Ecology Day 11 Learning Target: Students can predict population growth and understand limits on...
31
Ecology Day 11 Learning Target: Students can predict population growth and understand limits on growth. Agenda: 1)Population Growth Notes 2)Homework: 1) Read pp 92 – 99. Define all words in bold. Make a table listing the density-dependent and density – independent limiting factors.
-
Upload
michael-palmer -
Category
Documents
-
view
214 -
download
0
Transcript of Ecology Day 11 Learning Target: Students can predict population growth and understand limits on...

Ecology Day 11Learning Target: Students can predict population growth and understand limits on growth.
Agenda:
1)Population Growth Notes2)Homework:
1) Read pp 92 – 99. Define all words in bold. Make a table listing the density-dependent and density – independent limiting factors.

Population EcologyLimiting Factors

Growth and Limits• Populations often remain the same size regardless
of the number of offspring born• Exponential growth model applies to populations
with no growth limitsr = (b-d) + (i-e)
• r = rate of population increase; b = birth-rate; d = death rate; i = immigration; e = emigration

Growth and Limits• The growth potential of any population is
exponential, even when the rate of increase remains constant
• Growth: number of individuals accelerates rapidly
Time
Gro
wth
Rat
e

Growth and Limits
• Carrying capacity: symbolized by K, is the maximum number of individuals that the environment can sustain
• K is influenced by many factors• Usually a resource that is in limited supply• May be another organism in the ecosystem
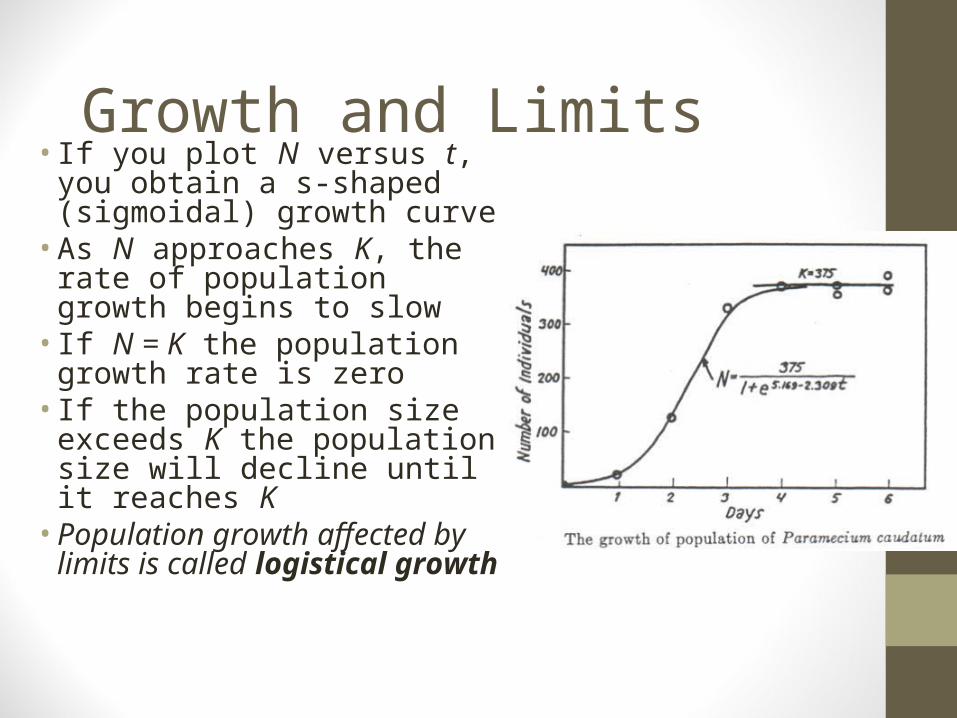
Growth and Limits• If you plot N versus t, you
obtain a s-shaped (sigmoidal) growth curve
• As N approaches K, the rate of population growth begins to slow
• If N = K the population growth rate is zero
• If the population size exceeds K the population size will decline until it reaches K
• Population growth affected by limits is called logistical growth

Growth and Limitsexponential
logistic

Growth and Limits
Many populations exhibit logistic growth

Factors that Regulate
Density-dependent: factors that affect the population and depend on population size

Factors that Regulate
Density dependence in the song sparrow on Mandarte island

Factors that Regulate
• Density-independent effects: the rate of growth of a population at any instant is limited by something unrelated to the size of the population
• External environment aspects: cold winters, droughts, storms, volcanic eruptions
• Populations display erratic growth patterns because of these events

Factors that Regulate
• North American snowshoe hare has a 10 year cycle
• Population numbers fall 10-fold to 30-fold in a cycle and 100-fold changes can occur
• Two factors generate this cycle:• Food plants• Predators

Factors that Regulate

Factors that Regulate• K-selected populations: populations where quality of
offspring is more important than quantity.• When resources are limited, the cost of reproduction
is high• Selection will favor individuals that can compete and
utilize resources efficiently• Can lower reproductive rates

Factors that Regulate
• r - selected populations: populations where quantity of reproduction is more important than quality.
• Populations far below carrying capacity, so resources are abundant
• Costs of reproduction are low • Most natural populations show life history
adaptations that exist along a continuum of r and K - selected traits

Ecology Day 12Learning Target: Students can explain changes in predator/prey populations
PLEASE DO NOT TOUCH THE BOXES OF CUT PAPER
Agenda: 1)Turn in Homework (92-99)2)Fix Biodiversity Posters (if you need to)3)Predator/Prey Population Game

Predator Prey Game1) Read game directions (just like a board game, you
need to read the directions)
2) Make your own data table like the example in the directions, but yours will have 20 generations.
3) If I see any game pieces on the ground after your class, any writing on them, or torn pieces, I will take ½ credit off the for the nearest table. Clean up after yourselves please.
Pink = Wolves Blue = Coyotes Yellow = Lemmings
Green = Rabbits Red = Invasive Species

Ecology Day 13Learning Target: Students can explain changes in predator/prey populations
Agenda: 1)Predator/Prey Population Game2)Finish Collecting Data3)Graph Your data neatly = homework.

Ecology Day 14Learning Target: Students can explain the growth of human populations and the
Agenda: 1)Correct Take Home Quiz2)Human Population Notes3)Homework: Page 109, # 1-5, 7, 9, 16, 22-25, 26-28, 32

Human PopulationsWorld Population 7,184,157,072

Human Population Growth• K-selected life history traits
• Small brood size• Late reproduction• High degree of parental care
• Human populations have grown exponentially• Last 300 years birth rate has remained the same• Death rate has fallen dramatically

History of human population size
Human Population Growth

Human Population Growth
Projected growth in 2050

Population Pyramid: a bar graph displaying the number of people in each age category
Human Population Growth

Earth’s rapidly growing human population constitutes, perhaps, the
greatest challenge to the future of the biosphere

• Uneven distribution among countries• Increasing gap between rich and poor• The world ecosystem is already under stress• What is K for the human population?
Human Population Growth

Distribution of population growth
Human Population Growth

• World population growth rate is declining:• High of 2.0% in 1965-1970• 2005: 1.2%• Still an increase of 78 million people per year
Human Population Growth

• Consumption in the developed world further depletes resources• Wealthiest 20% of the world’s population accounts for 86%
consumption of resources and produces 53% of CO2 emissions• Poorest countries: 20% is responsible for 1.3% consumption and
3% CO2 emissions
Human Population Growth

Ecological Footprint: amount of productive land required to support an individual at the standard of living of a particular population through the course of his/her life
Human Population Growth

World Population