ECE317 : Feedback and Controlweb.cecs.pdx.edu/~tymerski/ece317/ECE317 L13_RelativeStability.pdf ·...
23
ECE317 : Feedback and Control Lecture : Relative stability Dr. Richard Tymerski Dept. of Electrical and Computer Engineering Portland State University 1
Transcript of ECE317 : Feedback and Controlweb.cecs.pdx.edu/~tymerski/ece317/ECE317 L13_RelativeStability.pdf ·...
ECE317 : Feedback and Control
Lecture :Relative stability
Dr. Richard Tymerski
Dept. of Electrical and Computer Engineering
Portland State University
1

Course roadmap
2
Laplace transform
Transfer function
Block Diagram
Linearization
Models for systems
• electrical
• mechanical
• example system
Modeling Analysis Design
Stability
• Pole locations
• Routh-Hurwitz
Time response
• Transient
• Steady state (error)
Frequency response
• Bode plot
Design specs
Frequency domain
Bode plot
Compensation
Design examples
Matlab & PECS simulations & laboratories

Frequency response (review)
• Steady state output • Frequency is same as the input frequency
• Amplitude is that of input (A) multiplied by
• Phase shifts
• Frequency response function (FRF): G(jw)
• Bode plot: Graphical representation of G(jw)
3
Gain
G(s)
y(t)Stable

Stability of feedback system
• Consider the feedback system
• Fundamental questions• If G and C are stable, is the closed-loop system always
stable?
• If G and C are unstable, is the closed-loop system alwaysunstable?
4
G(s)C(s)

Closed-loop stability criterion
• Closed-loop stability can be determined by the roots of the characteristic equation
• Closed-loop system is stable if the Ch. Eq. has all roots in the open left half plane.
• How to check the closed-loop stability?• Computation of all the roots
• Routh-Hurwitz stability criterion
• Relative stability criterion (phase margin): Open-loop FRF L(jw) contains information of closed-loop stability.
5

Advantages of using frequency response to determine stability
• It does not require transfer functions, just experimental frequency response data of the (stable) open-loop system are necessary to judge the closed-loop stability. On the other hand, Routh-Hurwitz criterion needs transfer functions.
• It leads to the concept of “stability margin”, i.e., gain-margin and phase-margin. From Routh-Hurwitz criterion, we can only judge “stable or not”.
6

Remarks on stability margin criterion
• Stability margin criterion gives not only absolutebut also relative stability.• Absolute stability: Is the closed-loop system stable or
not? (Answer is yes or no.)
• Relative stability: How “much” is the closed-loop system stable? (Margin of safety)
• Relative stability (stability margin) is important because a math model is never accurate.
• How to measure relative stability?• Gain margin (GM) & Phase margin (PM)
7
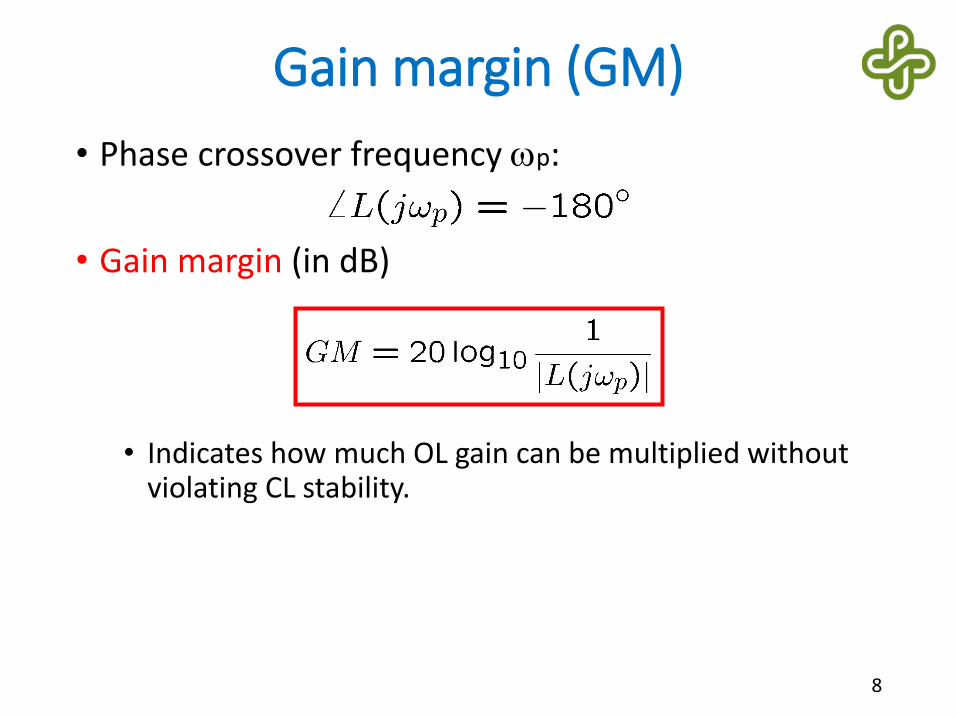
Gain margin (GM)
• Phase crossover frequency wp:
• Gain margin (in dB)
• Indicates how much OL gain can be multiplied without violating CL stability.
8

Phase margin (PM)
• Gain crossover frequency wg:
• Phase margin
• Indicates how much OL phase lag can be added without violating CL stability.
9

Phase margin test for stability
• (Under a some conditions*) Closed loop stability of a system is guaranteed when
Phase margin is positive (PM > 0)
i.e. the phase of the system needs to be greater than -180 degrees at the gain crossover frequency
10
* i) there is exactly one gain crossover frequency
ii) the system is open-loop stable
Phase margin test for stability
• Note under this test there is NO requirements for gain margin.
• However, it is generally stated that gain margin must also be positive. This can be shown to not be true by a counter example.
11

Relative stability on Bode plot
12
wg
wp
GM
PM
• When PM is positive otherwise, it is negative
• When GM is positive, otherwise it is negative
Here GM is positive
Here PM is positive
|𝐿(𝑗𝜔𝑝) | < 0𝑑𝐵
∠𝐿(𝑗𝜔𝑔) > −180∘

Unstable closed-loop case
13
wgwp
GM
PM
Here GM is negative
Here PM is negative
Notes on Bode plot
• Advantages• Without computer, Bode plot can be sketched easily by
using straight-line approximations.
• GM, PM, crossover frequencies are easily determined on Bode plot.
• Controller design on Bode plot is simple.
• Disadvantage• If OL system has poles in open right half plane, it will be
complicated to use Bode plot for closed-loop stability analysis.
14

Example 1:
15
100
101
102
103
-100
-50
0
100
101
102
103
-180
-270
GM: positive? negative?
PM: positive? negative?
wg = ?
wp= ?
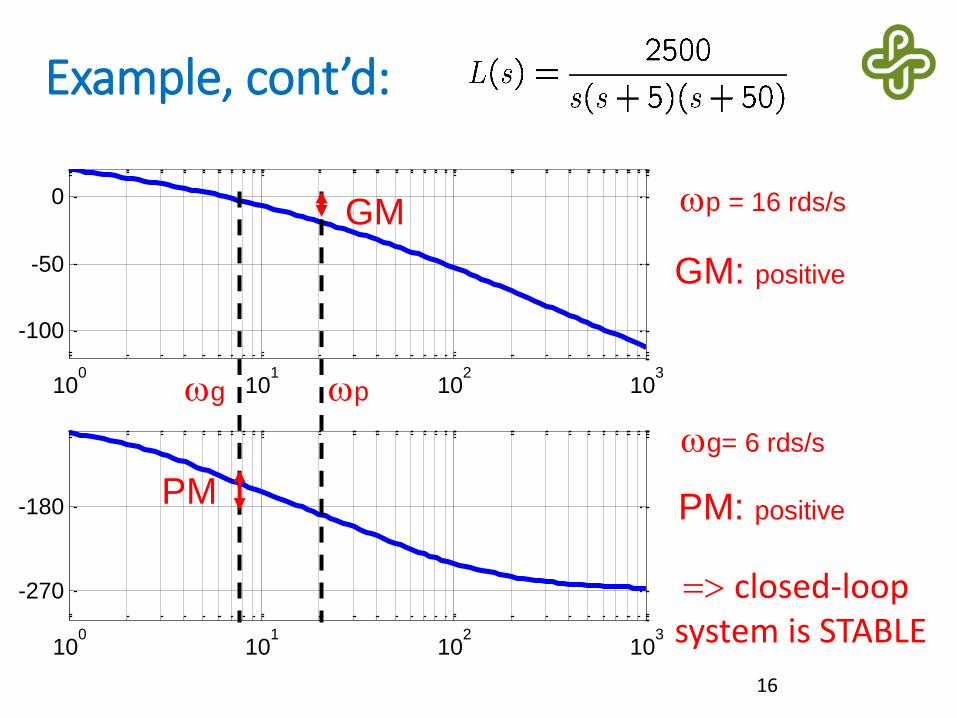
Example, cont’d:
16
100
101
102
103
-100
-50
0
100
101
102
103
-180
-270
wg wp
GM
PM PM: positive
wp = 16 rds/s
wg= 6 rds/s
GM: positive
=> closed-loop system is STABLE

Example, cont’d:
17
PMwp
wg
GM
• confirm the results with Matlab ‘margin’ command
• Using straight line asymptotic approximation determine:
i. Unity gain crossover frequency: ii. Phase margin:iii. -180 degree phase crossover frequency:iv. Gain margin:
(This example is worked out in class and homework)

Example 2:
18
𝐿(𝑠) =𝐴
1 +𝑠𝜔0
1 +𝑠𝜔1
𝐴 = 200, 𝜔0 = 100, 𝜔1 = 300
where:
(This example is worked out in class and homework)
Sketch the asymptotic Bode plot for the following loop gain.
Annotate the plots completely: 1) Show the values of all break frequencies for magnitude and phase, 2) For magnitude plots: show i) gain along all straight line segments, and ii) slopes, 3) For phase plots: show the slopes.

Example 3:
19
where:
(This example is worked out in class and homework)
Sketch the asymptotic Bode plot for the following loop gain.
Annotate the plots completely and sketch using frequency in Hz (not rds/s): 1) Show the values of all break frequencies for magnitude and phase, 2) For magnitude plots: show i) gain along all straight line segments, and ii) slopes, 3) For phase plots: show the slopes.
𝐿(𝑠) =𝐴 1 −
𝑠𝜔𝑧
1 +𝑠
𝑄𝜔0+
𝑠𝜔0
2
𝐴 = 120, 𝜔𝑧 = 2𝜋(2500), 𝜔0 = 2𝜋(500), 𝑄 = 5

Summary
• Relative stability:• Gain margin, phase crossover frequency
• Phase margin, gain crossover frequency
• Relative stability on Bode plot
• We normally emphasize PM in controller design.
20

21
Application to the lab:
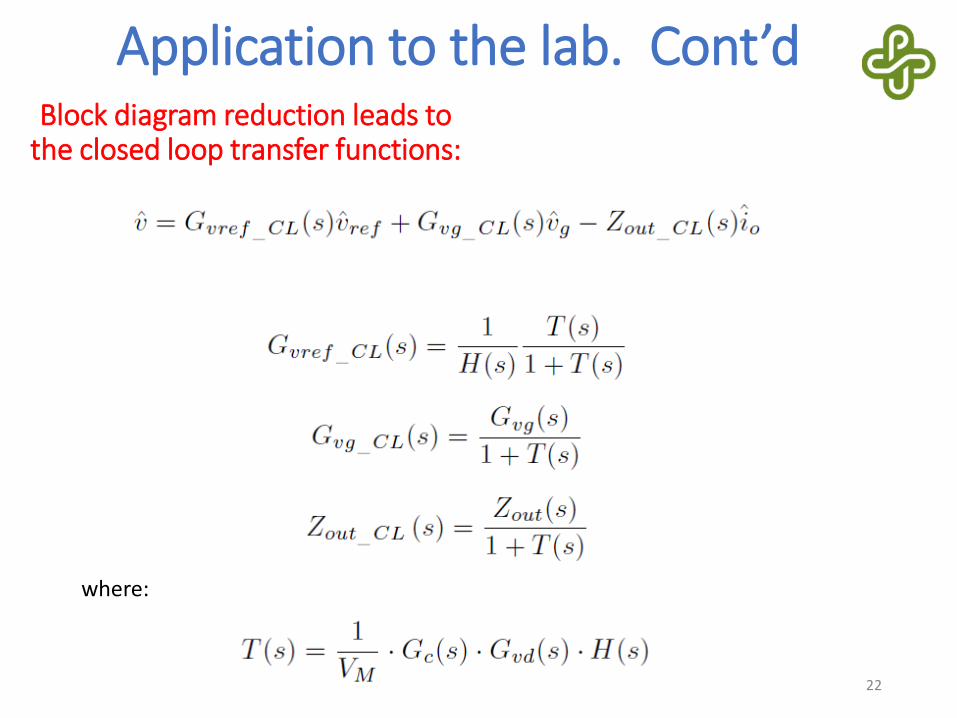
In the lab T(s) is used to refer to the loop gain L(s)
22
Block diagram reduction leads to the closed loop transfer functions:
Application to the lab. Cont’d
where:

23
Application to the lab. Cont’d
• To determine absolute stability of this system we can use Routh-Hurwitz criterion. Note however, this is NOT applied to T(s), but rather the Routh-Hurwitz criterion is applied to the denominator polynomial of
or 1
)1 + 𝑇(𝑠)𝑇(𝑠
)1 + 𝑇(𝑠
• To determine absolute stability and relative stability of the system we find the phase and gain margins exhibited by the loop gain T(s)