Eastern Europe B2C E-Commerce Report 2012
13
LinkedIn XING Twitter Facebook - 1 - Phone: +49 (0) 40 - 39 90 68 50 Fax: +49 (0) 40 - 39 90 68 51 [email protected] www.ystats.com Publication Date November 2012 Language English Format PDF & PowerPoint Number of Pages/Charts 226 Covered Countries Top Countries: Russia, Poland, Czech Republic Other Countries: Ukraine, Hungary, Slovakia, Albania, Bosnia and Herzegovina, Bulgaria, Croatia, Estonia, Greece, Latvia, Lithuania, Macedonia, Romania, Slovenia Price Single User License: € 3,950 (excl. VAT) Site License: € 7,900 (excl. VAT) Global Site License: € 11,850 (excl. VAT) Eastern Europe B2C E-Commerce Report 2012 November 2012 We deliver the facts – you make the decisions RESEARCH ON INTERNATIONAL MARKETS Provided by November 2012
description
This report includes detailed information about B2C E-Commerce in 17 Eastern European countries.
Transcript of Eastern Europe B2C E-Commerce Report 2012

LinkedIn XING Twitter Facebook
- 1 -
Phone: +49 (0) 40 - 39 90 68 50Fax: +49 (0) 40 - 39 90 68 51
Publication Date November 2012
Language English
Format PDF & PowerPoint
Number of Pages/Charts 226
Covered Countries Top Countries: Russia, Poland, Czech Republic Other Countries: Ukraine, Hungary, Slovakia, Albania, Bosnia and Herzegovina, Bulgaria, Croatia, Estonia, Greece, Latvia, Lithuania, Macedonia, Romania, Slovenia
Price Single User License: € 3,950 (excl. VAT) Site License: € 7,900 (excl. VAT) Global Site License: € 11,850 (excl. VAT)
Eastern Europe B2C E-Commerce Report 2012 November 2012
We deliver the facts – you make the decisionsRESEARCH ON INTERNATIONAL MARKETS
Provided by
November 2012

- 2 -
LinkedIn XING Twitter FacebookPhone: +49 (0) 40 - 39 90 68 50Fax: +49 (0) 40 - 39 90 68 51
Eastern Europe B2C E-Commerce Report 2012
Key Findings
Company and Product Information
Covering 17 Eastern European Countries
• Despite slowing growth rates, B2C E-Commerce sales in Russia are expected to more than double between 2011 and 2015.
• Price comparison sites, websites showing user opinions and group-buying sites were popular among online shoppers in Poland in 2011.
• Following a decrease from 2010 to 2011, which was based on the fact that consumers in the Czech Republic had already purchased many expensive products online and increasingly ordered cheaper goods, average per capita online spending in the Czech Republic was expected to grow by a low single digit percentage in 2012.
• In 2011, “Household Appliances” was the most popular online product category in Ukraine, followed by “Clothing, Footwear, Accessories, Jewelry”.
• Price comparison websites were among the most popular services utilized in online shopping in Slovakia in 2011, as the offline retail segment was underdeveloped and had prices above the EU average.
About our Reports
Market reports by yStats.com inform top managers about recent market trends and assist with strategic company decisions
A list of advantages
• yStats.com provides secondary market research: By using various sources of information we ensure maximum objectivity for all obtained data. As a result companies get a precise and unbiased impression of the market situation.
• The analyses, statistical reports and forecasts are only based on reliable sources including national and international statistical offices, industry and trade associations, business reports, business and company databases, journals, company registries and news portals.
• Our international employees research and filter all sources and translate relevant information into English. This ensures that the content of the original studies is correctly interpreted.
• yStats.com delivers all research results as PowerPoint files. All data can therefore be used directly for board presentations or be individually adapted.
• If required, yStats.com provides in-depth analysis for all research projects. Simply send us a request.
About yStats.com
• yStats.com has been committed to research up-to-date, objective and demand-based data on markets and competitors from various industries since 2005.
• Headquartered in Hamburg, Germany, the firm has a strong international focus and is specialized in secondary market research.
• In addition to reports on markets and competitors, yStats.com also carries out client-specific research.
• Clients include leading global enterprises from various industries including B2C E-Commerce, electronic payment systems, mail order and direct marketing, logistics as well as banking and consulting.

1. MANAGEMENT SUMMARY
2. TRENDS
• B2C E-Commerce Trends in Russia, 2011/2012
• B2C E-Commerce Competition Trends in Russia,
2012 and Number of new Online Shops appearing
daily in Russia, 2009-H1 2012
• Online Credits in B2C E-Commerce in Russia,
April 2012 and Attitude of Online Shoppers towards
Online Credits, in % of Online Shoppers, April 2012
• Reasons to go Online in Russia,
in % of Internet Users, 2010 & 2012f
• Total daily Visits and Visits by frequent Visitors of
Goods and Services Websites in Russia,
January-September 2012
• Growth of Online Search Requests for “Online Shop”
and “Buy” in Russia, by Location, in %, 2011
• Breakdown of the B2C E-Commerce Sales by
Regions in Russia, in %, 2011
• Breakdown of Growth Drivers of B2C E-Commerce
in Russia, in %, 2012-2015f
• Factors influencing the Choice of an Online Shop in
Russia, in % of Online Shoppers, July-August 2012
• Online Shopping Concerns in Russia,
in % of Online Shoppers, July-August 2012
• Top Reasons for abandoning an Online Shopping
Cart in Russia, in % of Online Shoppers,
January-February 2012
• Leading Concerns about Overseas Online Shopping
in Russia, in % of Online Shoppers,
January-February 2012
3. SALES
• B2C E-Commerce Spending in Russia, in USD billion,
2012f & 2016f
• B2C E-Commerce Sales in Russia, in RUB billion,
2010-2015f
• B2C E-Commerce Sales and Growth worldwide,
by selected Country, including Russia,
in USD billion and in %, 2011
• B2C E-Commerce Sales in Russia,
by Tickets and Digital Goods and Physical Goods,
in RUB billion and in % of total
B2C E-Commerce Sales, 2011
- 3 -
2. TRENDS (cont.)
• B2C E-Commerce Payment Trends in Russia,
2012 and Awareness and Usage of
Payment Methods, by Payment Method, in %,
March 2012
• Online Delivery Trends in Russia, 2011/2012 and
Shares of Delivery Types on total Online Deliveries,
in %, Q1-Q3 2011
• Mobile Commerce Trends in Russia, 2012 and
Growth in the Number of Mobile Visitors to Russian
Internet Sites, by Mobile Platform, in %,
May 2011-May 2012
• Social Online Shopping Trends in Russia, 2012 and
Top 5 Websites by Number of average daily Visitors,
in millions, March 2012
• Online Group Sales Trends in Russia, 2011/2012 and
Share of Internet Users knowing about
Online Coupon Services, in % of Internet Users,
April 2012
LinkedIn XING Twitter FacebookPhone: +49 (0) 40 - 39 90 68 50Fax: +49 (0) 40 - 39 90 68 51
Eastern Europe B2C E-Commerce Report 2012
Table of Contents (1 of 7) - Russia (Top Country)
- 4 -
7. PLAYERS
• Players Trends in Russia, 2012 and Share of Top 30
Players on total B2C E-Commerce Sales of physical
Goods, in %, 2011
• Top 30 Online Shops in Russia,
ranked by B2C E-Commerce Sales, in RUB billion,
2011
• Profile of Utkonos.ru
• Profile of Ozon.ru
• Profile of Komus.ru
• Profile of Quelle.ru
• Profile of Svyaznoy.ru
• Profile of Biglion.ru
• Profile of Groupon.ru
5. PRODUCTS
• Breakdown of Online Product Categories in Russia,
in % of total B2C E-Commerce Turnover, 2011
• Online Sales in Russia, by Product Categories,
in RUB billion, 2011
• Online Sales in Russia, by Product Category,
in RUB billion, 2010 & 2011
• Growth in Online Product Categories in Russia,
in %, 2011
• Breakdown of Online Product Categories in the
Regions of Russia,
in % of total B2C E-Commerce Sales, 2011
• Products bought Online in Russia, by Category,
in % of Online Shoppers, 2009 & 2011
6. USERS / SHOPPERS
• Internet Users/Unique Visitors in Europe,
by Country, incl. Average Hours and Pages
per Visitor, November 2011
• Development of Internet Users and daily Internet
Audience in Russia, in millions, 2007-2012f
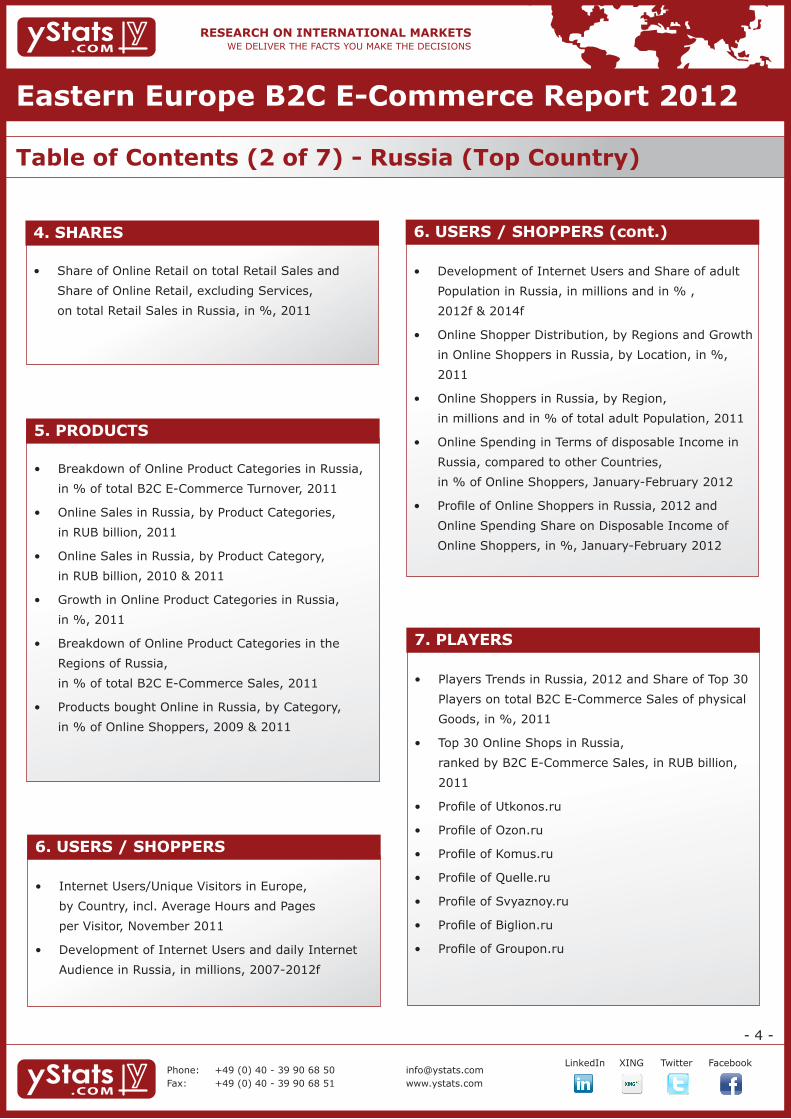
6. USERS / SHOPPERS (cont.)
• Development of Internet Users and Share of adult
Population in Russia, in millions and in % ,
2012f & 2014f
• Online Shopper Distribution, by Regions and Growth
in Online Shoppers in Russia, by Location, in %,
2011
• Online Shoppers in Russia, by Region,
in millions and in % of total adult Population, 2011
• Online Spending in Terms of disposable Income in
Russia, compared to other Countries,
in % of Online Shoppers, January-February 2012
• Profile of Online Shoppers in Russia, 2012 and
Online Spending Share on Disposable Income of
Online Shoppers, in %, January-February 2012
4. SHARES
• Share of Online Retail on total Retail Sales and
Share of Online Retail, excluding Services,
on total Retail Sales in Russia, in %, 2011
LinkedIn XING Twitter FacebookPhone: +49 (0) 40 - 39 90 68 50Fax: +49 (0) 40 - 39 90 68 51
Eastern Europe B2C E-Commerce Report 2012
Table of Contents (2 of 7) - Russia (Top Country)

1. MANAGEMENT SUMMARY
2. TRENDS
• B2C E-Commerce Market Trends in Poland, 2011/2012
• Online Purchases by Types of Websites in Poland, in % of Online Shoppers, 2010
• Change in Profit and Turnover of Online Shops in Poland, in %, 2011 vs. 2010
• Number of Products offered by Online Shops in Poland, in %, 2009-2011
• Number of Online Shops selling Clothing in Poland, in thousands, 2008-2012f
• Breakdown of Home Appliances, Consumer Electronics and digital Media Retail Market Sales Channels in Poland, by Value, in %, 2011
• Offered Online Delivery Options in Poland, in % of Online Shops, 2009-2011
• Online Delivery Methods in Poland, by Popularity, in % of Consumers, 2009-2011
• Cooperation with Logistics Companies in Poland, by Company, in % of Online Shops, 2010 & 2011
• Payment Methods offered by Online Shops in Poland, in % of Online Shops, 2009-2011
• Most popular Payment Methods when shopping at Online Shops in Poland, in % of Online Shoppers, 2009-2011
• Offered Online Payment Companies in Poland, in % of Online Shops, 2009-2011
• Online Payment Methods in Poland, by Acceptance among Online Shops, in %, 2011
• Problems encountered when selling Online in Poland, by Problem Area, in % of Online Shops, 2009-2011
• M-Commerce and Group Shopping Trends in Poland, 2011/2012 and M-Commerce Growth in Poland, compared to Europe Average, in %, 2011 vs. 2010
4. SHARES (cont.)
• Share of B2C E-Commerce on total Retail Sales in Poland, in %, 2011 & 2012f
• Share of Online Sales on total Retail Trade Value in Poland, in %, June 2012
• Share of Online Sales on total Clothing and Footwear Revenues in Poland, in %, 12 Months to June 2012
3. SALES
• B2C E-Commerce Sales in Poland, in EUR billion, 2008-2012f
• Average per Capita B2C E-Commerce Sales in Europe, by Country, including Poland, in EUR, 2011 & 2012f
• Average per Capita B2C E-Commerce Sales in Poland, in EUR, 2011 & 2012f
4. SHARES
• Share of B2C E-Commerce on total Retail Sales in Europe, by Country, including Poland, in %, 2011 & 2012f
5. PRODUCTS
• Assortment of Online Shops in Poland, by Product Category, in % of Online Shops, 2012
• Purchased Online Product Categories in Poland, in % of Online Shoppers, June 2012
• Online Product Categories in Poland, by Popularity, in %, 2011
• Purchased Online Clothing Product Categories in Poland, in % of Online Shoppers, 12 Months to June 2012
6. USERS / SHOPPERS
• Individuals in Europe using the Internet, by Country, including Poland, in %, 2009-2011
• Internet and Broadband Household Penetration in Europe, by Country, incl. Poland, in %, 2007, 2009 & 2011
• Fixed Total Broadband Subscribers in Poland, in Total and per 100 Inhabitants, compared to Germany, USA and the OECD Average, 2006-2011
• Fixed Broadband Subscribers in Poland, by Access Technology, compared to the OECD Average, in %, 2011
• Share of Online Shoppers on Individuals in Poland, compared to the EU Average, in %, 2006-2011
• EU Comparison of Online Shopper Penetration, by Country, including Poland, in % of Population, 2011
7. PLAYERS
• Top 20 B2C E-Commerce Websites in Poland, in million Users, February 2012
• Top 30 B2C E-Commerce Websites in Poland, by B2C E-Commerce Sales, in PLN million, 2011
• Profile of Allegro.pl• Profile of Groupon.pl• Profile of Neo24.pl• Profile of Komputronik.pl• Profile of Merlin.pl
LinkedIn XING Twitter FacebookPhone: +49 (0) 40 - 39 90 68 50Fax: +49 (0) 40 - 39 90 68 51
Eastern Europe B2C E-Commerce Report 2012
Table of Contents (3 of 7) - Poland (Top Country)
- 5 -

1. MANAGEMENT SUMMARY
2. TRENDS
• B2C E-Commerce Trends in the Czech Republic, 2011/2012
• Mobile Usage Trends in the Czech Republic 2011/2012 and Breakdown of Operating Systems used on Smartphones, in %, 2011
• Internet Activities conducted in the Czech Republic, in % of Individuals, 2011
• Essential and important Factors influencing the Choice of an Online Shop in the Czech Republic, in % of Online Shoppers, August 2012
• Average per Capita Online Spending in the Czech Republic, in CZK thousand, 2010-2012f
• Breakdown of Online Payment Methods used in the Czech Republic, in % of Online Shoppers, 2011
• Delivery Types offered by Online Shops in the Czech Republic, in % of Online Shops, 2011
• Online Clothing Sales Trends in the Czech Republic, 2012
• Social Networking Trends in the Czech Republic, 2011/2012 and Social Network Usage, by Age Group, in % of individuals, 2011
• Christmas B2C E-Commerce Trends in the Czech Republic, 2012 and Online Christmas Sales, in CZK billion, 2011-2012f, 2014f
3. SALES
• B2C E-Commerce Sales in the Czech Republic, in CZK billion, 2007-2011
5. PRODUCTS (cont.)
• Average Online Basket Value in the Czech Republic, by Product Category, in CZK, 2011
• Product Categories purchased Online in the Czech Republic prior to going on Vacation, in % of Internet Users, May 2012
6. USERS / SHOPPERS
• Number of Internet Users in the Czech Republic, in millions and in % of Country Population, 2007-2011
• Individuals in Europe using the Internet, by Country, including the Czech Republic, in %, 2009-2011
• Internet and Broadband Household Penetration in Europe, by Country, incl. the Czech Republic, in %, 2007, 2009 & 2011
• Fixed total Broadband Subscribers per 100 Inhabitants in the Czech Republic, compared to Germany, USA and the OECD Average, 2006-2011
• Broadband Subscribers in the Czech Republic, by Access Technology, compared to the OECD Average, in %, 2011
• Number of Online Shoppers in the Czech Republic, in millions and in % of Country Population, 2007-2011
• Share of Online Shoppers on total Population in the Czech Republic, compared to the EU 27 Average, in %, 2007-2011
• EU Comparison of Online Shopper Penetration, by Country, including Czech Republic, in % of Population, 2011
• Online Shopping Penetration in the Czech Republic, by Age Group, in % of Consumers, 2011
- 6 -
7. PLAYERS
• Top 5 B2C E-Commerce Players in the Czech Republic, by B2C E-Commerce Sales, in CZK billion and in EUR million, 2011
• Profile of Alza.cz
• Profile of Mall.cz
• Profile of Kasa.cz
• Profile of Czc.cz
• Profile of Vivantis a.s.
4. SHARES
• Share of B2C E-Commerce on total Retail Sales in the Czech Republic, in %, 2007-2011
5. PRODUCTS
• Types of Goods ordered Online in the Czech Republic, in % of Online Shoppers, 2011
• Types of Goods and Services bought Online in the Czech Republic, by Age Groups, in % of Online Shoppers, 12 Months to Q2 2011
• Products offered by Online Shops in the Czech Republic, in % of Online Shops, 2011
LinkedIn XING Twitter FacebookPhone: +49 (0) 40 - 39 90 68 50Fax: +49 (0) 40 - 39 90 68 51
Eastern Europe B2C E-Commerce Report 2012
Table of Contents (4 of 7) - Czech Republic (Top Country)

1. MANAGEMENT SUMMARY
2. TRENDS
• B2C E-Commerce Trends, 2011
• Internet User Trends, 2011
- 7 -
UKRAINE
3. SALES
• B2C E-Commerce Sales, in EUR billion, 2010 & 2011
4. SHARES
• Share of B2C E-Commerce Sales on total Retail Sales, in %, 2011
5. PRODUCTS
• Most purchased Online Product Categories, in % of Online Shoppers, 2011
6. USERS / SHOPPERS
• Internet Users, in millions and in % of Country Population, 2008-Q3 2012
• Breakdown of Internet Users, by Usage Frequency and by Region, in %, November 2011
• Breakdown of Internet Users, by monthly Income, in %, November 2011
7. PLAYERS
• Online Retailers, by B2C E-Commerce Sales, in USD million, 2011
• Top 15 B2C E-Commerce Websites, ranked by Unique Visitors (Users) from Ukraine, May 2012
1. MANAGEMENT SUMMARY
2. TRENDS
• Internet User Trends, 2011/2012 and E-Commerce related Activities of Internet Users, in %, 12 months to February 2012
• B2C E-Commerce Trends, 2011/2012 and Online Coupon Selling Trends, 2011
HUNGARY
3. SALES
• B2C E-Commerce Sales, in HUF billion, 2007-2012f
4. SHARES
• Share of B2C E-Commerce on total Retail Sales, in %, 2011
5. PRODUCTS
• Products purchased Online, by Product Category, in % of Individuals, 2011
6. USERS / SHOPPERS
• Individuals in Europe using the Internet, by Country, in %, 2009-2011
• Internet and Broadband Household Penetration in Europe, by Country, in %, 2007, 2009 & 2011
• Fixed total Broadband Subscribers, in total and per 100 Inhabitants, compared to Germany, USA and the OECD Average, 2006-2011
• Broadband Subscribers, by Access Technology compared to the OECD Average, in %, 2011
• Share of Online Shoppers, compared to the EU Average, in %, 2006-2011
• Comparison of Online Shopper Penetration in the EU, by Country, in % of Population, 2011
7. PLAYERS
• Top 15 B2C E-Commerce Websites, ranked by Unique Visitors (Users) from Hungary, May 2012
• Leading Online Coupon Sellers, by Turnover, in HUF million, 2011
LinkedIn XING Twitter FacebookPhone: +49 (0) 40 - 39 90 68 50Fax: +49 (0) 40 - 39 90 68 51
Eastern Europe B2C E-Commerce Report 2012
Table of Contents (5 of 7) - Ukraine & Hungary

1. MANAGEMENT SUMMARY
2. TRENDS
• Internet and B2C E-Commerce Trends, 2011/2012
- 8 -
SLOVAKIA
3. SALES
• B2C E-Commerce Sales, in EUR million, H1 2010 & H1 2011
• B2C E-Commerce Sales, in EUR million, 2010, 2011 & 2016f
4. SHARES
• Share of B2C E-Commerce on total Retail Sales, in %, 2011
5. PRODUCTS
• Products purchased Online, by Product Category, in % of Individuals, 2011
6. USERS / SHOPPERS
• Individuals in Europe using the Internet, by Country, in %, 2009-2011
• Internet and Broadband Household Penetration in Europe, by Country, in %, 2007, 2009 & 2011
• Comparison of Online Shopper Penetration in the EU, by Country, in % of Population, 2011
• Share of Online Shoppers on total Population, 2007-2011
• Share of Online Shoppers, by Age Group, in % of Individuals, Q1 2011
7. PLAYERS
• Leading Online Retailers, by Market Share, in %, 2011
• Top 15 B2C E-Commerce Websites, ranked by Unique Visitors (Users) from Slovakia, May 2012
1. ALBANIA
• Internet Penetration Rate, in % of Individuals, 2007-2011
ADDITIONAL EASTERN EUROPEAN COUNTRIES
2. BOSNIA AND HERZEGOVINA
• Internet Penetration Rate, in % of Individuals, 2007-2011
3. BULGARIA
• Internet and B2C E-Commerce Trends, 2011
• Breakdown of Online Orders, by Regions, in %, 2011
• Products purchased Online, by Product Category, in % of Individuals, 2011
• Internet Penetration Rate, in % of Individuals, 2007-2011
• Online Shopper Penetration, in % of Individuals, 2007-2011
• Online Shopper Penetration, in % of Internet Users, 2009-2011
4. CROATIA
• Purpose of Internet Usage, by Purpose, in % of Individuals, Q1 2011
• Reasons against having Internet Access, in % of Households, Q1 2011
• Products purchased Online, by Product Category, in % of Online Shoppers, Q1 2009-Q1 2011
• Share of Households with Internet Access, in % of Households, 2009-2011
• Internet Users, by Age Group, in % of Individuals, Q1 2011
• Breakdown of Internet Access Methods, by Access Method, in % of Households with Internet Access, Q1 2011
LinkedIn XING Twitter FacebookPhone: +49 (0) 40 - 39 90 68 50Fax: +49 (0) 40 - 39 90 68 51
Eastern Europe B2C E-Commerce Report 2012
Table of Contents (6 of 7) - Slovakia & Additional Countries

- 9 -
8. LITHUANIA
• Online Shopper Penetration, in % of Individuals, Q1 2011 & Q1 2012
• Products purchased Online, by Product Category, in % of Online Shoppers, Q1 2012
ADDITIONAL EASTERN EUROPEAN COUNTRIES (cont.)
9. MACEDONIA
• Purpose of Internet Usage, by Purpose, in % of Individuals, 3 Months to October 2012
• Reasons against Mobile Internet Usage, in % of Individuals, 3 Months to October 2012
• Share of Individuals ever having purchased Goods or Services Online, in %, October 2012
10. ROMANIA
• B2C E-Commerce Trends, 2011 and Share of Internet Users conducting monthly Online Purchases, in %, 2011
• Products purchased Online, by Product Category, in % of Individuals, 2011
• Online Shopper Penetration, in % of Individuals, 2009-2011
11. SLOVENIA
• Internet and B2C E-Commerce Trends, Q1 2012
• Products purchased Online, by Product Category, in % of Individuals, 2011
• Internet Access, in % of Households, Q1 2011 & Q1 2012
• Internet Access, by Access Method, in % of Households, Q1 2012
• Regular Internet Users, by Age Group, in % of Individuals, Q1 2012
• Online Shopper Penetration, in % of Individuals, 2007-2011
5. ESTONIA
• Purpose of Internet Usage, by Purpose, in % of Internet Users, 2011 & 2012f
• Products purchased Online, by Product Category, in % of Online Shoppers, 2011 & 2012f
• Online Shoppers, in millions and in % of Individuals, 2008-2012f
ADDITIONAL EASTERN EUROPEAN COUNTRIES (cont.)
6. GREECE
• B2C E-Commerce Sales, in EUR billion, 2008-2011
• Products purchased Online, by Product Category, in % of Online Shoppers, April 2009-March 2010 & April 2010-March 2011
• Product Categories ordered Online, by Region, in % of Online Shoppers, April 2010-March 2011
• Number of Online Shoppers, in millions, 2007-2011 and in % of Internet Users, 2009-2011
• Internet Users who have never purchased Goods Online, in %, 2009-2011
• Breakdown of Online Purchases, by Gender and Age Group, in % of Online Shoppers, Q1 2011
7. LATVIA
• Purpose of Internet Usage, by Purpose, in % of Individuals, January 2012
• Products purchased Online, by Product Category, in % of Individuals, 2011
• Regular Internet Usage, by Age Group, in % of Individuals, January 2012
• Internet Access, by Access Method, in % of Households, January 2012
• Online Shopper Penetration, in % of Individuals, 2007-2011
LinkedIn XING Twitter FacebookPhone: +49 (0) 40 - 39 90 68 50Fax: +49 (0) 40 - 39 90 68 51
Eastern Europe B2C E-Commerce Report 2012
Table of Contents (7 of 7) - Additional Countries

We deliver the facts – you make the decisions RESEARCH ON INTERNATIONAL MARKETS
In 2011, Ozon.ru sent out a total of 2.4 million orders, up from 2.0 million in 2010, of which most were books and electronics. Profile of Ozon.ru
52
Source: Google, company homepages, business reports, business and company databases, journals, company registries, news portals, industry and trade associations
Name of Company Ozon.ru
Headquarters Moscow, Russia
Major Online Shop www.ozon.ru
Company Type Internet Pure Player
Product Range Mass Merchant
B2C E-Commerce Sales, 2011 Online sales of RUB 4.6 billion
Year Ended December 31
News (E-Commerce)
• In 2012, Ozon.ru’s own delivery network was expanded to comprise 130 Russian cities.
• Ozon.ru sent out 2.4 million orders in 2011, up from 2.0 million in 2010.
• In 2012, 34% of sales at Ozon.ru were books and electronics, respectively.
• Ozon Group’s sales, including ozon.ru and ozon.travel, grew by almost +80% in 2011 and reached RUB 8.87 billion, according to the company.
• In September 2011, the Ozon Group raised a total of USD 100 million in investments, including from foreign investors.
• Ozon Group’s product range in 2011 included over 2.2 million items, 110,000 hotels and 300 airlines.
• In March 2011, Ozon.ru had more than 5.6 million registered users.
Trends Sales Users / Shoppers Products Shares Players
We deliver the facts – you make the decisionsRESEARCH ON INTERNATIONAL MARKETS
The number of Internet users in Russia is expected to reach 59 million in 2012, of which 45 million go online on a daily basis.Development of Internet Users and daily Internet Audience in Russia, in millions, 2007-2012f
Source: FOM, October 2012
Trends Sales Users / ShoppersProductsShares Players
42
in m
illion
Inte
rnet
Use
rs
31
44
59
37
52
23
1016
21
29
37
45
0
20
40
60
80
2007 2008 2009 2010 2011 2012f0
20
40
60
80
Number of Internet Users Daily Internet Audience
in m
illion
dai
ly In
tern
et A
udie
nce
- 10 -
LinkedIn XING Twitter FacebookPhone: +49 (0) 40 - 39 90 68 50Fax: +49 (0) 40 - 39 90 68 51
Eastern Europe B2C E-Commerce Report 2012
Samples (1 of 2)

We deliver the facts – you make the decisionsRESEARCH ON INTERNATIONAL MARKETS
Bulgaria: Internet and B2C E-Commerce Trends, 2011
Online shopping in Bulgaria was conducted by only 14% of Internet users in 2011, but gained popularity compared to the previous year.
183
Online shopping is not yet a widespread phenomenon in Bulgaria, as Information Policy reported. In 2011, most Bulgarians stillpreferred conventional shopping to buying over the Internet. This situation, however, is changing due to increasing participation ofthe population in technology activities.
According to a survey by the Bulgarian Statistical Office, 45% of households in Bulgaria had Internet access in 2011, compared toonly 30% in 2009. Moreover, 46% of the adult population regularly goes online. For the young people aged between 16 and 24 thisfigure reaches 80%. The 25-43 year-olds comprise the second most active age group of Internet users, with 68% of them surfingthe World Wide Web almost daily.
The online shopper penetration rate in Bulgaria also grew in 2011. The share of Internet users who purchased goods or servicesover the Internet that year reached 14.4%, 2.2 percentage points more than in 2010.
The South-West region of the country, where the capital is situated, is most active in online shopping, accounting for almost half ofonline orders (46.2%). It is followed by the North-East region (14.4%) and North Central region (13.6%).
Online shoppers in Bulgaria prefer to buy from the local online retailers, but the share of Bulgarian online shops on total onlineorders has decreased over the years, from 83% in 2009 to 73% in 2011, whereas online shopping across the borders hasgained popularity. In 2011, 38% of orders from online shoppers in Bulgaria were received by online shops in other EU countries, upfrom 31% in 2009, and 16% by online sellers from the rest of the world, 4 percentage points more than two years earlier.
Source: Information Policy, December 2011; Bulgarian National Statistical Institute, December 2011
We deliver the facts – you make the decisions RESEARCH ON INTERNATIONAL MARKETS
10
“Good Product Information” was essential to 66% of online shoppers in the Czech Republic when choosing an online shop in August 2012. Essential and important Factors influencing the Choice of Online Shop in the Czech Republic, in % of Online Shoppers, August 2012
31%
32%
25%
22%
29%
33%
34%
40%
43%
43%
51%
52%
55%
58%
66%
32%
36%
40%
32%
40%
36%
38%
35%
32%
0% 25% 50% 75%
Certified E-Shop
Physical Location
Broad Payment Options
Customer Ratings and Comments
Comparison Parameters for the Product
Wide Range of Goods
Recommendations from known People
Search by Parameters (Filters)
Free Shipping
Photos of the Goods
Availability of Goods in the Warehouse
Good Product Information
Important EssentialSource: APEK, August 2012
Trends Sales Users / Shoppers Products Shares Players
- 11 -
LinkedIn XING Twitter FacebookPhone: +49 (0) 40 - 39 90 68 50Fax: +49 (0) 40 - 39 90 68 51
Eastern Europe B2C E-Commerce Report 2012
Samples (2 of 2)

- 12 -
LinkedIn XING Twitter FacebookPhone: +49 (0) 40 - 39 90 68 50Fax: +49 (0) 40 - 39 90 68 51
Eastern Europe B2C E-Commerce Report 2012
Report Order FormREPORT ORDER FORM
yStats.com GmbH & Co. KG Behringstr. 28a, 22765 Hamburg
Telefon: +49 (0) 40 - 39 90 68 50Fax: +49 (0) 40 - 39 90 68 51
www.twitter.com/ystatswww.facebook.com/ystats
PlacE YOuR ORDER as FOllOws
Call us at + 49 40 39 90 68 50
Fax us at + 49 40 39 90 68 51 using the form below
Scan and Email us at [email protected] using the form below
cHOOsE YOuR lIcENsE TYPE aND REPORTs
Please confirm the license type you require:
Single User License Site License1 Global Site License2
Report Title Publication Date Price (€)
aN INvOIcE wIll bE sENT TO YOuR cOMPaNY. PlEasE cOMPlETE YOuR cONTacT DETaIls.
Title: Mr/Mrs/Ms First Name
Last Name
Job Title
Company
Email Address
Telephone Number
Fax Number
Address
City State/Province
Country Post Code/ZIP
Your Order is subject to our Terms & Conditions as attached hereto.All Forms must have a signature to confirm your order:
Signature
Where did you find us?
Google/Search Engine
Google Adwords/Online Advertising
Article in Trade Journal
Press Release
Social Media
Recommendation
Others: ________________________
Note: Reports are provided in electronic PDF form. yStats.com will contact you in the future to provide our free newsletter or other mailings. If you do not wish to receive our newsletter or other mailings, you may advise us of this. Your contact informa-tion will not be sold to other organizations.
1) Site Licenses, allowing all users within a given geographical location of an organization to access the report, are available for double the price.2) Global Site Licenses, allowing all worldwide users of an orga-nization to access the report, are available for triple the price.
EU Companies must supply VAT No
Purchase Order No(if required)
Order Date
Eastern Europe B2C E-Commerce Report 2012

- 13 -
LinkedIn XING Twitter FacebookPhone: +49 (0) 40 - 39 90 68 50Fax: +49 (0) 40 - 39 90 68 51
Eastern Europe B2C E-Commerce Report 2012
Terms and Conditions1. SCOPE1.1 The following terms and conditions apply to our entire contract (the “Contract”) between
yStats.com GmbH & Co. KG (hereinafter also referred to as “we” or “us”) with our customers regarding (i) research services, (ii) the purchase of reports, and (iii) any other contracts between us and our customers executed by reference to these terms and conditions (any reports and other services and products which we may make available to the customer under a Contract hereinafter the “Products”).
1.2 Any terms and conditions of our customers are hereby expressly rejected. Agreements con-trary to these terms and conditions require our written confirmation. In case of deviations between these terms and conditions and the contents of the Order Forms, the contents of the Order Form shall prevail.
2. OFFERS, ORDERS2.1 With respect to research services, we usually submit an offer to the customer in the form of
a “Research Order Form” accompanied with a proposal stating the nature of the issue to be researched, the services to be rendered, the time required for the study and the fee due.
2.2 With respect to the purchase of reports, we usually submit an offer to the customer in the form of a “Report Order Form” accompanied with product brochure stating the contents of the report and the fee due. In this respect, our customers may chose between two types of Products, namely (i) our Product “Market Reports” and (ii) our Product “Full Access Global E-Commerce Reports”.
2.3 If a customer orders our Product “Market Reports”, the customer gets access to the ordered report as identified in the Report Order Form and the customer may use that report in accor-dance with Section 4.3 below and the other provisions of the Contract.
2.4 If a customer orders our Product “Full Access Global E-Commerce Reports”, the customer gets access to any standard reports (for the avoidance of doubt excluding reports published in connection with any research services) focussed on the “Internet & E-Commerce” industry as generally published by us during the twelve (12) months prior to the execution of the Contract and during the subscription term as identified in the “Report Order Form” as of the date of the execution of the Contract (i.e. one, two or three years), and the customer may use those reports as a “Global Site License” in accordance with Section 4.3 below and the other provisions of the Contract.
2.5 Unless expressly agreed otherwise in writing, the contents of our offers may not be made available in whole or in part to any third party outside the organization of the customer without our prior written consent.
2.6 Our offers are not binding and subject to change without notice until acceptance by the customer. Our orders will become legally binding upon acceptance by the customer. A valid acceptance requires the execution of our “Research Order Form” or our “Report Order Form” respectively (each such document hereinafter the “Order Form”) by a duly authorized repre-sentative of the customer and the submission of the Order Form to us via facsimile or email with pdf-attachment. We will provide the customer with the access data required to access the ordered Product(s) with two (2) days as of the execution of the Contract.
3. TERMS OF PAYMENT3.1 The contractually negotiated prices are to be derived exclusively from the Order Form and/or
the documents referenced therein.3.2 All prices are net and without transportation costs, if applicable. Value Added Tax, if applica-
ble, at the statutory rate shall be added to all fees payable hereunder.3.3 We may demand an additional fee for services that go beyond the scope as agreed under the
Order Form in case such additional Products are requested by the customer.3.4 We will send our invoice to the customer upon execution of the Contract, unless agreed
otherwise in the Order Form. In the event that the customer orders our Product “Full Access Global E-Commerce Reports”, we will send our invoice for the first contract year upon exe-cution of the Contract and the invoice(s) for any subsequent contract year(s), if any, upon commencement of any subsequent contract year.
3.5 All payments shall be due and payable within thirty (30) days following the date of our invoice without any deductions. The customer will be in default one day after the expiry date without any further warning notice being required.
3.6 All customers‘ rights of retention or set-off are hereby excluded to the extent that they are not based on the same contractual relationship. Retentions or set-offs are allowed only if the customer‘s claim is nondisputed or has become unappeasable.
3.7 In the event of a customer‘s default in payment or other apparent credit unworthiness, all remaining claims against that customer shall become immediately due and payable in full. We shall then be entitled to rescind payment terms previously agreed upon and to demand payment in advance or other appropriate security with respect to pending deliveries. A customer shall be deemed unworthy of credit in particular when he files a petition in ban-kruptcy or composition proceedings.
4. INTELLECTUAL PROPERTY RIGHTS AND INDEMNITIES4.1 All copyrights and other intellectual property rights in connection with our Products remain
with us. All data carriers remain our property. The customer may not modify, publish, trans-mit, transfer or sell, reproduce, create derivative works from, distribute, perform, display, or in any way exploit any of the Products made available by us, in whole or in part, except as expressly permitted under the Contract.
4.2 Upon delivery of the Products to the customer and payment of the agreed fee, the customer obtains a non-exclusive, non-transferable, perpetual, worldwide right to use the Products provided to the customer for its internal purposes or any additional purposes set out in the Order Form. A right to resell our Products requires our prior written approval.
4.3 In the event that the parties agree on a “Single User License” under the Order Form, this means that only one individually named user of an organization shall be entitled to access the report. In the event that the parties agree on a “Site License” under the Order Form, this means that all users within a given geographical location (as specified in the Order Form) of an organization shall be entitled to access the report. In the event that the parties agree on a “Global Site License”, this means that all worldwide users of an organization shall be
entitled to access the report. In both cases, the term “organization” refers to the company of the specific customer only and excludes any third parties including affiliates.
4.4 We must expressly be named as the author of any data the customer processes further as contractually negotiated.
5. TECHNICAL INFORMATION5.1 We shall provide our Products in standardized data formats.5.2 The customer must ensure that he has the corresponding technical resources to make use of
these data. The customer may not derive any claims in this connection on grounds of breach of obligation.
6. DEFECTS AS TO QUALITY6.1 No claims for defects as to quality are triggered by insignificant discrepancies between our
products and services and the warranted quality or fitness for use.6.2 Likewise, no claims for defects as to quality may be derived from entrepreneurial risks –
e.g., with regard to questions of entrepreneurial discretion, an erroneous assessment of the market situation or the failure to recognize a business action’s merit.
6.3 Defect-based claims are further excluded in cases of excessive or improper use or in connec-tion with damages caused by extraordinary conditions not reflected in the Order Form. This is also true in cases of subsequent changes made by the customers or third parties unless such changes do not affect the analysis and removal of a given defect.
6.4 Claims for defects as to quality expire within one year from the commencement of the legal statute of limitation. This limitation does not apply to the extent that applicable law stipu-lates a longer period in cases of intentional or grossly negligent breaches of duty on the part of us, fraudulent concealment of a defect and injuries to life, body and health.
6.5 Claims for damages and the reimbursement of expenditures are further subject to Section 8.7. LEGAL DEFECTS7.1 We are liable for products and services infringing on third-party rights only if and to the
extent that our products and services are used in accordance with the agreed contractual requirements.
7.2 Unless agreed otherwise, our liability for the infringement on third-party rights is limited to the territory of the European Union and the European Economic Area as well as the place of its services’ proper use as agreed under the applicable Order.
7.3 In the event that a third party asserts claims against the customer, alleging that a service performed by us violates its rights, the customer shall promptly notify us. If a service rendered by us violates thirdparty rights, we shall choose one of the below actions, duly taking into consideration the customer’s interests:
a) procuring for the customer the right to use the service; b) revising the service to render it free of legal violations; or c) withdrawing the service and refunding to the customer any related compensation paid,
as adjusted by an adequate user fee, if we cannot effect another remedy at a reasonable expense.
7.4 Upon our request, the Customer shall assist us with the defense against claims according to this section 7, with us reimbursing the Customer for any expenditures and costs incurred as a result, although each of the Parties bears the costs of the use of its own personnel.
7.5 Claims the Customer may hold for legal defects expire in accordance with Section 6.4.7.6 Claims for damages and the reimbursement of expenditures are further subject to Section 8.8. LIABILITY8.1 In cases of intentional misconduct and gross negligence, we are fully liable pursuant to
applicable law.8.2 Our liability in cases of simple negligence is limited as follows: we are liable only if and to
the extent that we violated a material contractual obligation (cardinal obligation) – i.e., an obligation that (i) the Customer reasonably relied upon at execution of the applicable Order Form and (ii) was of critical significance to the outcome of performance. As regards property damage and financial loss, such liability is limited to typical and foreseeable damages; in no event will we be liable for any incidental, special, punitive or consequential damages, loss of profits or loss of data in such case.
8.3 Our liability for damages under warranties (Beschaffenheitsgarantien) is limited to instances in which the warranty expressly includes such liability.
8.4 Claims for the reimbursement of expenditures and other liability claims asserted by the Customer against us are subject to sections 8.1 through 8.3.
9. CONFIDENTIALITY9.1 The Parties shall hold in strict confidence for an indefinite period of time all data and
information materials of which they gain knowledge as part of a Contract, be it orally, in writing or otherwise, directly or indirectly, provided that such data or information materials are designated confidential or must be considered confidential based on their nature, and shall use them exclusively as part of the services covered by the relevant Order. This duty of confidentiality excludes data and information materials that:
a) were already known or accessible to any third party at the time of disclosure; b) one of the parties legitimately receives from a third party following disclosure, and such
third party is not bound by a duty of confidentiality in relations with the other Party; c) must be disclosed by order of and to a government agency or another competent third
party; and d) must be disclosed to legal or tax advisors of the contractual customer in question for
consulting purposes. In the cases of Sections c) and d), the parties shall (i) promptly inform each other about a
given request and prior to disclosing confidential information, and (ii) limit the disclosure of confidential information to the minimum required.
9.2 We may use the Customer as a reference so long as no contractual details are divulged.10. JURISDICTION, GOVERNING LAW, MISCELLANEOUS10.1 Place of payment is Hamburg, Germany.10.2 All disputes arising from or in connection with any Contract between the parties shall be
resolved through the courts of Hamburg. Governing law is German law.