
Earthquake Seismology 2019/2020
37
Earthquake Seismology 2019/2020 BGS National Earthquake Information Service Thirty-first Annual Report
Transcript of Earthquake Seismology 2019/2020

Earthquake Seismology 2019/2020
BGS National Earthquake Information Service
Thirty-first Annual Report

BRITISH GEOLOGICAL SURVEY
OPEN REPORT OR/20/039
Key words
Monitoring, Earthquakes, Seismology.
Front cover
Macroseismic intensities for the magnitude 2.9 ML earthquake at Preston New Road on 26 August.
Bibliographical reference
BAPTIE, B., 2020. Earthquake Seismology 2019/2020. British Geological Survey Open Report, OR/20/039
37pp.
Earthquake Seismology 2019/2020
B. Baptie (editor)
© UKRI 2020 Edinburgh British Geological Survey 2020

i
Contents
Contents ........................................................................................... i
Summary ......................................................................................... ii
Introduction .................................................................................... 1
Monitoring Network ....................................................................... 3
Achievements ................................................................................. 5
Network Performance ................................................................... 5
Network Development .................................................................. 7
Information Dissemination ............................................................ 9
Communicating Our Science ...................................................... 11
Collaboration and Data Exchange .............................................. 13
Seismic Activity ............................................................................ 15
Bridgwater, Somerset ................................................................. 17
Stockton-on-Tees ........................................................................ 19
Preston New Road ...................................................................... 21
Funding and Expenditure ........................................................... 23
Acknowledgements ..................................................................... 24
References .................................................................................... 24
Appendix 1 The Earthquake Seismology Team ..................... 25
Appendix 2 Publications ........................................................... 26
Appendix 3 Publication Summaries ........................................ 27

ii
Summary
The British Geological Survey (BGS) operates a network of seismometers throughout the UK in order to acquire seismic data on a long-term basis. The aims of the National Earthquake Information Service (NEIS) project are to develop and maintain a national database of seismic activity in the UK for use in seismic hazard assessment, and to provide a near-immediate response to the occurrence, or reported occurrence, of significant events. The project is supported by a group of organisations under the chairmanship of the Office for Nuclear Regulation (ONR) with major financial input from the Natural Environment Research Council (NERC).
In the 31st year of the project, we have continued to operate the national seismic monitoring network efficiently and effectively. Two new arrays of borehole seismometers were installed and an old short period station was upgraded with the installation of a new broadband sensor and digital data telemetry. Data from all stations were transferred directly to Edinburgh for near real-time detection and location of seismic events as well as archiving and storage of continuous data. Data latency was generally low, less than one minute most of the time, and there was a high level of completeness within our archive of continuous data.
All significant events were reported rapidly to the Customer Group through seismic alerts sent by e-mail. The alerts were also published on the Internet (http://www.earthquakes.bgs.ac.uk).
Three papers have been published in peer-reviewed journals, three BGS reports were prepared and three papers were published in conference proceedings. This included studies of seismicity at Newdigate, Surrey and Preston New Road, Lancashire. We have continued to collaborate widely with academic partners across the UK and overseas on a number of research initiatives.

1
Introduction
The BGS Seismic Monitoring and Information Service has developed as a result of the commitment of a group of organisations with an interest in the seismic hazard of the UK and the immediate effects of felt or damaging vibrations on people and structures. The supporters of the project, drawn from industry and central and local government, are referred to as the Customer Group.
Almost every week, seismic events are reported to be felt somewhere in the UK. A small number of these prove to be sonic booms or are spurious, but a large proportion are natural earthquakes often felt at intensities which cause concern and, occasionally, some damage. The Information Service aims to rapidly identify these various sources and causes of seismic events, which are felt or heard.
In an average year, about 150 earthquakes are detected and located by BGS with around 15% being felt by people. Historically, the largest known British earthquake occurred on the Dogger Bank in 1931, with a magnitude of 6.1 ML. Fortunately, it was 60 miles offshore but it was still powerful enough to cause minor damage to buildings on the east coast of England. The most damaging UK earthquake known in the last 400 years was in the Colchester area (1884) with the
modest magnitude of 4.6 ML. Some 1200 buildings needed repairs and, in the worst cases, walls, chimneys and roofs collapsed.
Long term earthquake monitoring is required to refine our understanding of the level of seismic hazard in the UK. Although seismic hazard and risk are low by world standards they are by no means negligible, particularly with respect to potentially hazardous installations and sensitive structures. The monitoring results help assess the level of precautionary measures which should be taken to prevent damage and disruption to new buildings, constructions and installations which otherwise could prove hazardous to the population. For nuclear sites, seismic monitoring provides objective information to verify the nature of seismic events or to confirm false alarms, which might result from locally generated instrument triggers.

2
Epicentres of earthquakes with magnitudes 2.5 ML or greater, for the period 1979 to March 2020.

3
Introduction
Monitoring Network
The BGS National Earthquake Monitoring project started in April 1989, building on local networks of seismograph stations, which had been installed previously for various purposes. By the late 1990s, the number of stations reached its peak of 146, with an average spacing of 70 km. The current network consists of both broadband seismometers and strong motion accelerometers and provides high quality data for both monitoring and scientific research.
In the late 1960s, BGS installed a network of eight seismograph stations in the lowlands of Scotland, with data transmitted to the recording site in Edinburgh by radio, over distances of up to 100 km. Data were recorded on a slow running FM magnetic tape system. Over the next thirty years the network grew in size, both in response to specific events, such as the Lleyn Peninsula earthquake in 1984, and as a result of specific initiatives, such as monitoring North Sea seismicity, reaching a peak of 146 stations by the late 1990s.
The network was divided into a number of sub-networks, each consisting of up to ten seismometers radio-linked to a central site, where the continuous data were recorded digitally. Each sub-network was accessed several times each day using Internet or dial-up modems to transfer any automatically detected event to the BGS offices in Edinburgh. Once transferred, the events were analysed to provide a rapid estimate of location and magnitude.
However, scientific objectives, such as measuring the attenuation of seismic waves, or accurate determination of source parameters, were restricted by both the limited bandwidth and dynamic range of the seismic data acquisition. The extremely wide dynamic range of natural seismic signals means that instrumentation capable of recording small local micro-earthquakes will not remain on scale for larger signals.
The network currently consists of 47 broadband seismometers at stations across the UK along with 33 strong motion accelerometers with high dynamic range for recording strong signals. Eight short period sensors also remain in use. In addition, 36 stations have been installed across the north of England as part of the UKArray project (34 broadband sensors and two strong motion sensors and there are a further five temporary sensors in southeast England (all broadband) to monitor the Newdigate sequence.

4
BGS seismograph stations, March 2020

5
Achievements
Network Performance
The network contains 47 broadband sensors with 24-bit acquisition which provide real-time data from across the UK. Significant faults were rapidly identified and remedied. Data completeness is high.
The network currently consists of 47 broadband sensors, 33 strong motion sensors and 8 short period sensors. Continuous data from all stations are transmitted in real-time to Edinburgh, where they are used for analysis and archived.
New borehole sensors were deployed at two sites. The Glasgow Geothermal Energy Research Field (GGERF) site is an urban geothermal project designed to monitor sub-surface changes as water moves around abandoned mine workings. The GeoEnergy Test Bed (GTB) near Sutton Bonnington is a field laboratory for studying underground fluid movement in relation to onshore geological carbon storage.
The station on Lewis in the Outer Hebrides was decommissioned in February, as we were unable to come to a suitable agreement with the new landowner’s agent. We are investigating other possible locations.
We are continuing to use automated software processes to identify equipment faults rapidly. These identify both sudden and significant problems as well as smaller repetitive ones that over time represent a significant degradation in station performance.
In 2019/20 almost 400 separate significant faults were identified using these methods. 303 of these faults were
dealt with either remotely, or with the help of a network of local contacts. 82 stations required a visit by field section staff of which 45 were permanent stations and 33 were to UKArray stations (see page 7). To improve efficiency we combine multiple site visits into a single trip, and, if appropriate, use lone working.
During the year, 140 person days were spent on fieldwork, with 83.5 days spent on the permanent monitoring network and 39 days on fieldwork associated with UKArray. The UKArray work included the Environmental Baseline Monitoring project in the Vale of Pickering and the Fylde Peninsula carried out for the Department for Business, Energy and Industrial Strategy (BEIS). 16 days were spent on installing new stations and 17 days were spent on decommissioning the broadband station on the Isle of Lewis, some legacy short period stations and stations around the Vale of Pickering at the end of the baseline monitoring project.
Continuous data from all our stations are archived and the completeness of these data can be easily checked to gain an accurate picture of network performance. For 2019-2020, data was 95% complete at 72% of stations, 90% complete at 83% of stations and 85% complete at 93% of stations, which is a decline on the previous year when data was 95%

6
complete at 92% of stations and more than 90% complete for over 96% of stations.
The worst performing broadband stations were DYA, Yadsworthy (54%), WPS, Wylfa (68%), LINV, Lochinver (83%) and RSBS, Rosebush (85%). The lengthy outage at DYA was a result of being unable to gain access to the site. Flooding at WPS resulted in a significant power outage. Equipment at LINV and RSBS was damaged by lightning and there was also difficulty in gaining access to the site at LINV. The station in Glasgow (GCERF) wasn’t installed until May 2019.
In addition, fewer than two stations were down at the same time 84% of the time and less than four down 99% of the time. A snapshot of the impact that this has on the overall detection capability of the network can be obtained by calculating detection capability maps with and without the stations that were down at any time. For example, in July 2019, nine stations, EDI, GAL1, HLM1, JDC, JDG, MCD, TORA, TORB and WACR were down at the same time.
Data completeness for all broadband stations that operated throughout 2019/2020. Data are more than 95% complete at 72% of stations, 90% complete at 83% of stations and 85% complete at 93% of stations.
Detection capability of the network with (a) all stations operational (b) with EDI, GAL1, HLM1, JDC, JDG, MCD, TORA, TORB and WACR down. The contours show earthquake magnitudes (ML) that can be detected. Signal amplitudes must exceed the background noise level by a factor of two at five or more stations. A noise amplitude of 10 nm is assumed for all stations. Red triangles show stations operated by other agencies.
(a) (b)

7
Achievements
Network Development
New borehole sensors were deployed at the Glasgow Geothermal Energy Research Field (GGERF) site and the GeoEnergy Test Bed (GTB) near Sutton Bonnington. A new broadband sensor was deployed at an existing site near Aberfoyle to replace an old short period sensor.
A string of five broadband seismometers were installed in a borehole at the Glasgow Geothermal Energy Research Field (GGERF) site, where research is being carried out to study water circulation in abandoned mine workings to understand if this could provide a sustainable geothermal heat source to homes and businesses. The borehole seismometer array greatly improves the national seismic monitoring network in this urban area so that any felt earthquake can be detected and located. Reliable characterisation of baseline levels of natural seismicity in the area will also allow discrimination of any future events that could erroneously be attributed to geothermal activities at the research site. Without this, it would be hard to categorically demonstrate that any future local seismicity was not caused by the geothermal project.
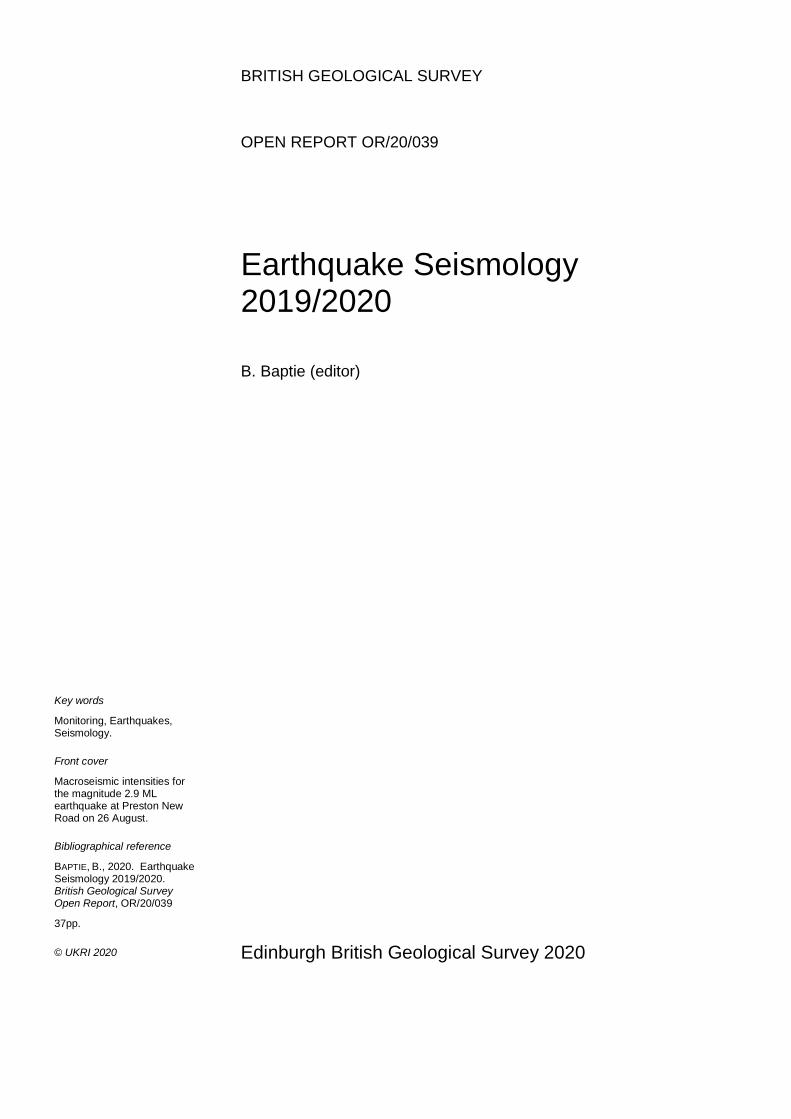
The five seismometers are at depths of 200 m, 160 m, 120 m, 80 m and 40 m. The borehole sensors provide significant reductions in noise levels, since most seismic noise attenuates rapidly with increasing depth, allowing sensors to be situated in a high noise urban location where it would not be possible to install surface sensors. The average noise level at 200 m is around four times lower than at 40 m.
The GeoEnergy Test Bed (GTB) is a field laboratory for studying underground fluid movement in porous reservoir rocks and
lower permeability seal rocks through field tests and experiments on rock samples extracted from the GTB. The string of five borehole seismometers was installed in February to detect and characterise any seismicity induced during injection of liquid CO2. Data from the sensors is transmitted in near real-time over the Internet and is integrated with our other data acquisition and processing.
In March 2020, a broadband sensor was deployed at an existing monitoring site near Aberfoyle. This site was one of the first BGS seismic monitoring stations to be installed and has been operating since the 1970s. The three-component broadband seismometer replaces a single component short period sensor, providing data with a higher dynamic range and wider bandwidth. Continuous data are transmitted in near real-time over the Internet. The site lies very close to the Highland Boundary Fault and significantly improves detection and location capability in this part of Scotland.
In July 2019, ten temporary seismic stations were installed at distances of up to a few kilometres from the United Downs Deep Geothermal Project (UDDGP) site in Cornwall. This work was carried out as part of the NERC funded GWatt project. The sensors will supplement the existing seismometer network and will allow us to detect and reliably locate very small
8
seismic events related to fluid flow as well as estimate fracture geometries. This will help to better characterise fracture
networks and fluid flow in the heat-producing granites around the site.
Installing the borehole seismometers at the GeoEnergy Test Bed site near Sutton Bonnington,
Nottinghamshire.
RMS amplitudes of background seismic noise at each of the five borehole seismometers at the
Glasgow geothermal site. Noise reduced with depth.

9
Achievements
Information Dissemination
It is a requirement of the Information Service that objective data and information be distributed rapidly and effectively after an event. Customer Group members have received alerts by e-mail whenever an event was felt or heard by more than two individuals.
Alerts were issued for 35 UK events within the reporting period. Alerts for all local earthquakes were issued to Customer Group members within two hours of a member of the 24-hour on-call team being notified. The alerts include earthquake parameters, reports from members of the public, damage and background information. Twenty-five of the alerts were for earthquakes on mainland Britain and a further eight were for earthquakes offshore in the waters around the British Isles. The two remaining alerts were for sonic booms.
The Earthquake Seismology web pages are directly linked to our earthquake database providing near real-time lists of significant earthquake activity, together with automatically generated pages for each event.
Our web pages also incorporate our automatic macroseismic processing
system, which remains a key part of our response to felt events and is used to produce macroseismic maps for the seismology web pages. These are updated in near real-time as data are contributed. We received over 2000 replies following the magnitude 2.9 ML earthquake induced by hydraulic fracturing operations at Preston New Road, Lancashire on 26 August 2019 and over 700 and 860 replies following the magnitude 3.2 ML and 3.1 ML earthquakes near Bridgwater, Somerset on 5 December 2019 and near Stockton-on-Tees on 23 January 2020, respectively.
A newsletter was circulated to Customer Group members for the time periods April–September. A briefing note was issued during the induced seismicity related to hydraulic fracturing operations at Preston New Road, Lancashire in August.
Macroseismic intensities for the magnitude 2.9 ML earthquake induced by hydraulic fracturing at Preston New Road, Lancashire on 26 August 2019. Coloured squares in (a) show intensities calculated from macroseismic data. Grey squares show places where the earthquake was felt but there were too few observations to determine an EMS Intensity. Coloured squares in (b) show the number of observations
used to determine each intensity value.

10
Events in the reporting period (1 April 2019 – 31 March 2020) for which alerts have
been issued. Circles are scaled by magnitude.

11
Achievements
Communicating Our Science
An important part of the BGS mission is to provide accurate, impartial information in a timely fashion to our stakeholders, the public and the media. We promote understanding of Earth Sciences by engaging with the public and other audiences and by creating dynamic web pages with background information and topical content.
The SECED2019 Earthquake Risk and Engineering Towards a Resilient World conference took place on 9-10 September 2019 at the University of Greenwich, London. The conference was attended by Brian Baptie, David Hawthorn, Richard Luckett, Ilaria Mosca and Susanne Sargeant.
Ilaria Mosca gave a presentation on “Objective quantification of the seismic source model for nuclear sites” in the session on “Design for Nuclear Safety”. This is a new approach to objective quantification of the seismic source models used for seismic hazard assessment and uses a fully non-linear method to evaluate source zone models. Ilaria also gave a presentation on “Revising the seismic hazard maps for the UK” in the session on “Seismic Hazard and Engineering Seismology”. Brian Baptie gave a presentation on “Seismicity induced by hydraulic fracturing operations at Preston New Road, Lancashire, 2018” in the session on “Induced Seismicity”. BGS staff also co-authored a number of other papers.
BGS were also official sponsors of the conference and had a stand in the exhibition area on monitoring earthquake activity across the UK, providing site specific seismic monitoring solutions,
conducting seismic hazard assessments and quantifying landslide risk.
Heiko Buxel, Rob Clark, David Hawthorn and John Laughlin all participated in an Edinburgh Science festival event on Saturday 6 April at Dynamic Earth, Edinburgh. Earthquakes and Earth hazards were a key part of the BGS display. All four also took part in the BGS open day that was part of Doors Open Day (http://www.doorsopendays.org.uk/) an event that offers free access to over a thousand venues across the country throughout September. Over 500 visitors were treated to short talks as well as hands-on activities.
David Hawthorn also participated in the BGS Open Day at our office in Keyworth Nottinghamshire on 12 October 2019, providing demonstrations of how we measure earthquakes and other insights. The event was held as part of Earth Science Week (12–20 October) and was supported by leading Universities, partners and scientists.
David Hawthorn also attended the British Dam Society Supervising Engineers' Forum on September 12 in Birmingham. The meeting included presentations on assessment, and monitoring of dams.

12
Brian Baptie gave a presentation to the All Party Parliamentary Group on the Impact of Shale Gas on 2 April at Portcullis House, Westminster, London. The main topic of discussion was the traffic light system regulation and whether it should be amended and if existing independent monitoring of seismicity at fracking sites was sufficient.
Brian also gave a talk on seismicity induced by hydraulic fracturing operations at Preston New Road, Lancashire, at the SECED evening meeting at the Institute of Civil Engineers, London, on 26 September 2019.
BGS remains a principal point of contact for the public and the media for information on earthquakes and seismicity, both in the UK and overseas. During 2019-2020, at least 1,038 enquiries were answered. These were all logged using the BGS enquiries tracking database. Many of these were from the media, which often led to TV
and radio interviews, particularly after significant earthquakes.
The seismology web site continues to be widely accessed, with an average of over 304,000 visitors logged each month.
The Seismology web pages are intended to provide earthquake information to the general public as quickly as possible. Earthquake lists, maps and specific pages are generated and updated automatically whenever a new event is entered in our database or when the parameters for an existing event are modified. We also have a database search page that allows users to search our database for basic earthquake parameters within a given geographic or magnitude range. We have also continued to provide displays of real-time data from most of our seismic stations that allow users to check activity or look for specific events. In addition, we continue to add event-specific content for significant earthquakes in the UK and around the world.
Heiko Buxel talks to members of the public at the Edinburgh Science festival event on Saturday 6
April at Dynamic Earth, Edinburgh.

13
Achievements
Collaboration and Data Exchange
Data from the seismograph network are freely available for academic use and we have continued to collaborate with researchers at academic institutes within the UK throughout the past year, as well as exchanging data with European and world agencies.
Brian Baptie and Richard Luckett are co-authors of a paper on the Newdigate earthquake sequence that has been published in Seismological Research Letters titled “A Shallow Earthquake Swarm Close to Hydrocarbon Activities: Discriminating between Natural and Induced Causes for the 2018–2019 Surrey, United Kingdom, Earthquake Sequence”. The paper analyses the data recorded on the array of temporary stations installed by BGS around Newdigate to better understand the sequence and its relationship with hydrocarbon exploration and production in the area. The paper finds no evidence that oil extraction caused the earthquakes sequence.
Work is continuing on the revision of the UK national seismic hazard maps that are intended to inform the UK’s revised National Annex to the 2020 version of Eurocode 8. We received comments and suggestions on the first draft from a number of reviewers. These then required a number of changes to both the analysis and the report. We are now in the process of incorporating the comments and suggestions for the next version of the report. When this is finalized, we hope to be able to give a presentation to the wider engineering community.
Ilaria Mosca attended a two day peer review workshop on the European Seismic Hazard Model 2020 (ESHM20) in Lisbon on 6-7 June 2019. The main aim of the workshop was to obtain feedback on the
ESHM20 model. The Lisbon meeting focussed on Iberia, France, Italy and the UK. Ilaria also attended the SIGMA2 symposium on 21 November in the EDF Lab facilities, Paris-Saclay, France. The event gathered over 90 participants from the international seismic hazard and earthquake engineering communities.
The annual meeting of the Seismology and Earthquake Engineering Research Infrastructure Alliance for Europe (SERA) was held in Edinburgh on 15-16 May. The SERA project aims to reduce the risk posed by natural and anthropogenic earthquakes based on innovative research and development projects and significantly improve the access to data, services and research infrastructures for scientists and other professionals. The meeting was attended by a number of participants from BGS and was a good opportunity to learn about some of the latest developments in seismic hazard research across Europe.
The NERC-NSF project “The Central Apennines sequence under a New Microscope” entered its third year. The project is led by Margarita Segou from BGS and brings together scientists from the UK (BGS, Universities of Edinburgh and Bristol), the US (University of Stanford, US Geological Survey, Lamont-Doherty Observatory Columbia University) and Italy (INGV).
Atalay Ayele from the Institute of Geophysics, Space Science and

14
Astronomy (IGSSA) at the University of Addis Ababa in Ethiopia visited BGS in August. Dr Ayele worked with Richard Luckett on recent seismicity at Fentale volcano in Ethiopia and with Ilaria Mosca on developing seismic hazard assessments for the Main Ethiopian Rift. Brian Baptie and Richard Luckett visited IGSSA in November 2019 to deliver a training course in seismic data analysis and earthquake hazard.
Brian Baptie is continuing to work with researchers from the Universities of Leeds and Edinburgh on the NERC funded REMIS (Reliable Earthquake Magnitudes for Induced Seismicity) project. The project aims to determine interlinked probability density functions of earthquake locations, magnitudes, and seismic velocities in the subsurface using a non-linear Bayesian approach.
The BGS environmental baseline monitoring project in the Vale of Pickering, North Yorkshire ended in March 2020. The project was funded by BEIS and included
partners from the universities of Birmingham, Bristol, Manchester and York and partners from Public Health England (PHE).
BGS continues to exchange data with other agencies to help improve source parameters for regional and global earthquakes. Phase data are distributed to the European-Mediterranean Seismological Centre (EMSC) to assist with relocation of regional earthquakes and rapid determination of source parameters. Phase data for global earthquakes are sent to both the National Earthquake Information Centre (NEIC) at the USGS and the International Seismological Centre (ISC). This year, data from 420 seismic events were sent. Data from the BGS broadband stations are transmitted to both ORFEUS, the regional data centre for broadband data, and IRIS (Incorporated Research in Seismology), the leading global data centre for waveform data, in near real-time.
Locations for the Newdigate earthquakes as published by Hicks et al (2019). Events are coloured by time and scaled by magnitude.

15
Seismic Activity
The details of all earthquakes, felt explosions and sonic booms detected by the BGS seismic network have been published in monthly bulletins and compiled in the BGS Annual Bulletins.
There were 252 local earthquakes located by the monitoring network during 2019-2020. This does not include the seismicity induced by hydraulic fracturing at Preston New Road (which was 136 events from 15 August to 30 September with magnitudes from -1.7 to 2.9ML). It does include 57 events from near Newdigate, Surrey, the largest of which had a magnitude of 2.5 ML. Thirty-one of these had magnitudes of 2.0 ML or greater and five had magnitudes of 3.0 ML or greater. Sixteen events, with a magnitude of 2.0 ML or greater, were reported felt, together with a further ten smaller ones, bringing the total to 26 felt earthquakes in 2019-2020.
The largest earthquake was a magnitude 4.2 ML event in the Shearwater Field, Central North Sea, approximately 250 km east of Aberdeen. This event was felt on oil platforms in the nearby Elgin-Franklin fields. It was the largest earthquake in the Central North Sea since a magnitude 4.7 ML event at the southern part of the Viking Graben on 30 June 2017 and around 90 km west of the magnitude 4.2 ML earthquake that was induced in the Ekofisk field in June 2001. Shearwater is among the biggest producing fields in the North Sea and events with magnitudes of 3.5 and 3.1 ML were recorded here in 2010 and 2013. Events with magnitudes of 3.9 and 3.2 ML were recorded in the nearby Elgin field in June and July 2007.
A magnitude 3.2 ML earthquake occurred near the town of Bridgwater, Somerset, on 5 December 2019 at 22:49 UTC. Over 700 reports were received from members of the public and were used to determine macroseismic intensities. The maximum intensity was estimated as 5 EMS.
A magnitude 3.1 ML earthquake was located near Stockton-on-Tees on 23 January 2020. We received over 860 responses from members of the public who felt the earthquake. The maximum intensity was estimated as 5 EMS.
Instrumentally recorded earthquakes (red circles) in the region of the magnitude 4.2 ML earthquake in Shearwater Field, Central North Sea. Shaded areas
show locations of oil and gas fields.
16
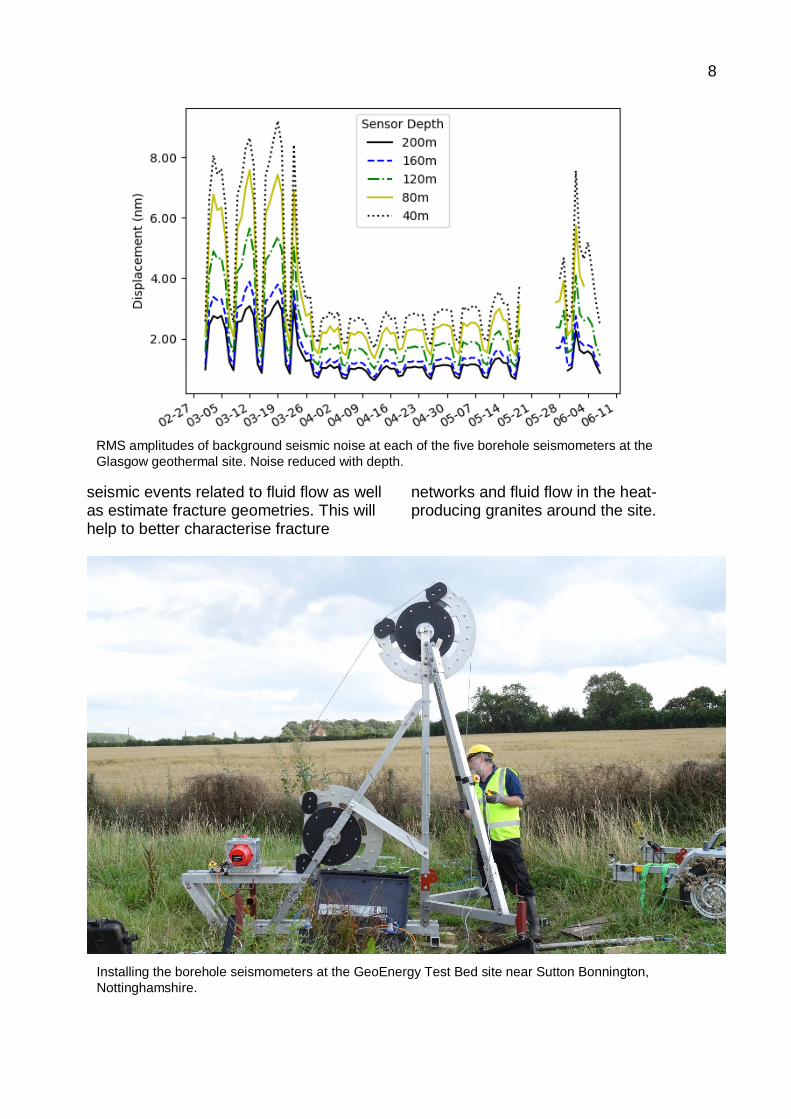
Epicentres of all earthquakes in and around the UK detected in the reporting period
(1 April 2019 – 31 March 2020).

17
Seismic Activity
Bridgwater, Somerset
A magnitude 3.2 ML earthquake was located near Bridgwater, Somerset on 5 December 2019 in the same location as three other magnitude 3 events in 2004. The event was felt widely throughout Somerset.
An earthquake was recorded near Bridgwater, Somerset on 5 December 2019 at 22:49 UTC. The earthquake had a magnitude of 3.2 ML. A cluster of three other magnitude 3 ML earthquakes occurred in the same location on 29 January 2004. The latter were a few hours apart with intensities of 3 and 4 (EMS), respectively. Another smaller event (1.5 ML) occurred at nearly the same location on 9 February 2004.
The earthquake was 85 km east-southeast of the magnitude 4.1 Bristol Channel earthquake in 2014 and approximately 90 km southeast of the magnitude 4.2 ML earthquake near Swansea in 2018.
Southwest England is characterized by low levels of seismicity, although small earthquakes have occurred throughout the region. The largest earthquake in the
region was a magnitude 4.1 Mw in West Cornwall in 1757. Musson (1994) assigns an epicentre for this earthquake just east of Penzance. This earthquake was felt throughout Cornwall and the Scilly Isles and in the western part of Devon. More recently, a magnitude 3.5 Mw earthquake was recorded near Penzance in 1996.
Wells Cathedral was reported to have been badly damaged by an earthquake on 21 December 1248. On 11 September 1275, an earthquake struck southwest England and Wales. The epicentre is unknown, although it may have been in Glamorgan, Wales. The earthquake is known for causing the destruction of St Michael's Church on Glastonbury Tor in Somerset.
The event of 5 December 2019 was felt widely in towns and villages throughout Somerset and over 700 people completed
Historical (yellow) and instrumentally recorded (red) seismicity of southwest England. Events are scaled by magnitude.

18
our online questionnaire allowing us to estimate macroseismic intensities for the event. Reports described "whole house rattled", "physically felt my bed shake", "a low rumble", "house gave a short cracking sound" and "big rumble and house was given a definite shove". The maximum intensity was estimated as 5 EMS.
The closest station to the epicentre was 68 km and there were only five stations within 100 km. Location errors depend on the distribution and density of the recording stations and these errors may be large if the station density is insufficient, or if the closest stations are far from the earthquake source. For the lowest errors, the source needs to be surrounded by stations. A uniform station density is required to ensure comparable location accuracy across the region of interest.
The lack of nearby stations resulted in considerable uncertainty in the calculated
depth for the Bridgwater earthquake, although the epicentre is relatively well constrained as a result of the good azimuthal coverage of stations at greater distances. Location errors were estimated using a probabilistic, non-linear, global-search earthquake location algorithm (Lomax et al, 2009). This suggests that the depth uncertainty is at least ±5 km.
We can estimate the reduction in location uncertainty that would result if there was an additional station within 15 km of the epicentre by adding modelled arrival times then recalculating the location. The nearby station results in a considerable reduction in the calculated depth uncertainty, demonstrating the importance of stations close to the epicentre. This is also important for recording strong ground motions.
Macroseismic intensities for the Bridgwater earthquake. The yellow star shows the epicenter. Intensities are calculated in 5 km grid squares from over 700 reports from people who felt the earthquake. A minimum of five observations is needed in any grid square to calculate a value of intensity, otherwise the value is recorded as “Felt”, but no intensity is
calculated.
Location calculated from observed phase arrivals from the Bridgwater earthquake [(a) and (b)]. The blue star gives the maximum likelihood location. Red dots show the density-scatter in the location probability distribution function. The blue ellipsoids show 95% confidence regions. (c) and (d) show the reduction in uncertainty by including modelled travel-times for station within
15 km of the epicentre.

19
Seismic Activity
Stockton-on-Tees
A magnitude 3.1 ML earthquake was located near Stockton-on-Tees on 23 January 2020. The event was well recorded by both permanent and temporary monitoring stations in the North of England. It was felt widely throughout Teeside.
A magnitude 3.1 ML earthquake was located near near Stockton-on-Tees on 23 January 2020. The earthquake was widely felt with intensities up to 5 EMS, leading to considerable public and media interest in the event. The former orientation agrees with observed faulting in the region.
Northeast England is an area of relatively low seismicity even by UK standards. Most significant historical activity is located to the west. In 1871, a magnitude 4.9 ML occurred near Appleby in Cumbria, 75 km to the west. This event seems to have been widely felt over a large area, but caused very little damage. In 1768 and 1780, magnitude 4.4 ML and 4.8 ML
earthquakes occurred in Wensleydale. Another magnitude 4.4 ML event was recorded in Wensleydale in 1933. Again this was strongly felt over a wide area and resulted in some damage. In 1970 a magnitude 4.1 ML event occurred near Kirby Stephen. The felt extent was similar to the 1933 event, but there was virtually no damage.
The recent event was well recorded by monitoring stations in the north of England, with seven stations at a distance of less than 50 km and one station within 10 km. As a result, the event location is well-constrained, with an uncertainty in the focal depth of approximately ±2 km. The
Historical (yellow) and instrumentally recorded (red) seismicity of northeast England. Events are scaled by magnitude. The inset shows the focal mechanism calculated for the event on 23 January 2020.

20
depth was relatively shallow at approximately 3 km. A focal mechanism was also calculated for the event. This shows either right-lateral strike-slip faulting on a near vertical east-west plane or left-lateral strike-slip faulting on a near vertical north-south plane.
Over 860 members of the public completed our online questionnaire allowing us to estimate macroseismic intensities for the event. The majority of reports were from Stockton-on-Tees, Billingham, Norton, Middlesbrough, Wolviston and Hartlepool. These typically described, "woke me up", "felt like someone had crashed into the house with a car", "single shock and felt like an explosion nearby", "it felt like the house was lifting from its foundations", "it was over in a second or two but the shaking was severe", "felt my entire room move and I have never felt anything like that in my life" and "the whole wardrobe was shaking". The maximum intensity was estimated as 5 EMS.
Stations used to locate the Stockton-on-Tees earthquake (a). Stations are coloured by distance from the
epicentre. (b) shows measured PGA for the closest stations.
Macroseismic intensities for the Stockton earthquake. The yellow star shows the epicenter. Intensities are calculated in 2 km grid squares from over 860 reports from people who felt the earthquake. A minimum of five observations is needed in any grid square to calculate a value of intensity, otherwise the value is recorded as “Felt”, but no intensity is
calculated.

21
Seismic Activity
Preston New Road
Hydraulic fracturing (HF) operations at Preston New Road, Lancashire, restarted on 15 August 2019 and resulted in the largest HF related earthquake recorded in the UK to date, leading to a premature end to operations. It was strongly felt at distances of up to a few kilometres from the epicentre with maximum intensities of 6 EMS.
In late 2018, hydraulic fracturing of the Bowland Shale was carried out at the Preston New Road 1Z horizontal well (PNR-1z), approximately 4 km south of Preese Hall. The PNR-1z well targets the Bowland shale at a depth of approximately 2300 m and runs approximately east-west for 700 m horizontally through the unit. A total of 16 stages were stimulated between 16 October 2018 and 17 December 2018 with a maximum injected volume of 431 m3. No HF was carried out between 3 November and 4 December as flow-back from the well took place.
Operations in the PNR-1z well were accompanied by seismicity (Clarke et al., 2019) that was recorded by both a dense network of surface sensors and by a downhole geophone array in the adjacent PNR-2 well. The largest event had a magnitude of 1.6 ML and was felt by a small number of people near the epicentre. Seismicity is observed to move from west to east, corresponding to different stages of operations and focal mechanisms show predominantly strike-slip faulting along near vertical NW-SE or NE-SW planes, which is consistent with observed mechanisms for most tectonic earthquakes in the British Isles (Baptie, 2010).
HF operations in the PNR-2 well at Preston New Road, Lancashire, started on 15 August 2019 and were also accompanied by seismicity. The horizontal PNR-2 well
runs roughly parallel to the PNR-1z well that was stimulated in October-December 2018 and is offset by approximately 200 m. The largest of these events was 2.9 ML and occurred on 26 August 2019 at 07:30 UTC, almost 72 hours after the last HF stage on 23 August. Seismicity is again observed to move from west to east, corresponding to different stages of operations with similar focal mechanisms to PNR-1z.
The last stage was stimulated on 23 August 2019, with trailing events continuing to occur in the following few days: a 2.1 ML event at 22:01 (UTC) on 24 August 2019 (~40 hours after the last HF stage) and a 2.9 ML event at 07:30 UTC on 26 August 2019 (~72 hours after the last HF stage). The latter is the largest HF related earthquake recorded in the UK to date and it was strongly felt at distances of up to a few kilometres from the epicenter with maximum intensities of 6 EMS. This led to a premature end to operations in the PNR-2 well with only 7/47 HF stages completed and the UK government subsequently announced an immediate moratorium on HF due to the possibility of unacceptable impacts on local communities.
During operations in PNR-1z, event rates increase when injection starts and decay rapidly after injection stops but there is considerable variation in event rates

22
between individual stages of operations, with some showing relatively high activity rates. Stages close to the heel (east) end of the horizontal well show higher levels of seismicity than those at the toe (west) end, despite similar stimulation volumes. During operations in PNR-2, the events initially show strong temporal association with HF stages, as there are relatively few events
outside these periods – suggesting that the event rates decay rapidly with time after stimulation stops. After 21 August 2019, the event rate decays more slowly with time and a number of larger trailing events are observed outside of periods of operation.
Microseismicity recorded during operations at Preese Hall in 2011 (blue circles) and at Preston New Road in 2018 (orange circles) and 2019 (red circles). Symbols are scaled by magnitude. Locations of Preese Hall and Preston New Road sites are shown by grey squares and grey triangles show locations of surface seismometers. The shaded area in the inset (a) shows regions of shale gas potential across the North of England. The red rectangle shows area of larger map. Inset (c) shows the focal mechanism for the magnitude -0.2 ML event at Preese Hall on 2 August 2011 (Clark et al, 2014). This was the only event with a well constrained focal mechanism. Insets (d) and (e) show focal mechanisms calculated for selected events during operations at Preston New Road in 2018 and 2019, respectively.
Histograms showing the number of events per hour (bars) as a function of time during operations in PNR-1z in October 2018 (a), PNR-1z in December 2018 (b), and PNR-2 in August 2019 (c). The grey shaded bars show all events, the red bars show events with magnitudes of -1.5 Mw or above. Blue lines show the cumulative volume of injected fluid during HF operations. No HF was carried out in PNR-1z between 3 November and 4 December.

23
Funding and Expenditure
In 2019-2020 the project received a total of £686K, including a contribution of £438K from NERC. This was matched by a total contribution of £248K from the Customer Group drawn from industry, regulatory bodies and central and local government.
The projected income for 2020-2021 from the Customer Group is £267K. The NERC contribution for 2020-2021 currently stands at £390K, but we hope to increase this through applications for additional funding through the year.
Income 2019/2020 Expected Income 2020/2021
64%
5%
4%
15%
6%6%
BGS/NERC
MHLG
ONR/HSE
Nuclear
Water
Other
57%
6%
5%
18%
7%7%
BGS/NERC
MHLG
ONR/HSE
Nuclear
Water
Other
24
Acknowledgements
This work would not be possible without the continued support of the Customer Group. The current members are as follows: the Ministry for Housing Communities and Local Government, EDF Energy, Jersey Water, Magnox Ltd., the Office for Nuclear Regulation, Sellafield Ltd, Scottish Power, Scottish Water, SSE and BRBGenCo. Station operators and landowners throughout the UK have made an important contribution and the BGS technical and analysis staff have been at the sharp end of the operation. The work is supported by the Natural Environment Research Council.
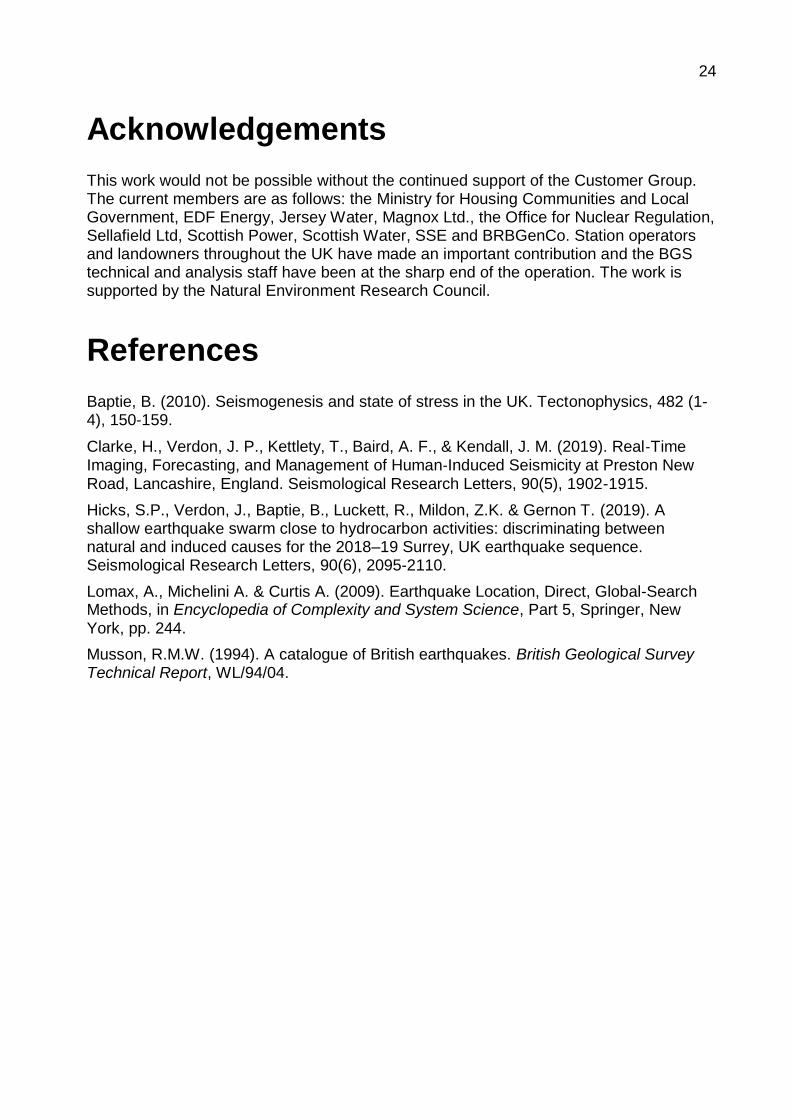
References
Baptie, B. (2010). Seismogenesis and state of stress in the UK. Tectonophysics, 482 (1-4), 150-159.
Clarke, H., Verdon, J. P., Kettlety, T., Baird, A. F., & Kendall, J. M. (2019). Real‐Time Imaging, Forecasting, and Management of Human‐Induced Seismicity at Preston New Road, Lancashire, England. Seismological Research Letters, 90(5), 1902-1915.
Hicks, S.P., Verdon, J., Baptie, B., Luckett, R., Mildon, Z.K. & Gernon T. (2019). A shallow earthquake swarm close to hydrocarbon activities: discriminating between natural and induced causes for the 2018–19 Surrey, UK earthquake sequence. Seismological Research Letters, 90(6), 2095-2110.
Lomax, A., Michelini A. & Curtis A. (2009). Earthquake Location, Direct, Global-Search Methods, in Encyclopedia of Complexity and System Science, Part 5, Springer, New York, pp. 244.
Musson, R.M.W. (1994). A catalogue of British earthquakes. British Geological Survey Technical Report, WL/94/04.

25
Appendix 1 The Earthquake Seismology Team
Brian Baptie Project Manager, observational seismology, passive seismic imaging, induced seismicity.
Heiko Buxel Installation, operation and repair of seismic monitoring equipment.
Rob Clark Field engineer, installation, operation and repair of seismic monitoring equipment.
Glenn Ford Analysis of seismic events, provision of information to stakeholders.
Davie Galloway Analysis of seismic events, provision of information to stakeholders.
David Hawthorn Lead engineer, installation, operation and repair of seismic monitoring equipment.
John Laughlin Electronics engineer, installation, operation and repair of seismic monitoring equipment.
Richard Luckett Observational seismology, local earthquake tomography and seismic data acquisition.
Ilaria Mosca Seismic hazard and ground motion modelling.
Roger Musson Honorary Research Associate, historical earthquakes and seismic hazard.
Susanne Sargeant Seismic hazard and NERC Knowledge Exchange Fellow.
Margarita Segou Earthquake forecasting and improving understanding of earthquake triggering mechanisms.

26
Appendix 2 Publications
Baptie, B., & Luckett, R. (2019). Seismicity induced by hydraulic fracturing operations at Preston New Road, Lancashire, 2018. Proceedings of the Society for Earthquake and Civil Engineering Dynamics Conference 2019.
Baptie, B., Luckett, R., Butcher, A. & Werner, M.J. (2020). Robust relationships for magnitude conversion of PNR seismicity catalogues. British Geological Survey Open Report, CR/20/033.
Butcher, A., Luckett, R., Kendall, J.-M. & Baptie, B. (2020). Seismic Magnitudes, Corner Frequencies and Microseismicity: Using Ambient Noise to Correct for High-Frequency Attenuation. Geophysical Journal International
Cremen, G., Werner, M.J. & Baptie, B. (2020). A New Procedure for Evaluating Ground‐Motion Models, with Application to Hydraulic‐Fracture‐Induced Seismicity in the United Kingdom. Bulletin of the Seismological Society of America, doi: https://doi.org/10.1785/0120190238
Hicks, S.P., Verdon, J., Baptie, B., Luckett, R., Mildon, Z.K. & Gernon T. (2019). A shallow earthquake swarm close to hydrocarbon activities: discriminating between natural and induced causes for the 2018–19 Surrey, UK earthquake sequence. Seismological Research Letters.
Mancini, S., Segou, M., Werner, M.J. & Baptie, B.J. (2019). Statistical Modelling of the Preston New Road Seismicity: Towards Probabilistic Forecasting Tools. British Geological Survey Commissioned Report, CR/19/068.
Mancini, S., Werner, M.J., Baptie, B.J. & Segou, M. (2020). Statistical Modelling and Forecasting of the Preston New Road Seismicity. British Geological Survey Commissioned Report, CR/20/032.
Mosca, I., Baptie, B., Villani, M., Lubkowski, Z. & Courtney, T. (2019). Objective quantification of the seismic source model for nuclear sites. Proceedings of the Society for Earthquake and Civil Engineering Dynamics Conference 2019.
Mosca, I., Sargeant, S., Baptie, B., Musson, R. & Pharaoh, T. (2019). Revising the seismic hazard maps for the UK. Proceedings of the Society for Earthquake and Civil Engineering Dynamics Conference 2019.

27
Appendix 3 Publication Summaries
Seismicity induced by hydraulic fracturing operations at Preston New Road, Lancashire, 2018
B. Baptie and R. Luckett
Abstract: Hydraulic fracturing of an unconventional shale reservoir in northwest England began in October 2018, over seven years after induced seismicity related to the first such operations in the UK resulted in a moratorium. A dense network of surface sensors was installed to monitor any induced seismicity, partly in order to comply with regulatory requirements. We use a combination of conventional, energy transient detection algorithms along with template matching to detect seismic events with magnitudes as low as -1.8 ML using only surface sensors. We also show that the detected seismicity is strongly clustered in space and time, and is closely associated with periods of injection, with only small numbers of “trailing” events. Despite relatively small injected volumes of less than 500 m3 a number of events exceeded the magnitude limit of 0.5 ML that is set by current regulations and requires operators to temporarily stop injection. We use a bootstrap approach to better quantify magnitude uncertainty, finding that the 95% confidence limits in the mean magnitudes for each event are at least ±0.1 ML. This may create a considerable problem for both operators and regulators for events that are close the 0.5 ML threshold. Finally, we find that the magnitude of completeness for events detected in near real-time without template matching is close to the 0.0 ML amber light threshold, which further highlights the problem of reliable characterisation of induced seismicity during operations using surface monitoring networks.
Robust relationships for magnitude conversion of PNR seismicity catalogues
B. Baptie, R. Luckett, A. Butcher and M.J. Werner
In this study we analyse the magnitude estimates from the seismicity catalogues recorded during hydraulic fracturing operations in the PNR-1z and PNR-2 wells in 2018 and 2019, in order to understand the limitations of the different magnitude estimates and to develop robust relationships between the local magnitudes in the catalogue of events recorded by the surface network and the moment magnitudes in the catalogue of events recorded by the downhole geophone arrays. Such relationships are essential to avoid incorrect or biased estimates of seismicity rates and recurrence parameters that describe the exponential frequency magnitude relationship between the number of events and the magnitude of those events.
We compare the moment magnitudes (Mw) for a subset of events in the PNR-1z and PNR-2 downhole catalogues with local magnitudes (ML) calculated from surface recordings and find that the moment magnitudes from the PNR-1z and PNR-2 catalogues are not consistent, each having a different relationship with the surface local magnitudes. We also find that referencing the ML-Mw data against an existing relationship between surface Mw and ML shows that downhole Mw values are significantly less than the expected value of Mw at the surface. This discrepancy is greater for PNR-1z than for PNR-2.
This issue may be explained in part by differences in the downhole data acquisition between PNR-1z and PNR-2 as well as possible limitations of the downhole instrumentation. Such dependence of Mw on recording instruments is undesirable and we recommend that in future operators should assess the impact of this issue and provide instrument calibration data.
Additionally, we find that moment magnitudes calculated from surface recordings of events during operations in PNR-1z are greater than the moment magnitudes of the same events determined from the downhole data. The surface moment magnitudes also broadly agree with those expected using a number of different empirical relationships between ML and Mw. Again, this finding may be a result of the limitations of the downhole data, however, it may also reflect differences in the method and parameters used to calculate the moment magnitudes using surface and downhole data as this can also result in significant differences in the resulting magnitudes values. We recommend that the method and parameters used to calculate moment magnitude are made available for future operations.
While we find that the magnitudes in the surface catalogue are consistent and reliable, the small number of events recorded means that there is limited overlap between the surface and downhole catalogues, making it difficult to validate the downhole magnitudes and calculate reliable adjustment factors across a wider range of magnitudes. We recommend that denser surface networks or improved instrumentation are used to address this in future. This would also help address the limited completeness of the surface catalogues and ensure that all events around the amber light threshold of 0 ML are detected.

28
We correct the moment magnitudes in the downhole catalogues by referencing them to an existing relationship between surface Mw and ML. For PNR-1z this leads to an apparent increase in the activity rate calculated from the revised frequency magnitude distribution, along with a slight decrease in the b-value. For PNR-2, the correction has a stronger dependence on ML and results in a significant reduction in the b-value. If this is real, it suggests a change in the behaviour of the seismicity between PNR-1z and PNR-2.
A fuller understanding of these results will require calculation of Mw for the PNR-2 surface catalogue and Mw estimates for both the PNR-1z and PNR-2 downhole catalogues, as well as systematic analysis of the waveform data to understand its limitations.
Seismic Magnitudes, Corner Frequencies and Microseismicity: Using Ambient Noise to Correct for High-Frequency Attenuation.
A. Butcher, R. Luckett, J.-M. Kendall and B. Baptie.
Over recent years a greater importance has been attached to low magnitude events, with increasing use of the subsurface for industrial activities such as hydraulic fracturing and enhanced geothermal schemes. Magnitude distributions and earthquake source properties are critical inputs when managing the associated seismic risk of these activities, yet inconsistencies and discrepancies are commonly observed with microseismic activity (M<2). This in part is due to their impulse response being controlled by the medium, as opposed to the source. Here an approach for estimating the high-frequency amplitude decay
parameter from the spectral decay of ambient seismic noise (𝜅0_𝑛𝑜𝑖𝑠𝑒) is developed. The estimate does not
require a pre-existing seismic catalogue and is independent of the source properties, so avoids some of the main limitations of earthquake-based methods. We then incorporate 𝜅0_𝑛𝑜𝑖𝑠𝑒 into the Brune (1970)
source model and calculate source properties and magnitude relationships for coal-mining related microseismic events, recorded near New Ollerton, UK. This generates rupture radii ranging approximately between 10-100m, which agrees with the findings of Verdon et al. (2018), and results in stress drops values between 0.1-10MPa. Calculating these properties without 𝜅0_𝑛𝑜𝑖𝑠𝑒 produces much higher rupture
radii of between 100-500m and significantly lower stress drops (~0.01 MPa). Finally, we find that the
combined 𝜅0-Brune model parameterised with these source property estimates accurately capture the ML-MW relationship at New Ollerton, and that stress drop heavily influences the gradient of this relationship.
A New Procedure for Evaluating Ground‐Motion Models, with Application to Hydraulic‐Fracture‐Induced Seismicity in the United Kingdom
G. Cremen, M.J. Werner & B. Baptie
An essential component of seismic hazard analysis is the prediction of ground shaking (and its
uncertainty), using ground‐motion models (GMMs). This article proposes a new method to evaluate (i.e., rank) the suitability of GMMs for modeling ground motions in a given region. The method leverages a statistical tool from sensitivity analysis to quantitatively compare predictions of a GMM with underlying observations. We demonstrate the performance of the proposed method relative to several other popular GMM ranking procedures and highlight its advantages, which include its intuitive scoring system and its ability to account for the hierarchical structure of GMMs. We use the proposed method to evaluate the applicability of several GMMs for modeling ground motions from induced earthquakes due to U.K. shale
gas development. The data consist of 195 recordings at hypocentral distances ( R) less than 10 km for 29
events with local magnitude (ML) greater than 0 that relate to 2018/2019 hydraulic‐fracture operations at the Preston New Road shale gas site in Lancashire and 192 R<10 km recordings for 48 ML>0 events induced—within the same geologic formation—by coal mining near New Ollerton, North Nottinghamshire. We examine: (1) the Akkar, Sandikkaya, and Bommer (2014) models for European seismicity; (2) the
Douglas et al. (2013) model for geothermal‐induced seismicity; and (3) the Atkinson (2015) model for central and eastern North America induced seismicity. We find the Douglas et al. (2013) model to be the
most suitable for almost all of the considered ground‐motion intensity measures. We modify this model by recomputing its coefficients in line with the observed data, to further improve its accuracy for future analyses of the seismic hazard of interest. This study both advances the state of the art in GMM evaluation and enhances understanding of the seismic hazard related to U.K. shale gas development.
A shallow earthquake swarm close to hydrocarbon activities: discriminating between natural and induced causes for the 2018–19 Surrey, UK earthquake sequence
S.P. Hicks, J. Verdon, B. Baptie and R. Luckett
Earthquakes induced by subsurface industrial activities are a globally emotive issue, with a growing catalogue of induced earthquake sequences. However, attempts at discriminating between natural and

29
induced causes, particularly for anomalously shallow seismicity, can be challenging. An earthquake swarm during 2018–19 in south-east England with a maximum magnitude of ML 3.2 received great public and media attention because of its proximity to operating oilfields. It is therefore vital and timely to provide a detailed characterisation of the earthquake sequence at present, and to decide based on current evidence, whether the earthquakes were likely natural or induced. We detected 129 earthquakes and computed detailed source parameters of these events. Most earthquakes occurred at a shallow depth of 2.3 km, >1 km deeper than the geological formations targeted by the oilfields, and laterally >3 km away from the drill-sites. We combine the east-west trending cluster of the seismicity with 2-D seismic reflection profiles to find the causative fault system for the earthquakes. A b-value close to unity and strike-slip faulting mechanisms are consistent with tectonic reactivation along a pre-existing fault. Overall, we find no indicators in the earthquake parameters that would strongly suggest an induced source. Nor do we find any clear trends between drilling activities and seismicity based on operational logs provided by the operators. Injected volumes are near-zero and monthly production amounts are many orders of magnitude smaller than other reported cases of extraction-induced seismicity. On balance, and based on the available evidence, we find it currently unlikely that nearby industrial activities induced the seismic swarm. Most likely, the Surrey earthquakes offer a uniquely detailed insight into shallow seismicity within sedimentary basins. Nevertheless, the way that activity reporting by operators themselves is regulated remains a controversial issue when discriminating between natural and induced seismicity for industrial methods that have not been expected to induce earthquakes.
Statistical Modelling of the Preston New Road Seismicity: Towards Probabilistic Forecasting Tools
S. Mancini, M. Segou, M.J. Werner and B.J. Baptie
The microseismic datasets collected at the well PNR-1z present globally unique opportunities to understand and model subsurface processes in response to hydraulic fracturing, including induced seismicity. The insights are likely to contribute to improved operations and risk mitigation strategies. The two magnitude scales used by the surface and the downhole networks present a challenge because they are difficult to reconcile. This implies that the standard extrapolation of seismicity rates observed at small magnitudes to the rates and chances of larger magnitudes, including those that might be felt or cause damage, is more uncertain than in the case of tectonic seismicity. We observe a b-value of the Gutenberg-Richter frequency magnitude distribution of about 1.5, which appears to be robustly larger than b-values of tectonic seismicity, notwithstanding issues with the magnitude scales. We estimate that the downhole catalogue is approximately complete down to a moment magnitude of -1. We adopted a precautionary maximum magnitude of 6.5 on the basis of the most likely tectonic maximum magnitude according to the most recent national seismic hazard map. A more context-specific assessment of maximum magnitude is difficult and was beyond the scope of this project.
The calibration of the statistical seismicity model highlighted similarities and differences between tectonic and induced seismicity. Several model parameters were similar to those found in tectonic applications, but some were substantially different. Similarities include clear evidence for temporal clustering of seismicity and the applicability of the Gutenberg-Richter distribution, as well as aspects of the seismic source parameters themselves. Differences include that the parameters suggest that the magnitude of an event has little effect on the number of subsequently triggered events, in clear contrast to the magnitude-dependent aftershock generation of tectonic earthquakes. In addition, we observed a more rapid decay of temporal clustering than is customary for tectonic sequences, which may indicate a more dominant role of fluids in the clustering characteristics of the microseismicity. We caution that we examined a relatively narrow range of magnitudes above the completeness magnitude of -1, and further work is needed to understand the robustness of these conclusions, ideally on an independent dataset.
The performance of the forecasts generated by the statistical model highlighted some successes and some discrepancies. In broad terms, the forecasts performed well during periods with moderate seismic response to hydraulic fracturing as well as in between stages and during the prolonged halt of operations in November 2018 during which the seismicity decayed slowly. On the other hand, the model frequently underpredicted the most seismically intense periods. Whether the current forecasts are good enough to be useful depends on the particular usage as well as other available predictive tools, and would require discussions with potential users.
We interpret the mixed performance of the forecasts as a result of features in the induced seismicity that are rare in natural seismicity. Specifically, events induced during fracturing do not appear to show the type of magnitude-dependent triggering and clustering observed in natural seismicity. Instead, we observe during these times a high rate of apparently unclustered seismicity. This feature is not currently built into the model.

30
Statistical Modelling and Forecasting of the Preston New Road Seismicity
S. Mancini, M.J Werner, B.J Baptie and M. Segou
The relationship between operational parameters and the seismic response of the geological medium to hydraulic fracturing is complicated and non-unique. Prior studies mostly concerned with waste-water injection have linked seismic moment release to injected volume. In the case of PNR, the released moment per unit injected volume varies dramatically between the wells and also between neighbouring hydraulic fracturing stages in the same well. We find that neither PNR well violates a popular upper bound for the moment release for a given injected volume (the so-called McGarr relationship), but the observed
magnitude distribution is also consistent with a much higher bound thought to apply in the UK’s tectonic
setting. The relationship between earthquake counts and injected volume is also non-unique and variable, but the variability is smaller than in the case of seismic moment release. We observe no obvious temporal trend of the seismic response with time. Despite the scatter in the relationship between earthquake count and injected volume, we find that increased seismicity rates tend to be associated with greater volumes (although large volumes can also generate little seismic response), while smaller volumes are associated with lower seismic rates.
Motivated by this finding, we modify a model used for forecasting tectonic clustered seismicity, the Epidemic Type Aftershock Sequence (ETAS) model. Specifically, our modification to the standard ETAS formulation involves a background seismicity rate that is proportional to the injection rate and that
simulates the external ‘forcing rate’ due to the pumping of pressurised fluid. We estimate both well-specific
and sleeve-specific constants of proportionality between seismicity and injection rate from both wells. Using ETAS parameters previously obtained from PNR-1z, we conduct multiple probabilistic forecast experiments on both PNR-1z and PNR-2 to assess the predictive skill of this modified ETAS model class.
We find that the modified ETAS model provides better earthquake rate forecasts than the standard model. In particular, the modified ETAS model can capture high rates due to injection periods. This is based on the assumption that the background and injection rates are correlated, that the injection rate is known in advance and that either the well-specific average seismic response or the sleeve-specific seismic response is known. These are best-case scenarios for forecasting, but they enable the estimation of a constant of proportionality between the background earthquake rate and the injection rate using real-time data.
We also conduct an out-of-sample forecast experiment, in which the modified ETAS model is calibrated on PNR-1z, applied and then evaluated using PNR-2 data. While the model does not perform as well as the PNR-2-specific models, as expected, its estimates are substantially more informative than the standard model, even in periods of high rates. This provides evidence that injection-rate driven ETAS models can contribute to useful probabilistic forecasts in future shale gas developments.
Objective quantification of the seismic source model for nuclear sites
I. Mosca, B. Baptie, M. Villani, Z. Lubkowski and T. Courtney
The UK is a relatively low seismicity region and therefore seismic design is applied only to high consequence facilities, e.g. nuclear power plants. Knowledge of the tectonic structures beneath the UK is limited and the earthquake catalogue covers a relatively short history compared to the geological history. In this context, the definition of the seismic source model and its uncertainties is critical. In the current practice of a probabilistic seismic hazard assessment (PSHA) in the nuclear industry, expert judgement is often adopted to determine some source model parameters, e.g. location of source zones boundaries or maximum magnitude associated with the sources, which introduces some degree of subjectivity. The development of a robust seismic source zone model for PSHA and a comprehensive characterization of its uncertainties will benefit both seismic hazard assessments and seismic design in the nuclear industry. We develop statistical tools for a fully non-linear method for characterising the source zone model used for PSHA using the Metropolis-Hastings Algorithm and Bayesian inference. This approach will allow us to: 1) sample the potential models compatible with the data; 2) capture multiple sources of uncertainties in the source zone model used for the PSHA; and 3) model the key components of the source zone model jointly rather than individually. We apply this approach to the Wylfa Newydd nuclear site (Anglesey), one of the proposed sites for new nuclear power plants in the UK, and benchmark our results using the PSHA developed for this site by Arup for Horizon Nuclear Power.
Revising the seismic hazard maps for the UK
I. Mosca, S. Sargeant, B. Baptie, R. Musson & T. Pharaoh

31
The last seismic hazard maps for the UK were produced by Musson and Sargeant in 2007. Since then, significant advances in probabilistic seismic hazard assessment methodology have been made, particularly in the way that ground motion is characterised. As a result, there is a strong argument for revising the seismic hazard maps for the UK. Here, we present the revised maps. They have been developed using a modified version of the source model used in the SHARE (Seismic Hazard Harmonization in Europe) project and an updated earthquake catalogue. The main difference between this work and that of Musson and Sargeant (2007) is how ground motion, and its uncertainty, are modelled. Musson and Sargeant (2007) used two published ground motion equations that were equally weighted. In this work, two different ground motion models were considered and tested: a traditional logic tree approach using multiple GMPEs and the backbone approach, with a single GMPE scaled over different branches of a logic tree. We adopt a partially non-ergodic sigma model following the approach taken in the most recent probabilistic seismic hazard assessments for nuclear sites in the UK. We present the results as maps for return periods of 95, 475, and 2475 years for peak ground acceleration (PGA) and spectral acceleration at 0.2 and 1.0 s with 5% damping.