Earthquake Building Vulnerability and Damage Assessment...
127
Earthquake Building Vulnerability and Damage Assessment with reference to Sikkim Earthquake, 2011 VENKATA PURNA TEJA MALLADI MARCH, 2012 SUPERVISORS: Dr. P.K. Champati Ray (IIRS) Mr. B. D. Bharath (IIRS) Drs. M. C. J. Damen (ITC) Drs. N. C. Kingma (ITC)
Transcript of Earthquake Building Vulnerability and Damage Assessment...

Earthquake Building Vulnerabilityand Damage Assessment withreference to Sikkim Earthquake,2011
VENKATA PURNA TEJA MALLADIMARCH, 2012
SUPERVISORS:Dr. P.K. Champati Ray (IIRS)Mr. B. D. Bharath (IIRS)Drs. M. C. J. Damen (ITC)Drs. N. C. Kingma (ITC)


Thesis submitted to the Faculty of Geo-Information Science and EarthObservation of the University of Twente in partial fulfilment of therequirements for the degree of Master of Science in Geo-information Scienceand Earth Observation.Specialization: Natural Hazards and Disaster Risk Management
IIRS SUPERVISORS:Dr. P.K. Champati RayMr. B. D. Bharath
ITC SUPERVISORS:Drs. M. C. J. DamenDrs. N. C. Kingma
THESIS ASSESSMENT BOARD:Prof. Dr. Alfred Stein (Chair)Prof. Dr. V.G. JettenProf. Dr. Chandan Ghosh (External Examiner, NIDM)
Earthquake Building Vulnerabilityand Damage Assessment withreference to Sikkim Earthquake,2011
VENKATA PURNA TEJA MALLADIDehradun, India, March, 2012

DISCLAIMERThis document describes work undertaken as part of a programme of study at the Indian Institute of Remote Sensing ofIndian Space Research Organisation, Department of Space, Government of India and the Faculty of Geo-InformationScience and Earth Observation of the University of Twente. All views and opinions expressed therein remain the soleresponsibility of the author, and do not necessarily represent those of the Faculty.

dedicated to my brother


i
ABSTRACT
About 59% (M > 5) which makes it one ofhighest seismic risk prone areas in the world. Destructive earthquakes (M > 6.5), which are highly
horities ignore the importance of theearthquake resistant building design, disaster preparedness and post disaster management. Damage andvulnerability assessment of a city is very important and provides the probable amount of damage to thesettlement due to potential earthquake hazard. The damage scenarios can act as the base for preparation ofdisaster management plans, taking mitigation measures and prepare population living in the highvulnerable areas.
HAZUS methodology, developed for US using GIS as platform, is used for assessing vulnerability anddamage caused by the 18th September 2011earthquake at Gangtok (68 km from the epicentre) which is thecapital city of state of Sikkim, a major hub for tourism and economy. The creation of databases withdetailed information on buildings is the important task that has to be carried out before using the tool forgeneration of damage scenarios for reference earthquake. The scale and the details of the results aredirectly based on the amount of information used in the execution of methodology. For the vulnerabilityand damage assessment, the methodology requires parameters like, magnitude and type of earthquake,distance from epicentre to the study area, geology and local conditions of soil etc, and buildingcharacteristics. To achieve the defined objectives, research work was divided into three stages, Pre-field,Field work and Post field work. Collection of literature regarding HAZUS methodology, collection of fielddata, GIS database organisation, damage assessment and validation with the actual damage data andobservation are some of the important activities carried out in different stages. The identification ofbuilding types and the damage to the buildings were done in the field by rapid visual screening procedure.Based on the methodology, expected damage to the identified building categories are given in the form ofcharts and figures for various ground shaking scenarios. Damages reported by the local authorities wereused as the reference to validate the generated results and discuss the applicability of the method in Indiancontext. Based on the terrain conditions, the possible hazard zones, elements at risk and risk map werealso generated.
The reasons for damage and the failure of structure were discussed and possible methods for retrofittingand improving future constructions have been recommended. The results showed that concrete types ofbuildings were highly vulnerable and there is a high probability of slight damage to such buildings. Thesescenarios were matched with the reported damage. So it is concluded that the HAZUS methodology canbe used in Indian condition as HAZUS building types have some similarity with Indian building types.However, the drawback of using such method is that the capacity curves and vulnerability functions givenin HAZUS have been derived for building types in the US, which may differ from the other parts of theworld. Therefore, it is concluded that Indian building structural parameters, which are currentlyunavailable, should be developed and used for generating more realistic damage scenarios using suchmethodology.
Keywords: Earthquake, Building Vulnerability, HAZUS, Gangtok

ii
ACKNOWLEDGEMENTS
I take this opportunity to thank Indian Institute of Remote Sensing, Dehradun, India and InternationalInstitute of Geo-information Science and Earth Observation, Enschede, The Netherlands, for their jointeducation M.Sc programme.
I sincerely thank all my supervisors Dr. P. K. Champati Ray, Head, Geo Sciences and Geo- HazardDivision (GSGHD), Mr. B.D. Bharath, Urban and Regional Studies Division (URSD) from IndianInstitute of Remote Sensing, Drs. Michiel C. J. Damen and Drs Nanette. C. Kingma, Earth SystemsAnalysis Department, ITC, The Netherlands, for constant support and priceless guidance through out myresearch and course work.
I would like to express my heartfelt gratitude to Dr. P. K. Champati Ray for his valuable discussions,critical suggestions, encouragement, ever spirited advice, invaluable guidance, support throughout my stayin the Geo-sciences and Geo Hazard Department.
I sincerely thank Dr. P. S. Roy, Director, IIRS allowing me to pursue and for providing all the facilities forsuccessful completion of this research. I thank Dr. V.G. Jetten, Head, ESA Department, ITC, Dr. D.G.Rossiter, Faculty ITC, Prof. B. S. Sokhi, Head, URSD, IIRS, for their advice and suggestion through outmy research.
I specially thank Prof. Dr. Chandan Ghosh, NIDM for his all his contacts, guidance, literature andsupport in my field work. I am thankful to Dr. D.K. Paul, Head Earthquake Engineering Department, andMs. Putul Haldar, Research Associate, IIT, Roorkee for their guidance and help and providing me relevantliterature regarding structural design and structural parameters.
I am extremely grateful to Mr. Naveen Rai, Town Planner, for sharing data, and support during field.Special thanks to Mr. Anjan Mohanty, IFS, Conservator of Forest for valuable advice and logisticsarrangements. I am also thankful to Mr. Siddarth Rasaily, Town Planner, Dr. Sandeep Thambe, Spl.Secretary, Rural Development Department, Mr. Ashok Kumar, NIDM, Mr. Keshar Kumar Luitel, MinesMineral and Geology Department, for providing me all the data and insightful suggestions during my fieldwork.
I thank my entire Faculty in IIRS and ITC for providing me all the support, and any my friends formaking my stay in Dehradun and Enschede memorable and fun. I am thankful to Mr. Prasun KumarGupta for all the support, motivation and fun times, and I specially thank Dr. Vaibhav Garg, WRD, Dr.Ajanta Gowami, GDGHD, Mr. Pradeep, JRF, GSGHD, Mr. Ashish Dhiman, for all the motivation andsupport.
I thank all my course mates Abhijeet Kumar Parmar, Ankit Rawat, Chittaranjan Singh and my fellow batchmates Gourav Misra, Priyanka Sharma, Surya Ganguly, Rakesh Sarmah , Suruchi Aggarwal, Pratik Rajput,Rahul Sahu, Jai Singh Sisodia, and most awesome Suranjana Bhaswathi Borah for all the good times.
I sincerely thank Computer Maintenance Department (CMA) for taking care of all the system andsoftware needs. I thank mess workers for great hospitality in the last one and half years in IIRS .
Teja Malladi

iii
TABLE OF CONTENTS1. Introduction...........................................................................................................................................................1
1.1. Earthquakes..................................................................................................................................................................11.1.1. Earthquake and India ...............................................................................................................................11.1.2. Sikkim Earthquake....................................................................................................................................21.2. Earthquake and Buildings Indian Context .........................................................................................................51.2.1. Materials and Method of Construction .................................................................................................51.3. Motivation and Problem Statement........................................................................................................................61.4. Main Research Objectives..........................................................................................................................................71.4.1. Sub Research Objectives and Related Research Questions ...............................................................71.5. Research Limitations...................................................................................................................................................81.6. Organisation of the Thesis.........................................................................................................................................8
2. Literature Review..................................................................................................................................................92.1. Indian Building Types.................................................................................................................................................92.1.1. C3 Building Type ....................................................................................................................................112.1.2. W1 building Type....................................................................................................................................112.1.3. Seismic Design Level in Buildings........................................................................................................122.2. Vulnerability and Factors affecting building vulnerability. .............................................................................. 122.2.1. Strength of structure and Seismic design requirement. ....................................................................12
2.2.1.1. Structural Elements of building. ...............................................................................................132.2.2. Function of building...............................................................................................................................132.2.3. Material and Method of construction..................................................................................................132.2.4. Height of the building ............................................................................................................................142.2.5. Shape of buildings...................................................................................................................................142.2.6. Building Codes ........................................................................................................................................152.3. HAZUS Methodology............................................................................................................................................. 162.3.1. Deterministic Seismic Hazard Analysis ...............................................................................................17
2.3.1.1. Generation of Demand Spectrum ............................................................................................172.3.2. Development of Building Damage Functions ...................................................................................18
2.3.2.1. Capacity Curve.............................................................................................................................182.3.3. Discrete Damage Probabilities..............................................................................................................20
3. Methodology and Database Organisation .....................................................................................................233.1. Introduction .............................................................................................................................................................. 233.2. Pre- field stage........................................................................................................................................................... 243.3. Field Work................................................................................................................................................................. 253.4. Post Field Work........................................................................................................................................................ 263.5. Database Preperation............................................................................................................................................... 273.5.1. Preparation of Satellite Imagery............................................................................................................273.5.2. Homogenous Area Mapping.................................................................................................................29
4. Study Area............................................................................................................................................................304.1. Introduction .............................................................................................................................................................. 304.2. Geographical Location and Area........................................................................................................................... 314.3. Geology and Soil ...................................................................................................................................................... 314.4. Topograpghy ............................................................................................................................................................. 324.5. Land Stability............................................................................................................................................................. 354.6. Population and Household.................................................................................................................................... 364.7. Building Distribution ............................................................................................................................................... 394.8. Land-Use/ Land-Cover Distribution.................................................................................................................... 404.9. The Sikkim Building Regulation Act 1991........................................................................................................... 404.10. Description of Study Ward..................................................................................................................................... 41

iv
4.10.1.Identified Building types........................................................................................................................414.10.1.1. Traditional houses - Ekra houses.........................................................................................424.10.1.2. Asbestos - temporary structures...........................................................................................424.10.1.3. Un -reinforced Masonry Structures. ...................................................................................424.10.1.4. Low-rise Concrete frame structures ....................................................................................434.10.1.5. Mid -rise Concrete frame structures ....................................................................................434.10.1.6. High -rise Concrete frame structures ..................................................................................44
5. Damage Assessment and Remedial Measures ...............................................................................................495.1. Introduction .............................................................................................................................................................. 495.2. Damage assessment at Macro Level ..................................................................................................................... 495.3. Damage Assessment at Micro Level ..................................................................................................................... 535.4. Damage in Buildings................................................................................................................................................ 545.5. Site - 1......................................................................................................................................................................... 555.6. Site - 2......................................................................................................................................................................... 575.7. Site - 3......................................................................................................................................................................... 585.8. Site - 4......................................................................................................................................................................... 595.9. Site - 5......................................................................................................................................................................... 615.10. Repair and Retrofitting............................................................................................................................................ 625.10.1.Damages in Masonry Walls...................................................................................................................625.10.2.Damages in Structural Systems.............................................................................................................635.10.3.Construction on Sloping Sites. .............................................................................................................65
6. Analysis and Results...........................................................................................................................................676.1. Demand Spectrum ................................................................................................................................................... 696.2. Capacity curves ......................................................................................................................................................... 706.3. Peak Building Response .......................................................................................................................................... 71
6.3.1.1. Peak Building Response at shear wave velocities 760 m/s and 1125 m/s ........................736.4. Damage probabilities ............................................................................................................................................... 756.5. Validation................................................................................................................................................................... 816.6. Damage in Chungthang Area................................................................................................................................ 856.7. Risk Zonation............................................................................................................................................................ 88
7. Conclusions and Recommendations ..............................................................................................................947.1. Conclusion................................................................................................................................................................. 947.2. Recommendations.................................................................................................................................................... 957.2.1. Recommendations for Gangtok City ..................................................................................................957.2.2. Recommendations for further research. .............................................................................................96
List of references .........................................................................................................................................................97Annexure A.............................................................................................................................................................100Annexure B.............................................................................................................................................................110

v
LIST OF FIGURESFigure 1-1 Seismic Zones of India..............................................................................................................................2Figure 1-2 Sikkim earthquake: location of epicentre and intensities as felt across the region ..........................3Figure 1-3 Main Boundary Thrust (MBT) and major earthquakes of the region ..............................................3Figure 1-4 Sikkim Map showing Districts and Location of Epicentre and Gangtok .........................................4Figure 2-1 Rules to be followed in construction practices....................................................................................13Figure 2-2 Stiffness of building .................................................................................................................................14Figure 2-3 Simple rules to be followed in shapes of Plans and Elevations ........................................................15Figure 2-4 Figure showing insufficient gap and Pounding effects in Plan and Elevation..............................15Figure 2-5 HAZUS Methodology.............................................................................................................................16Figure 2-6 Deformation of building due to lateral forces .....................................................................................18Figure 2-7 Capacity Curve showing Yield and Ultimate Capacity points...........................................................19Figure 2-8 Capacity Spectra vs. Demand Spectra...................................................................................................19Figure 2-9 Capacity Spectrum Method showing the level of Damage................................................................20Figure 3-1 Methodology Flow-Chart........................................................................................................................23Figure 3-2 Cartosat-2 2011.........................................................................................................................................27Figure 3-3 Cartosat-1 2007.........................................................................................................................................28Figure 3-4 Cartosat-1 2011 ..................................................................................................................................28Figure 3-5 Geoeye ...................................................................................................................................28Figure 3-6 Digitisation of Buildings on Geoeye image..........................................................................................29Figure 4-1 Gangtok Location and Municipal Ward Boundary.............................................................................30Figure 4-2 Geology Map of Gangtok .....................................................................................................................31Figure 4-3 Panoramic View of Gangtok and growth along its Ridge Line along N-S direction ....................32Figure 4-4 Sections through Gangtok Ridge showing its gentler western slope ...............................................32Figure 4-5 Contour Map and Digital Elevation Model showing its gentler western slope .............................33Figure 4-6 Aspect and Slope Map showing its gentler western slope ................................................................34Figure 4-7 Land Stability Map ...................................................................................................................................35Figure 4-8 Ward level population density map .......................................................................................................37Figure 4-9 Building Density Map..............................................................................................................................38Figure 4-10 Mid-rise Concrete Frame Building Types in Arithang Ward ..........................................................39Figure 4-11 Building Distribution and Road Network..........................................................................................39Figure 4-12 Location of Arithang Ward .................................................................................................................41Figure 4-13 Ekra Traditional Building Types in Arithang Ward ......................................................................42Figure 4-14 Asbestos Building Types in Arithang Ward.......................................................................................42Figure 4-15 Un-reinforced Masonry Building Types in Arithang Ward............................................................43Figure 4-16 Mid-rise Concrete Frame Building Types in Arithang Ward ..........................................................43Figure 4-17 Mid-rise Concrete Frame Building Types in Arithang Ward ..........................................................44Figure 4-18 High-rise Concrete Frame Building Type in Arithang Ward..........................................................44Figure 4-19 Building Material used in Arithang Ward buildings..........................................................................45Figure 4-20 Number of Floors in Arithang Ward..................................................................................................45Figure 4-21 Building Ownership in Arithang Ward ............................................................................................46Figure 4-22 Building Use in Arithang Ward............................................................................................................47Figure 4-23 Building Density Map in Arithang Ward............................................................................................47Figure 4-24 Degree Slope Map.................................................................................................................................48Figure 5-1 Sikkim Map showing areas visited during field and location of Epicentre .....................................49Figure 5-2 Sattelite Images showing chunthang and new landslides post earthquake .....................................50

vi
Figure 5-3 Figure Showing the chunthang area and new landsides ....................................................................50Figure 5-4 Figure Showing the damaged building in Chunthang ........................................................................51Figure 5-5 River Terraces and Settlements ............................................................................................................51Figure 5-6 Figure Showing the chunthang area and new landsides ....................................................................52Figure 5-7 Road damaged by landslides...................................................................................................................52Figure 5-8 Identified buildings in Gangtok city .....................................................................................................54Figure 5-9 Damages observed in Gangtok City .....................................................................................................55Figure 5-10 Damages in Secretariat Building..........................................................................................................56Figure 5-11 Damaged buildings in Development area ward ................................................................................57Figure 5-12 Damages in Police Head quarters Building .......................................................................................58Figure 5-13 Damages in Hotel Building ..................................................................................................................60Figure 5-14 Damages in Government College Building .......................................................................................61Figure 5-15 Unreinforced Masonry infill's ..............................................................................................................62Figure 5-16 Damages in Unreinforced Masonry infill's ........................................................................................63Figure 5-17 Details of Bracing for Masonry Walls ................................................................................................63Figure 5-18 Reinforcement failures ..........................................................................................................................64Figure 5-19 Connection between Structural Systems............................................................................................64Figure 5-20 Absence of shear walls ..........................................................................................................................64Figure 5-21 Vertical Bracing Systems .....................................................................................................................65Figure 5-22 Failure of Slope ......................................................................................................................................65Figure 5-23 Stabilisation of Slope .............................................................................................................................66Figure 5-24 Foundations ............................................................................................................................................66Figure 6-1 Classified HAZUS building types in Arithang ward ..........................................................................68Figure 6-2 Bye-Laws Violation (Height) followed in Arithang Ward.................................................................68Figure 6-3 Demand Spectrum...................................................................................................................................69Figure 6-4 Capacity Curves for Low code Seismic Design ..................................................................................70Figure 6-5 Capacity Curves for Pre code Seismic Design ....................................................................................70Figure 6-6 Demand and Capacity Curves for Low code Seismic Design ..........................................................71Figure 6-7 Demand and Capacity Curves for Pre code Seismic Design ............................................................72Figure 6-8 Peak Building Response Low code Seismic Design..........................................................................72Figure 6-9 Peak Building Response Pre code Seismic Design.............................................................................73Figure 6-10 Peak Building Response at 1125 m/s.................................................................................................74Figure 6-11 Peak Building Response at 1125 m/s.................................................................................................74Figure 6-12 Percentage damage probabilities pre code seismic design level .....................................................75Figure 6-13 Percentage damage probabilities low code seismic design level.....................................................76Figure 6-14 Graph showing number of predicted damaged in Arithang Ward at 1125 m/s ........................78Figure 6-15 Number of predicted damaged in Arithang Ward at 1125 m/s.....................................................78Figure 6-16 Graph showing Number of predicted damaged in Arithang Ward at 760 m/s .........................79Figure 6-17 Number of predicted damaged pre code seismic buildings in Arithang Ward at 760 m/s .......80Figure 6-18 Predicted privately owned damaged buildings in Arithang Ward at..............................................82Figure 6-19 Predicted privately owned damaged buildings in Arithang Ward at 760 m/s .............................82Figure 6-20 Actual damage reported in Gangtok Area .........................................................................................83Figure 6-21 Number of reported damaged buildings of private ownership in Gangtok.................................84Figure 6-22 Number of actual reported damaged buildings and predicted building damage at.....................85Figure 6-23 Demand and capacity curves for pre code seismic design ..............................................................86Figure 6-24 Percentage damage probabilities for pre code seismic design........................................................87Figure 6-25 Damaged buildings in Chunthang Area .............................................................................................88

vii
Figure 6-26 Buildings constructed on Unstable slope Areas with High Building Density ..............................89Figure 6-27 Risk Map of Gangtok ............................................................................................................................92Figure 6-28 Identified damaged buildings on Risk Map .......................................................................................93

viii
LIST OF TABLES
Table 1-1 Seismic Zones and Associated Intensity................................................................................................. 1Table 1-2 IMD and USGS Earthquake Parameters................................................................................................. 2Table 1-3 Reported Aftershocks Date, Time and Magnitude ................................................................................ 5Table 1-4 Number of Houses and Level of expected Damage ............................................................................. 6Table 2-1 Indian Building Types and their respective HAZUS building types.................................................10Table 2-2 Advantages and Disadvantages of Flexible and Stiff Structures........................................................12Table 2-3 Suitable building material for different kind of Construction ............................................................14Table 2-4 Natural frequency of buildings................................................................................................................14Table 2-5 List of Indian Standard Codes.................................................................................................................16Table 2-6 NEHRP Site Classes .................................................................................................................................17Table 2-7 Code building Capacity Curves ...............................................................................................................20Table 2-8 Structural Fragility Curve Parameters ....................................................................................................21Table 2-9 Discrete Damage Probabilities ................................................................................................................21Table 2-10 Damage states of C3 building type.......................................................................................................22Table 2-11Damage states of W1 building type.......................................................................................................22Table 3-1 List of the Satellite Imagery Used...........................................................................................................24Table 3-2 Data collected before Field Visit ............................................................................................................24Table 3-3 Questionnaire prepared for Field Survey ..............................................................................................25Table 3-4 List of Maps Collected during field work..............................................................................................26Table 3-5 Generated Results and Input Provided..................................................................................................26Table 4-1 Factors - Land stability map ....................................................................................................................35Table 4-2 Permissible Number of Floors ................................................................................................................35Table 4-3 Gangtok Population Data ........................................................................................................................36Table 4-4 Gangtok Ward Population, Area and Density......................................................................................36Table 4-5 Number of Households and growth rate ..............................................................................................37Table 4-6 Number of Households at ward level ....................................................................................................38Table 4-7 Land- use classification and area.............................................................................................................40Table 4-8 Permissible Built-up-Area and Set backs...............................................................................................40Table 4-9 Building Details..........................................................................................................................................46Table 5-1 Damage Report at Ward level according to building type ..................................................................53Table 6-1 Number of buildings in each HAZUS class of Arithang ward..........................................................67Table 6-2 Number of buildings following Byelaws ...............................................................................................67Table 6-3 PGA experienced at different Shear wave velocity..............................................................................69Table 6-4 Peak Building Response for Low code Seismic Design......................................................................72Table 6-5 Peak Building Response Pre code Seismic Design ..............................................................................73Table 6-6 Peak Building Response at 1125 m/s.....................................................................................................73Table 6-7 Peak Building Response at 760 m/s.......................................................................................................74Table 6-8 Cumulative Damage Probabilities Pre code at 1125 m/s................................................................77Table 6-9 Discrete Damage Probabilities Pre code at 1125 m/s .....................................................................77Table 6-10 Cumulative Damage Probabilities Pre code at 760 m/s................................................................77Table 6-11 Discrete Damage Probabilities Pre code at 760 m/s .....................................................................77Table 6-12 Percentage of Damage Pre code at 1125 m/s.................................................................................77Table 6-13 Number of predicted damaged pre code seismic buildings in Arithang Ward at 1125 m/s.......78Table 6-14 Percentage of Damage Pre code at 760 m/s...................................................................................79

ix
Table 6-15 Number of predicted damaged pre code seismic buildings in Arithang Ward at 760 m/s .........79Table 6-16 Number of private owned buildings in each HAZUS class in Arithang ward. .............................81Table 6-17 Number of buildings according to construction material .................................................................81Table 6-18 Number of predicted privately owned damaged buildings in Arithang Ward at 1125 m/s ........82Table 6-19 Number of predicted privately owned damaged buildings in Arithang Ward at 760 m/s..........82Table 6-20 Number of actual reported damaged buildings of private ownership in Arithang Ward ............83Table 6-21 Number of reported damaged buildings of private ownership in Gangtok .................................84Table 6-22 Predicted Percentage of Damage Pre code at 760 m/s ................................................................84Table 6-23 Number of actual reported damaged buildings and predicted building damage at 760 m/s. .....85Table 6-24 Peak building response for pre code seismic design at 270 m/s for Chunthang area..................86Table 6-25 Cumulative damage probabilities Pre code at 270 m/s for Chunthang Area ............................86Table 6-26 Discrete damage probabilities Pre code at 270 m/s for Chunthang Area..................................86Table 6-27 Percentage damage probabilities Pre code at 270 m/s for Chunthang Area .............................87Table 6-28 Rating for pair wise comparison ..........................................................................................................90Table 6-29 Pair wise comparison Matrix..............................................................................................................90Table 6-30 Normalized Weights and Individual class rating ................................................................................90


EARTHQUAKE BUILDING VULNERABILITY AND DAMAGE ASSESSMENT, SIKKIM EARTHQUAKE, 2011
1
1. INTRODUCTION
1.1. Earthquakes
Earthquakes are one of the most dangerous, destructive and unpredictable natural hazards, which canleave everything up to a few hundred kilometres in complete destruction in seconds. In more than 300natural disasters in year 2011, over 30,000 people lostTsunami in March 2011) and 206 million people were affected and $366 billion were the economic losses,which made it the costliest year in the history of the catastrophes (EM-DAT, 2011). The number ofdisasters and number of deaths were less compared to the year 2010, where the Haiti earthquake event inJanuary 2010 alone claimed deaths of nearly 220,000. EM-DAT (2011) reports indicate that theearthquakes in the developed countries would result higher economic losses and more number of deathsin developing countries. In developing countries due to economic conditions people are forced to live inhigh vulnerable locations and people have invested so much money for construction, and post disastermoving to safer locations is not an option as they cannot abandon their present houses.
Therefore, a paradigm shift is required in earthquake risk mitigation and the first step in this direction isrisk and vulnerability assessment using a recently occurred earthquake which will draw home the point toboth decision makers as well as affected population.
1.1.1. Earthquake and India
India has enough experiences with earthquakes and the kind of damage that they can leave behind withinseconds and it is not rare or unusual anymore. About 59earthquakes which makes it one of highest seismic risk prone areas in the world (BMTPC, 2006). Morethan 25,000 people died in 8 major earthquakes during last 20 years and the last major earthquake in Indiawas a decade earlier in Bhuj, Gujarat, which occurred on 26th January 2001 and claimed over 14,000 livesand caused severe damage to buildings and infrastructure resulting high economic losses (Arya, 2000;Ghosh, 2008; NDMA, 2011). Due to the collision of Indian plate with the Eurasian plate, the Himalayanregion has emerged as one of the seismically active regions of world, resulting in many disastrousearthquakes in the past and recent times and North East India alone has emerged as one of the mostseismically active regions in the country (NDMA, 2011).
Many active faults, such as Himalayan Frontal Thrust, Main Boundary Thrust (MBT) and Main CentralThrust (MCT) exist in the region. Bureau of Indian Standards (BIS) and Indian MeteorologicalDepartment (IMD) with records of seismicity in past 100 years, and other scientific data, divided thecountry into four major seismic zones and the possible Modified Mercalli Intensity (MMI) is given inTable 1-1, corresponding to the seismic zones shown in Figure 1-1.
Table 1-1 Seismic Zones and Associated Intensity
Seismic Zone Possible MM Intensity Area in %II(Low) VI and below 41
III (Moderate) VII 31IV (Severe) VIII 17
V (Very Severe) IX and above 11

EARTHQUAKE BUILDING VULNERABILITY AND DAMAGE ASSESSMENT, SIKKIM EARTHQUAKE, 2011
2
Figure 1-1 Seismic Zones of India(BMTPC, 2006)
1.1.2. Sikkim EarthquakeAn earthquake of 6.9 magnitude with its epicentre near the India-Nepal border (27.70 N, 88.20 E) shookthe northeast and large parts of northern and eastern India on 18-09-2011 at 18 11 hrs for 47 seconds(IMD 2011). Gangtok, capital city of Sikkim, which is around 68.74 km southwest from the epicentre,experienced earthquake intensity of VI in MMI scale. It caused extensive damage, wide spread panic andthose who experienced the earthquake realised that the event was large enough and majority of theirbuildings were not strong enough to sustain another earthquake of same or higher magnitude.
According to preliminary report by USGS, at least 94 people killed, several injured and 5,000 displaced,several thousand buildings, many roads and bridges destroyed or damaged in the Sikkim-Bihar-WestBengal area; 6 people killed and 25 injured and at least 4,300 buildings destroyed or damaged in Bhojpur,Ilam, Panchthar and Sankhuwasabha, Nepal; 7 people killed and 136 injured in Tibet, China; 1 personkilled and 16 injured and at least 6,000 buildings damaged in the Paro-Thimphu region, Bhutan; minordamage to several buildings in Dhaka, Bangladesh. Total economic loss in India estimated at 22.3 billionUS dollars.
Table 1-2 IMD and USGS Earthquake Parameters (IMD, 2011), (USGS,2011)
IMD USGSDate 18th September 2011Time 18:11 hrs(IST) 18:25hrs(IST)Magnitude 6.8 6.9Focal Depth (Km) 10 19.7Epicentre 27.7 °N and 88.2 °E 27.72 °N and 88.06 °E

EARTHQUAKE BUILDING VULNERABILITY AND DAMAGE ASSESSMENT, SIKKIM EARTHQUAKE, 2011
3
Figure 1-2 Sikkim earthquake: location of epicentre and intensities as felt across the region (USGS, 2011)
Figure 1-3 Main Boundary Thrust (MBT) and major earthquakes of the region (Rajendran et al., 2011)

EARTHQUAKE BUILDING VULNERABILITY AND DAMAGE ASSESSMENT, SIKKIM EARTHQUAKE, 2011
4
Figure 1-4 Sikkim Map showing Districts and Location of Epicentre and Gangtok (Rural Development Department,Sikkim)
Sikkim earthquake caused severe damage to built environment across the state of Sikkim and partly inDarjeeling district of neighbouring state of West Bengal. It also triggered numerous landslides that causeddamage to the buildings in several parts of the state. Subsequent to earthquake, heavy monsoonal rainfallfurther added to the earthquake induced landslides and caused severe damage to the lifeline of the state,road network and as a result the post earthquake relief operations were severely affected. Within one hourof the major shock, IMD (2011) reported two aftershocks of M 5.3 and M 4.6 which created panic andalso affected relief operations particularly extraction of injured from heavily damaged buildings.
Prior to 2011, people of the state Sikkim had experienced earthquake of higher magnitudes on February14, 2006, which was of M 5.3 before that it was in 1988 of M 6.6 and in 1833 of M 7.7 (Rajendran et al.,2011). This area lies in Zone 4 (second highest category) of seismic zone atlas of India and according toUSGS, this region has experienced moderate seismicity in the past, with 18 earthquakes of M 5 or greaterover the past 35 years within 100 km of the epicentre of the September 18 event.
The Sikkim earthquake occurred near the boundary between the India and Eurasia plates, at a depth ofapproximately 20 km beneath the Earth's surface. In this region, the India plate converges with Eurasia ata rate of approximately 46 mm/yr towards the north-northeast. The broad convergence between thesetwo plates has resulted in the uplift of the Himalayas. The preliminary focal mechanism of the earthquakesuggests strike slip faulting, and thus an intra-plate source within the upper Eurasian plate or theunderlying India plate, rather than occurring on the thrust interface plate boundary between the two(USGS, 2011).

EARTHQUAKE BUILDING VULNERABILITY AND DAMAGE ASSESSMENT, SIKKIM EARTHQUAKE, 2011
5
Table 1-3 Reported Aftershocks Date, Time and Magnitude (IMD, 2011)
Date Time of Aftershocks (IST) Magnitude18.09.2011 18:42 5.318.09.2011 19:24 4.618.09.2011 20:35 3.019.09.2011 00:57 3.419.09.2011 03:21 3.8
State Government of Sikkim reported that in East District 13 people died, and approximately 6000 houseswere fully damaged, 9000 houses were partially damaged, 201 schools and 23 hospitals were fullydamaged. USGS PAGER estimated that around 31,000 people from Gangtok area of East District ofSikkim were exposed to MMI of VI.
1.2. Earthquake and Buildings Indian Context
components: structural and non-structural. Structural components are the building load bearing elementslike foundations, columns, beams and walls etc. Non-structural components include architectural anddesign features like doors, windows, false ceiling etc and services include features like electrical andplumbing fixtures. Buildings fail in the event of earthquake when major damage occurs to structuralsystems. Kircher et al. (1997). Ideally, buildings should be designed with respect to earthquake such thatthey survive in moderate earthquakes with non-structural damages and resist collapse with structuraldamages in strong and major earthquakes and ensure that no life is lost because of the collapse ofbuildings.
Destructive (M>6.5 ) earthquakes occur with low frequency which makes people, local authorities ignorethe importance of the earthquake resistant building design, disaster preparedness and post disastermanagement. Previous earthquakes in the country have proven that both old and new constructions arevulnerable and structures in improper settlements like slums are more dangerous because of their substandard and sub-optimal provisions of earthquake resistant designs. People who migrate from rural tourban areas in search of work often tend to live in these vulnerable settlements due to the low costs,thereby increasing the vulnerability of fast growing urban population. According to the vulnerability atlasof India, about 80 million housing units in India are vulnerable to earthquakes, of which 11 million falls inZone V and 50 million falls under Zone IV of the seismic zones of the country (Agrawal and Chourasia,2007). Uttarkashi (1991), Chamoli (1999), Bhuj (2001), Kashmir (2005), and Sikkim (2011) are some of therecent earthquakes in the Indian Sub-continent, which have caused severe damage to the builtenvironment resulting in human and economic losses. It has raised wide spread concerns for earthquakesafety and consciousness in people and government authorities about increasing vulnerability toearthquake hazards.
1.2.1. Materials and Method of ConstructionIn India, age old construction practice using traditional to modern building materials exists even today inrural and small towns where as in big metropolis, advance technology and materials are in use, butironicallyfor high building vulnerability across the country (Rai, 2008). Even though there are codes and standardsfor construction with RCC but for the construction with other local building materials that are followed atmany places, there are hardly any standards and moreover it is difficult to monitor all such construction.

EARTHQUAKE BUILDING VULNERABILITY AND DAMAGE ASSESSMENT, SIKKIM EARTHQUAKE, 2011
6
structures turn out to be vulnerable to earthquake hazards. Most of these construction practices by localmasons are inherited from earlier generations, they tend to follow the same practices used in past. In Indiaengineers and architects do not design most of the buildings and buildings in rural areas/outskirts ofurban areas were not approved by the local authorities before construction. Due to the economicconditions, the buildings are built in stages based on the availability of the money and buildings are alsopoorly maintained after construction. Even though building is only planned for few floors in the initialstage, years later, more floors are added to the same building which makes the structure weak and morevulnerable.
In India, old heritage structures are also vulnerable to earthquake hazards therefore, need to be protectedwith proper remedial measures. Preventing these structures from damage is important not only fromhistorical point of view but also it helps tourism.
Table 1-4 Number of Houses and Level of expected Damage (BMTPC, 2006)
Material No. of Houses % Level of Risk under EQ ZoneV IV III II
Mud, Un-burnt Brick, and StoneWall
India 99,280,979 39.9 VH H M LSikkim 20,501 15.9 H
Burnt Brick Wall India 111,891,629 44.9 H M L VLSikkim 9,300 7.2 M
Concrete and Wood Wall India 9,737,330 3.9 M L VL VLSikkim 70,738 54.6 L
Other Materials India 28,185,931 11.4 M VL VL VLSikkim 28,664 22.2 VL
VH - Very High, H- High, M-Moderate, L- Low, VL- Very Low
1.3. Motivation and Problem StatementThe main motivation behind this research is to use GIS based techniques for assessing earthquakevulnerability and damage, which can be further used by the local authorities for the preparedness andother disaster management measures. Preparedness and prevention are key elements of disastermanagement and GIS based damage assessment can contribute significantly towards this. Thevulnerability of buildings can only be reduced with proper study of earthquake damage to the buildings inthe past and planning structures and infrastructure accordingly so that they meet the challenges ofearthquake safety in future. A proper study of earthquake and vulnerability of buildings to develop damagecurves as required by various damage assessment techniques has not been developed in the country due tovarious reasons(Arya, 2000; Haldar et al., 2010). Damage to buildings generally occurs due to lack ofawareness of earthquake resistant practices and current practices like use of building materials andreinforcement in the structures do not match with the standards (Haldar and Singh, 2009). It is veryimportant to investigate the behavior of buildings after an earthquake to identify any problems inearthquake resistant design and develop damage scenarios. These damage patterns and scenarios would behelpful for damage prediction using user defined scenarios for the future earthquakes and prepare properdisaster management plans. Studying types of construction, their performance and failure patterns helps inimproving the design and detailing aspects(Jagadish et.al, 2003). According to Census of India, 2011, rateof urbanization in the last 10 years is about 31.8 %, which means more and more people are living inurban areas where most of the buildings are vulnerable, thereby exposing a larger population toearthquake hazards.

EARTHQUAKE BUILDING VULNERABILITY AND DAMAGE ASSESSMENT, SIKKIM EARTHQUAKE, 2011
7
It is a matter of concern that with history of so many earthquakes in India, no proper risk assessmentmethodologies have been developed for Indian conditions (Haldar et al., 2010). HAZUS (Hazard US)developed by Federal Emergency Management Agency (FEMA) for the National Institute of BuildingScience (NIBS) estimates the potential losses from earthquakes on a regional basis (FEMA 2011).HAZUS is a capacity-spectrum based method, which uses structural properties for estimating theprobability of building damage and loss in the event of an earthquake. The drawback of using suchmethod directly elsewhere is that the capacity curves and vulnerability functions published in the HAZUSmanual have been derived for building types in the US, which completely differ from the other parts ofthe world. However, HAZUS has been adopted all over the world for the loss assessment using localspecific modifications. Examples include the loss assessment of New York city carried out by Tantala et al.(2008), the seismic risk assessment of Dehradun by Gulati (2006), building replacement cost estimation byAswandono (2011) for Yogyakarta, Indonesia and several such studies proved that HAZUS methodologywith user supplied inputs and earthquake data can be applied to different urban areas. But it is not veryclear how much these studies were successful in generating reliable results which could be used for riskassessment and loss estimation for future planning and preparedness in the event of an earthquake.Luckily there have been no earthquakes in the recent past in these areas to validate the results generated.The Sikkim earthquake of 2011 is a good opportunity to test the level of applicability of HAZUS to theIndian context, as the damage results generated can be verified.
1.4. Main Research ObjectivesTo assess earthquake building vulnerability adapting HAZUS methodology for buildings constructed withlocal building materials and techniques and validate the generated results with reference to a earthquakeevent.
1.4.1. Sub Research Objectives and Related Research QuestionsSub - Research Objectives Research Questions
To identify input parameters of HAZUSmethodology for adapting to Indiancondition
What are the different building types thatexist in the Gangtok area and what are thecriteria to classify them?How far do the building types in HAZUSmatch with building types in Gangtok area?What are the parameters that should bemodified in the existing HAZUSmethodology?
To estimate building damage in userdefined earthquake scenario usingHAZUS methodology adopted forIndian condition and validate them.
What information can be derived fromhigh resolution satellite data and whatshould be collected during fieldinvestigation for the study?How the GIS database is to be organizedto adopt and implement HAZUSmethodology for the Gangtok area?What is the general characteristics ofdamage to built environment and how wellthe predicted and actual building damagedin recent earthquake match?

EARTHQUAKE BUILDING VULNERABILITY AND DAMAGE ASSESSMENT, SIKKIM EARTHQUAKE, 2011
8
To make an general assessment ofdamage to built environment andcomment on various prevention andretrofitting methods for reducingbuilding damage.
What are the main causes of buildingdamage and how well these can be assessedand generalized based on field observation.What are the retrofitting methods that canbe applicable to reduce damage to theidentified building types in Gangtok area?
1.5. Research LimitationsOne of the important inputs is building foot print map and location of all damages buildings. As the areacovers vast stretches of area, it was not possible to map approximately 12000 buildings; therefore, thebuilding foot print map prepared in 2004 by the authorities was used for the research. The completebuilding data is available for the central wards of the city and data is not available for few wards away fromthe centre of Gangtok. So for wards at the centre of city was mainly considered for analysis and validation.Since it is impossible to collect damage data in short time, the damage data provided by the municipalauthority was used for validation.
1.6. Organisation of the ThesisChapter 1 provides the general introduction of the earthquake and its vulnerability towards buildings inIndian context, the motivation behind the research, objectives and research questions related to theobjectives of the research. Limitations and the expected outcome of the research were also discussed.
Chapter 2 gives an idea of the theoretical background for the research regarding Indian building types,HAZUS methodology, attenuation functions etc. It is basically theory behind the methods and processused in research for generating results.
Chapter 3 discusses about the material and methods used for the study. The process and details of thedata collected in the field and other data acquired, tools and methodology used in the research areexplained. The processing and preparation of the satellite imagery was also explained.
Chapter 4 and 5 describes about the study area Gangtok in detail and the experience of field work in thestudy area for three weeks. Damage observed and other details regarding the building types, constructionpractices and the problems that were found as the cause of the building damage are discussed in detail.
Chapter 5 gives the retrofitting recommendations that can be adapted for the buildings in Gangtok.
Chapter 6 explains the results and various scenarios generated using the described methodology. It alsodeals with generation of risk map and the validation of generated results.
Chapter 7 explain the conclusions based on the results generated and the various retrofitting methodsrecommended for the study area for repairing the damaged buildings and preparing for the futureearthquakes.

EARTHQUAKE BUILDING VULNERABILITY AND DAMAGE ASSESSMENT, SIKKIM EARTHQUAKE, 2011
9
2. LITERATURE REVIEW
In India, a variety of constructions methods and local materials are used for building construction, most ofwhich r high buildingvulnerability. Even though there are codes and standards for construction with RCC, for construction
happening in different parts of the country.
2.1. Indian Building Types
The majority of Indian construction depends on the availability of building material and construction
traditional methods practised for decades based on the material, topography and the economic conditionof the building owner. Prasad et al. (2009) believes that socio economic condition of the people definesthe type and construction quality of the building and divided building patterns into three types. Firstly theindependent houses which were built for residential purposes and secondly the group housing likeapartment complexes etc. for multipurpose use and industrial, office and commercial buildings. In presentday scenario, the small industries and retail stores have started functioning from residential complexes,which makes majority of the urban buildings multipurpose and comparatively more in commercial uses.
Prasad et al. (2009) identified 34 building types that are generally found in India. The classification isbased on the structural system of the buildings, which are mainly divided into three types namely adobeand random rubble masonry construction, masonry construction and finally framed construction. Thesewere divided into subclasses based on different parameters like roof material, floors etc. and classificationis given in Table 2-1. Height of the building is also considered as one of the major factor in classificationas the strength and natural period of vibration depend on the height of the building.
Analytical functions were not available for Indian building types and development of empirical curves isalso not possible because of lack of sufficient damage data in previous earthquakes (Prasad et al. 2009).After some comparison between Indian building design standards and US standards, Indian framedstructures have some comparison with high, medium and low code of the HAZUS building types. Prasadet al. (2009) compared the classified Indian building types to the HAZUS model building types and foundout that the Indian adobe and masonry building types cannot be compared to any of the fragility curvesthat are given in default HAZUS building types.

EARTHQUAKE BUILDING VULNERABILITY AND DAMAGE ASSESSMENT, SIKKIM EARTHQUAKE, 2011
10
Table 2-1 Indian Building Types and their respective HAZUS building types (Prasad et al. 2009)
S.NoDescription of Indian model building types
Most likely HAZUS Building TypeWall/Framing type Roof/Floor Type * Floors
Adobe and Random Rubble Masonry
1 Rammed mud/ sun-driedbricks/rubble stone in mudmortar
R1, R2 1-2
Not Defined
2 R3 1-2
3Rubble stone in lime-surkhimortar
R1, R2 1-2
4 R3, R4 1-25 R5 1-26
Rubble stone in cementmortar
R1, R2 1-2
7 R3, R4 1-2
8 R5,R6 1-2
Masonry consisting of Rectangular Units
9Burnt clay brick/ rectangularstone in mud mortar
R1, R2 1-2
Not Defined
Not Defined
10 R3, R4 1-2
11 R5 1-2
12Burnt clay brick/ rectangularstone in lime-surkhi mortar
R1, R2 1-2
13 R3, R4 1-2
14 R5,R6 1-215 Burnt clay brick/ rectangular
stone/ concrete blocks incementmortar
R1, R2 1-216 R3, R4 1-2
17R5,R6
1-218 3+
19Burnt clay brick/ rectangularstone/ concrete blocks incement mortar and providedwith seismic bands andvertical reinforcement atcorners and jambs
R5,R6
1-2
20 3+
Framed Structures
21 RC frame/ shear wall withURM constructedwithout any consideration forearthquake forces
R-6
1-3 C3L
Precode22 4-7 C3M
23RC frame/ shear wall withURM - earthquakeforces considered in designbut detailing ofreinforcement and executionnot as per earthquakeresistant guidelines (Lowcode/Moderate-Code)
1-3 C3L
Precode/Low code24 4-7 C3M
25 8+ C3H
26RC frame/ shear wall withURM - designed,detailed and executed as perearthquake resistantguidelines (Low code/Moderate-Code/High Code)
1-3 C3L
Precode/Low code/Moderate Code27 4-7 C3M
28 8+ C3H

EARTHQUAKE BUILDING VULNERABILITY AND DAMAGE ASSESSMENT, SIKKIM EARTHQUAKE, 2011
11
29 Steel moment frames withURM (Low code/Moderate-Code/ High Code)
1-3 S5LPrecode/Low code/Moderate Code30 4-7 S5M
31 8+ S5H32 Steel braced frames (Low
code/ Moderate-Code/HighCode)
1-3 S2L
Precode/Low code/Moderate Code33 4-7 S2M
34 8+ S2H* Roof/Floor types: R1 - Heavy sloping roofs-stones/burnt clay tiles/thatch on sloping rafters; R2 Heavy Flatflexible heavy roof - wooden planks, stone/burnt clay tiles supported on wooden/steel joists with thick mudoverlay; R3 - Light sloping roofs - corrugated asbestos cement or GI sheets on sloping rafters without crossbracing; R4 - Trussed roof with light weight sheeting (without cross bracing); R5 - Trussed/hipped roof with lightweight sheeting (with cross bracing); R6 - Flat rigid reinforced concrete or reinforced masonry slab
2.1.1. C3 Building Type
The C3 type of HAZUS building type is defined in Appendix C of Technical Manual prepared by FEMA(2011) which defines the structure Concrete Frame Buildings with Unreinforced Masonry Infill Walls.These buildings are frame buildings with unreinforced masonry infill walls and the frame is of reinforcedconcrete. The frames can be located almost anywhere in the building. Usually the columns have theirstrong directions oriented so that some columns act primarily in one direction while the others act in theother direction. In these buildings, the shear strength of the columns, after cracking of the infill, may limitthe semi-ductile behavior of the system. In earthquakes these building fail and lead to partial or fullcollapse because of brittle failure as these are only designed with ductile properties. The other two typescloser to C3 are C1 and C2. C1 type of structure is defined as the buildings with frames of reinforcedconcrete and C2 buildings are similar to C1, but in these buildings shear walls are used as load bearingwalls instead of the vertical reinforced concrete columns. These walls tend to fail because of the lateralforces acted on these walls in the earthquakes.
Buildings with some level of seismic design were considered but they do not match with the suitable levelof building codes and therefore, were considered as low codedesign considerations falls under pre code category of HAZUS classification.
2.1.2. W1 building Type
Buildings made out of wood are other types of structures usually found in hilly regions and are not listedin the classification. These are typically single-family or small, multiple-family dwellings of not more than5,000 square feet of floor area. The essential structural feature of these buildings is repetitive framing bywood rafters or joists on wood stud walls. These are light structures and usually all structural systems aremade up of small spans. Most of these buildings, especially the single-family residences, are not designedand constructed any seismic design considerations of building codes. Lateral loads are transferred bywooden posts and beams to shear walls. Shear walls are the partition between the frames are made out ofseveral kind of material like bamboo, fiber, plastic etc. as a covering material but has no structuralimportance. They are usually strong enough to resist lateral forces of minor quakes but not strong enough

EARTHQUAKE BUILDING VULNERABILITY AND DAMAGE ASSESSMENT, SIKKIM EARTHQUAKE, 2011
12
2.1.3. Seismic Design Level in Buildings
HAZUS default building types represent typical buildings of a given model building type that are designedwith respect to High-Code, Moderate-Code, or Low- Code seismic standards, or not seismically designed(referred to as Pre code buildings). The High-Code, Moderate-Code, or Low- Code seismic standards aregiven based on the level of seismic design considerations. Low code seismic design buildings areconstructed with basic structural design considerations to resist forces due to earthquakes. The low codedamage functions can be used for modeling the damage due to earthquakes in these buildings, where precode damage functions are appropriate for modeling buildings that were not designed for any earthquakeload, which can also be used for buildings without any building codes and rules.
2.2. Vulnerability and Factors affecting building vulnerability.UNISDR (2009) defines vulnerability as the characteristics and circumstances of a community, system orasset that make it susceptible to the damaging effects of a hazard. In our case the vulnerability is thedegree of damage to the built environment to a given strength of earthquake shaking (Dowrick, 2005).Vulnerability is expressed on a scale of 0 to 1, where 0 is no damage and 1 defines complete destruction.
The form and shape of the structure are the important parameters defining building vulnerability. Theform includes the material of the building, type of construction, height, architectural and design elements,seismic design levels etc, where as the shape defines the regular or irregular forms in plan and elevation.Dowrick (2005) defines that poor structures and design cannot be expected to perform well inearthquakes.
2.2.1. Strength of structure and Seismic design requirement.Based on the location of building, parameters which effect strength of the structure should be identified inadvance. Parameters like local geology, soil conditions, and possible ground motion of earthquake alsodetermine the performance of the buildings and design. These parameters will also determine what kind ofdamage that building can possibly resist in future events. Table 2-2 shows advantages and disadvantages ofdifferent types of structures.
Table 2-2 Advantages and Disadvantages of Flexible and Stiff Structures (Dowrick 2005)
Advantages DisadvantagesFlexible structures Specially suitable for short period
sites, for buildings with long periodsHigher response on long-period sites
Ductility arguably easier to achieve Flexible framed reinforced concrete isdifficult to reinforce
Non-structure may invalidate analysis More amenable to analysisNon-structure difficult to detail
Stiff structures Suitable for long-period sites Higher response on short-period sites
Easier to reinforce stiff reinforcedconcrete (i.e. with shear wall)
Appropriate ductility not easy to knowinglyachieve
Non-structure easier to detail Less amenable to analysis

EARTHQUAKE BUILDING VULNERABILITY AND DAMAGE ASSESSMENT, SIKKIM EARTHQUAKE, 2011
13
2.2.1.1. Structural Elements of building.Proper design of structural elements improves the performance of the building in earthquakes.Foundations, shear walls, no soft storeys, regular loading, cantilevers, continuous beams, tie-beams, aresome structural elements which improves the strength of the building. Connectivity of all the structuralcomponents of building from foundation to the roof is very important for its structural performance
a) Heavy mass in the upper floors or unequaldistribution of mass is not advisable
b)Mass Should be equally distributed from top tobottom, cantilevers should be avoided
c) Soft storeys should be avoided, the open columns should be always connected with shear walls
Figure 2-1 Rules to be followed in construction practices (Dowrick 2005)
2.2.2. Function of building.The building use often determines the building design, material to be use and the kind of construction tobe undertaken. Function of the building defines the number of people likely to use the building and thekind of equipment or other items in the building to be stored which will define the economic value of thebuilding. Space available and the space required for building use is what defines the number of floors thatneed to be constructed which also influences the material selection. Some buildings of important use likeschools, hospitals, banks, and other government services which are important and availed by many peoplerequire high standards of safety, proper planning, and execution
2.2.3. Material and Method of construction
As discussed in Section 1.2.1, India has several materials and methods of constructions. The material ofbuilding is chosen based on various factors like availability of material, function of the building, economiccondition of the owner, and expected life of building, temporary or permanent type of structure, andseismic design requirements of the building. Table 2-3 shows the kind of material that is ideal to use fordifferent types of buildings based on their height. Structural properties like strength, weight of building,ductility etc are derived from the material used for construction.

EARTHQUAKE BUILDING VULNERABILITY AND DAMAGE ASSESSMENT, SIKKIM EARTHQUAKE, 2011
14
Table 2-3 Suitable building material for different kind of Construction (Dowrick 2005)Type of Building
High Rise Medium Rise Low RiseAdvisable*Structural materialsin approximateorder ofsuitability
1. Steel2. In-situ reinforcedconcrete
1. Steel2. In-situ reinforcedconcrete3. Good pre-castconcrete
1. Timber2. In-situ reinforcedconcrete3. Steel4. Prestressed concrete5. Good reinforcedmasonry6. Good pre-castconcrete
Not Advisable 7. Primitive reinforcedmasonry
Even though when the structures are well designed for earthquake resistance and enough money is spentto obtain the best quality of material, if the workmanship of the building is poor, all the effort taken willbe of no use. So the quality assurance during the period of construction and maintenance afterconstruction are also very important for the life and safety of the building.
2.2.4. Height of the buildingHeight of the building is important as it is directly related to the weight of the structures and theirresponse to ground motion. The natural frequency of building is low for tall buildings and high for shortbuildings. Since time period is inversely proportional to frequency, short buildings tend tocollapse/experience damage when amplification is higher in high frequency domain and tall buildingsexperience damage when amplification is higher in low frequency domain.
Figure 2-2 Stiffness of building(Dowrick 2005)
Table 2-4 Natural frequency of buildings (BIS, 2002)
Natural Frequency12
3-5(Medium)Tall Buildings
High-Rise
1052
0.5-1.00.17
2.2.5. Shape of buildings.Simple shapes and forms are recommended in earthquake prone zones. Dowrick (2005) explains thebenefits with two reasons. First, it is easy to design and understand structurally the simple structures,second it is easier to build these structures and it is easier to repair or retrofit them post earthquake.Symmetry in the plan form defines the simplicity of plan and elevation of the building. Symmetry helps insimplifying the structural design, services and other parameters. Height-Width ratios in elevation, Length-Width ratios in plan are also very important. Tall buildings with less base and long buildings with less

EARTHQUAKE BUILDING VULNERABILITY AND DAMAGE ASSESSMENT, SIKKIM EARTHQUAKE, 2011
15
width are very prone to damages due to high ground motions. Sudden changes in these ratios in plan orelevation make structures asymmetrical and make them more vulnerable.
(A) (B)Figure 2-3 Simple rules to be followed in shapes of Plans and Elevations A- (Dowrick 2005), B- (BIS, 2002)
In the case of long buildings in plan, buildings should be broken into parts of ideal length and should begiven space for them to shake in earthquakes or else there will be chances of pounding effect that cancause more damage than expected.
Figure 2-4 Figure showing insufficient gap and Pounding effects in Plan and Elevation (Dowrick 2005)
2.2.6. Building CodesBuilding codes play a very important role in the vulnerability of the buildings. Building codes with properland use planning can reduce the vulnerability of earthquakes in any area. But enforcement of the buildingcodes in design and construction is very important. These acts as guidelines for all architects and engineersto make buildings and cities that are less vulnerable to earthquakes. Khose et al. (2010) believes that sincethe codes developed in India are not sufficient for modern day construction practices, there is a need toupdate the code.

EARTHQUAKE BUILDING VULNERABILITY AND DAMAGE ASSESSMENT, SIKKIM EARTHQUAKE, 2011
16
Table 2-5 List of Indian Standard Codes
IS Code TopicIS:4326IS:13920IS:13827IS:13828IS:13935IS:1893(Part 2)
Earthquake Resistant ConstructionDuctile Detailing of Reinforced Concrete StructuresEarthen DwellingsLow Strength Masonry StructuresSeismic Strengthening of BuildingsElevated and Ground Supported Liquid Retaining Structures
2.3. HAZUS MethodologyHazards US, commonly referred as HAZUS is a GIS based tool developed by National Institute ofBuilding Sciences (NIBS) for Federal Emergency Management Agency (FEMA) for estimating risk due todisasters and estimate losses which can help authorities for making settlements prepared for the disastersand help in post disaster planning, recovery and reconstruction (FEMA, 2011). The tool uses GIS fordeveloping databases, inventory of buildings, infrastructure, constantly updating databases, and carry outanalysis for better presentation of results.
The creation of databases with extensive information on buildings is the important task that has to becarried out before using the tool for generation of results and scenarios in the event of any disaster. Thescale and the details of the results are directly based on the amount of information used in the executionof methodology.
Figure 2-5 HAZUS Methodology (Porter 2009)
Kircher et al. (1997) described methods for estimating the probability of building damage from thefunctions developed by Whitman et al. (1997) for earthquake loss estimation. This methodology wasoriginally developed for FEMA and is used in HAZUS. These functions as mentioned use the groundshaking parameters for assessing damage for various building types. Irrespective of the hazard, themethodology requires databases and inventories, which are then used for damage and impact assessmentof a specific hazard. The following steps explain the methodology in a simplified form.

EARTHQUAKE BUILDING VULNERABILITY AND DAMAGE ASSESSMENT, SIKKIM EARTHQUAKE, 2011
17
2.3.1. Deterministic Seismic Hazard AnalysisIn this analysis, the ground motion parameters are specified from a defined event. The parameters like themagnitude of the earthquake, type of fault are defined from which the ground motion at the site isdetermined based on the distance from the source to the specific area.
2.3.1.1. Generation of Demand SpectrumThe ground shaking at a point due to the energy released from epicentre which is represented as demandspectrum. The demand spectrum is the plot between the Spectral Acceleration SA and SpectralDisplacement SD. The spectral acceleration at a point at a given time period is derived from attenuationequations which uses several parameters like local soil conditions, rock types, distance from epicentre etc.The derived spectral acceleration is plotted against the spectral displacement. Mandal et al. (2009) usedattenuation function derived by Boore et al. (1997) as described in the Equation 2-1 for calculating peakspectral acceleration for Bhuj 2001 earthquake and suggested that this function suits for generatingspectral acceleration for the Indian conditions.
where
and
where is the spectral acceleration to be derivedare constants provided with the equationis the magnitude of earthquakeis the horizontal distance from epicentre
the shear wave velocity of the soil class provided by NEHRP classification
Equation 2-1 Attenuation function. Boore et al. (1997)
The values of Shear Wave Velocity ( ) of different soil classes are given in the Table 2-6
Table 2-6 NEHRP Site Classes
Site Class Description Shear Wave Velocity ( ) in m/s
A Hard Rock > 1500
B Rock 760 < <1500
C Very dense soil and soft rock 360 < <760
D Stiff soil profile 180 < <360
E Soft soil profile <180

EARTHQUAKE BUILDING VULNERABILITY AND DAMAGE ASSESSMENT, SIKKIM EARTHQUAKE, 2011
18
The spectral displacement is calculated from the following equation.
where is the Spectral Acceleration calculated from Equation 2.1T is the time period in seconds
Equation 2-2 Spectral Displacement Equation
2.3.2. Development of Building Damage FunctionsKircher et al. (1997) describes Capacity and Fragility curves functions which are used by HAZUSmethodology for estimating damage from ground shaking caused by earthquakes. Capacity curves definethe non-linear behaviour of buildings which are described by the yield and ultimate strength and on theother hand the probability level of damage to the buildings at given ground shaking level is predicted bythe Fragility curve.
2.3.2.1. Capacity CurveBuildings respond to ground shaking in earthquakes. As buildings are tied to the ground with foundations,the free end i.e., roof shakes more than the ground. There is always some inbuilt strength to resist thisshaking. But when it reaches it maximum level, it tends to reach its upper limit and finally collapses. Till alimit, inbuilt strength of the building resist the shake and allow the building remains stiff and standstraight, this is called yield capacity point. When building reaches its yield capacity it starts to shake to alimit and at a stage the building loses its complete strength and can no longer resist the force of shakingand structural systems completely fails. That point before losing all its strength to shake is called ultimatecapacity point. The capacity curve is generally derived from these two points.
Figure 2-6 Deformation of building due to lateral forces (Calvi et al., 2006)
lateral displacement (Kircher et al. 1997). The amount of lateral displacement at the roof of the building at-
stage before building reaches its yield point, it is in solid state; from yield to ultimate point, it is in anelastic state; and post ultimate capacity, it will turn into plastic state. These curves define a building instructural terms and usually vary between different building types.

EARTHQUAKE BUILDING VULNERABILITY AND DAMAGE ASSESSMENT, SIKKIM EARTHQUAKE, 2011
19
Figure 2-7 Capacity Curve showing Yield and Ultimate Capacity points (Kircher et al. 1997)
Yield capacity of buildings varies from building to building and is defined by the design strength of thebuilding based on different seismic levels like high-code, moderate-code, low code and pre code. Factorssuch as soil condition, seismic zone, and height of the building and material of construction are consideredin the seismic design levels which decide the time till which the building can resist the shaking.
The response of building is determined at the point where the demand spectrum intersects with buildingcapacity curve (Kircher et al. 1997). Different buildings have different intersection points to differentdemand spectra. So for given ground shaking every building has a different level of damage.
The Figure 2-8 shows that stronger buildings usually have more time before they fail than the weakerbuildings because they tend to take more time to reach their ultimate capacity compared to the weakerbuildings.
Figure 2-8 Capacity Spectra vs. Demand Spectra (Kircher et al. 1997)

EARTHQUAKE BUILDING VULNERABILITY AND DAMAGE ASSESSMENT, SIKKIM EARTHQUAKE, 2011
20
The yield and ultimate capacity points of C3 model building type for low code and pre code seismic designlevels are given below in Table 2-7.
Table 2-7 Code building Capacity Curves (FEMA 2011)
Building Type Yield Capacity Ultimate Capacity
Low code Seismic DesignW1 0.24 0.200 4.32 0.600C3L 0.12 0.100 1.35 0.225C3M 0.26 0.083 1.95 0.188C3H 0.74 0.063 4.13 0.143
Pre- Code Seismic DesignW1 0.24 0.200 4.32 0.600
C3L 0.12 0.100 1.35 0.225
C3M 0.26 0.083 1.95 0.188
C3H 0.74 0.063 4.13 0.143
2.3.3. Discrete Damage ProbabilitiesKircher et al. (1997) defines the fragility curves as the lognormal functions that describe the probability ofreaching or exceeding the structural and non-structural damage for a given spectral displacement. Thesecurves determine the probability of damage to the buildings from slight, moderate, extensive to completedamage. These damages are based on the seismic design level of the building.
Figure 2-9 Capacity Spectrum Method showing the level of Damage (FEMA 2011)
Discrete damage probabilities are derived from cumulative damage probabilities which were calculatedfrom the Equation 2-3 developed by Kircher et al. (1997).
where is the probability of reaching the slight damage state for a given peak buildingresponse

EARTHQUAKE BUILDING VULNERABILITY AND DAMAGE ASSESSMENT, SIKKIM EARTHQUAKE, 2011
21
is the median value of spectral displacement at which the building reaches thethreshold of damage state,is the standard deviation of the natural logarithm of spectraldisplacement for damage stateis the standard normal cumulative distribution function
Equation 2-3 Equation for developing building damage functions
Probability of each damage state is calculated by substituting the value of peak building response and thedamage state median of a specific damage state. The values of different damage states for a C3 buildingtype are given in Table 2-8. The probable levels of expected damage vary from building type-to-type andlevel of different seismic design levels. Damage states of the concrete frame building with unreinforcedmasonry walls are described as given in the Table 2-10.
Table 2-8 Structural Fragility Curve Parameters (FEMA 2011)
BuildingType
Slight Moderate Extensive Complete
Low code Seismic DesignW1 0.50 0.93 1.25 0.98 3.86 1.02 9.45 0.99C3L 0.54 1.09 1.08 1.07 2.70 1.08 6.30 0.91C3M 0.90 0.85 1.80 0.83 4.50 0.79 10.50 0.98C3H 1.30 0.71 2.59 0.74 6.48 0.90 15.12 0.97
Pre- Code Seismic DesignW1 0.40 1.01 1.00 1.05 3.09 1.07 7.56 1.06
C3L 0.43 1.19 0.86 115 2.16 1.15 5.04 0.92
C3M 0.72 0.90 1.44 0.86 3.60 0.90 8.40 0.96
C3H 1.04 0.73 2.07 0.75 5.18 0.90 12.10 0.95
After calculating cumulative damage probabilities discrete damage probabilities are calculated from thefollowing formula,
Table 2-9 Discrete Damage Probabilities(FEMA 2011)
ProbabilityComplete Damage =Extensive Damage =Moderate Damage =Slight Damage =No Damage =
The C3 type of HAZUS building type is defined as the buildings with unreinforced masonry infill wallsand the frame is of reinforced concrete. In these buildings, the shear strength of the columns, aftercracking of the infill, may limit the semi-ductile behavior of the system. The infill wall is made of eitherbrick or concrete blocks and these walls are not properly tied to the columns.

EARTHQUAKE BUILDING VULNERABILITY AND DAMAGE ASSESSMENT, SIKKIM EARTHQUAKE, 2011
22
Table 2-10 Damage states of C3 building type (FEMA 2011)
Damage State Description
Slight Diagonal (sometimes horizontal) hairline cracks on most infillwalls; cracks at frame-infill interfaces.
Moderate Most infill wall surfaces exhibit larger diagonal or horizontalcracks; some walls exhibit crushing of brick around beam-column connections. Diagonal shear cracks may be observedin concrete beams or columns.
Extensive Most infill walls exhibit large cracks; some bricks maydislodge and fall; some infill walls may bulge out-of-plane;few walls may fall partially or fully; few concrete columns orbeams may fail in shear resulting in partial collapse. Structuremay exhibit permanent lateral deformation.
Complete Structure has collapsed or is in imminent danger of collapsedue to a combination of total failure of the infill walls andnon-ductile failure of the concrete beams and columns.Approximately 15%(low-rise), 13%(mid-rise) or 5%(high-rise)of the total area of structure
W1 buildings are made out of wood and other prominent types of structures usually found in hilly regions.These are light structures and usually all structural systems are made up of small spans. The partitionbetween the frames are made out of several kind of material like bamboo, fiber, plastic etc. as a coveringmaterial but has no structural importance.
Table 2-11Damage states of W1 building type (FEMA 2011)
Damage State Description
Slight Small plaster or gypsum-board cracks at corners of door andwindow openings and wall-ceiling intersections; small cracks inmasonry chimneys and masonry veneer.
Moderate Large plaster or gypsum-board cracks at corners of door andwindow openings; small diagonal cracks across shear wall panelsexhibited by small cracks in stucco and gypsum wall panels; largecracks in brick chimneys;
Extensive Large diagonal cracks across shear wall panels or large cracks atplywood joints; permanent lateral movement of floors and roof;cracks in foundations; splitting of wood sill plates and/or slippage
-over--
Complete Structure may have large permanent lateral displacement, mayCollapse, or be in imminent danger of collapse due to cripple wallfailure or the failure of the lateral load resisting system; somestructures may slip and fall off the foundations; large foundationcracks. Approximately 3% of the total area of W1 buildings withComplete damage is expected to be collapsed.

EARTHQUAKE BUILDING VULNERABILITY AND DAMAGE ASSESSMENT, SIKKIM EARTHQUAKE, 2011
23
3. METHODOLOGY AND DATABASE ORGANISATION
3.1. IntroductionThe present research emphasizes on assessing building vulnerability due to seismic hazard. The mainobjective is to assess the earthquake building vulnerability by adopting HAZUS methodology andvalidation of the results with the actual damage caused by the earthquake on 18 th September 2011. Themain part of the methodology is to develop or acquire the extensive databases that are required to developthe damage scenarios and produce risk map.
To achieve the defined objectives, research work is divided into three stages: Pre-Field, Field Work andPost Field Work. Collection of literature on HAZUS methodology, field data collection, GIS databaseorganisation, damage assessment, validation and risk map generation are some of the importantcomponents of the study. The method of research work is given in the form of flow chart as shown inFigure 3-1. Complete methodology and the data used in the research are explained in the followingsections.
Figure 3-1 Methodology Flow-Chart

EARTHQUAKE BUILDING VULNERABILITY AND DAMAGE ASSESSMENT, SIKKIM EARTHQUAKE, 2011
24
3.2. Pre- field stageIn the first stages of research, literature regarding HAZUS methodology was reviewed to understand themethod to assess building vulnerability. Various journal papers, HAZUS user and technical manuals,reports and previous works that used HAZUS outside US were referred in the process (Boore et al.(1997); Tantala et al. (2008); Gulati (2006), Aswandono (2011)). By understanding how methodologyworked, as described in literature review, the information and data required to generate the desired resultswere listed out and a checklist for the data collection and field plan were prepared. Literature based onbuilding codes, Indian building types, theory on possible earthquake damage to buildings were studied for
is referred for the screening of buildings in the field.
High-resolution satellite imagery was acquired from various sources. These images were thenorthorectified and mosaic was prepared. Reports on previous studies were referred to get better ideabefore visiting the field. Earthquake parameters like source, type of faulting, magnitude etc., were collectedfrom various sources like IMD, GSI, and USGS. Attenuation function as described in Equation 2-1,developed by Boore et al. (1997), was used to generate spectral acceleration and spectral displacementrequired for generation of response spectra of an earthquake.
Table 3-1 List of the Satellite Imagery Used
List of high resolution imageryPlatform Sensor Date of Acquisition Path Row Resolution (m)Cartosat -1 PAN 30th September 2011
585 271 2.521st March 201102nd February 2007
Cartosat -2 PAN 01st March 2011 001 002 and 001 0.8Centre Lat Centre Long
Geoeye PAN 05th October 2011 27.292 88.597 0.40Quickbird MS 29th September 2011 27.334 88.590 2.4
Table 3-2 Data collected before Field Visit
Data SourceToposheet, 1:50,000 No: 78 A/11 Survey of India
Earthquake Scenario IMDUSGSRajendran et al. (2011)
City Development PlanStrategic Urban PlanGangtok City Mobility Plan
Urban Development and Housing Department,Government of Sikkim
Gangtok Housing Strategy Department of Housing, School of Planning andArchitecture, New Delhi
Population Urban Development and Housing Department,Government of Sikkim
Soil and Geology Mine, Minerals and Geology Department,Government of SikkimKumar Nath (2004); Sharma et al. (2011);Bhasin et al. (2002), Kumar Nath (2000) KumarNath (2009)

EARTHQUAKE BUILDING VULNERABILITY AND DAMAGE ASSESSMENT, SIKKIM EARTHQUAKE, 2011
25
HAZUS MethodologyCapacity curves and fragility curves
Technical Manual (FEMA 2011)
Rapid Visual Screening Procedure Rapid Visual Screening of Buildings for PotentialSeismic Hazard (FEMA, 2002)
Building Typology and building damage in previousearthquakes
Kaushik et al. (2006)
Questionnaire Lang et al.( 2009)
Table 3-3 Questionnaire prepared for Field Survey (Lang et al. 2009)
Question Observation1 Is the building irregular in plan Yes No2 Are the columns regularly distributed Yes No3 Are both building directions adequately braced Yes No4 Yes No5 Does the building possess eccentric cores (staircases or elevators) Yes No6 Does the building have a soft storey Yes No7 Is the building irregular in elevation caused by setbacks of upper stories Yes No8 Does the building have cantilevering upper stories Yes No9 Does the building possess a heavy mass at the top or at roof level Yes No
10 Are pounding effects possible Yes No11 Does the building have short columns Yes No12 Are strong beams weak columns available Yes No13 Does the building possess shear walls Yes No14 Did the building suffer any significant structural damage in the past Yes No15 Does the building possess seismic retrofitting or strengthening measures Yes No
3.3. Field WorkField work was an important component for this study. Information/data that was already available aslisted was collected from various departments. The data collected from the field are given in Table 3-4 andexplained in detail in next chapter. This helped in saving time in preparation of data bases and otherdigitisation work and allowed more time on observing building damage, interaction with local authoritiesand people.
The locations of damaged buildings in study area were collected from the local authorities/ people andimportant as well as sample points were visited. Location of the sample site was recorded by GPS andphotographs of the building and damage were taken. Based on building inspection, site inspection,interaction with local population and literature, the possible causes of building damage was ascertained.Based on the data provided by the local authority, Municipal Wards were taken as the basic unit forvulnerability assessment. Rapid visual screening procedure was carried out for the study area to collectinformation on building types, structural information, building distribution at ward level, and kind ofdamage due to the earthquake at different locations. The building types, damage observed in buildings andother field observations were described in detail in the following chapter.

EARTHQUAKE BUILDING VULNERABILITY AND DAMAGE ASSESSMENT, SIKKIM EARTHQUAKE, 2011
26
Table 3-4 List of Maps Collected during field work
Maps Attributes Source
Municipal and Ward Boundary Urban Development andHousing Department
Building Foot Print Map Number of floorsBuilding MaterialUsage
Road Map National High WayState Highway, BypassInternal RoadsFootpath
Contour Map (5m)Land Stability Map Mines and Geology
DepartmentRiver and Drainage Network Water and Sanitation
Department
3.4. Post Field WorkIn the last phase of research, based on the collected field data/information and literature, acquireddatabases, maps, and images were organised using uniform georeference system in GIS. The collectedfield data was cross checked with processed high resolution imagery. Based on the different building typesin the study area, and building typology information, different classes of buildings were determined withrespect to HAZUS building classification as given section 2.1 of literature review. Based on the identifiedbuilding types, the building parameters: yield and ultimate capacity values as provided in FEMA (2011)handbook were considered. Using the HAZUS method with building response and ground motionexplained in section 2.3 of literature review, the damage probability of each building type at the ward levelwas generated. The results thus generated were compared with the damage details that were provided bylocal authorities and the level of applicability of HAZUS was evaluated. The complete step by step processfor generating the discrete damage probabilities of building types is given in Annexure A. Based on thedata collected, risk map were generated and was compared with the actual building damages in the 2011earthquake. Based on the literature and field survey, different retrofitting methods that have been adaptedin the study area were identified and discussed whether these methods were successful in decreasing thevulnerability and new methods were suggested which can be adopted for future construction.
Table 3-5 Generated Results and Input ProvidedInput Data Output ResultsBuilding foot print map Building Density MapContour Map Digital Elevation ModelDigital Elevation Slope and Aspect MapsGPS points and Satellite Imagery Surveyed Building Point MapSlope, Land Stability and Building Density Map Hazard MapWard Map and Population Data Population Density MapHAZUS methodology and Identified Building Types Building Damage Probability

EARTHQUAKE BUILDING VULNERABILITY AND DAMAGE ASSESSMENT, SIKKIM EARTHQUAKE, 2011
27
3.5. Database Preperation
3.5.1. Preparation of Satellite ImageryHigh resolution satellite imagery, particularly Cartosat-1, Cartosat-2 and others as given in Table 3.1 wereacquired to: 1) assess damage to built environment with respect to ground condition and 2 ) preparebuilding foot print maps in the study area. Before using these images for preparing foot print maps, theseimages have to be geometrically corrected. Cartosat-1 image stereo pairs were orthorectified using X andY reference points from Google earth and the Z values are considered from the SRTM 90 m resolutiondata. Using Leica Photogrammetry suite in Erdas Imagine 9.3, the ortho rectification was done with a totalRMS error of 0.74 m. Using orthorectified Cartosat-1 imagery as reference image other images weregeometrically corrected. These images were analysed to assess damage to the buildings with respected tolocal geology and geomorphology with the support of field verification. For building foot printpreparation, these images were clipped using the Gangtok municipal boundary shape file in ArcGIS.
Figure 3-2 Cartosat-2 2011

EARTHQUAKE BUILDING VULNERABILITY AND DAMAGE ASSESSMENT, SIKKIM EARTHQUAKE, 2011
28
Figure 3-3 Cartosat-1 2007
Figure 3-4 Cartosat-1 2011 Figure 3-5 Geoeye

EARTHQUAKE BUILDING VULNERABILITY AND DAMAGE ASSESSMENT, SIKKIM EARTHQUAKE, 2011
29
3.5.2. Homogenous Area MappingThe main idea of homogenous area mapping is to identify a small unit, in which all types of buildings canbe represented in Gangtok area. Arithang ward, which is located in the centre of Gangtok and close tomajor commercial zone, is selected as the unit for homogenous area mapping. Then using the Googleearth Geo-eye Image, the outline for the buildings were digitised. As the building foot print map ofGangtok region for the year 2004 was already available, that data was verified against the prepared foot-print map and good match was observed, therefore, it was decided to use the existing building foot printmap. Since these foot print maps were prepared from aerial photographs, there was slight shift in thebuilding outlines which was considered as negligible. However, in the outskirt of the city area, in somewards, additional buildings were observed on 2011 data compared to 2004 building foot-print map. In thecity centre areas very little additional built up areas were observed therefore building foot print of 2004was considered for all analysis.
Figure 3-6 Digitisation of Buildings on Geoeye image

EARTHQUAKE BUILDING VULNERABILITY AND DAMAGE ASSESSMENT, SIKKIM EARTHQUAKE, 2011
30
4. STUDY AREA
4.1. IntroductionState of Sikkim with lateral extent varying from
with a total area of around 7096 km2 lies in the north eastern part of India. It is entirely amountainous state consisting of steep slopes, complex geology and number of important tectonic featuressuch as MCT and MBT in close proximity. The entire state is located in the seismic zone IV and itscapital, Gangtok city is located on the flat areas of an elongated NNE trending ridge. The city has furtherexpanded to both the slopes of the ridge/hill. Population of the city is mixed with both local as well asmigrated population from other parts of country. In recent times it has emerged as an important touristdestination attracting a lot of tourist, thus adding to the population at risk in the event of an earthquake.Elevation of the state varies from 244 m at south to 8534 m in North (Bhasin et al., 2002). The altitude ofthe state plays a major role in controlling the climate. It experiences usual Himalayan mountain climate ofwarm summers and cold winters. North part of Sikkim due to its high altitudes and mountains gets highsnow fall in winters. Region receives average annual rainfall of around 3494 mm in about 164 days of theyear (UDHD, 2011).
Figure 4-1 Gangtok Location and Municipal Ward Boundary

EARTHQUAKE BUILDING VULNERABILITY AND DAMAGE ASSESSMENT, SIKKIM EARTHQUAKE, 2011
31
4.2. Geographical Location and AreaGangtok, the state capital of Sikkim, is also the district head quarters of East district and is one of themain tourist destinations of the country. It is located on the steep slopes of Sikkim Himalaya with itsextents lying between East 88 88 27° 21average altitude of 1,667m above mean seal level. The area of Gangtok is around 19.62 km2 (SPA, 2011)
4.3. Geology and SoilThe rock types of Gangtok region mainly consists of phylites, schists and gneissic rocks of Daling Groupand Lingtese granitoid gneiss and due to high monsoonal rainfall and structurally disturbed nature of thearea, rocks are highly weathered at many places. Because of the high weathering and erosion there arefrequent landslides in the region. The soil is developed from schist and gneissic group of rocks and ischaracterized by coarse loamy type of soil with surface stoniness and susceptible to high erosion. Theheavy rainfall also results in heavy soil erosion in the region (Bhasin et al., 2002; Kumar Nath, 2004;Sharma et al., 2011).
Figure 4-2 Geology Map of Gangtok MMG Dept. (2008)

EARTHQUAKE BUILDING VULNERABILITY AND DAMAGE ASSESSMENT, SIKKIM EARTHQUAKE, 2011
32
4.4. TopograpghyGangtok city is located on flat top of a ridge oriented in NE-SW direction and sloping down in NW-SEdirection. City has grown in a linear fashion along the ridge line. It has also started growing towards theNW direction as the slope on west side of the hill has a gentle slope than other side. Because of this kind
infrastructure like water supply and sewerage systems are also located on one side of hil l slope thusaffecting the slope stability of the region.
Figure 4-3 Panoramic View of Gangtok and growth along its Ridge Line along N-S direction
Figure 4-4 Sections through Gangtok Ridge showing its gentler western slope (SPA, 2011)

EARTHQUAKE BUILDING VULNERABILITY AND DAMAGE ASSESSMENT, SIKKIM EARTHQUAKE, 2011
33
Figure 4-5 Contour Map and Digital Elevation Model showing its gentler western slope

EARTHQUAKE BUILDING VULNERABILITY AND DAMAGE ASSESSMENT, SIKKIM EARTHQUAKE, 2011
34
Figure 4-6 Aspect and Slope Map showing its gentler western slope

EARTHQUAKE BUILDING VULNERABILITY AND DAMAGE ASSESSMENT, SIKKIM EARTHQUAKE, 2011
35
4.5. Land StabilitySince the Gangtok lies on the steep slopes, the stability of land plays a very important role in planning andconstruction. Based on parameters as listed in Table 4-1, Mines, Minerals and Geology Department ofGovernment of Sikkim, divided the land into six categories based on their level of stability. They haverecommended certain heights of buildings permissible in these areas.
Table 4-1 Factors - Land stability mapMMG Dept. (2008)FactorsGeology and Geotechnical ParameterSlope with AspectRainfall PatternLand use/Land coverHydrology and Ground waterSeismicitySoil type and Rock ErodabilityVegetation
Table 4-2 Permissible Number of FloorsMMG Dept. (2008)
Condition PermissibleFloors
% of Land
Very Stable 5 ½ 20Stable 4 ½ 29Relatively Stable 3½ 24Relatively Un-Stable
2 ½ 18
Un-Stable 1 ½ 5Very Un-Stable 0 4
Figure 4-7 Land Stability Map (MMG Dept. 2008)

EARTHQUAKE BUILDING VULNERABILITY AND DAMAGE ASSESSMENT, SIKKIM EARTHQUAKE, 2011
36
0
50,000
100,000
150,000
1951 1961 1971 1981 1991 2001 2011
4.6. Population and HouseholdGangtok, the state capital and district headquarter of East district, is the major urban area in the state ofSikkim. It attracts large number of tourists throughout the year because of its scenic beauty and proximityto snow clad mountains of Himalaya. Because of tourism and administrative activities, Gangtok hasemerged as the main centre of economic activity and attracts people from all over the state foremployment opportunities and better infrastructure. The growth of population is very high in the lastdecade. According to the Census of India, 2011, Gangtok municipal area population is 105,196 and thenumber of households is 27,464. Due to migration from other parts of Sikkim and increase in tourismactivities, Gangtok population exploded in the last 10 years with an increase of 258.37 %, which isextremely high.
Table 4-3 Gangtok Population Data (UDHD, 2011)
Year Population Growth rate1951 2,7441961 6,848 149.561971 13,308 94.331981 36,747 176.131991 25,024 -31.92001 29,354 17.32011 105,196 258.37
The negative growth as shown in 1991 is due to the reduction of the Gangtok municipality area. The areaof Gangtok municipality was reduced into a smaller area and divided into 15 municipal wards. The detaillist of population at ward level, with area and population density is given in Table 4-4 and Figure 4-8
Table 4-4 Gangtok Ward Population, Area and Density (UDHD, 2011)
S.No. Ward Name Area (Km2) Ward Total Persons / Km2
1 Deorali 0.282 7402 26248.232 Daragaon 1.1492 12407 10796.213 Tadong 1.3861 10049 7249.834 Ranipool 1.0872 4159 3825.425 Arithang 0.348 9333 26818.96 Burtuk 4.3621 8109 1858.967 Chandmari 2.9813 5975 2004.158 TathangchenSyari 2.3909 9117 3813.209 Lower Sichey 3.1619 5671 1793.5410 Upper Sichey 0.7222 8640 11963.4511 Development Area 0.7398 9244 12495.2712 Upper M.G.Marg 0.1291 2800 21688.6113 Lower M.G.Marg 0.13412 4110 30644.2014 Tibet Road 0.2768 2914 10527.4615 Diesel Power House 0.1752 5266 30057.08
Total 19.626 105196 5360.033

EARTHQUAKE BUILDING VULNERABILITY AND DAMAGE ASSESSMENT, SIKKIM EARTHQUAKE, 2011
37
Figure 4-8 Ward level population density map
The density map shows the high population density at the centre of city close to the ridge line and itdecreases as the distance from the ridge line increases. City Mobility Plan of Gangtok claims that around2, 00,000 tourists visit Gangtok every year which increases burden on the city and population exposure toearthquake hazard also increases.
Due to steep population growth in Gangtok, there was a lot of demand for housing. In order to meet thisdemand, the buildings at the city centre became taller in already high density areas and also constructionactivity spread to the out skirts of the city with low rise buildings in the low density area. Due to changingrequirements, buildings at the city centre which were designed for low to mid rise structure, wereconverted into high rise by adding number of floors to the existing structures.
Table 4-5 Number of Households and growth rate (UDHD, 2011)
. Type of StructureYear Population Household Growth% Permanent Growth% Temporary Growth%1991 25,024 7103 5094 20092001 29,354 9655 25.52 8244 31.5 1411 -5.982011 105196 27464 178.09 25554 173.1 1910 4.99
Persons/km2

EARTHQUAKE BUILDING VULNERABILITY AND DAMAGE ASSESSMENT, SIKKIM EARTHQUAKE, 2011
38
The 2011 data shows the unprecedented growth between 2001 and 2011, and increase in number ofpermanent structures in the city. The growth rate of concrete to wooden and other lighter materialstructures in the last decade shows the improvement in economic condition of people and the kind ofbuildings they prefer to live. As per UDHD (2011), there are 1650 houses that come under slums orinformal construction, which is around 6% of building stocks in the city.
Table 4-6 Number of Households at ward level
S.No. Ward Name Households %1 Deorali 1749 6.362 Daragaon 1224 4.453 Tadong 2057 7.484 Ranipool 1638 5.965 Arithang 2220 8.086 Burtuk 1182 4.307 Chandmari 2447 8.908 TathangchenSyari 929 3.389 Lower Sichey 2100 7.6410 Upper Sichey 898 3.2611 Development Area 2060 7.5012 Upper M.G.Marg 2989 10.8813 Lower M.G.Marg 2596 9.4514 Tibet Road 1133 4.1215 Diesel Power House 2242 8.16
Total 27464 100
Figure 4-9 Building Density Map
Buildings/km2

EARTHQUAKE BUILDING VULNERABILITY AND DAMAGE ASSESSMENT, SIKKIM EARTHQUAKE, 2011
39
4.7. Building Distribution-31 passes through Gangtok City. National Highway passes from south to
north of Gangtok along its ridge line. All other roads are connected to the highway and runs to interiorsof city away from the national highway. Most of the important structures are situated along the highway.Buildings have been built along the national highway and started moving towards valley in the westernside away from the Highway
(A) (B)
Figure 4-10 Mid-rise Concrete Frame Building Types in Arithang Ward
Figure 4-11 Building Distribution and Road Network

EARTHQUAKE BUILDING VULNERABILITY AND DAMAGE ASSESSMENT, SIKKIM EARTHQUAKE, 2011
40
4.8. Land-Use/ Land-Cover DistributionGangtok has mixed land-use/ land-cover pattern due to the unplanned development. As not much land isavailable for expansion, the growth of city is highly concentrated along its only lifeline, national highwayrunning through mainly western slope of the region. Based on the need and availabili ty, land is allocated todifferent uses. All public and semi-public spaces, commercial, retail activities and residential complexes arethe major land uses found in the city. And as we move away from the national highway, the building usechanges to mostly residential. The military areas are usually considered as the restricted areas which arelocated at the north and the south extents of the city, which are now blocking the growth of city along itslength and forcing city to grow towards the slopes nearer to the river.
Table 4-7 Land- use classification and area ( SPA, 2011)
S.No. Land use Land Cover % Area( km2)1 Residential 23 4.4162 Commercial 4 0.7683 Industrial 2 0.3844 Public and Semi-Public 8 1.5365 Recreational 4 0.7686 Transport 11 2.1127 Cultivation 5 0.968 Undeveloped 28 5.3769 Vacant 7 1.34410 Restricted Area and Forest 8 1.536
Total 100 19.6
4.9. The Sikkim Building Regulation Act 1991
As per the recommendations given by the Mines, Minerals and Geology Department, Government ofSikkim, and the sanction of plans and permissions for construction by the Urban Development andHousing Department, the maximum height of building permitted is 5 ½ storeys. The permissible coveredarea and set back are given below in the Table 4-8.
Table 4-8 Permissible Built-up-Area and Set backs
Plot Area Permissible Built-up area
> 2700 ft2 and < 5400 ft2 70% of plot area
> 5400 ft2 and < 10000 ft2 50% of plot area
> 10000 ft2 40% of plot area
Setback
Plot Area Required Setback
<2700 ft2 Minimum 27 feet away from the centre of the road
> 2700 ft2 10 feet from road and 3 feet on other sides

EARTHQUAKE BUILDING VULNERABILITY AND DAMAGE ASSESSMENT, SIKKIM EARTHQUAKE, 2011
41
4.10. Description of Study WardFor identifying the building types in the study region, Arithang ward was selected as basic unit. The wardis located close to the main core of the Gangtok city. The area is characterized by different kind ofbuildings ranging from slums to major commercial buildings. Major commercial buildings are locatedalong the national highway which passes along the ward boundary on the east side of the ward.
Arithang has around 2220 households which are around 8% of Gangtok total households. The populationof Arithang ward is 9333 and it covers an area of 0.348 km2 which makes it one of the densely populatedareas in Gangtok. Figure 4- 12 shows the location of Arithang Ward in Gangtok and the location of thenational highway.
Figure 4-12 Location of Arithang Ward
4.10.1. Identified Building typesThe major building typology identified in the Gangtok region are mid rise structure 5-7 storeys , but thebuildings ranges from 1 and up to 12 storeys in few areas. The material used for construction is mainlyconcrete, and buildings are also constructed with wood, bamboo, asbestos etc. Details of identifiedbuilding types are given below.

EARTHQUAKE BUILDING VULNERABILITY AND DAMAGE ASSESSMENT, SIKKIM EARTHQUAKE, 2011
42
4.10.1.1. Traditional houses - Ekra housesThese are single- or two-storied huts built with a wood frame as main structural features along withcolumns and roof beams. Light metal sheets like asbestos are used as roofing material supported by thewooden frame. The in fills between wooden columns are cross-woven Ekra or bamboo spilt matting andthese are plastered with mud or cement. In some cases these are replaced by half-brick thick burnt claybrick un-reinforced masonry walls. In few cases the metal or asbestos sheets or plywood planks are alsoused instead of Ekra mats. These are usually ranging from 1-2 storeys as they are not strong enough forhigh rise construction. In most of these buildings, the wooden roofs are replaced by the asbestos sheets asthey are much more resistant and durable in monsoon seasons.
(A) (B) (C)Figure 4-13 Ekra Traditional Building Types in Arithang Ward
Figure 4-13 shows the Ekra type of constructions in the Arithang ward. Figure 4-13 A show the twostorey Ekra construction with traditional wooden roof. The extension from the roof at second floor levelis to protect the building walls from rains. Figure 4-13 B shows the buildings with bamboo woven matscovered by the cement plaster. Figure 4-13-C shows the bamboo woven mats between the woodencolumns with mud plaster and the asbestos sheet roofs. These are considered as HAZUS class W1.
4.10.1.2. Asbestos - temporary structures.These are similar to the Ekra type construction but these are much more temporary and very light inweight. These are just bamboo posts and beams and connected by the asbestos sheets.
(A) (B) (C)Figure 4-14 Asbestos Building Types in Arithang Ward
4.10.1.3. Un -reinforced Masonry Structures.These structures are single-storeyed un-reinforced brick, stone or concrete block masonry withoutearthquake resistant features. The horizontal bands which tie these walls are rarely seen in these buildings.The infill material vary based on several building materials as random rubble masonry (RRM), cementconcrete blocks un-burnt brick etc, and these are joined by the cement mortar. The roof is either flatconcrete slab or sloping asbestos roofs supported by un-reinforced masonry constructions

EARTHQUAKE BUILDING VULNERABILITY AND DAMAGE ASSESSMENT, SIKKIM EARTHQUAKE, 2011
43
(A) (B) (C)Figure 4-15 Un-reinforced Masonry Building Types in Arithang Ward
Figure 4-15 shows the un-reinforced masonry type structures in the Arithang Ward. Figure 4-15 A and Bshow the building with un-reinforced masonry and asbestos sloping roof supported by these walls, Figure4-15 C shows the flat slab roof resting on the un-reinforced masonry with wide openings for windows anddoors which make these much weaker. These falls under HAZUS class C3L.
4.10.1.4. Low-rise Concrete frame structuresThese structures are single or double storeyed, where the masonry walls are used as infill material betweenconcrete columns. The first floor of the buildings is generally made of concrete and the roof is eitherconcrete flat slab or sloping asbestos light roof material. The walls are built from floor to roof withopenings as required. No horizontal tying between columns except at beam level and the openings are notsupported by lintel and sill level beams. Sometimes the ground floor is made of concrete frame with un-reinforced masonry infill and first floor is built as traditional Ekra type. These are considered as HAZUSbuilding type C3L.
(A) (B) (C)Figure 4-16 Mid-rise Concrete Frame Building Types in Arithang Ward
Figure 4-16 A shows the un-reinforced masonry walls constructed without any tie beams and notbetween the columns but at the end of slab/floor. Figure 4-16-B shows the building with concrete slab onfirst floor and the light asbestos roof on the second. Figure 4-16-C shows the mix type construction withconcrete and masonry in ground and Ekra in first floor.
4.10.1.5. Mid -rise Concrete frame structuresThese are the most predominant kind of constructions seen in Gangtok region. These range from 3 to 7floors. The frame is built with concrete and walls are constructed without any structural features. Thesecan be mainly seen in the areas of high population density. Most of these buildings have 230 mm X 230mm columns with half brick thick walls. The roof is generally sloping asbestos roof and the slabs areconcrete. Openings are not usually supported by structural members. Based on the availability of space thebuildings are constructed in odd shapes and with setbacks or projection on upper floors. Most of thebuildings are constructed without any gap between them. Due to the construction on slopes, these haveirregular column heights and frames are not symmetrical either.

EARTHQUAKE BUILDING VULNERABILITY AND DAMAGE ASSESSMENT, SIKKIM EARTHQUAKE, 2011
44
(A) (B) (C)Figure 4-17 Mid-rise Concrete Frame Building Types in Arithang Ward
Figure 4-17 A, B, C shows the mid rise concrete frame structure constructed with projections in the topfloor and no gap between structures. This lack of gap can lead to the pounding affect between buildings inmajor earthquakes. These are considered as HAZUS building type C3H.
4.10.1.6. High -rise Concrete frame structuresStructures which are more than 7 floors are considered as high rise constructions. There are manybuildings more than 7 floors in Gangtok, which are not allowed as per the rules. These also have similarsize columns as low rise and mid rise, but they have to take the load of 8-12 floors, which make these veryhighly vulnerable. These are considered as HAZUS building type C3M.
Figure 4-18 High-rise Concrete Frame Building Type in Arithang Ward
Figure 4-18 shows the 8 storey building without any seismic design considerations. Thin columns, wallswithout any tying, stand independent of columns and there are openings without any support, and are alsoirregular in shape. Figure 4-19 shows the building material used for construction.
Majority of the construction uses concrete followed by wood and bamboo. Few buildings are even builtwith asbestos. It is clearly seen that all the buildings which are built with wood, bamboo or asbestos aresmaller in size and have less number of floors compared to concrete buildings. Figure 4-20 shows thenumber of buildings in the study ward. Majority of buildings with higher number of floors are closer tothe national highway.

EARTHQUAKE BUILDING VULNERABILITY AND DAMAGE ASSESSMENT, SIKKIM EARTHQUAKE, 2011
45
Figure 4-19 Building Material used in Arithang Ward buildings
Figure 4-20 Number of Floors in Arithang Ward

EARTHQUAKE BUILDING VULNERABILITY AND DAMAGE ASSESSMENT, SIKKIM EARTHQUAKE, 2011
46
Table 4-9 gives the details of number of buildings with number of floors. Majority of buildings are with1-4 floors, followed by buildings with 5-6 floors and very few have 7 floors and 1 building of 8 floors.
Table 4-9 Building Details
Number of Buildings Number of Floors184 1113 2114 3125 486 530 67 71 8
The majority of buildings in the ward are privately owned and few buildings are owned by governmentand used for official purpose. Figure 4-21 shows the buildings which are owned by government and whichare owned by private people. Most of the privately owned buildings are for residential usages and fewcommercial buildings. There are few hotels and guesthouses in the area as Gangtok is a major touristdestination and there is a lot of income generated by these hotels in peak seasons. Map indicates that thesebuildings are situated next to the national highway. Arithang ward is situated very close to the city centreand commercial areas, and vehicles have to pass through this region to reach there. There is no properland use plan prepared before hand, the buildings are distributed randomly throughout the area and havedifferent building usage.
Figure 4-21 Building Ownership in Arithang Ward

EARTHQUAKE BUILDING VULNERABILITY AND DAMAGE ASSESSMENT, SIKKIM EARTHQUAKE, 2011
47
Figure 4-22 Building Use in Arithang Ward
Figure 4-23 Building Density Map in Arithang Ward
Buildings/km2

EARTHQUAKE BUILDING VULNERABILITY AND DAMAGE ASSESSMENT, SIKKIM EARTHQUAKE, 2011
48
Figure 4-24 Degree Slope MapArithang ward is one of the high population density area in the Gangtok region. Figure 4-23 and Figure 4-24 shows the building density and slope map of the ward respectively. It is clearly seen that the steep sloperegions in the south part of the ward are not highly populated compared to the central region which iscomparatively flat.

EARTHQUAKE BUILDING VULNERABILITY AND DAMAGE ASSESSMENT, SIKKIM EARTHQUAKE, 2011
49
5. DAMAGE ASSESSMENT AND REMEDIAL MEASURES
5.1. IntroductionAs discussed in Chapter-1, wide spread damage to built environment was reported from different parts ofSikkim. In order to assess the building damage due to both structural causes and foundation (terrain)related causes, field investigation was carried out in different parts of the north Sikkim district within adistance of 40 to 80 km from the epicentre. Different distance zones in terrain conditions were covered inorder to assess damage in geological and terrain set up. This is referred as damage assessment at macrolevel for making general assessment on different structural, non-structural failures and failures due todifferential ground acceleration. Building characterisation, modelling and damage prediction was carriedout in detail at ward level for Gangtok city which was considered to be at at high risk. Field investigationwas carried out for 21 days: 7 days were spent for damage assessment in Mangan, Chungthang, Lanchungand Lachen areas of North Sikkim and 14 days were for spent in Gangtok for collection of relevant data.
5.2. Damage assessment at macro levelThe M 6.9 earthquake caused severe ground shaking and around 300 hundred new slides have beenreported after the earthquake which caused severe damage to the roads and buildings (NRSC, 2011).Elevation of the state varies from 244 m at south to 8534 m in North (Bhasin et al., 2002). Due to steepslopes and high elevation of the state, the region is prone to landslides. National highway 31 whichconnects Gangtok to west Bengal and National 31 A which connects Gangtok and North Sikkim has beenseverely damaged because of the landslides. Compared to the east district, north district is more affectedin the earthquake as north district is situated closer to the epicentre. The landslides affected theaccessibility to these places because of the road blockage by heavy landslides and rock falls. Locations ofmajor towns in North District and Gangtok are shown in the Figure 5-1. Even after a month after theearthquake, few places were not accessible by road at the time of our visit and the damages in these areaswere still not known. Mangan town is not that severely affected as compared to Chunthang. Location ofMangan and other areas visited in field shown in Figure 5-1.
Figure 5-1 Sikkim Map showing areas visited during field and location of Epicentre

EARTHQUAKE BUILDING VULNERABILITY AND DAMAGE ASSESSMENT, SIKKIM EARTHQUAKE, 2011
50
Figure 5-2 Sattelite Images showing chunthang and new landslides post earthquake
Figure 5-3 Figure Showing the chunthang area and new landsidesFrom all the areas visited, Chunthang area has experienced highest number of damages in the earthquake.Located at the point where Lachen and Lachung rivers meet and turn into Teesta River, the major river inthe state of Sikkim shown in Figure 5-2 and Figure 5-3. Because of the river, there are lot of colluvialmaterial; the soil in area is very soft and sandy in nature. Many of the buildings experienced extreme tocomplete damage level.
A
C
B

EARTHQUAKE BUILDING VULNERABILITY AND DAMAGE ASSESSMENT, SIKKIM EARTHQUAKE, 2011
51
(A) (B)
Figure 5-4 Figure Showing the damaged building in Chunthang
Figure 5-4 shows school building damaged in Chunthang area. Several buildings are of the same damagestates as shown in the figure. Figure 5-4 A and B shows the building in which couple of floors gotpancaked as the columns were weak, not supported by shear walls and resulted in complete failure. Alsopart of the building was resting on a detrital rock (transported large boulder) which might haveexperienced severe shaking as it is located on soft soil.
Figure 5-5 River Terraces and Settlements
Figure 5-5 shows the colluvial deposits of the Teesta River. The buildings lying on this type of groundexperience more damage than buildings on rock sites. These deposits are constantly cut by the flowingriver, and houses constructed on these deposits made vulnerable.

EARTHQUAKE BUILDING VULNERABILITY AND DAMAGE ASSESSMENT, SIKKIM EARTHQUAKE, 2011
52
(A) (B)
Figure 5-6 Figure Showing the chunthang area and new landsidesFigure 5-6 A and B shows the scale of rock slides due to earthquake causing blockage of roads.
Figure 5-7 Road damaged by landslides.

EARTHQUAKE BUILDING VULNERABILITY AND DAMAGE ASSESSMENT, SIKKIM EARTHQUAKE, 2011
53
5.3. Damage Assessment at Micro LevelIn the Sikkim earthquake of M 6.9 in 2011, buildings were severely shaken with an intensity of VI on MMIscale, particularly those on the edge of the cliff and steep slopes causing wide spread panic and distress.Majority of the buildings are of made up of concrete with column pillar structure and masonry walls. Asper the data from government sources, approximately 27,464 households occupy 25,554 permanentstructures (Table 4-5). Around 17000 households were added in last 10 years, which shows the rate ofgrowth in the city is very hAs a result wide spread damage was reported from the Gangtok city alone and similar
Table 5-1 Damage Report at Ward level according to building type(Source: Municipal Corporation Gangtok)
Sl. No Ward Type of house Type of house
Pucca Kutcha
100% Severe Major Minor 100% Severe Major Minor Total
1 Burtuk - 2 22 148 - 5 4 154 335
2 Lower Sichey - 8 53 123 - 1 12 83 280
3 Upper Sichey 6 9 35 71 2 3 40 53 219
4 Chandmari - 2 158 4 - 41 113 42 360
5 Development area 2 1 7 26 - 2 - 22 60
6 Diesel power house - 1 3 22 - - 3 21 50
7 Arithang - 4 24 82 - - 5 20 135
8 Lower M.G Marg - - 2 35 - 1 2 - 40
9 Upper M.G Marg - - 1 - - - 19 - 20
10 Tibet road - - 4 37 - - 1 1 43
11 Deorali - 2 9 53 - 1 3 5 73
12 Daragaon - 3 70 67 - 7 39 4 190
13 Tadong 3 7 79 299 - 5 77 50 520
14 Ranipool - - 130 - - - 159 5 294
15 Syari - 11 28 151 3 10 11 214
Total 11 50 625 1118 2 69 487 471
Grand total 2833
In consultation with local authorities, severely damaged different types of buildings were selected forinspection/survey covering sample areas in Gangtok city across ridge to valley and length of the city. Outof all surveyed buildings, selected buildings of different types representing HAZUS classes were describedin detail. Figure 5-8 shows the location of identified buildings where damage assessment was carried outsuch as Police head quarters, Sikkim secretariat, a residence in Development area, a hotel building and agovernment degree college.

EARTHQUAKE BUILDING VULNERABILITY AND DAMAGE ASSESSMENT, SIKKIM EARTHQUAKE, 2011
54
Figure 5-8 Identified buildings in Gangtok city
5.4. Damage in BuildingsGangtok city situated mainly on the western slope of the hill has buildings constructed with different typeof building material and styles. The buildings are predominantly medium-rise concrete frame structures asdescribed in the study area, followed by low-rise concrete frame structures, masonry structures andtraditional Ekra type buildings. It is observed that most of the buildings have suffered hairline cracks inthe infill walls. In poor quality constructions, the damages are seen from moderate to extreme where theyhave developed major cracks. The cracks are generally observed on the wall and column joints at thecorners and at the corners of the openings. Few buildings have diagonal and horizontal cracks extendingthroughout the wall and in few cases walls have completely collapsed. The columns have failed in fewstructures where the shear walls are absent and this type column failure was observed in lower floors ofthe structures. It is also observed in the whole Gangtok area, that buildings on the down slope of the roadhave suffered more damage compared to the buildings constructed on the upslope of the road. Thedamage in the buildings on the down slope is mainly found in the lower floors, where buildings areattached to the road. Since the ground below the road and building are mostly filled up ground, that canexperience lateral spreading thus developing cracks on the overlaying structure. Although very few totalcollapse and deaths have been reported, most of the buildings have suffered damages of different states .
Holy Cross School
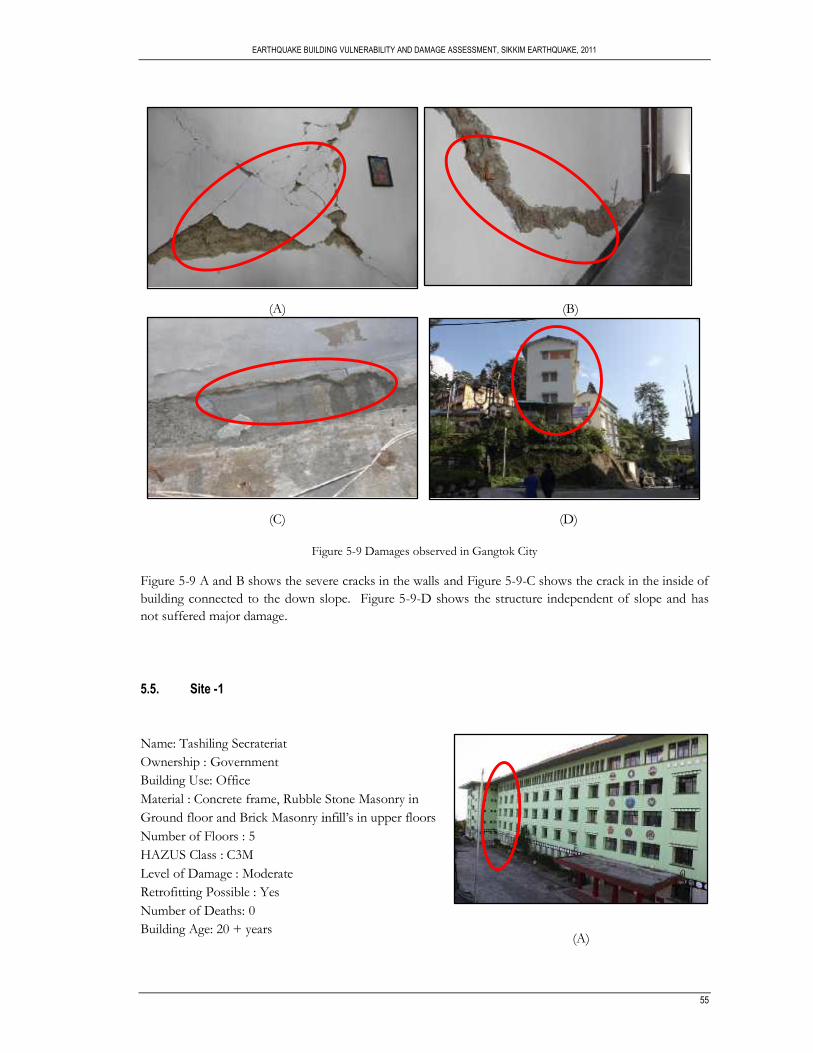
EARTHQUAKE BUILDING VULNERABILITY AND DAMAGE ASSESSMENT, SIKKIM EARTHQUAKE, 2011
55
(A) (B)
(C) (D)
Figure 5-9 Damages observed in Gangtok City
Figure 5-9 A and B shows the severe cracks in the walls and Figure 5-9-C shows the crack in the inside ofbuilding connected to the down slope. Figure 5-9-D shows the structure independent of slope and hasnot suffered major damage.
5.5. Site -1
Name: Tashiling SecrateriatOwnership : GovernmentBuilding Use: OfficeMaterial : Concrete frame, Rubble Stone Masonry inGround floor and Brick Masonry in upper floorsNumber of Floors : 5HAZUS Class : C3MLevel of Damage : ModerateRetrofitting Possible : YesNumber of Deaths: 0Building Age: 20 + years
(A)

EARTHQUAKE BUILDING VULNERABILITY AND DAMAGE ASSESSMENT, SIKKIM EARTHQUAKE, 2011
56
(B) (C)Figure 5-10 Damages in Secretariat Building
Question Observation
1 Is the building irregular in plan No2 Are the columns regularly distributed Yes3 Are both building directions adequately braced No4 is > 2.5 No5 Does the building possess eccentric cores (staircases or elevators) Yes6 Does the building have a soft storey No7 Is the building irregular in elevation caused by setbacks of upper stories No8 Does the building have cantilevering upper stories No9 Does the building possess a heavy mass at the top or at roof level No
10 Are pounding effects possible Yes11 Does the building have short columns No12 Are strong beams weak columns available Yes13 Does the building possess shear walls No14 Did the building suffer any significant structural damage in the past No15 Does the building possess seismic retrofitting or strengthening measures No
Damage Description
Sikkim Government Secretariat, the main centre for states government administration was closed downdue to the damage it suffered in the earthquake. Major damage has occurred in the ground floor to thestone masonry walls and columns at the junction of two buildings. As shown in the Figure 5-10 A, thefront long building and back horizontal structure moved in different direction which resulted in the majordamage at the junction as shown in shown in the Figure 5-10 B and 5-10 C. Due to improper tying ofreinforcement and due to pounding affect, the building suffered damages. No major damage was seen inthe upper floor other than few cracks in infill walls, but the ground floor walls have been severelydamaged. Building has sustained several earthquakes in the past and requires major retrofitting.

EARTHQUAKE BUILDING VULNERABILITY AND DAMAGE ASSESSMENT, SIKKIM EARTHQUAKE, 2011
57
5.6. Site -2
The grey colour building is referred as building B and the white colour building is referred as building Cfor explanation.
Name: Private ResidenceOwnership : PrivateBuilding Use: Residential
Number of Floors : Building B 6Building C- 3
HAZUS Class : C3MLevel of Damage : CompleteRetrofitting Possible : NoNumber of Deaths: 4Building Age: 15 + years
(A)
(B) (C)Figure 5-11 Damaged buildings in Development area ward
Question ObservationB C
1 Is the building irregular in plan Yes Yes
2 Are the columns regularly distributed Yes Yes
3 Are both building directions adequately braced No No
4 Does the ratio between the Yes No
5 Does the building possess eccentric cores (staircases or elevators) No No
6 Does the building have a soft storey No No
7 Is the building irregular in elevation caused by setbacks of upper stories No No
8 Does the building have cantilevering upper stories No No
9 Does the building possess a heavy mass at the top or at roof level No No
10 Are pounding effects possible Yes Yes
11 Does the building have short columns No No

EARTHQUAKE BUILDING VULNERABILITY AND DAMAGE ASSESSMENT, SIKKIM EARTHQUAKE, 2011
58
12 Are strong beams weak columns available Yes Yes
13 Does the building possess shear walls No No
14 Did the building suffer any significant structural damage in the past No No
15 Does the building possess seismic retrofitting or strengthening measures No No
Damage Description
Two buildings located in the Balwakhani area of development ward suffered complete damage. Thesebuildings are situated on the steep slopes. 1st and 2nd floors of building B have collapsed as shown in theFigure 5-11 B and the roof of the top floor has completely failed. Walls are constructed at the end of slabwhich is at an offset from the columns. Due to shaking, the weight of whole building transferred to thefree columns in the bottom floors, which failed and building completely collapsed. In building C, due tothe weak columns in the ground floor, the back corner columns failed which made building to tilt andcaused damage to the building at the back as shown in the Figure 5-11 C. Both these buildings havesuffered extensive damage and have become inhabitable.
5.7. Site - 3
Name: Sikkim Police HeadquartersOwnership : GovernmentBuilding Use: OfficeMaterial : Concrete frame, Cement block Masonry
Number of Floors : 5HAZUS Class : C3MLevel of Damage : ModerateRetrofitting Possible : YesNumber of Deaths: 0Building Age: 9 years
(A)
(B) (C)Figure 5-12 Damages in Police Head quarters Building

EARTHQUAKE BUILDING VULNERABILITY AND DAMAGE ASSESSMENT, SIKKIM EARTHQUAKE, 2011
59
Question Observation
1 Is the building irregular in plan No2 Are the columns regularly distributed Yes3 Are both building directions adequately braced No4 Does the No5 Does the building possess eccentric cores (staircases or elevators) Yes6 Does the building have a soft storey Yes7 Is the building irregular in elevation caused by setbacks of upper stories Yes8 Does the building have cantilevering upper stories Yes9 Does the building possess a heavy mass at the top or at roof level Yes
10 Are pounding effects possible Yes11 Does the building have short columns No12 Are strong beams weak columns available Yes13 Does the building possess shear walls No14 Did the building suffer any significant structural damage in the past No15 Does the building possess seismic retrofitting or strengthening measures No
Damage Description
Sikkim police headquarters building has suffered slight damage in the earthquake. Even though majorityinfill walls have suffered high damage and ready to fail, the building is still operational and no repairs orretrofitting measures have been taken up even after one month of the event. The building is irregular inplan and have soft storey for parking. As shown in Figure 5-12 A, the building is irregular in elevation,with cantilever in 4th floor and setback in 5th floor. Heavy weights like dishes, batteries and otherequipment is placed on the top floor. Due to this, the part of ground floor under this part has sufferedsevere cracks in the walls. No damage is observed in the columns. Due to lack to tying of columns andwalls, at some places, the building walls were separated from the columns. All the walls can be repairedand retrofitted
5.8. Site -4
Name: Hotel Himanchuli Super ViewOwnership : PrivateBuilding Use: HotelMaterial : Concrete frame,Number of Floors : 7HAZUS Class : C3MLevel of Damage : SevereRetrofitting Possible : NoNumber of Deaths: 0Building Age: 15 + years
(A)

EARTHQUAKE BUILDING VULNERABILITY AND DAMAGE ASSESSMENT, SIKKIM EARTHQUAKE, 2011
60
(B) (C) (D)Figure 5-13 Damages in Hotel Building
Question Observation
1 Is the building irregular in plan No2 Are the columns regularly distributed Yes3 Are both building directions adequately braced No4 2.5 Yes5 Does the building possess eccentric cores (staircases or elevators) No6 Does the building have a soft storey No7 Is the building irregular in elevation caused by setbacks of upper stories Yes8 Does the building have cantilevering upper stories No9 Does the building possess a heavy mass at the top or at roof level No
10 Are pounding effects possible Yes11 Does the building have short columns No12 Are strong beams weak columns available Yes13 Does the building possess shear walls No14 Did the building suffer any significant structural damage in the past No15 Does the building possess seismic retrofitting or strengthening measures No
Damage DescriptionFirst floor of the building which have no shear walls and open columns has failed in the earthquake due tothe load of 5 floors onof rods in columns resulted in damage. The crushing of columns has occurred in all the columns of thefloor. Other top floors which have infill walls between columns supported them but in the first floor theywere absent. The size of each floor increased from ground to top floor, and top floors were constructedtowards the slope taking the support of the rock in the slope. In the building it was also observed that theouter walls were constructed at the end of slab and columns were inside the floor. Figure 5-13 B showsthe failed stirrup which opened up freeing the reinforcement bars. Figure 5-13 C shows the crushedcolumns and failed tie rods and Figure 5-13 D shows the irregularity in the elevation and increase of floorsize on the top.

EARTHQUAKE BUILDING VULNERABILITY AND DAMAGE ASSESSMENT, SIKKIM EARTHQUAKE, 2011
61
5.9. Site - 5
Name : Government Degree CollegeOwnership : GovernmentBuilding Use: EducationalMaterial : Concrete frame, Brick MasonryNumber of Floors : 2HAZUS Class : C3LLevel of Damage : ModerateRetrofitting Possible : YesNumber of Deaths: 0Building Age: 20 + years
(A)
(B) (C)Figure 5-14 Damages in Government College Building
Question Observation
1 Is the building irregular in plan Yes2 Are the columns regularly distributed Yes3 Are both building directions adequately braced No4 No5 Does the building possess eccentric cores (staircases or elevators) Yes6 Does the building have a soft storey No7 Is the building irregular in elevation caused by setbacks of upper stories No8 Does the building have cantilevering upper stories No9 Does the building possess a heavy mass at the top or at roof level No
10 Are pounding effects possible No11 Does the building have short columns No12 Are strong beams weak columns available No13 Does the building possess shear walls Yes14 Did the building suffer any significant structural damage in the past No15 Does the building possess seismic retrofitting or strengthening measures No

EARTHQUAKE BUILDING VULNERABILITY AND DAMAGE ASSESSMENT, SIKKIM EARTHQUAKE, 2011
62
Damage Description
Government Degree college is one of few buildings which have been repaired immediately afterearthquake. All the walls have suffered severe cracks. But these gaps have not been retrofitted. The gapswere opened and filled with cement to cover up the damage. The building is a part of the group ofstructures. All the corners at the opening have cracks and diagonal cracks have also been observed in fewplaces of the building. Figure 5-14 B and C shows the building with repaired cracks.
5.10. Repair and RetrofittingThe main aim of this section of the report is to provide simple design and structural consideration that canbe adopted by the local authorities and users which can increase the strength of the structure and decreasevulnerability. Damage from earthquakes can be controlled by adopting seismic design considerations at
incorporated in the process of strengthening the building to make it ready for the future events. Duetechnical considerations are required while selecting building sites and material for construction. Expertadvice need to be taken for restoration of a damaged building by retrofitting. Local authorities should bevery particular in such cases because, the buildings which have lost inherent strength cannot withstandfuture earthquakes and can result in complete damage of the buildings.
Buildings move in all directions during earthquakes. It is not very cost effective to design the building forall the forces, but horizontal movement should be addressed, which is the major cause of building damagein earthquakes. Structural systems like shear walls, slabs, columns, beams etc., should be properly bracedor tied, so that all of these act as systems together. If one of these systems fails, they tend to result insevere damages, or sometimes these result in complete collapse of the buildings. Some of the commondamages identified in all the buildings are summarized below.
5.10.1. Damages in Masonry WallsMost of the buildings used burnt bricks as masonry infill in reinforced concrete framed structure. Fewbuildings like Police head quarters have used hollow concrete blocks as infill materials. All of these wallswere observed to be untied with the concrete frame. As these are not connected, the columns and wallstend to shake differently which results in cracks and failures. Figure 5-15 shows new constructions whichdo not have any tie beams or rods between walls and columns
Figure 5-15 Unreinforced Masonry infill's
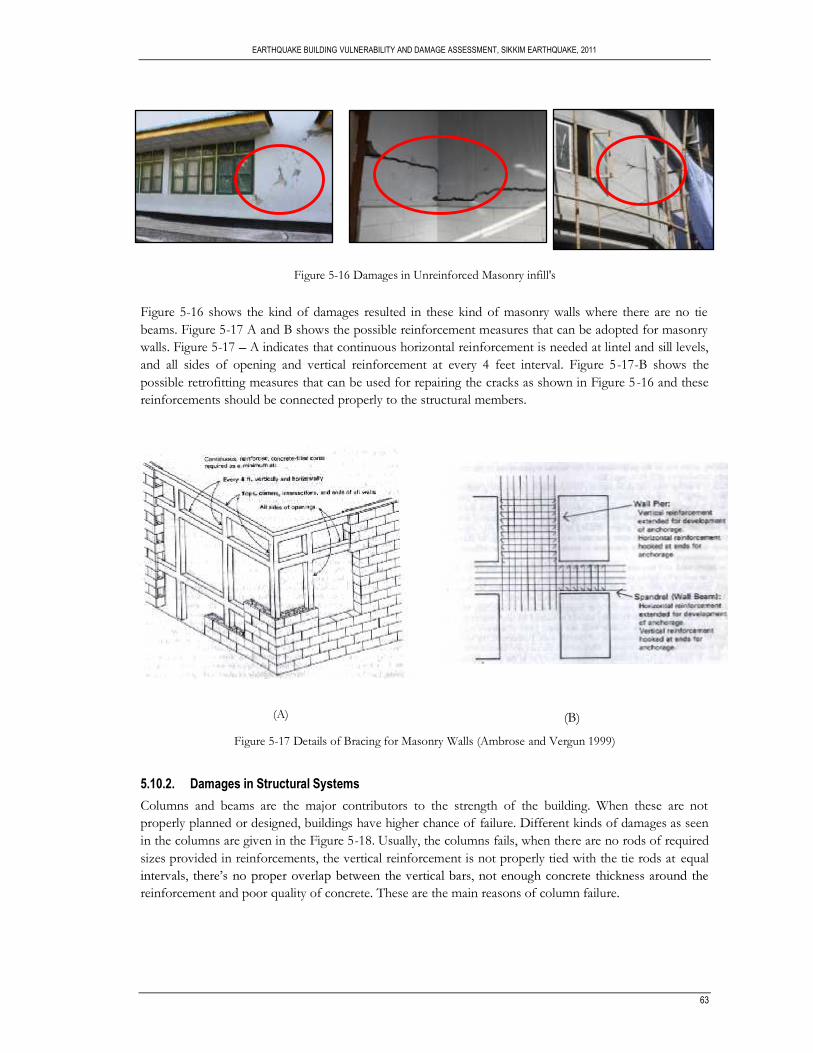
EARTHQUAKE BUILDING VULNERABILITY AND DAMAGE ASSESSMENT, SIKKIM EARTHQUAKE, 2011
63
Figure 5-16 Damages in Unreinforced Masonry infill's
Figure 5-16 shows the kind of damages resulted in these kind of masonry walls where there are no tiebeams. Figure 5-17 A and B shows the possible reinforcement measures that can be adopted for masonrywalls. Figure 5-17 A indicates that continuous horizontal reinforcement is needed at lintel and sill levels,and all sides of opening and vertical reinforcement at every 4 feet interval. Figure 5-17-B shows thepossible retrofitting measures that can be used for repairing the cracks as shown in Figure 5-16 and thesereinforcements should be connected properly to the structural members.
(A) (B)
Figure 5-17 Details of Bracing for Masonry Walls (Ambrose and Vergun 1999)
5.10.2. Damages in Structural SystemsColumns and beams are the major contributors to the strength of the building. When these are notproperly planned or designed, buildings have higher chance of failure. Different kinds of damages as seenin the columns are given in the Figure 5-18. Usually, the columns fails, when there are no rods of requiredsizes provided in reinforcements, the vertical reinforcement is not properly tied with the tie rods at equal
reinforcement and poor quality of concrete. These are the main reasons of column failure.

EARTHQUAKE BUILDING VULNERABILITY AND DAMAGE ASSESSMENT, SIKKIM EARTHQUAKE, 2011
64
Figure 5-18 Reinforcement failuresAll the columns, beams and slabs have to be properly connected with each other. Figure 5-19 shows thepoor connections between columns and beams, and columns and slabs etc. Symmetrical arrangement ofcolumns is also important for the structural stability.
Figure 5-19 Connection between Structural SystemsThe load of the buildings is transferred to the ground by columns. The load of slab is transferred bybeams to the columns. In case of shaking in earthquakes, the horizontal shaking of columns between thefloors is controlled by shear walls. These carry some weight from the slabs and beams and reduce load onthe columns and control horizontal motion. They are higher chances of columns to fail in the absence ofshear walls. These walls should be continuous between columns with minimum opening sizes. Figure 5-20shows the absence of shear walls in buildings.
Figure 5-20 Absence of shear walls

EARTHQUAKE BUILDING VULNERABILITY AND DAMAGE ASSESSMENT, SIKKIM EARTHQUAKE, 2011
65
In cases where shear walls cannot be provided and columns which suffered damage in earthquakes, use ofbraces is the recommended option. Vertical bracing is done by steel bars which connect columns andtransfers load and also control the horizontal movement in columns. Few examples of vertical bracing areshown in Figure 5-21
Figure 5-21 Vertical Bracing Systems (Ambrose and Vergun, 1999)
5.10.3. Construction on Sloping Sites.Enough precautions have to be taken before construction of buildings on sloping sites. Stabilization ofslope is very important to decrease the potential problems to buildings. Figure 5-22 shows the failure ofslope and the damage to the building. These unstable slopes are very dangerous and have high chances tofail anytime; Earthquake shaking is one of the reasons to trigger this failure. Figure 5-22- A shows the cutand fill of the slope to make the site flat, without any stabilization of down slope. Figure 5-22- B showsthe rotational slip possible due to the failure of down slope.
(A) (B)
Figure 5-22 Failure of Slope (Ambrose and Vergun 1999)

EARTHQUAKE BUILDING VULNERABILITY AND DAMAGE ASSESSMENT, SIKKIM EARTHQUAKE, 2011
66
So before construction, slopes have to be cut and filled to make the site flat and stabilize the slope. Thereshould be enough gap between the slope and the wall of the building, to let the building shake freely inearthquakes. Or else the joining areas of building and earth fail because both of these shake with differentfrequency and develop cracks at joints.
(A) (B)
Figure 5-23 Stabilisation of Slope. (Ambrose and Vergun 1999)
After stabilization of slope, the foundations have to be taken deep into the ground till it reaches the stiffsoil or solid rock. Since the rocks have higher shear wave velocities they tend to accelerate less, where asthe soft soil, that have lower shear wave velocities, experience amplification of ground motion, resulting inhigher damage to the buildings. Figure 5-24 A shows the detail of foundations on surface slope and Figure5-24 B shows the foundation taken deep to the stiff ground.
(A) (B)Figure 5-24 Foundations (Ambrose and Vergun 1999)

EARTHQUAKE BUILDING VULNERABILITY AND DAMAGE ASSESSMENT, SIKKIM EARTHQUAKE, 2011
67
6. ANALYSIS AND RESULTS
HAZUS building types W1, C3L, C3M, and C3H are identified building types present in the study area.Two seismic design codes for selected building types Low code and Pre code as specified by FEMA(2011) are used for generating damage probabilities for different site classes. Equations given by Kircheret al. (1997) were used for generating cumulative and discrete damage probabilities by using capacitycurves and damage probability parameters given in HAZUS technical manual (FEMA, 2011). The detailsteps of calculating damage probabilities are given in Annexure A of this report.
Based on the building material and number of floors, these buildings in the study area Arithang Ward wereassigned as per different HAZUS classes as shown in Figure 6-1. Based on the land stability map given byMines, Minerals and Geology Department, Government of Sikkim, number of floors are permitted foreach stability class as described in the Table 4-2. Table 6-1 shows total number of buildings and totalnumber of privately owned buildings in each HAZUS building type for Arithang ward and Table 6-2 givesthe number buildings which follow the bye-law and which violate them. Based on these values buildingswhich followed these bye-laws and which violated were identified and mapped as shown in the Figure 6-2.
Table 6-1 Number of buildings in each HAZUS class of Arithang ward
HAZUS Class Number of Buildings Number of privately owned buildings
W1 159 135
C3L 139 128
C3M 360 347
C3H 1 1
Table 6-2 Number of buildings following Byelaws
Bye-laws followed Number of Buildings
Yes 524
No 135
Figure 6-2, clearly shows that almost quarter of these buildings violates the bye-laws for permissiblenumber of floors, which make these buildings highly vulnerable and are highly prone to damage thanbuildings which follow municipal rules.

EARTHQUAKE BUILDING VULNERABILITY AND DAMAGE ASSESSMENT, SIKKIM EARTHQUAKE, 2011
68
Figure 6-1 Classified HAZUS building types in Arithang ward
Figure 6-2 Bye-Laws Violation (Height) followed in Arithang Ward
Bye-law
Violation
(Height)

EARTHQUAKE BUILDING VULNERABILITY AND DAMAGE ASSESSMENT, SIKKIM EARTHQUAKE, 2011
69
6.1. Demand SpectrumEarthquake of magnitude 6.9 with its epicentre located at 27.72 0 N and 88.06 0 E, with its focus at a depthof 19.7 km is used for generating demand spectrum using equation given by Boore et al. (1997), explainedin Annexure-A. The distance from epicentre to the study area Gangtok is 68.74 km. Figure 6-3 shows thedemand spectrum plotted for five different shear wave velocities. The average of shear wave velocities ofsite classes C, D and three values, minimum, average and maximum shear wave velocities of site class Bare used for plotting the demand spectrum.
Table 6-3 PGA experienced at different Shear wave velocity
VS 270 m/s 560 m/s 760 m/s 1125 m/s 1500 m/sPGA 0.1847 0.1414 0.1284 0.1146 0.1057
Figure 6-3 Demand Spectrum
Discussion
Figure 6-3 indicates that for a given time period, the values of spectral acceleration are higher for lowershear wave velocities resulting in higher spectral displacement at a specific location. Lower shear wavevelocity takes longer time for wave to pass through the site compared to higher shear wave velocity. Siteclass C and D, which have low shear wave velocities, results in higher spectral acceleration and spectraldisplacement compared to site class B, which has comparatively higher shear wave velocities. In case ofbuildings, lower shear wave velocities cause higher spectral acceleration and this results in higher spectraldisplacement which causes higher level of building damage. Chunthang area of north Sikkim, which lieson the river borne material, is an example for the site class D which can experience high SA in earthquakes.

EARTHQUAKE BUILDING VULNERABILITY AND DAMAGE ASSESSMENT, SIKKIM EARTHQUAKE, 2011
70
Gangtok area, which lies mainly in the site class B, can experience shear wave velocities ranging from 760m/s to 1500 m/s. Damage probabilities are generated for average shear wave velocity 1125 m/s andminimum value 760 m/s.
6.2. Capacity curvesCapacity curves are generated from the yield and ultimate capacity points of the building. These valueschange as per building types based on their seismic design level. Weight of the building and material of thebuilding are important factors in development of these curves. These curves define the strength of thebuilding to resist earthquakes. Figure 6-4 and Figure 6-5 shows the capacity curves for low code seismicdesign and pre code seismic design, respectively. W1 is wooden building type, C3L indicates low riseconcrete frame structure with un-reinforced masonry infill walls, C3M indicates mid-rise concrete framestructure with un-reinforced masonry infill walls and C3H indicates high-rise concrete frame structurewith un-reinforced masonry infill walls..
Figure 6-4 Capacity Curves for Low code Seismic Design
Figure 6-5 Capacity Curves for Pre code Seismic Design
Capacity Curves Low code seismic design level
Capacity Curves Pre code seismic design level

EARTHQUAKE BUILDING VULNERABILITY AND DAMAGE ASSESSMENT, SIKKIM EARTHQUAKE, 2011
71
DiscussionThe yield and ultimate capacities of low code and pre code seismic design levels show minor differencewhich is due to few seismic considerations followed in the low code seismic design buildings. Due to theabsence of these considerations in pre code seismic design buildings, they show higher spectraldisplacement values compared to low code design buildings, which results in higher level of damage dueto earthquakes. C3H buildings which have more than 8 floors usually have lower natural frequency,therefore, can experience damage due to ground shaking at longer time periods. These buildings showhigh displacement values at low spectral acceleration. As the number of floors decreases, like in low riseC3L and mid-rise C3M, their natural frequency increases and they show lower spectral displacementvalues at comparatively higher acceleration. Wooden buildings, which are more flexible in nature, showsmall displacement at high spectral acceleration and therefore, these are considered as safer structures andexperience lesser damaged compared to concrete buildings.
6.3. Peak Building ResponsePeak Building response is the point at which demand spectrum meets capacity curves. It means that thebuilding experience shaking till it reaches its peak building response and maximum damage occurs when itreaches its peak building response. So using this value the building damage probabilities are generated.Figure 6-6 shows the low code seismic design curves of the four identified building types overlaid on thedemand spectrum to calculate peak building response.
Figure 6-6 Demand and Capacity Curves for Low code Seismic Design
Figure 6-7 shows the pre code seismic design curves of the four identified building types overlaid on thedemand spectrum to calculate peak building response.
Peak building response Low code seismic design level

EARTHQUAKE BUILDING VULNERABILITY AND DAMAGE ASSESSMENT, SIKKIM EARTHQUAKE, 2011
72
Figure 6-7 Demand and Capacity Curves for Pre code Seismic Design
Table 6-4 Peak Building Response for Low code Seismic DesignPeak Building Response Low code
Building Type 270 m/s 560 m/s 760 m/s 1125 m/s 1500 m/sW1 0.22 0.16 0.14 0.12 0.10C3L 0.51 0.24 0.17 0.12 0.10C3M 0.71 0.33 0.25 0.20 0.17C3H 1.14 0.59 0.47 0.36 0.29
Figure 6-8 Peak Building Response Low code Seismic Design
0
0.2
0.4
0.6
0.8
1
1.2
W1 C3L C3M C3H
270 m/s
560 m/s
760m/s
1125m/s
1500m/s
Peak building response Pre code seismic design level

EARTHQUAKE BUILDING VULNERABILITY AND DAMAGE ASSESSMENT, SIKKIM EARTHQUAKE, 2011
73
Peak Building Response Pre codeBuilding Type 270 m/s 560 m/s 760 m/s 1125 m/s 1500 m/sW1 0.22 0.16 0.14 0.12 0.10C3L 0.51 0.24 0.17 0.12 0.10C3M 0.76 0.34 0.25 0.20 0.17C3H 1.18 0.59 0.47 0.35 0.29
Figure 6-9 Peak Building Response Pre code Seismic DesignDiscussionPeak building response of low code and pre code are given in Table 6-4 and Table 6-5 respectively. Thevalues indicate that there is no major difference in the building response between low code and pre codeseismic design levels. In both the cases, for all the building types, peak building response is higher for theshear wave velocity of 270 m/s and decreases as it reaches to 1500 m/s. In C3 type structures thedifference between 270 m/s and 560 m/s is very high compared to the difference between the otherconsecutive shear wave velocities from 560 m/s to 1500 m/s. C3H building type has the highest peakbuilding response at 270 m/s. Wooden buildings (W1) have least peak building response compared to allthe other building types and difference between peak building response values for all the shear wavevelocities is very less in wooden building type.
6.3.1.1. Peak Building Response at shear wave velocities 760 m/s and 1125 m/sThe peak building response values for all the building types at 1125 m/s shear wave velocity are given inTable 6-6 and Figure 6-10 and for 760 m/s shear wave velocity are given in Table 6-7 and Figure 6-11
Table 6-6 Peak Building Response at 1125 m/sPeak Building Response 1125 m/s
Building Type Low code Pre codeW1 0.12 0.12C3L 0.12 0.12C3M 0.20 0.20C3H 0.36 0.35
0
0.2
0.4
0.6
0.8
1
1.2
W1 C3L C3M C3H
270 m/s
560 m/s
760m/s
1125m/s
1500m/s
Table 6-5 Peak Building Response Pre code Seismic Design

EARTHQUAKE BUILDING VULNERABILITY AND DAMAGE ASSESSMENT, SIKKIM EARTHQUAKE, 2011
74
Figure 6-10 Peak Building Response at 1125 m/s
Table 6-7 Peak Building Response at 760 m/sPeak Building Response 760 m/s
Building Type Low code Pre codeW1 0.14 0.14C3L 0.17 0.17C3M 0.25 0.25C3H 0.47 0.47
Figure 6-11 Peak Building Response at 1125 m/sDiscussionThe values indicates that the peak building response for two seismic design levels of the 4 building typesare almost identical at the shear wave velocities of 1125 m/s and 760 m/s. C3H building type has higherbuilding response value and W1 have the lowest building response value. But the level of damage dependsupon the parameters given by HAZUS for calculating damage probabilities. Since many buildings in thestudy region d follow any seismic design considerations, damage probabilities for Pre code seismicdesign buildings were calculated.
0
0.05
0.1
0.15
0.2
0.25
0.3
0.35
0.4
W1 C3L C3M C3H
Low-code
Pre-code
0
0.05
0.1
0.15
0.2
0.25
0.3
0.35
0.4
0.45
0.5
W1 C3L C3M C3H
Low-code
Pre-code

EARTHQUAKE BUILDING VULNERABILITY AND DAMAGE ASSESSMENT, SIKKIM EARTHQUAKE, 2011
75
6.4. Damage probabilities
Discrete damage probabilities are calculated from cumulative damage probabilities using formula given inAnnexure-A. From discrete damage probabilities, percentages of damage for each building type werecalculated. Damage percentage probabilities for four damage states: slight, moderate, extensive andcomplete damage for four building types W1, C3L, C3M, and C3H are generated for all shear wavevelocities: 270 m/s, 560 m/s, 760 m/s 1125 m/s and 1500 m/s. Figure 6-12 and Figure 6-13 show thedamage probabilities of pre code seismic design and low code seismic design respectively. The calculationfor the cumulative and the discrete damage probabilities are given in detail for a building type W1 inAnnexure A. Similarly the values of all the cumulative, discrete and percentage damage probabilities aregiven in Annexure A. Table 6-8 shows the cumulative damage probabilities of Pre code Seismic design atshear wave velocity of 1125 m/s. Table 6-9 shows the discrete damage probabilities of Pre code Seismicdesign at shear wave velocity of 1125 m/s. Table 6-10 shows the cumulative damage probabilities of Precode Seismic design at shear wave velocity of 760 m/s. Table 6-11 shows the discrete damage probabilitiesof Pre code Seismic design at shear wave velocity of 760 m/s.
Figure 6-12 Percentage damage probabilities pre code seismic design level
Percentage damage probabilities pre code seismic design level

EARTHQUAKE BUILDING VULNERABILITY AND DAMAGE ASSESSMENT, SIKKIM EARTHQUAKE, 2011
76
Figure 6-13 Percentage damage probabilities low code seismic design level
DiscussionFigure 6-12 and Figure 6-13 clearly shows that the pre code seismic design buildings have higher level ofdamage compared to the low code seismic design buildings. Even though the peak building response ofboth these seismic design levels are almost equal, the damage expected in these differ by almost 5% in allthe building types except in the case of complete damage. The overall pattern of damage is similar for allthe building types for these two building design levels for all the shear wave velocities. In both the seismicdesign levels, C3L indicated higher level of damage, followed C3M and then C3H, where as W1 indicatedlow level of damage for a given value of shear wave velocity. In all the four damage states from slight tocomplete, shear wave velocity of 270 m/s corresponds to maximum damage and very less damagecorresponds to 1500 m/s. At shear wave velocity of 270 m/s there is a major difference in damagebetween W1 and C3 type of buildings, but in higher shear wave velocities, C3L building type indicatedmore damage and W1, C3M and C3H have much less than the C3L building type. For the magnitude of6.9 and at a distance of around 68.74 km, the expected level of complete damage is less than 1 %. For thesame scenario, the graphs clearly indicate that the probability of higher level of damage for shear wavevelocity 270 m/s, which is usually experienced in soft soil material and the expected damage decreases asthe stiffness of the ground increases. This is clearly seen in the areas of Chungthang which belongs to siteclass D where similar building types have experienced more damage compared to the buildings inGangtok which largely belongs to site class B.
Percentage damage probabilities low code seismic design level

EARTHQUAKE BUILDING VULNERABILITY AND DAMAGE ASSESSMENT, SIKKIM EARTHQUAKE, 2011
77
Table 6-8 Cumulative Damage Probabilities Pre code at 1125 m/sBuilding Type Slight Moderate Extreme Complete
W1 0.1166 0.0217 0.0012 0.0000C3L 0.1417 0.0434 0.0060 0.0000C3M 0.0773 0.0109 0.0007 0.0000C3H 0.0679 0.0089 0.0014 0.0001
Table 6-9 Discrete Damage Probabilities Pre code at 1125 m/sBuilding Type Slight Moderate Extreme Complete
W1 0.0960 0.0206 0.0012 0.0000C3L 0.1043 0.0374 0.0060 0.0000C3M 0.0671 0.0102 0.0006 0.0000C3H 0.0603 0.0076 0.0013 0.0001
Table 6-10 Cumulative Damage Probabilities Pre code at 760 m/sBuilding Type Slight Moderate Extreme Complete
W1 0.1493 0.0306 0.0019 0.0001C3L 0.2177 0.0793 0.0135 0.0001C3M 0.1199 0.0209 0.0015 0.0001C3H 0.1383 0.0240 0.0038 0.0003
Table 6-11 Discrete Damage Probabilities Pre code at 760 m/sBuilding Type Slight Moderate Extreme Complete
W1 0.1206 0.0287 0.0018 0.0001C3L 0.1519 0.0659 0.0134 0.0001C3M 0.1005 0.0195 0.0014 0.0001C3H 0.1178 0.0205 0.0035 0.0003
Table 6-12 Percentage of Damage Pre code at 1125 m/s
Building Type Slight Moderate Extreme CompleteW1 9.6045 2.0575 0.1153 0.0046C3L 10.4302 3.7442 0.5955 0.0024C3M 6.7087 1.0243 0.0611 0.0049C3H 6.0253 0.7618 0.1281 0.0096
The number of damaged buildings is calculated by multiplying the discrete damage probability with thetotal number of buildings in each class and the number of buildings in each HAZUS class for Arithangward is given Table 6-1 of this chapter.

EARTHQUAKE BUILDING VULNERABILITY AND DAMAGE ASSESSMENT, SIKKIM EARTHQUAKE, 2011
78
Table 6-13 Number of predicted damaged pre code seismic buildings in Arithang Ward at 1125 m/sBuilding Type Slight Moderate Extreme CompleteW1 15 3 0 0C3L 14 5 1 0C3M 24 4 0 0C3H 0 0 0 0
Figure 6-14 Graph showing number of predicted damaged pre code seismic buildings in Arithang Ward at1125 m/s
Figure 6-15 Number of predicted damaged pre code seismic buildings in Arithang Ward at 1125 m/s
0
5
10
15
20
25
W1 C3L C3M C3H
Slight
Moderate
Extreme
Complete
Seismic design level Pre code

EARTHQUAKE BUILDING VULNERABILITY AND DAMAGE ASSESSMENT, SIKKIM EARTHQUAKE, 2011
79
Table 6-14 Percentage of Damage Pre code at 760 m/s
Building Type Slight Moderate Extreme CompleteW1 12.0564 2.8739 0.1831 0.0084C3L 15.1852 6.5896 1.3421 0.0115C3M 10.0451 1.9482 0.1395 0.0126C3H 11.7781 2.0516 0.3519 0.0314
The number of damaged buildings is calculated by multiplying the discrete damage probability with thenumber of buildings in each class. The number of buildings in each HAZUS class is given Table 6-1 ofthis chapter.
Table 6-15 Number of predicted damaged pre code seismic buildings in Arithang Ward at 760 m/sBuilding Type Slight Moderate Extreme CompleteW1 19 5 0 0C3L 21 9 2 0C3M 36 7 1 0C3H 0 0 0 0
Figure 6-16 Graph showing Number of predicted damaged pre code seismic buildings in Arithang Wardat 760 m/s
0
5
10
15
20
25
30
35
40
W1 C3L C3M C3H
Slight
Moderate
Extreme
Complete

EARTHQUAKE BUILDING VULNERABILITY AND DAMAGE ASSESSMENT, SIKKIM EARTHQUAKE, 2011
80
Figure 6-17 Number of predicted damaged pre code seismic buildings in Arithang Ward at 760 m/s
DiscussionTable 6-8, Table 6-9, Table 6-12 and Table 6-13 describes the Cumulative, Discrete, Percentage damageprobabilities and number of damaged buildings of 4 building types as per pre code design level at 1125m/s, respectively. Table 6-10, Table 6-11, Table 6-14 and Table 6-15 describes the Cumulative, Discrete,Percentage damage probabilities and number of damaged buildings of 4 building types as per pre codedesign level at 760 m/s, respectively. Figure 6-15 and Figure 6-17 show the number of damaged buildingsof four damage states for four identified building types for pre code seismic design level at 1125 m/s and760 m/s, respectively.
Results indicate at shear wave velocities 1125 m/s and 760 m/s, C3L building type has highest probabilityof experiencing slight damage (10%) compared to other building types, followed by W1 (9%), C3H (6%)and C3M (6%). At 1125 m/s, C3L building type has highest probability of experiencing moderate damage(4%) compared to other building types (1-2 %), which have equal probabilities of experiencing moderatelevel damage. At 760 m/s, C3L building type has highest probability of experiencing moderate damage(7%) compared to other building types (2-3 %), which have equal probabilities of experiencing moderatelevel damage. At 1125 m/s C3L indicated less than 1% probability of extensive level damage. At 760 m/s
Seismic design level Pre code

EARTHQUAKE BUILDING VULNERABILITY AND DAMAGE ASSESSMENT, SIKKIM EARTHQUAKE, 2011
81
C3L indicated low probability (1%) of extensive level damage and it is than 1% in W1, C3M and C3H. Inall the building types there is very low probability of experiencing complete damage at both 1125 and 760m/s.
In Arithang ward out of 659 buildings (W1-159, C3L-139, C3M-360, C3H-1) results indicated at shearwave velocity 1125 m/s, C3M building type has highest number of buildings (24) experiencing slightdamage compared to other building types, followed by C3L (14), W1 (15) and none in C3H. C3L buildingtype has highest number of buildings experiencing moderate damage (5) compared to other building types,followed by C3M(4), W1(3) and none in C3H. C3L indicated one building of extensive level damage andnone in other building types. At 760 m/s, C3M building type has highest number of buildings (36)experiencing slight damage compared to other building types, followed by C3L (27), W1 (19) and none inC3H. C3L building type has highest number of buildings experiencing moderate damage (9) compared toother building types, followed by C3M(7), W1(5) and none in C3H. C3L indicated two buildings ofextensive level damage followed by one C3M type and none in other building types. In all the buildingtypes the number of buildings experiencing complete damage is none at both 1125 and 760 m/s.
6.5. ValidationTable 5-1 shows the number of ward wise damaged buildings in Gangtok reported by the MunicipalCorporation of Gangtok. These were the observed damages in the first phase of damage assessment bythe local authorities within a month after earthquake. Based on this damage assessment, compensationwas paid to building owners for the building damage by the local government. So for this purpose,government building damages were not included in the Table 5-1. So for comparing the predicted numberof damage to the actual damage reported, government buildings are not considered. In Arithang ward, outof 659 buildings, 611 buildings are privately owned and 48 are government owned buildings. Table 6 -16gives the number of privately owned buildings in each HAZUS class and Table 6-17 gives number ofbuildings as per their construction material. Number of predicted damaged buildings in Arithang ward aregiven in Table 6-18 and Table 6-19 respectively. Actual numbers of damaged buildings in Arithang wardare given in Table 6-20.
Table 6-16 Number of private owned buildings in each HAZUS class in Arithang ward.
HAZUS Class Number of BuildingsW1 135C3L 128C3M 347C3H 1
Table 6-17 Number of buildings according to construction material
Material Number of BuildingsWooden 135Concrete 476

EARTHQUAKE BUILDING VULNERABILITY AND DAMAGE ASSESSMENT, SIKKIM EARTHQUAKE, 2011
82
Table 6-18 Number of predicted privately owned damaged pre code seismic buildings in Arithang Ward at1125 m/s
Damages ReportedBuilding Type Slight Moderate Extreme CompleteWooden(Kutcha) 13 3 0 0Concrete(Pucca) 37 8 1 0
Figure 6-18 Predicted privately owned damaged pre code seismic buildings in Arithang Ward at1125 m/s
Table 6-19 Number of predicted privately owned damaged pre code seismic buildings in Arithang Ward at760 m/s
Damages ReportedBuilding Type Slight Moderate Extreme CompleteWooden(Kutcha) 16 4 0 0Concrete(Pucca) 54 15 2 0
Figure 6-19 Predicted privately owned damaged pre code seismic buildings in Arithang Ward at 760 m/s
0
5
10
15
20
25
30
35
40
Wooden(Kutcha) Concrete(Pucca)
Slight
Moderate
Extreme
Complete
0
10
20
30
40
50
60
Wooden(Kutcha) Concrete(Pucca)
Slight
Moderate
Extreme
Complete

EARTHQUAKE BUILDING VULNERABILITY AND DAMAGE ASSESSMENT, SIKKIM EARTHQUAKE, 2011
83
Table 6-20 Number of actual reported damaged buildings of private ownership in Arithang Ward(Source : Municipal Corporation of Gangtok)
Damages ReportedBuilding Type Slight Moderate Extreme CompleteWooden(Kutcha) 20 5 0 0Concrete(Pucca) 82 24 4 0
Figure 6-20 Actual damage reported in Gangtok AreaDiscussionThe actual numbers of damaged buildings indicate that the highest numbers of buildings damaged areconcrete buildings (82) and most of the damage is reported as the slight damage followed by moderatedamage (24), extreme damage (4) and no complete damage is reported. Number of slight damagedbuildings is more in wooden buildings (20) followed by moderate damage (5), extreme and completedamage is nil. At 1125 m/s, predicted numbers of slight damaged buildings are concrete buildings (37),damage followed by moderate damage (8), extreme damage (1) and no complete damage. At 1125 m/spredicted number of slight damaged buildings are more in wooden buildings (13) followed by moderatedamage (3), extreme and complete damages are nil. At 760 m/s, predicted numbers of slight damagedbuildings are concrete buildings (54) damage followed by moderate damage (15), extreme damage (2) andno complete damage. At 760 m/s predicted number of slight damaged buildings are more in woodenbuildings (16) followed by moderate damage (4), extreme and complete damages are nil.
At 760 m/s the predicted numbers of slightly damaged concrete buildings (54) are close to the actualreported slightly damaged concrete buildings (82) by the local authorities than the slightly damagedconcrete buildings (37) at 1125 m/s. Similarly at 760 m/s the predicted numbers of moderately damagedconcrete buildings (15) are close to half the actual reported moderately damaged concrete buildings (24) bythe local authorities than the moderately damaged concrete buildings (8) at 1125 m/s which is one third ofactual damage. Similarly at 760 m/s the predicted numbers of extremely damaged concrete buildings (2) ishalf the actual reported extremely damaged concrete buildings (4) by the local authorities than the slightlydamaged concrete buildings (1) at 1125 m/s. And in both the cases at 760 m/s and 1125 m/s thecomplete damage is nil and there are no completely damaged buildings reported in Arithang ward.
At 760 m/s the predicted numbers of slightly damaged wooden buildings (16) match 80% to the actualreported slightly damaged wooden buildings (20) by the local authorities than the slightly damagedwooden buildings (13) at 1125 m/s which is 65% match to the actual damage. At 760 m/s and 1125 m/sthere are no predicted moderately damaged wooden buildings predicted but 5 buildings reported to havemoderate damage. And in both the cases at 760 m/s and 1125 m/s the extreme and complete damage inwooden buildings is nil and there are no completely damaged wooden buildings reported in Arithang
0
20
40
60
80
100
Wooden(Kutcha) Concrete(Pucca)
Slight
Moderate
Extreme
Complete

EARTHQUAKE BUILDING VULNERABILITY AND DAMAGE ASSESSMENT, SIKKIM EARTHQUAKE, 2011
84
ward. Since the building damage prediction at 760 m/s matches closely with the actual damage in Arithangward, 760 m/s shear wave velocity can be considered for prediction of building damage at Gangtok citylevel.
Based on the building outline map of 2010, provided by the Town Planning Division of UrbanDevelopment and Housing Department, the number of buildings counted in the Gangtok is 11,188,which include all the building types, ownership etc. Based on the damage data provided by the municipalcorporation of Gangtok as given in Table 5-1, total number of damages reported in the first phase ofevaluation is 2833, in which 1804 are concrete structures and 1029 are wooden and other light materialstructures. The divided damage break up numbers in each damage state is given in Table 6-21.
Table 6-21 Number of reported damaged buildings of private ownership in Gangtok(Source: Municipal Corporation of Gangtok)
Damages ReportedBuilding Type Slight Moderate Extreme Complete TotalWooden(Kutcha) 471 487 69 2 1029Concrete(Pucca) 1118 625 50 11 1804
Figure 6-21 Number of reported damaged buildings of private ownership in Gangtok(Source: Municipal Corporation of Gangtok)
As the break-up of each building type is not available average values of four damages states wereconsidered for calculating the total number of damaged buildings for each damage state and comparedwith the actual reported damage in each damage state. Table 6-22 shows the predicted damage percentageprobability of pre code seismic design level and calculated average percentage probability of each damagestate. So for total number of 11,188 buildings in Gangtok the numbers of modelled damaged buildingsand actual reported buildings are given in Table 6-23.
Table 6-22 Predicted Percentage of Damage Pre code at 760 m/sBuilding Type Slight Moderate Extreme Complete
W1 12.0564 2.8739 0.1831 0.0084C3L 15.1852 6.5896 1.3421 0.0115C3M 10.0451 1.9482 0.1395 0.0126C3H 11.7781 2.0516 0.3519 0.0314
Average 12.2662 3.365825 0.50415 0.015975
0
200
400
600
800
1000
1200
Wooden(Kutcha) Concrete(Pucca)
Slight
Moderate
Extreme
Complete

EARTHQUAKE BUILDING VULNERABILITY AND DAMAGE ASSESSMENT, SIKKIM EARTHQUAKE, 2011
85
Table 6-23 Number of actual reported damaged buildings and predicted building damage at 760 m/s.
Building Type Slight % Moderate % Extreme % Complete % Total %Actual 1589 1112 119 13 2833Predicted 1372 86 377 34 56 47 2 15 1807 64
Figure 6-22 Number of actual reported damaged buildings and predicted building damage at760 m/s
DiscussionTable 6-23 indicates that at 760 m/s predicted number of slight damaged buildings (1372) is 86% of theactual damage buildings (1589) as per pre code seismic design level. At 760 m/s predicted number ofmoderate damaged buildings (377) is 34% of the actual damaged buildings (1112) as per pre code seismicdesign level. At 760 m/s predicted number of extremely damaged buildings (56) is 47% of the actualdamaged buildings (119) at pre code seismic design level. At 760 m/s predicted number of completedamaged buildings (2) is 15% of the actual damaged buildings (13) at pre code seismic design level.Overall at 760 m/s total predicted number of damaged buildings (1807) is 64% of the actual damagedbuildings (2833) at pre code seismic design level.
6.6. Damage in Chungthang AreaDuring the field work it was observed that Chunthang area in the north district of Sikkim has experiencedhigh building damage in comparison to other places in Sikkim. Chunthang is situated at around 58.66 kmfrom epicentre and the town was constructed on the river sediments which correspond to the site class Dwhich has an average shear wave velocity of 270 m/s. As described in the earlier sections peak buildingresponses of all 4 identified building types were calculated by overlaying the capacity curves of fouridentified building types at pre code seismic design levels for the demand spectrum of shear wave velocity270 m/s. From the generated peak building response, cumulative discrete and percentage damageprobabilities are calculated. Figure 6-23 shows the pre code seismic design curves of the four identifiedbuilding types overlaid on the demand spectrum of 270 m/s at Chunthang area to calculate peak buildingresponse and Table 6-24 shows the Peak building response for Pre code Seismic Design at 270 m/s forChunthang Area.
0
300
600
900
1200
1500
1800
Slight Moderate Extreme Complete
Actual
Predicted

EARTHQUAKE BUILDING VULNERABILITY AND DAMAGE ASSESSMENT, SIKKIM EARTHQUAKE, 2011
86
Figure 6-23 Demand and capacity curves for pre code seismic design
Table 6-24 Peak building response for pre code seismic design at 270 m/s for Chunthang area
Table 6-25 Cumulative damage probabilities Pre code at 270 m/s for Chunthang AreaBuilding Type Slight Moderate Extreme Complete
W1 0.3619 0.1126 0.0124 0.0009C3L 0.6155 0.3825 0.1357 0.0108C3M 0.6209 0.3143 0.0694 0.0115C3H 0.6755 0.3175 0.0785 0.0127
Table 6-26 Discrete damage probabilities Pre code at 270 m/s for Chunthang AreaBuilding Type Slight Moderate Extreme Complete
W1 0.2607 0.1012 0.0114 0.0009C3L 0.3578 0.2576 0.1249 0.0108C3M 0.3644 0.2565 0.0578 0.0115
C3H 0.4238 0.2517 0.0658 0.0127
Building Type Peak Building ResponseW1 0.25C3L 0.63C3M 0.93C3H 1.45
Pre code seismic design level
Spectral Displacement SD

EARTHQUAKE BUILDING VULNERABILITY AND DAMAGE ASSESSMENT, SIKKIM EARTHQUAKE, 2011
87
Table 6-27 Percentage damage probabilities Pre code at 270 m/s for Chunthang AreaBuilding Type Slight Moderate Extreme Complete
W1 26.077 10.121 1.147 0.093C3L 35.788 25.767 12.492 1.085C3M 36.445 25.650 5.780 1.159C3H 42.383 25.170 6.581 1.276
Figure 6-24 Percentage damage probabilities for pre code seismic design
DiscussionTable 6-25, Table 6-26, Table 6-27 describes the Cumulative, Discrete, and Percentage damageprobabilities of 4 building types as per pre code design level at 270 m/s in Chunthang area, respectively.Figure 6-24 shows the percentage of damage probability of four states for four identified building typesfor pre code seismic design level at 270 m/s in Chunthang area. Results indicate at shear wave velocity270 m/s, in Chunthang area, C3H building type has highest probability of experiencing slight damagecompared to other building types, followed by C3M, C3L and W1. The damage probability of C3H isclose to 43%. C3M and C3L have almost similar probability of around 35%. At 270 m/s in Chunthangarea C3L, C3M and C3 H building types has almost equal probability of experiencing moderate damage(25%) compared to W1 (10 %). At 270 m/s in Chunthang area, C3L indicated high probability (13%) ofextensive level damage and it is around 5.5 to 7 % in C3M and C3H building types, and it is comparativelyvery less in W1 (2%). At 270 m/s in Chunthang area C3L, C3M and C3H indicated equal probability (1%)of complete level damage and there is no expected complete damage in W1. So in all the cases exceptslight damage state, wooden building show low probable damage in all damage states compared toconcrete building types.
Field Observation
As indicated by the percentage damage probability calculated, slight damage is seen everywhere followedby moderate and extensive damages. Because of poor construction, columns are seen separated from thebeams, and most of the infill walls have developed extreme to severe cracks and in some cases completecollapse.
0
5
10
15
20
25
30
35
40
45
W1 C3L C3M C3H
Slight
Moderate
Extreme
Complete

EARTHQUAKE BUILDING VULNERABILITY AND DAMAGE ASSESSMENT, SIKKIM EARTHQUAKE, 2011
88
(A) (B)
(C) (D)
Figure 6-25 Damaged buildings in Chunthang Area
Discussion
Figure 6-25 A to D shows the failure of columns and complete damage to the walls at ground floor levelcompared to moderate and slight damage at upper levels. Figure 6-25 A, B shows the crushed anddetached columns where concrete has completed failed and reinforcement was broken. Even though thedifference between epicentre in Gangtok and Chunthang is approximately 10km, Chunthang sufferedextreme damage because of the soft soils beneath the buildings which shake with high frequency than therocky areas.
6.7. Risk ZonationIn the previous section, various analyses showed percentage of different kind of buildings that areexpected to be damaged in the reference earthquake. Now it is important to know the probable locationof such buildings with assumption that all building types considered are of similar quality and age, which isan over simplification. However, it is worthwhile to assume this in order to assess the role of local groundcondition in possible amplification of ground motion or adverse impact on building because of itslocation. This is more important in the present case as Gangtok is a landslide prone area and buildingslocated on steep and unstable slopes are more likely to develop damage compared to similar buildings onflat and stable areas.
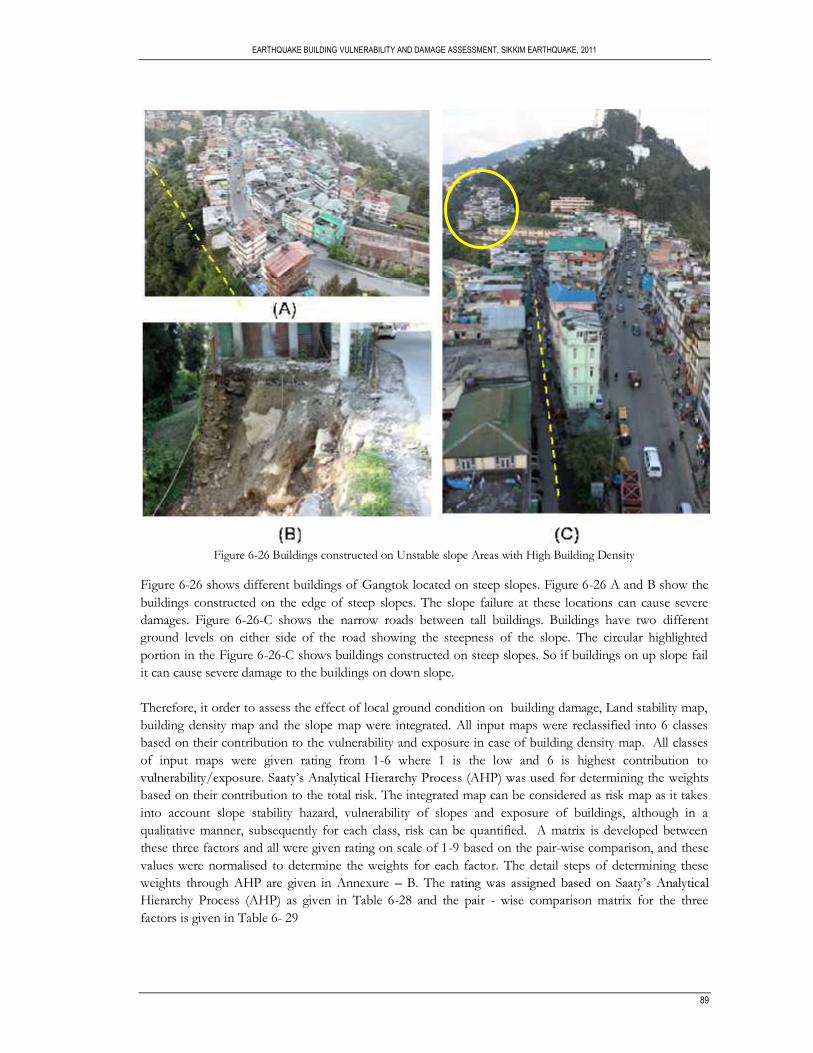
EARTHQUAKE BUILDING VULNERABILITY AND DAMAGE ASSESSMENT, SIKKIM EARTHQUAKE, 2011
89
Figure 6-26 Buildings constructed on Unstable slope Areas with High Building Density
Figure 6-26 shows different buildings of Gangtok located on steep slopes. Figure 6-26 A and B show thebuildings constructed on the edge of steep slopes. The slope failure at these locations can cause severedamages. Figure 6-26-C shows the narrow roads between tall buildings. Buildings have two differentground levels on either side of the road showing the steepness of the slope. The circular highlightedportion in the Figure 6-26-C shows buildings constructed on steep slopes. So if buildings on up slope failit can cause severe damage to the buildings on down slope.
Therefore, it order to assess the effect of local ground condition on building damage, Land stability map,building density map and the slope map were integrated. All input maps were reclassified into 6 classesbased on their contribution to the vulnerability and exposure in case of building density map. All classesof input maps were given rating from 1-6 where 1 is the low and 6 is highest contribution to
for determining the weightsbased on their contribution to the total risk. The integrated map can be considered as risk map as it takesinto account slope stability hazard, vulnerability of slopes and exposure of buildings, although in aqualitative manner, subsequently for each class, risk can be quantified. A matrix is developed betweenthese three factors and all were given rating on scale of 1-9 based on the pair-wise comparison, and thesevalues were normalised to determine the weights for each factor. The detail steps of determining theseweights through AHP are given in Annexure B. TheHierarchy Process (AHP) as given in Table 6-28 and the pair - wise comparison matrix for the threefactors is given in Table 6- 29

EARTHQUAKE BUILDING VULNERABILITY AND DAMAGE ASSESSMENT, SIKKIM EARTHQUAKE, 2011
90
Table 6-28 Rating for pair wise comparisonNumerical Rating Judgments9 Extremely preferred8 Very strongly to extremely7 Very strongly preferred6 Strongly to very strongly5 Strongly preferred4 Moderately to strongly3 Moderately preferred2 Equally to moderately1 Equally preferred
Table 6-29 Pair wise comparison MatrixLand Stability Building Density Slope
Land Stability 1.000 1.000 3.000Building Density 1.000 1.000 5.000Slope 0.333 0.200 1.000
Land stability map was generated by Mines, Minerals and Geology Department, Government of Sikkim,Gangtok, to define the number of floors to be permitted based on slope/land stability. The factors andpermissible numbers of floors are given in Table 4-1 are and Table 4-2. Since the land stability is generatedusing many geo-environmental factors such as geology, slope, aspect, rainfall pattern, land use/land cover,hydrology and land cover, seismicity, soil type and rock erodability and vegetation, which determines theslope stability, it was considered as cumulative effect of all such factors instead of all the individual factors.For finding out the exposure and vulnerability of buildings, the building density and slope wereconsidered.
During field investigation it was observed that the slope is the single most important factor thatdetermines building vulnerability in hilly areas due to uneven weak foundation, distribution of load andforce due to lateral spreading. Building density map is considered as exposure of buildings to hazards andsecondly on slopes if a single building fails, it is likely to affect buildings in the down slope direction. Sothese three factors were considered and rated according their importance for risk assessment.
Table 6-30 Normalized Weights and Individual class rating
Map Weight Classes WeightLand Stability 0.480 Very Stable 1
Stable 2Relatively Stable 3Relatively Unstable 4Unstable 5Very Unstable 6

EARTHQUAKE BUILDING VULNERABILITY AND DAMAGE ASSESSMENT, SIKKIM EARTHQUAKE, 2011
91
Building Density 0.405 0-20 121-40 241-60 361-80 481-100 5100+ 6
Slope 0.115 0-10 111-20 221-30 331-40 441-50 550+ 6
Three classified maps were multiplied with their respective weights and were integrated to generate thefinal risk map.
Risk Map = 0.480 0.405
The final output map was then reclassified in to three classes such as High Risk, Medium Risk and LowRisk Areas. Figure 6-27 shows the final classified Map of Gangtok.

EARTHQUAKE BUILDING VULNERABILITY AND DAMAGE ASSESSMENT, SIKKIM EARTHQUAKE, 2011
92
Figure 6-27 Risk Map of Gangtok
DiscussionFigure 6-27 clearly shows areas where the land is highly unstable, building density is high and slope is high,is classified as high risk zones. Majority of area falls under moderate and low risk that are either locatedclose to the ridge or to the river in the valley and the centre of the city is located in the high risk zone.
ValidationThe location of the damaged buildings which were visited during field investigation was overlaid on therisk map to see the location of buildings with respect to the risk zones. The descriptions of all thesebuildings are given in the previous chapter.

EARTHQUAKE BUILDING VULNERABILITY AND DAMAGE ASSESSMENT, SIKKIM EARTHQUAKE, 2011
93
Figure 6-28 Identified damaged buildings on Risk Map
DiscussionFigure 6-28 clearly indicates that most of the damaged buildings are located in the high risk zones or closeto the high risk zones. Only two buildings close to the ridge area are in the low risk zone. Few others lie inthe moderate risk zones, but are close to the high risk areas.

EARTHQUAKE BUILDING VULNERABILITY AND DAMAGE ASSESSMENT, SIKKIM EARTHQUAKE, 2011
94
7. CONCLUSIONS AND RECOMMENDATIONS
7.1. ConclusionThe main objective of the research was to assess vulnerability of buildings (building response and damageassessment) due to magnitude 6.9 M earthquake of 18th September, 2011, in Gangtok region which is avery important town with largest number of population closest to the epicentre (located at around 68 kmfrom the epicentre). The study was carried out using HAZUS methodology which was originallydeveloped for US buildings and latter on used elsewhere, and therefore, one of the aim was to comparethe generated results with the actual damage occurred in the Gangtok area and assess the level ofapplicability of the methodology in Indian context. The main of objective of the research was achieved bycompleting two sub-objectives and third sub objective concentrated on the retrofitting of damagedbuildings due to earthquake to reduce of vulnerability of buildings to future events. The conclusionsderived from each sub objective are discussed in detail below.
Sub objective 1: To identify input parameters of HAZUS methodology for adapting in Indian context.
HAZUS methodology which was originally developed for multi hazard risk assessment of buildings inUnited States has been used in other parts of world including in India. The earthquake risk assessmentmodule of HAZUS requires four main parameters for seismic risk assessment such as seismic hazard,ground motion, building inventory and damage functions. The seismic risk assessment mainly uses thenon-linear structural analysis of buildings for developing damage probabilities. This requires structuralproperties of buildings along with properties of construction material and method of construction. Thesevalues were developed for buildings in US and are not currently available for Indian building types. So toadopt the HAZUS methodology to Indian condition, local building types was matched with the mostlikely building types as used in HAZUS. The similar classifications have been attempted by Prasad et al.(2009). The structural properties of a building are defined by the capacity curves of the building based ontheir seismic design level. These values are provided by FEMA (2011) in HAZUS technical manual.
Second parameter in the methodology was derived from the characterisation of earthquake scenario bysimulating ground motion at the site of consideration. Earthquake magnitude, type of faulting, location ofepicentre and depth, type of soil class, shear wave velocity of soil class were identified as the parametersfor generating earthquake scenario (ground motion) using the attenuation function developed by Boore etal. (1997). The peak building response is calculated from the earthquake scenario and building structuralproperties. Using the spectral displacement, median value of spectral displacement at which buildingreaches the threshold of damage state, and other building parameters, the damage probabilities can becalculated for four levels of damages namely slight, moderate, extensive and complete damage states. It isconcluded that the methodology can be adapted for the Indian context and damage results can match withreal situation. However, without the availability of structural values required for the method, thedeveloped scenarios may not be able to produce exact result due to variation of building type,construction practice, age and local conditions.

EARTHQUAKE BUILDING VULNERABILITY AND DAMAGE ASSESSMENT, SIKKIM EARTHQUAKE, 2011
95
Sub objective 2: To estimate building damage in user defined earthquake scenario using adapted HAZUS methodology forIndian context and validate them
The level of applicability of the methodology in Indian context was known by comparing the generatedresults with actual damage in the field due to the 2011 earthquake. Buildings types in the study area wereidentified during the field visit and classified according to the HAZUS building types. The buildingdamage data reported in the field by local authorities were collected for validation. Based on the identifiedbuilding types, damage probabilities were estimated by following the HAZUS method for differentpossible ground motion scenarios. Four different building types and different shear wave velocities wereconsidered.
The results showed that C3L types of buildings were highly vulnerable and there is a high probability ofslight damage to such buildings. These scenarios were matched with the reported damage. So it isconcluded that the HAZUS methodology can be used for Indian condition, and HAZUS building typeshave some similarity with Indian building types. It is also concluded that for generating real scenariosIndian building structural values should be used.
In order to assess high risk areas of the Gangtok region, land stability map, slope map and the buildingdensity map were integrated using AHP, in which weights were assigned to these maps and risk map wasgenerated. Most of the visited damaged buildings are located in the high risk areas or close to the high riskareas. So the risk map can be further utilised for locating most probable areas of maximum damage, it canbe further improved by incorporating local ground conditions of all the damaged buildings in Gangtok,which can be carried out in further research.
Sub objective 3: To make an general assessment of damage to built environment and comment on various prevention andretrofitting methods for reducing building damage.
From the field visit it is concluded that none of the building have any level of seismic designconsiderations and most of the buildings violate the local building laws. Poor construction practices wereidentified in the new constructions and old constructions were maintained in very bad conditions. Damageto different buildings was assessed and possible factors that caused building damages were identified forfinding out the possible retrofitting methods. Based on the literature review and local condition, possibleretrofitting measures were recommended for reducing the vulnerability. It is also observed that most ofgovernment buildings have experienced maximum damage, therefore, as a policy, it may be easier toimplement retrofitting measures and better building construction practices in government buildings firstfollowed by private buildings.
7.2. Recommendations
7.2.1. Recommendations for Gangtok CityAs Gangtok is one of the major urban areas and main resource of economy, detailed and soundbuilding damage assessment need to be carried out with respect to building properties andfoundation condition.It is recommended for developing codes for earthquake resistant designs and details for futureconstructions.Practices whichstructures are not strong enough to sustain future earthquakes. So it is recommended toimmediately repair, retrofit and strengthen the damaged buildings and make them strong enoughto resist future earthquakes.

EARTHQUAKE BUILDING VULNERABILITY AND DAMAGE ASSESSMENT, SIKKIM EARTHQUAKE, 2011
96
As Gangtok lies in the high seismic zone, it is recommended to conduct training programs for allthe masons and construction workers regarding the earthquake resistant construction practices.It is also recommended that all the building databases developed needed to updated on a regular
basis by local authorities for efficient planning and preparedness in emergency situations.Gangtok is main tourist destination and it attracts many national and international tourists. It isstrongly recommended that assessment of all the hotels, guest houses and other tourist relatedinfrastructure to be carried out immediately and make these earthquake resistant, as damage tothese structures can affect the income generated by tourism.It is recommended that proper disaster management and emergency management plan needed tobe developed as Gangtok is one of highly populated areas of Sikkim and lies in high seismichazard zone. It is also advised to conduct disaster management workshops and seminars toeducate the people on disaster safety measures and prepare them for future events.All the hospitals, schools, government buildings have to be immediately made earthquake proofto minimise damage and loss in future events on a priority basis
7.2.2. Recommendations for further research.Development of structural parameters can produce more realistic scenario for vulnerabilityassessment.Similar vulnerability assessment is recommended in future when Indian building structuralparameters are available for generating realistic scenarios.With the present generated damage probabilities, the building replacement costs can be calculatedand based on the building vulnerability, population vulnerabilities can also be calculated for theGangtok region and other areas of Sikkim.As the HAZUS methodology closely approximate Indian conditions, it can be used for generatingthe vulnerability scenarios of buildings in other cities located in high earthquake hazard zones.

97
LIST OF REFERENCESAgrawal, S. K. S. K., and Chourasia, A. (2007). Methodology for Seismic Vulnerability Assessment of
Building Stock in Mega Cities. In T. G. Sitharam and B. K. Bansal (Eds.), Microzonation (pp. 182190). Banglore: Interline Publishing.
Ambrose, J., and Vergun, D. (1999). Design for Earthquakes (1st ed.). John Wiley and Sons, Ltd.
Arya, A. S. (2000). Recent developments toward earthquake risk reduction in India. Current science, 79(9),1270 1277.
Aswandono, B. (2011). Building Replacement Cost for Seismic Risk Assessment in Palbapang Village ,Bantul Sub-District , Yogyakarta Building Replacement Cost For Seismic Risk Assessment inPalbapang, Indonesia. Assessment. University of Twente.
BIS. (2002). Indian standard criteria for earthquake resistant design of structures, Part 1 generalprovisions and buildings". Engineering (Vol. 1893, p. 41). New Delhi.
BMTPC. (2006). Vulnerability Atlas of India. New Delhi: Building Materials and Technology PromotionCouncil.
Bhasin, R., Grimstad, E., Otto, J., Dhawan, A. K., Singh, R., Verma, S. K., and Venkatachalam, K. (2002).Landslide hazards and mitigation measures at Gangtok , Sikkim Himalaya. Engineering Geology, 64,351-368.
Boore, D. M., Joyner, W. B., and Fumal, T. E. (1997). Estimation of Rexponse Spectra and PeakAcceleration from Western North American Earthquakes: An Interm Report. SeismologicalResearch Letters, 68(1), 129-153. Menlo Park, CA.
Calvi, G. M., Pinho, R., Magenes, G., Bommer, J., Restrepo-Vélez, L., and Crowley, H. (2006).Development of seismic vulnerability assessment methodologies over the past 30 years. ISETjournal of Earthquake Technology, 43(3), 75 104. Dowrick, D. J. (2005). Earthquake RiskReduction. John Wiley and Sons, Ltd.
EM-DAT. (2011). 2011 Disasters in Numbers. The OFDA/CRED - International Disaster Database, (1).Belgium. Retrieved from www.emdat.be
FEMA. (2002). Rapid Visual Screening of Buildings for Potential Seismic Hazards : A Hanbook.National Earthquake Hazards Reduction Program (2nd ed.). Washington D.C: Applied TechnologyCouncil.
FEMA. (2011). HAZUS MH 2.0 User and Technical Manual. Washington, D.C: Department ofHomeland Security.
Ghosh, C. (2008). Earthquake Risk Mitigation Strategies in India. The 12th International Conference ofInternational Association for Computer Methods and Advances in Geomechanics (IACMAG) (pp.2985-2991). Goa, India.
Gulati, B. (2006). Earthquake Risk Assessment of Buildings: Applicability of HAZUS in Dehradun, India.University of Twente.

98
Haldar, P., and Singh, Y. (2009). Seismic Performance And Vulnerability Of Indian Code- Designed RcFrame Buildings. ISET journal of Earthquake Technology, 46(1), 29-45.
Haldar, P., Singh, Y., Lang, D. H., and Paul, D. K. (2010). IVARA A Tool For Seismic VulnarabilityAnd Risk Assessment Of Indian Housing. In A. Kumar and M. . Sharma (Eds.), 14 Symposium OnEarthquake Engineering (pp. 1405 - 1415). Roorkee: Elite Publishing.
IMD. (2011). A detailed report on the earthquake (M :6.8) of 18 September, 2011 in Sikkim-Nepalborder region. New Delhi. Retrieved from www.imd.gov.in
Jagadish, K. S., Raghunath, S., and Nanjunda Rao, K. S. (2003). Behaviour of masonry structures duringthe Bhuj earthquake of January 2001. Journal of Earth System Science, 112(3), 431-440.doi:10.1007/BF02709270
Kaushik, H. B., Dasgupta, K., Sahoo, D. R., and Kharel, G. (2006). Performance of structures during theSikkim earthquake of 14 February 2006. Current Science, 91(4), 449-455.
Khose, V. N., Singh, Y., and Lang, D. (2010). Limitations of Indian seismic design codes for RCbuildings. In A. Kumar and M. . Sharma (Eds.), 14 Symposium On Earthquake Engineering (pp.1416-1423). Roorkee: Elite Publishing.
Kircher, C. A., Nassar, A. A., Kustu, O., and Holmes, W. T. (1997). Development of Building DamageFunctions for Earthquake Loss Estimation. Earthquake Spectra, 13(4), 663. Earthquake EngineeringResearch Institute. doi:10.1193/1.1585974
Kumar Nath, S., Sengupta, P., Sengupta, S., & Chakrabarti, A. (2000). Seismic Hazard Mapping andMicrozonation in the Sikkim Himalaya through GIS Integration of Site Effects and Strong GroundMotion Attributes. Current Science, 79(9), 1316 - 1326. doi:10.1023/B:NHAZ.0000023355.18619.0c
Kumar Nath, S. (2004). Seismic Hazard Mapping and Microzonation in the Sikkim Himalaya through GISIntegration of Site Effects and Strong Ground Motion Attributes. Natural Hazards, 31(2), 319-342.doi:10.1023/B:NHAZ.0000023355.18619.0c
Kumar Nath, S., Thingbaijam, K. K. S., & Raj, A. (2009). Earthquake hazard in Northeast India Aseismic Microzonation approach with typical case studies from Sikkim Himalaya and Guwahati city.Journal of Earth System Science, 117(S2), 809-831.doi:10.1007/s12040-008-0070-6
Lang, D. H., Verbicaro, M. I., Singh, Y., Prasad, J., Diaz, D. W., and Gutiérrez, M. (2009). Structural AndNon-Structural Seismic Vulnerability Assessment For Schools And Hospitals Based OnQuestionnaire Surveys: Case Studies In Central America And India. User Manual Version1.0 (p. 59).
MMG Dept. (2008). Land Stability Map. Mines Minerals and Geology Department, Gangtok.
Mandal, P., Kumar, N., Satyamurthy, C., and Raju, I. P. (2009). Ground-motion Attenuation Relationfrom Strong-motion Records of the 2001 Mw 7.7 Bhuj Earthquake Sequence (2001 2006), Gujarat,India. Pure and Applied Geophysics, 166(3), 451-469. doi:10.1007/s00024-009-0444-y
NDMA. (2011). Development of Probabilistic Seismic Hazard Map of India Technical Report. NationalDisaster Management Authority (p. 126). New Delhi.

99
NRSC. (2011). Pre and Post Earthquake Report. Retirved fromhttp://bhuvan.nrsc.gov.in/bhuvan/PDF/sikkim_earthquake.pdf
Porter, K. (2009). Cracking an Open Safe: HAZUS Vulnerability Functions in Terms of Structure-Independent Spectral Acceleration. Earthquake Spectra, 25(2), 361. doi:10.1193/1.3106680
Prasad, J. S. R., Singh, Y., Kaynia, A. M., and Lindholm, C. (2009). Socioeconomic Clustering in SeismicRisk Assessment of Urban Housing Stock. Earthquake Spectra, 25(3), 619. doi:10.1193/1.3158547
Rai, D. C. (2008). A generalized method for seismic evaluation of existing buildings. Current Science,94(3), 363-370.
Rajendran, K., Rajendran, C. P., Thulasiraman, N., Andrews, R., and Nima, S. (2011). The 18 September2011 , North Sikkim earthquake. Current Science, 101(11), 1475-1479.
SPA. (2011). Housing Options and Strategy, Gangtok. New Delhi.
Sharma, L. P., Patel, N., Ghose, M. K., and Debnath, P. (2011). Landslide vulnerability assessment andzonation through ranking of causative parameters based on landslide density- derived statisticalindicators. Geocarto International, 26(6), 37-41.
Sharma, L. P., Patel, N., Ghose, M. K., and Debnath, P. (2011b). Landslide vulnerability assessment andzonation through ranking of causative parameters based on landslide density- derived statisticalindicators. Geocarto International, 26(6), 37-41.
Tantala, M., Nordenson, G., Deodatis, G., and Jacob, K. (2008). Earthquake loss estimation for the NewYork City Metropolitan Region. Soil Dynamics and Earthquake Engineering, 28(10-11), 812-835.doi:10.1016/j.soildyn.2007.10.012
UDHD. (2011). City Development Plan. Urban Development and Housing Department, Gangtok.
UNISDR. (2009). Terminology on Disaster Risk Reduction. Response. Geneva, Switzerland: UnitedNations International Strategy for Disaster Risk Reduction.
USGS. (2011). M 6.9, India-Nepal Border Region. Event. Retrived fromhttp://earthquake.usgs.gov/earthquakes/recenteqsww/Quakes/usc0005wg6.php#maps
Whitman, R. V., Anagnos, T., Kircher, C. A., Lagorio, H. J., Lawson, R. S., and Schneider, P. (1997).Development of a National Earthquake Loss Estimation Methodology. Earthquake Spectra, 13(4),643. doi:10.1193/1.1585973

100
ANNEXURE A
Generation of Discrete Damage probabilities
Step 1: Generation of Demand Spectrum
Demand Spectrum is generated by the Equation given by Boore et al. (1997) given Below.
where
and
where is the spectral acceleration to be derivedare constants provided with the equationis the magnitude of earthquakeis the horizontal distance from epicentre
the shear wave velocity of the soil class provided by NEHRP classification
The constants provided with equation by Boore et al. (1997) are
T0 -0.313 -0.117 -0.242 0.527 0 -0.778 -0.371 1396 5.570.1 1.006 1.087 1.059 0.753 -0.226 -0.934 -0.212 1112 6.270.11 1.072 1.164 1.13 0.732 -0.23 -0.937 -0.211 1291 6.650.12 1.109 1.215 1.174 0.721 -0.233 -0.939 -0.215 1452 6.910.13 1.128 1.246 1.2 0.711 -0.233 -0.939 -0.221 1596 7.080.14 1.135 1.261 1.208 0.707 -0.23 -0.938 -0.228 1718 7.180.15 1.128 1.264 1.204 0.702 -0.228 -0.937 -0.238 1820 7.230.16 1.112 1.257 1.192 0.702 -0.226 -0.935 -0.248 1910 7.240.17 1.09 1.242 1.173 0.702 -0.221 -0.933 -0.258 1977 7.210.18 1.063 1.222 1.151 0.705 -0.216 -0.93 -0.27 2037 7.160.19 1.032 1.198 1.122 0.709 -0.212 -0.927 -0.281 2080 7.10.2 0.999 1.17 1.089 0.711 -0.207 -0.924 -0.292 2118 7.020.22 0.925 1.104 1.019 0.721 -0.198 -0.918 -0.315 2158 6.830.24 0.847 1.033 0.941 0.732 -0.189 -0.912 -0.338 2178 6.620.26 0.764 0.958 0.861 0.744 -0.18 -0.906 -0.36 2173 6.390.28 0.681 0.881 0.78 0.758 -0.168 -0.899 -0.381 2158 6.170.3 0.598 0.803 0.7 0.769 -0.161 -0.893 -0.401 2133 5.940.32 0.518 0.725 0.619 0.783 -0.152 -0.888 -0.42 2104 5.720.34 0.439 0.648 0.54 0.794 -0.143 -0.882 -0.438 2070 5.50.36 0.361 0.57 0.462 0.806 -0.136 -0.877 -0.456 2032 5.30.38 0.286 0.495 0.385 0.82 -0.127 -0.872 -0.472 1995 5.10.4 0.212 0.423 0.311 0.831 -0.12 -0.867 -0.487 1954 4.910.42 0.14 0.352 0.239 0.84 -0.113 -0.862 -0.502 1919 4.740.44 0.073 0.282 0.169 0.852 -0.108 -0.858 -0.516 1884 4.570.46 0.005 0.217 0.102 0.863 -0.101 -0.854 -0.529 1849 4.410.48 -0.058 0.151 0.036 0.873 -0.097 -0.85 -0.541 1816 4.26

101
0.5 -0.122 0.087 -0.025 0.884 -0.09 -0.846 -0.553 1782 4.130.55 -0.268 -0.063 -0.176 0.907 -0.078 -0.837 -0.579 1710 3.820.6 -0.401 -0.203 -0.314 0.928 -0.069 -0.83 -0.602 1644 3.570.65 -0.523 -0.331 -0.44 0.946 -0.06 -0.823 -0.622 1592 3.360.7 -0.634 -0.452 -0.555 0.962 -0.053 -0.818 -0.639 1545 3.20.75 -0.737 -0.562 -0.661 0.979 -0.046 -0.813 -0.653 1507 3.070.8 -0.829 -0.666 -0.76 0.992 -0.041 -0.809 -0.666 1476 2.980.85 -0.915 -0.761 -0.851 1.006 -0.037 -0.805 -0.676 1452 2.920.9 -0.993 -0.848 -0.933 1.018 -0.035 -0.802 -0.685 1432 2.890.95 -1.066 -0.932 -1.01 1.027 -0.032 -0.8 -0.692 1416 2.881 -1.133 -1.009 -1.08 1.036 -0.032 -0.798 -0.698 1406 2.91.1 -1.249 -1.145 -1.208 1.052 -0.03 -0.795 -0.706 1396 2.991.2 -1.345 -1.265 -1.315 1.064 -0.032 -0.794 -0.71 1400 3.141.3 -1.428 -1.37 -1.407 1.073 -0.035 -0.793 -0.711 1416 3.361.4 -1.495 -1.46 -1.483 1.08 -0.039 -0.794 -0.709 1442 3.621.5 -1.552 -1.538 -1.55 1.085 -0.044 -0.796 -0.704 1479 3.921.6 -1.598 -1.608 -1.605 1.087 -0.051 -0.798 -0.697 1524 4.261.7 -1.634 -1.668 -1.652 1.089 -0.058 -0.801 -0.689 1581 4.621.8 -1.663 -1.718 -1.689 1.087 -0.067 -0.804 -0.679 1644 5.011.9 -1.685 -1.763 -1.72 1.087 -0.074 -0.808 -0.667 1714 5.422 -1.699 -1.801 -1.743 1.085 -0.085 -0.812 -0.655 1795 5.85
The other parameters considered in the equation are
6.968.7487 KmSite class B Average 1125 m/s
Then from the equation spectral acceleration SA is derived. Then SD is calculated from the equation givenbelow
where is the Spectral Acceleration calculated from the first equationT is the time period in seconds as given in the constants provided with the equation
So we get demand spectrum when we plot the generated SD in x-axis and SA in y axis shown in the graphbelow.

102
Step 2: Generation of Capacity CurvesThe capacity curves of buildings are generated by the parameters given by the HAZUS manual for eachbuilding type. The values for wooden building type W1 are given in the table below. Different seismiclevel design has different values. The values of pre code design level and taken in the case.
Building Type Yield Capacity Ultimate Capacity
Pre- Code Seismic DesignW1 0.24 0.200 4.32 0.600
The plot between the yield capacity points and ultimate capacity points generates the capacity curves.
Step 3: Calculate Peak Building Response (SD)By overlaying the capacity curve over the demand spectrum, the value at the intersection point of twographs gives us the peak spectral displacement or peak building response from which the damageprobabilities are calculated. The intersection point is shown in the graph below.

103
Peak Building ResponseBuilding Type W1Peak Building Response (SD) 0.12
Step 4: Calculation of Damage ProbabilityHAZUS manual has given the formula for calculating the damage probability. The damage probabilitiesare calculated for four damage scenarios, slight, moderate, extreme and complete by the given equationbelow.
where is the probability of reaching the slight damage state for a given peak buildingresponseis the median value of spectral displacement at which the building reaches thethreshold of damage state,is the standard deviation of the natural logarithm of spectraldisplacement for damage stateis the standard normal cumulative distribution function
Median and standard deviation values for each damage state and for seismic design levels are given in themanual. The parameters given for the W1 building, pre-design level code for slight, moderate, extreme andcomplete are given in the table below.
BuildingType
Slight Moderate Extensive Complete
Pre- Code Seismic DesignW1 0.40 1.01 1.00 1.05 3.09 1.07 7.56 1.06
By using these values the cumulative damage probabilities for each state are generated. From thesecumulative damage probabilities, discrete damage probabilities are calculated from the equations givenbelow.
ProbabilityComplete Damage =Extensive Damage =Moderate Damage =Slight Damage =No Damage =
Slight Moderate Extreme CompleteCumulative Damage Probability
0.1166 0.0217 0.0012 0.0000Discrete Damage Probability
0.0960 0.0206 0.0012 0.0000

104
Percentage Slight Moderate Extreme Complete9.6045 2.0575 0.1153 0.0046
Cumulative Damage Probabilities Low code
Cumulative Damage Probabilities Low code at 270 m/sBuilding Type Slight Moderate Extreme Complete
W1 0.1887 0.0381 0.0025 0.0001C3L 0.4791 0.2416 0.0614 0.0029C3M 0.3901 0.1312 0.0097 0.0030C3H 0.4266 0.1337 0.0268 0.0038
Cumulative Damage Probabilities Low code at 560 m/sBuilding Type Slight Moderate Extreme Complete
W1 0.1103 0.0180 0.0009 0.0000C3L 0.2284 0.0799 0.0125 0.0002C3M 0.1189 0.0205 0.0005 0.0002C3H 0.1329 0.0228 0.0039 0.0004
Cumulative Damage Probabilities Low code at 760 m/sBuilding Type Slight Moderate Extreme Complete
W1 0.0855 0.0127 0.0006 0.0000C3L 0.1445 0.0420 0.0052 0.0000C3M 0.0659 0.0087 0.0001 0.0001C3H 0.0759 0.0105 0.0018 0.0002
0
2
4
6
8
10
12
W1
Slight
Moderate
Extreme
Complete

105
Cumulative Damage Probabilities Low code at 1125 m/sBuilding Type Slight Moderate Extreme Complete
W1 0.0624 0.0084 0.0003 0.0000C3L 0.0838 0.0200 0.0020 0.0000C3M 0.0384 0.0041 0.0000 0.0000C3H 0.0353 0.0038 0.0007 0.0001
Cumulative Damage Probabilities Low code at 1500 m/sBuilding Type Slight Moderate Extreme Complete
W1 0.0418 0.0050 0.0002 0.0000C3L 0.0609 0.0131 0.0011 0.0000C3M 0.0250 0.0022 0.0000 0.0000C3H 0.0173 0.0015 0.0003 0.0000
Cumulative Damage Probabilities Pre code
Cumulative Damage Probabilities Pre code at 270 m/sBuilding Type Slight Moderate Extreme Complete
W1 0.2770 0.0746 0.0068 0.0004C3L 0.5570 0.3248 0.1047 0.0064C3M 0.5240 0.2287 0.0420 0.0062C3H 0.5687 0.2268 0.0501 0.0071
Cumulative Damage Probabilities Pre code at 560 m/sBuilding Type Slight Moderate Extreme Complete
W1 0.1821 0.0405 0.0028 0.0001C3L 0.3121 0.1335 0.0280 0.0005C3M 0.2022 0.0466 0.0044 0.0004C3H 0.2187 0.0471 0.0079 0.0007
Cumulative Damage Probabilities Pre code at 760 m/sBuilding Type Slight Moderate Extreme Complete
W1 0.1493 0.0306 0.0019 0.0001C3L 0.2177 0.0793 0.0135 0.0001C3M 0.1199 0.0209 0.0015 0.0001C3H 0.1383 0.0240 0.0038 0.0003
Cumulative Damage Probabilities Pre code at 1125 m/sBuilding Type Slight Moderate Extreme Complete
W1 0.1166 0.0217 0.0012 0.0000C3L 0.1417 0.0434 0.0060 0.0000C3M 0.0773 0.0109 0.0007 0.0000C3H 0.0679 0.0089 0.0014 0.0001

106
Cumulative Damage Probabilities Pre code at 1500 m/sBuilding Type Slight Moderate Extreme Complete
W1 0.0849 0.0142 0.0007 0.0000C3L 0.1102 0.0307 0.0038 0.0000C3M 0.0544 0.0065 0.0003 0.0000C3H 0.0401 0.0044 0.0007 0.0000
Discrete Damage Probabilities Low -code
Discrete Damage Probabilities Low code at 270 m/sBuilding Type Slight Moderate Extreme Complete
W1 0.1530 0.0357 0.0024 0.0001C3L 0.2960 0.1831 0.0585 0.0029C3M 0.2657 0.1245 0.0067 0.0030C3H 0.3159 0.1108 0.0230 0.0038
Discrete Damage Probabilities Low code at 560 m/sBuilding Type Slight Moderate Extreme Complete
W1 0.0932 0.0171 0.0009 0.0000C3L 0.1609 0.0676 0.0123 0.0002C3M 0.0987 0.0202 0.0003 0.0002C3H 0.1136 0.0193 0.0035 0.0004
Discrete Damage Probabilities Low code at 760 m/sBuilding Type Slight Moderate Extreme Complete
W1 0.0734 0.0122 0.0006 0.0000C3L 0.1077 0.0368 0.0052 0.0000C3M 0.0573 0.0086 0.0001 0.0001C3H 0.0670 0.0089 0.0016 0.0002
Discrete Damage Probabilities Low code at 1125 m/sBuilding Type Slight Moderate Extreme Complete
W1 0.0544 0.0081 0.0544 0.0000C3L 0.0658 0.0180 0.0658 0.0000C3M 0.0344 0.0040 0.0344 0.0000C3H 0.0320 0.0032 0.0320 0.0001
Discrete Damage Probabilities Low code at 1500 m/sBuilding Type Slight Moderate Extreme Complete
W1 0.0370 0.0048 0.0370 0.0000C3L 0.0490 0.0119 0.0490 0.0000C3M 0.0227 0.0022 0.0227 0.0000C3H 0.0160 0.0013 0.0160 0.0000

107
Discrete Damage Probabilities Pre code
Discrete Damage Probabilities Pre code at 270 m/sBuilding Type Slight Moderate Extreme Complete
W1 0.2086 0.0683 0.0063 0.0004C3L 0.3305 0.2265 0.0983 0.0064C3M 0.3311 0.1929 0.0358 0.0062C3H 0.3848 0.1838 0.0430 0.0071
Discrete Damage Probabilities Pre code at 560 m/sBuilding Type Slight Moderate Extreme Complete
W1 0.2086 0.0683 0.0063 0.0001C3L 0.3305 0.2265 0.0983 0.0005C3M 0.3311 0.1929 0.0358 0.0004C3H 0.3848 0.1838 0.0430 0.0007
Discrete Damage Probabilities Pre code at 760 m/sBuilding Type Slight Moderate Extreme Complete
W1 0.1206 0.0287 0.0018 0.0001C3L 0.1519 0.0659 0.0134 0.0001C3M 0.1005 0.0195 0.0014 0.0001C3H 0.1178 0.0205 0.0035 0.0003
Discrete Damage Probabilities Pre code at 1125 m/sBuilding Type Slight Moderate Extreme Complete
W1 0.0960 0.0206 0.0012 0.0000C3L 0.1043 0.0374 0.0060 0.0000C3M 0.0671 0.0102 0.0006 0.0000C3H 0.0603 0.0076 0.0013 0.0001
Discrete Damage Probabilities Pre code at 1500 m/sBuilding Type Slight Moderate Extreme Complete
W1 0.0714 0.0135 0.0006 0.0000C3L 0.0832 0.0269 0.0038 0.0000C3M 0.0482 0.0062 0.0003 0.0000C3H 0.0364 0.0038 0.0006 0.0000

108
Percentage Damage Low code
Percentage of Damage Low code at 270 m/sBuilding Type Slight Moderate Extreme CompleteW1 15.2957 3.5722 0.2415 0.0073C3L 29.6037 18.3053 5.8530 0.2868C3M 26.5667 12.4465 0.6718 0.2990C3H 31.5866 11.0756 2.2968 0.3788Average 25.76318 11.3499 2.265775 0.242975
Percentage of Damage Low code at 560 m/sBuilding Type Slight Moderate Extreme CompleteW1 9.3166 1.7084 0.0883 0.0019C3L 16.0882 6.7564 1.2346 0.0165C3M 9.8712 2.0217 0.0264 0.0207C3H 11.3595 1.9330 0.3472 0.0405Average 11.65888 3.104875 0.424125 0.0199
Percentage of Damage Low code at 760 m/sBuilding Type Slight Moderate Extreme CompleteW1 7.3353 1.2181 0.0563 0.0010C3L 10.7689 3.6806 0.5192 0.0036C3M 5.7272 0.8635 0.0058 0.0068C3H 6.6999 0.8939 0.1608 0.0169Average 7.632825 1.664025 0.185525 0.007075
Percentage of Damage Low code at 1125 m/sBuilding Type Slight Moderate Extreme CompleteW1 5.4381 0.8068 0.0328 0.0005C3L 6.5761 1.8049 0.1964 0.0007C3M 3.4362 0.4043 0.0014 0.0027C3H 3.2039 0.3228 0.0603 0.0057Average 4.663575 0.8347 0.072725 0.0024
Percentage of Damage Low code at 1500 m/sBuilding Type Slight Moderate Extreme CompleteW1 3.6953 0.4811 0.0169 0.0002C3L 4.8970 1.1943 0.1135 0.0003C3M 2.2727 0.2230 0.0004 0.0013C3H 1.6012 0.1288 0.0256 0.0022Average 3.11655 0.5068 0.0391 0.001
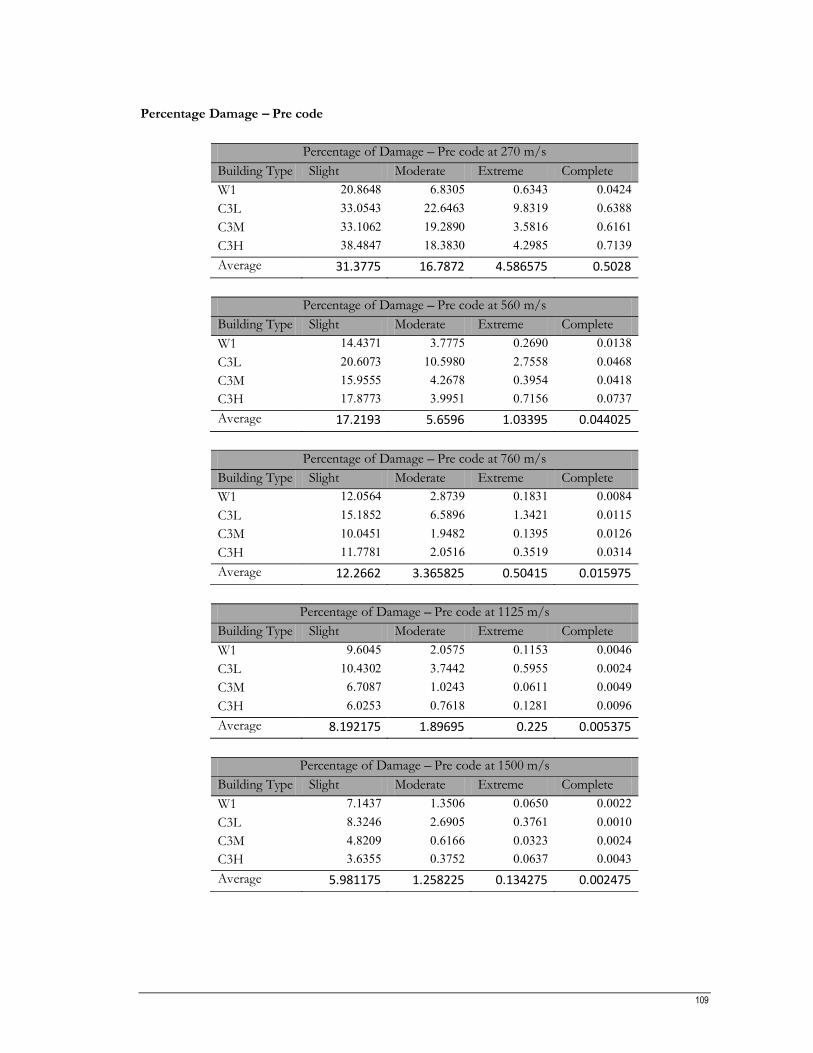
109
Percentage Damage Pre code
Percentage of Damage Pre code at 270 m/sBuilding Type Slight Moderate Extreme CompleteW1 20.8648 6.8305 0.6343 0.0424C3L 33.0543 22.6463 9.8319 0.6388C3M 33.1062 19.2890 3.5816 0.6161C3H 38.4847 18.3830 4.2985 0.7139Average 31.3775 16.7872 4.586575 0.5028
Percentage of Damage Pre code at 560 m/sBuilding Type Slight Moderate Extreme CompleteW1 14.4371 3.7775 0.2690 0.0138C3L 20.6073 10.5980 2.7558 0.0468C3M 15.9555 4.2678 0.3954 0.0418C3H 17.8773 3.9951 0.7156 0.0737Average 17.2193 5.6596 1.03395 0.044025
Percentage of Damage Pre code at 760 m/sBuilding Type Slight Moderate Extreme CompleteW1 12.0564 2.8739 0.1831 0.0084C3L 15.1852 6.5896 1.3421 0.0115C3M 10.0451 1.9482 0.1395 0.0126C3H 11.7781 2.0516 0.3519 0.0314Average 12.2662 3.365825 0.50415 0.015975
Percentage of Damage Pre code at 1125 m/sBuilding Type Slight Moderate Extreme CompleteW1 9.6045 2.0575 0.1153 0.0046C3L 10.4302 3.7442 0.5955 0.0024C3M 6.7087 1.0243 0.0611 0.0049C3H 6.0253 0.7618 0.1281 0.0096Average 8.192175 1.89695 0.225 0.005375
Percentage of Damage Pre code at 1500 m/sBuilding Type Slight Moderate Extreme CompleteW1 7.1437 1.3506 0.0650 0.0022C3L 8.3246 2.6905 0.3761 0.0010C3M 4.8209 0.6166 0.0323 0.0024C3H 3.6355 0.3752 0.0637 0.0043Average 5.981175 1.258225 0.134275 0.002475

110
ANNEXURE B
Analytical Hierarchy Process (AHP)Pair-wise comparison scale
Numerical Rating Judgments9 Extremely preferred8 Very strongly to extremely7 Very strongly preferred6 Strongly to very strongly5 Strongly preferred4 Moderately to strongly3 Moderately preferred2 Equally to moderately1 Equally preferred
Pair- wise comparison matrix
Land Stability Building Density SlopeLand Stability 1.000 1.000 5.000Building Density 1.000 1.000 3.000Slope 0.200 0.333 1.000Row total 2.200 2.333 9.000
Synthesized Matrix
Land Stability Building Density Slope Priority VectorLand Stability 0.455 0.429 0.556 0.480Building Density 0.455 0.429 0.333 0.405Slope 0.143 0.091 0.111 0.115
Total 1.000
Weighted sum matrix
1.000 1.000 5.000 1.4600.405* 1.000 + 0.480 * 1.000 + 0.115 * 3.000 = 1.230
0.200 0.333 1.000 0.346
All the elements in the of the weighted sum matrices were divided by theie respective priority vectorelement.
1.230 =3.044, 1.460 =3.033, 1.000=3.010
0.405 0.480 0.115

111
max
max = 3.033+3.044+3.010 = 3.0293
Consistency Index
CI = max nn-1
Number of factors n=3
CI =3.029 3
= 0.0153-1
Average Random Consistency Matrix (ARI)
Factors 1 2 3 4 5 6 7 8 9 10ARI 0 0 0.58 0.9 1.12 1.24 1.32 1.41 1.45 1.49
Consistency Ratio
CR = CIARI
ARI = 0.58
CI = 0.015 = 0.0250.58
As the value of the consistency ratio was less than 0.1, the above weights assigned are. acceptable