Earth and Planetary Science · Earth and Planetary Science Letters. ... 1982; Sarmiento et al.,...
12
Earth and Planetary Science Letters 432 (2015) 342–353 Contents lists available at ScienceDirect Earth and Planetary Science Letters www.elsevier.com/locate/epsl Distal and proximal controls on the silicon stable isotope signature of North Atlantic Deep Water Gregory F. de Souza a,b,∗ , Richard D. Slater a , Mathis P. Hain c , Mark A. Brzezinski d , Jorge L. Sarmiento a a Program in Atmospheric and Oceanic Sciences, Princeton University, Princeton, NJ 08544, USA b ETH Zurich, Institute of Geochemistry and Petrology, NW C81.3, Clausiusstrasse 25, 8092 Zurich, Switzerland c National Oceanography Centre, University of Southampton, Southampton SO14 3ZH, UK d Marine Science Institute, University of California, Santa Barbara, CA 93106, USA a r t i c l e i n f o a b s t r a c t Article history: Received 19 July 2015 Received in revised form 11 October 2015 Accepted 18 October 2015 Available online xxxx Editor: H. Stoll Keywords: biogeochemical cycles silicon isotopes meridional overturning circulation It has been suggested that the uniquely high δ 30 Si signature of North Atlantic Deep Water (NADW) results from the contribution of isotopically fractionated silicic acid by mode and intermediate waters that are formed in the Southern Ocean and transported to the North Atlantic within the upper limb of the meridional overturning circulation (MOC). Here, we test this hypothesis in a suite of ocean general circulation models (OGCMs) with widely varying MOCs and related pathways of nutrient supply to the upper ocean. Despite their differing MOC pathways, all models reproduce the observation of a high δ 30 Si signature in NADW, as well showing a major or dominant (46–62%) contribution from Southern Ocean mode/intermediate waters to its Si inventory. These models thus confirm that the δ 30 Si signature of NADW does indeed owe its existence primarily to the large-scale transport of a distal fractionation signal created in the surface Southern Ocean. However, we also find that more proximal fractionation of Si upwelled to the surface within the Atlantic Ocean must also play some role, contributing 20–46% of the deep Atlantic δ 30 Si gradient. Finally, the model suite reveals compensatory effects in the mechanisms contributing to the high δ 30 Si signature of NADW, whereby less export of high-δ 30 Si mode/intermediate waters to the North Atlantic is compensated by production of a high-δ 30 Si signal during transport to the NADW formation region. This trade-off decouples the δ 30 Si signature of NADW from the pathways of deep water upwelling associated with the MOC. Thus, whilst our study affirms the importance of cross- equatorial transport of Southern Ocean-sourced Si in producing the unique δ 30 Si signature of NADW, it also shows that the presence of a deep Atlantic δ 30 Si gradient does not uniquely constrain the pathways by which deep waters are returned to the upper ocean. © 2015 Elsevier B.V. All rights reserved. 1. Introduction 1.1. Marine Si cycling and the δ 30 Si distribution The cycling of nutrients in the sea is determined by a com- plex set of interactions between biota in the surface ocean and the physical circulation across a range of spatial and temporal scales. At the global scale, the export of nutrients to the abyss in biogenic particles is balanced by the supply of dissolved nu- trients via the upwelling of nutrient-rich deep waters in the MOC (Broecker and Peng, 1982; Sarmiento et al., 2007). At the scale of * Corresponding author at: ETH Zurich, Institute of Geochemistry and Petrology, NW C81.3, Clausiusstrasse 25, 8092 Zurich, Switzerland. Tel.: +41 44 632 6983. E-mail address: [email protected] (G.F. de Souza). the thermocline, nutrient distributions are determined by how the location and timing of biological nutrient drawdown at the surface interacts with the subduction of water masses and their gyre- to basin-scale circulation (Sarmiento et al., 2004; Palter et al., 2005; Karleskind et al., 2011). These distributions in turn determine the magnitude, biogeography and distribution of low-latitude primary productivity (Marinov et al., 2006; Palter et al., 2010, 2011). The ocean interior distributions of nutrients thus both influence and are influenced by biological productivity, and bear the imprint of the interaction between productivity and the ocean’s three- dimensional circulation, allowing them to be used to infer the physical and biological interactions that determine marine nutri- ent cycling. This study takes such an approach in order to trace the influence of physical–biological interactions on the large-scale transports associated with the marine cycle of silicon (Si). http://dx.doi.org/10.1016/j.epsl.2015.10.025 0012-821X/© 2015 Elsevier B.V. All rights reserved.
Transcript of Earth and Planetary Science · Earth and Planetary Science Letters. ... 1982; Sarmiento et al.,...

Earth and Planetary Science Letters 432 (2015) 342–353
Contents lists available at ScienceDirect
Earth and Planetary Science Letters
www.elsevier.com/locate/epsl
Distal and proximal controls on the silicon stable isotope signature
of North Atlantic Deep Water
Gregory F. de Souza a,b,∗, Richard D. Slater a, Mathis P. Hain c, Mark A. Brzezinski d, Jorge L. Sarmiento a
a Program in Atmospheric and Oceanic Sciences, Princeton University, Princeton, NJ 08544, USAb ETH Zurich, Institute of Geochemistry and Petrology, NW C81.3, Clausiusstrasse 25, 8092 Zurich, Switzerlandc National Oceanography Centre, University of Southampton, Southampton SO14 3ZH, UKd Marine Science Institute, University of California, Santa Barbara, CA 93106, USA
a r t i c l e i n f o a b s t r a c t
Article history:Received 19 July 2015Received in revised form 11 October 2015Accepted 18 October 2015Available online xxxxEditor: H. Stoll
Keywords:biogeochemical cyclessilicon isotopesmeridional overturning circulation
It has been suggested that the uniquely high δ30Si signature of North Atlantic Deep Water (NADW) results from the contribution of isotopically fractionated silicic acid by mode and intermediate waters that are formed in the Southern Ocean and transported to the North Atlantic within the upper limb of the meridional overturning circulation (MOC). Here, we test this hypothesis in a suite of ocean general circulation models (OGCMs) with widely varying MOCs and related pathways of nutrient supply to the upper ocean. Despite their differing MOC pathways, all models reproduce the observation of a high δ30Si signature in NADW, as well showing a major or dominant (46–62%) contribution from Southern Ocean mode/intermediate waters to its Si inventory. These models thus confirm that the δ30Si signature of NADW does indeed owe its existence primarily to the large-scale transport of a distal fractionation signal created in the surface Southern Ocean. However, we also find that more proximal fractionation of Si upwelled to the surface within the Atlantic Ocean must also play some role, contributing 20–46% of the deep Atlantic δ30Si gradient. Finally, the model suite reveals compensatory effects in the mechanisms contributing to the high δ30Si signature of NADW, whereby less export of high-δ30Si mode/intermediate waters to the North Atlantic is compensated by production of a high-δ30Si signal during transport to the NADW formation region. This trade-off decouples the δ30Si signature of NADW from the pathways of deep water upwelling associated with the MOC. Thus, whilst our study affirms the importance of cross-equatorial transport of Southern Ocean-sourced Si in producing the unique δ30Si signature of NADW, it also shows that the presence of a deep Atlantic δ30Si gradient does not uniquely constrain the pathways by which deep waters are returned to the upper ocean.
© 2015 Elsevier B.V. All rights reserved.
1. Introduction
1.1. Marine Si cycling and the δ30Si distribution
The cycling of nutrients in the sea is determined by a com-plex set of interactions between biota in the surface ocean and the physical circulation across a range of spatial and temporal scales. At the global scale, the export of nutrients to the abyss in biogenic particles is balanced by the supply of dissolved nu-trients via the upwelling of nutrient-rich deep waters in the MOC (Broecker and Peng, 1982; Sarmiento et al., 2007). At the scale of
* Corresponding author at: ETH Zurich, Institute of Geochemistry and Petrology, NW C81.3, Clausiusstrasse 25, 8092 Zurich, Switzerland. Tel.: +41 44 632 6983.
E-mail address: [email protected] (G.F. de Souza).
http://dx.doi.org/10.1016/j.epsl.2015.10.0250012-821X/© 2015 Elsevier B.V. All rights reserved.
the thermocline, nutrient distributions are determined by how the location and timing of biological nutrient drawdown at the surface interacts with the subduction of water masses and their gyre- to basin-scale circulation (Sarmiento et al., 2004; Palter et al., 2005;Karleskind et al., 2011). These distributions in turn determine the magnitude, biogeography and distribution of low-latitude primary productivity (Marinov et al., 2006; Palter et al., 2010, 2011). The ocean interior distributions of nutrients thus both influence and are influenced by biological productivity, and bear the imprint of the interaction between productivity and the ocean’s three-dimensional circulation, allowing them to be used to infer the physical and biological interactions that determine marine nutri-ent cycling. This study takes such an approach in order to trace the influence of physical–biological interactions on the large-scale transports associated with the marine cycle of silicon (Si).

G.F. de Souza et al. / Earth and Planetary Science Letters 432 (2015) 342–353 343
Of the ocean’s photosynthesizing primary producers, diatoms are the most important group for the export of organic carbon from the surface ocean (e.g. Buesseler, 1998). As a result, they play a key role in the biological pump, a mechanism by which the ocean modulates atmospheric pCO2 (Hain et al., 2014a). Whilst their opaline cell wall, or frustule, provides diatoms protection from predators (Smetacek, 1999) and is less energy-intensive to produce than an organic cell wall (Raven, 1983), it also makes them vitally dependent on the presence of Si dissolved in sea-water. The boom-bust behavior of diatom populations that leads to their importance for carbon export also means that diatoms are very efficient exporters of Si to depth (Brzezinski et al., 2003), such that they are the main driver of marine Si cycling (Tréguer and De la Rocha, 2013). Diatom uptake of Si discriminates between its isotopes, with lighter Si isotopes being preferentially incorporated into the frustule (De la Rocha et al., 1997; Sutton et al., 2013), leaving the residual Si in seawater enriched in heavier Si isotopes. Diatom Si uptake at the ocean’s surface thus produces a signal of biological cycling in the stable isotope composition of seawater Si (expressed in the standard delta notation as δ30Si), which can be used as a tracer of the marine Si cycle (e.g. Cardinal et al., 2005;Reynolds et al., 2006; Beucher et al., 2008; de Souza et al., 2012a;Grasse et al., 2013). For instance, diatom uptake in the surface Southern Ocean produces elevated δ30Si in the deep winter mixed layers from which the Southern Ocean mode/intermediate water masses Subantarctic Mode Water (SAMW) and Antarctic Intermedi-ate Water (AAIW) are ventilated (Fripiat et al., 2011). This isotopic signal is transported into the subtropical interior by the spreading of these water masses from their formation regions (de Souza et al., 2012b).
The clearest large-scale signal in the marine δ30Si distribution is the δ30Si gradient in the deep Atlantic Ocean (Fig. 1a; de Souza et al., 2012a; Brzezinski and Jones, 2015), with a systematic trend from high δ30Si values in deep waters of the Si-poor North At-lantic, influenced by NADW, to lower values towards the Si-richer south, influenced by Antarctic Bottom Water (AABW). This co-herent gradient is related to the quasi-conservative mixing of Si between these two water masses (Broecker et al., 1991), as re-flected by the systematics (Fig. 1a) and water-column distribution (Fig. 1b) of δ30Si in the Atlantic, both of which indicate water-mass control on the δ30Si distribution. de Souza et al. (2012a)suggested that the high δ30Si value of NADW ultimately results from the creation of a high-δ30Si signal by diatom Si uptake in the surface Southern Ocean, a signal that is transported to the North Atlantic by SAMW/AAIW in the upper limb of the MOC. This mech-anism has since been invoked to explain the isotope distributions of other biogeochemically-cycled elements, such as cadmium (e.g. Abouchami et al., 2014).
Such a Southern-Ocean-focused mechanism is consistent with burgeoning evidence that the dominant MOC pathway by which dense and nutrient-rich deep waters are brought to the surface is the wind-driven upwelling in the Southern Ocean (Toggweiler and Samuels, 1993; Sarmiento et al., 2004; Lumpkin and Speer, 2007;Marshall and Speer, 2012; Morrison et al., 2015), contrary to the canonical view of upwelling through the low-latitude thermocline (Robinson and Stommel, 1959; Broecker and Peng, 1982). However, some recent observationally-based estimates of global overturning indicate a significant role of low-latitude upwelling in closing the MOC (Talley et al., 2003; Talley, 2008). By using numerical ocean models to examine the relationship between the NADW δ30Si sig-nature and the pathways by which Si is transported by the MOC, this study assesses de Souza et al.’s (2012a) hypothesis of large-scale controls on the Atlantic δ30Si distribution, whilst also consid-ering the constraints placed by these observations on pathways of upwelling associated with the MOC.
Fig. 1. Silicon isotope data from the Atlantic Ocean. (a) Data from the deep (>2000 m) Atlantic Ocean from latitudes ranging from ∼60◦N to ∼60◦S in isotope mixing space (de Souza et al., 2012a), illustrating the systematic variation of deep water δ30Si values. The near-linear relationship between δ30Si and 1/[Si] indicates quasi-conservative mixing of Si brought into the deep Atlantic by Si-rich Southern Ocean sources (CDW) as well as Si-poor North Atlantic (LSW) and Nordic (DSOW, ISOW) sources. Open red symbols are results from the OGCMs used in this study (see Section 2.1), subsampled at the observational sampling locations. (b) Depth profiles of δ30Si from the GEOTRACES North Atlantic Zonal Transect at 20◦–40◦N (Brzezinski and Jones, 2015) reveal the elevated δ30Si values associated with the southward transport of NADW at mid-depths in the western Atlantic Ocean (blue and green points; see inset). (For interpretation of the references to color in this figure legend, the reader is referred to the web version of this article.)
1.2. Support for a Southern Ocean control
Support for a Southern Ocean control on the NADW δ30Si sig-nature is provided by the model CYCLOPS, an ocean box model originally developed by Keir (1988) that has been modified to explicitly represent the physical and biogeochemical zonation of the surface Southern Ocean (Fig. 2a; Robinson et al., 2005;Hain et al., 2014b). A representation of the marine cycling of Si and its isotopes (see Supplementary Information) allows an as-sessment of the leading-order sensitivities of the large-scale δ30Si distribution. As shown in Fig. 2b, the observed deep Atlantic Si concentration gradient (∼110 μM) can be reproduced by simulta-neously varying the length-scale defining the dissolution of opal export (which determines the partitioning of opal dissolution be-tween the intermediate and deep ocean) and the degree of Si drawdown in the Subantarctic Zone (SAZ), from where the model’s Southern Ocean mode/intermediate waters are ventilated. In con-trast, the gradient in δ30Si between NADW and the deep Southern Ocean is mostly insensitive to the opal dissolution length-scale, but varies systematically with Si drawdown in the SAZ, disappear-

344 G.F. de Souza et al. / Earth and Planetary Science Letters 432 (2015) 342–353
Fig. 2. (a) Schematic representation of the Atlantic circulation in the CYCLOPS ocean box model (Hain et al., 2014b), highlighting advective transport (black arrows) and diffusive exchange (red arrows) fluxes. In the sensitivity study discussed in the text (Section 1.2), the Si concentration of the Subantarctic surface box (light red shading) was systematically varied together with the length scale of opal dissolution, which controls the fraction of the sinking opal flux exported to the deep ocean boxes. The results of these parameter variations on the deep Atlantic [Si] and δ30Si gradients (calculated as the difference between the deep high-latitude boxes; light blue shad-ing) is shown in panel b (warm colours: �[Si] in μM; cool colours: �δ30Si in �). PAZ: polar Antarctic zone; AZ: Antarctic zone. The light blue shaded region in panel b corresponds to observations (�[Si] ∼ 108 μM, �δ30Si ∼ 0.5�). (For interpreta-tion of the references to color in this figure legend, the reader is referred to the web version of this article.)
ing when the Si concentration in the SAZ is forced to zero, so as not to leave any residual high-δ30Si in the SAZ surface (Fig. 2b). Under these conditions, the model’s advective pathway of Si sup-ply from the surface Southern Ocean to the high-latitude North Atlantic via mode/intermediate waters has been entirely elimi-nated, such that Si can reach the North Atlantic solely via diffusive upward supply from the low-latitude deep ocean. This sensitivity
of the Atlantic δ30Si gradient to Si supply by mode/intermediate waters supports the hypothesis that it results from the cross-equatorial transport of a partial Si consumption signal from the surface Southern Ocean. In the following, we further test this hy-pothesis by explicitly tracing the origins of Si supplied to the North Atlantic by the large-scale ocean circulation in a suite of OGCMs in which the pathways of deep water upwelling associated with the MOC are systematically varied.
1.3. A theoretical framework
Gnanadesikan’s (1999; hereafter G99) analytical model of the volume balance of the oceanic pycnocline (Fig. 3a) provides the conceptual basis for the OGCM suite presented in this study. This model shows that the depth D of the pycnocline, separating the buoyant waters of the upper ocean from the dense waters of the deep, results from the balance between four key processes that add or remove buoyant water from the upper ocean. These pro-cesses are (i) the formation of deep water in the North Atlantic (Tn in Fig. 3a), the balance between (ii) wind-driven upwelling and northward Ekman transport in the Southern Ocean (T w ) and (iii) southward eddy-induced advection of light waters (Te), and (iv) low-latitude upwelling through the thermocline (Tu ). There are two pathways by which volume lost from the upper ocean during NADW formation can be replaced: (a) downward heat transport driven by diapycnal mixing lightens dense waters, leading to an upwelling flux through the thermocline; (b) Ekman divergence in the Southern Ocean drives the adiabatic upwelling of deep waters, which are converted to lighter waters at the surface. G99 showed that the partitioning of upwelling between these two pathways depends on diapycnal mixing and the advective effects of eddies, represented by the diapycnal and isopycnal eddy diffusivities (κvand AI ) respectively. When these diffusivities are small, both low-latitude upwelling Tu and the eddy return flow Te compensating northward Ekman transport T w are minimal, such that deep up-welling (and the associated nutrient supply) is driven by Ekman divergence in the surface Southern Ocean T w (Fig. 3a). If, on the other hand, AI is large enough that the southward advective eddy transport in the Southern Ocean largely compensates northward Ekman transport (i.e. if the net flux T w − Te is small), most up-welling takes place at low latitudes (Tu ). This simultaneously re-quires high κv in order to maintain the observed depth of the pycnocline against a large upwelling flux. This simple model thus makes an important point: the pathway by which dissolved nu-trients stored in the deep ocean return to the surface depends on the vigorousness of turbulent mixing across and along den-sity surfaces. By varying both these parameters simultaneously in a numerical ocean model, we can produce widely varying path-ways of upwelling whilst maintaining the observed depth of the
Fig. 3. (a) Theoretical model framework of Gnanadesikan (1999) and (b) northward meridional volume transport above the σθ = 27.4 isopycnal in the suite of OGCMs used in this study, whose construction is based on the theory of Gnanadesikan (1999). In panel a, the depth D of the pycnocline (light blue shading) is maintained by the volume balance between flux Tn representing sinking of dense water in the North Atlantic, Tu representing low-latitude upwelling, and the balance between wind-driven northward Ekman transport T w and eddy-induced southward transport Te in the Southern Ocean. (For interpretation of the references to color in this figure legend, the reader is referred to the web version of this article.)

G.F. de Souza et al. / Earth and Planetary Science Letters 432 (2015) 342–353 345
ocean’s pycnocline. This study utilizes three variants of an OGCM with differing MOC pathways in order to systematically examine the relationship between the δ30Si signature of NADW and large-scale Si transport.
2. Methods
2.1. Model description and setup
The physical ocean model used is the Modular Ocean Model 3.0 (MOM3; Pacanowski and Griffies, 1999), run at 3.75◦ × 4.5◦ hor-izontal resolution with 24 vertical levels. This primitive-equation OGCM forms the basis of a model suite in which the values of dia-pycnal and isopycnal diffusivity are systematically varied according to the theory of G99, so as to produce varying MOC pathways. This suite is described in detail by Gnanadesikan et al. (2002, 2004, 2007) and Palter et al. (2010). In this study, we employ model variants LL, HH and P2A, whose key variables are summarized in Table S1. Model variant LL is a version of MOM3 in which both diapycnal and isopycnal eddy diffusivities have low values. In LL, κv in the pycnocline is 1.5 × 10⁻⁵ m2/s, similar to values inferred from direct tracer release experiments (Ledwell et al., 1993, 1998), increasing to 1.3 × 10⁻⁴ m2/s at depth with a hyperbolic tangent transition at 2500 m. Isopycnal diffusivity AI , which is also the co-efficient used in the models’ Gent–McWilliams parameterization of eddy thickness diffusion (Gent et al., 1995), has a constant value of 1000 m2/s in LL. In model variant HH, in contrast, both κv and AIhave high values: at 6 × 10⁻⁵ m2/s, pycnocline κv is four times higher than in LL, whilst the AI of 2000 m2/s is twice as large as in LL. Finally, model variant P2A conforms to observational con-straints of low pycnocline diffusivity (and thus has a pycnocline κv of 1.5 × 10⁻⁵ m2/s and AI of 1000 m2/s, as in LL), but simu-lates increased diapycnal mixing in the Southern Ocean, motivated by observations of high internal wave activity there (Polzin et al., 1997). In addition to a number of specific changes relative to LL as listed in Table S1 (and discussed by de Souza et al., 2014), P2A is forced by the ECMWF atmospheric reanalysis of Trenberth et al. (1989), which imposes higher wind stresses over the Southern Ocean than the reanalysis that forces LL and HH (Hellerman and Rosenstein, 1983).
The physical models are coupled to the nutrient-restoring bio-geochemical model of Jin et al. (2006), modified by de Souza et al. (2014) to include Si isotopes. As discussed therein, the model simulates isotope fractionation during Si uptake in the surface ocean, but does not fractionate Si isotopes during opal dissolution (Demarest et al., 2009; Wetzel et al., 2014; for a detailed discus-sion of this issue see de Souza et al., 2014). Further diagnostics added for this study (Section 2.2) allow us to trace Si originating from four high-latitude source regions in the models.
The simulations are initialized to steady-state physical condi-tions and distributions of Si and δ30Si from a 5000-yr spin-up simulation for each model variant. The fractional contribution of each of the four source regions (Section 2.2) to the Si inventory is initialized to a globally constant value of 25%, and the sim-ulations run forward for 2000 model years, by which time the Si source tracer distributions achieve equilibrium. Targets for sur-face nutrient restoring are derived from the objectively-analyzedmonthly climatologies of World Ocean Atlas 2009 (WOA09; Garcia et al., 2010). Results of the simulations are presented as aver-ages over the last 20 yrs of the simulations. We also present the models’ equilibrium (pre-bomb) radiocarbon distributions (�14C; Matsumoto et al., 2004) as 10-yr means.
2.2. Si source tagging scheme
In order to study the large-scale Si dynamics and transport in the model variants, we explicitly trace four sources of Si, using the
Fig. 4. Schematic meridional Atlantic section showing the tagging scheme employed to trace Si sources to the North Atlantic Ocean. Curved black lines represent poten-tial density anomaly (σθ ) surfaces labeled at their southern outcrop. Each coloured area represents a tagging region within which Si is assigned a source “identity”. Four sources of Si are traced: SAMW, AAIW, deep Southern Ocean (DEEP) and North Pacific (NPAC). The southern hemisphere tagging regions are circumpolar, whilst the NPAC tagging region is restricted to the North Pacific Ocean. The identity of Si tagged in any one region is destroyed when it enters another coloured tagging region, where it is assigned a new source identity. Within the gray area, tagged Si is cycled by biology and transported by the physical circulation analogously to the total Si pool.
method of Palter et al. (2010). As defined in Fig. 4, we tag and trace Si sourced from (a) the region of SAMW formation (SAMW), (b) the region of AAIW formation (AAIW), (c) the deep Southern Ocean (DEEP), and (d) the subpolar North Pacific Ocean (NPAC). At every model time step, Si within a defined source region is ‘tagged’ with the corresponding source identity. For example, AAIW-derived Si is tagged between the σθ = 27.1 and σθ = 27.4 isopycnals south of where the σθ = 26.5 isopycnal shoals to 200 m (see Fig. 4). Si tagged in this manner is transported away from its source re-gion by the circulation, and retains its source identity as it cycles through the low latitude ocean and into the North Atlantic, our re-gion of interest. Once acquired, source identity is only destroyed when Si enters another source region: e.g., AAIW-derived Si flow-ing northward in the surface Southern Ocean will lose its AAIW identity and be tagged as SAMW-sourced Si once it crosses the instantaneous outcrop of the σθ = 27.1 isopycnal. The sum of all four source tracers equals the total pool of Si, allowing us to trace the fractional contribution of the source regions to the local Si in-ventory at any point in the model. In the following, we refer to Si that has been tagged with a particular source identity as being ‘sourced’ or ‘derived’ from that region (e.g. ‘SAMW-derived’).
3. Results
3.1. MOC pathways, Si and δ30Si distributions
We begin by describing the upwelling pathways of the three model variants. Fig. 3b shows the zonally-averaged northward meridional volume transport above the σθ = 27.4 isopycnal, which lies at a depth of 800–1000 m at low latitudes in all models. An increase in horizontal transport implies upwelling of water across this density surface, into the upper ocean. Thus, the differing lat-itudinal evolution of this transport in the models reflects their differing MOC pathways. The constancy of P2A’s meridional trans-port north of ∼50◦S shows that this model achieves most of its upwelling at high southern latitudes (Fig. 3b). This Southern Ocean upwelling pathway is expected from G99 (Fig. 3a), given the low isopycnal and diapycnal diffusivities and the strong winds over the Southern Ocean (Table S1): P2A not only restricts Tu through lim-

346 G.F. de Souza et al. / Earth and Planetary Science Letters 432 (2015) 342–353
Fig. 5. Meridional sections showing the Atlantic-mean Si distribution in the uppermost 2400 m in World Ocean Atlas 2009 (upper left) and the three model variants. Concentrations are averaged over the Atlantic basin, and over the Southern Ocean from 60◦W to 30◦E.
ited low-latitude diapycnal mixing and Te through low isopycnal diffusivity, but also has high T w as a result of stronger Ekman transport in the Southern Ocean. In contrast, volume transport in HH increases over a wide latitudinal band from ∼50◦S to ∼30◦N, reflecting low-latitude upwelling. The importance of low-latitude transport (Tu) for the overturning is expected from G99, given HH’s high diffusivities and weaker Southern Ocean winds. Model variant LL is intermediate between these two extremes, since southern upwelling extends further north than in P2A, but lim-ited low-latitude upwelling is implied by the constancy of merid-ional volume transport north of ∼30◦S. The overturning path-ways simulated by LL and P2A are more consistent with esti-mates from inverse models (Lumpkin and Speer, 2007) and the emerging view of ocean overturning (Marshall and Speer, 2012;Talley, 2013), although LL’s ventilation of the deep Southern and Pacific Oceans is too sluggish to accurately reproduce the �14C distribution (Matsumoto et al., 2004).
When combined with their shared biogeochemical model, which restores surface Si concentrations towards observations, the circulation fields of the three models produce interior Si distri-butions that reproduce the large-scale structure to the observed distribution, but also show differences both from the observa-tions and from each other. Fig. 5 compares the models’ average Atlantic Si distribution in the uppermost 2400 m with WOA09 (see Fig. S3 for zonal averages). As in the observations, all models exhibit a southward propagating tongue of low-Si NADW at mid-depth, and an intermediate-depth tongue of elevated Si extending northwards from the Southern Ocean. However, in all model vari-ants, the low-Si tongue is too shallow, with a core at ∼1600 m rather than ∼1800 m as in the observations. This is because North Atlantic convection in the models produces a water mass that is too light and thus descends to shallower depths than observed. As a result, the models’ Si-rich AABW extends too far north, and upward diapycnal mixing of Si from this water mass leads to the elevated Si concentrations seen below ∼2200 m in all model vari-ants. All models also overestimate Si in the northward-penetrating intermediate-depth tongue, a feature that is more pronounced in P2A and HH than in LL. The Si distribution of HH is least similar to the observations: the southward- and northward-propagating ad-vective signals are much less clearly defined in this model than in LL or P2A, due to high interior diapycnal mixing. Model HH also strongly underestimates Si concentrations in the deep Southern Ocean relative to observations.
Despite these differences in the Si distribution between mod-els, they display similar skill at reproducing the interior Atlantic δ30Si distribution, especially in terms of its isotope systematics: as shown by Fig. 1a, all three models reproduce the near-linear δ30Si–1/Si relationship observed in the deep Atlantic Ocean, simu-late a similar range of δ30Si variation in Atlantic deep waters, and reproduce the observation of elevated δ30Si in the Si-poor deep North Atlantic. We will discuss the reasons for these similarities in Section 4. For now, bearing the differences in the Si distribution of the three models in mind, in the following we discuss the Si source tracer distributions in terms of their fractional contribution to the total Si inventory, f (i) = [Si]source=i/
∑j[Si]source= j .
3.2. Si source tracer distributions
By examining the steady-state distributions of the Si source tracer contributions f (i), we can study how Si from the four source regions spreads through the ocean to eventually contribute to the NADW Si inventory. We illustrate the influence of the mod-els’ differing MOC pathways on large-scale Si transport by exam-ining the contribution of each source region to the Si inventory of the thermocline, which we define as the volume of water above the σθ = 26.8 isopycnal.
The two sources of Si above the σθ = 26.8 isopycnal, SAMW and NPAC, exhibit their maximal contributions to the thermocline Si inventory close to their source regions, from where Si is directly introduced into the thermocline (Fig. 6). The locus of maximum fraction of SAMW-derived Si, f (SAMW), follows typical SAMW ventilation pathways (Sallée et al., 2010), extending anti-clockwise into the subtropics from the southern outcrop (Fig. 6a). NPAC-sourced Si enters the North Pacific thermocline from the north (Fig. 6d), and is transported into the Indian Ocean via the Indone-sian Throughflow, although virtually none enters the Atlantic via the warm-water pathway (Gordon, 1986) without first entering the SAMW source region and losing its NPAC identity. NPAC-derived Si also flows northward through Bering Strait, contributing consider-ably to the Si inventory of the Arctic Ocean above σθ = 26.8.
Silicon sourced from below the σθ = 26.8 isopycnal (AAIW and DEEP) exhibits rather different thermocline distributions, since it can enter the thermocline only via interior diapycnal fluxes across this isopycnal. Thus, the contribution of AAIW- and DEEP-sourced Si increases towards the subtropics and tropics, as deeper-lying Si is transported upwards (Fig. 6b, c). In concordance with the mod-els’ differing MOC pathways, the contribution of DEEP-sourced Si

G.F. de Souza et al. / Earth and Planetary Science Letters 432 (2015) 342–353 347
Fig. 6. Contribution of each source region to the Si inventory of the thermocline (σθ < 26.8) in the three model variants [mol Si/mol Si, unitless]. White shading indicates the absence of water lighter than σθ = 26.8.
to the thermocline inventory is highest in the diffusive model HH, and is lowest in the more adiabatic P2A, whose thermocline is also more vigorously ventilated along isopycnals from the south due to higher wind stress over the Southern Ocean. The contribution of DEEP-sourced Si to the thermocline inventory is 1.3–1.6 times higher in HH than in LL or P2A in the low-latitude Indian and Pa-cific Oceans, and even higher in the Atlantic, where it can be more than twice as large in HH than in P2A (Fig. 6c). Complementar-ily, high contributions of SAMW- and AAIW-derived Si penetrate further northward in LL and P2A than in HH: high contributions of SAMW-derived Si extend well into the North Atlantic in LL and P2A, such that f (SAMW) is 1.3–1.7 times higher in the tropical Atlantic thermocline of these models than in HH (Fig. 6a). Addi-tionally, the fraction of AAIW-derived Si in the Atlantic thermocline increases steadily towards the north in LL and P2A but not in HH, such that in the North Atlantic subtropics, f (AAIW) in P2A and LL is 1.2–1.5 times higher than in HH (Fig. 6b). In all three models, however, SAMW- and AAIW-sourced Si together contribute at least half the Si inventory of the North Atlantic thermocline.
3.3. Diapycnal Si redistribution in the Atlantic Ocean
The consequences of northward transport of SAMW- and AAIW-derived Si for the source composition of NADW are illustrated by Fig. 7, which shows the average source tracer contributions f (i) in the uppermost 2400 m of the Atlantic Ocean (see Fig. S4 for zonal averages). Only SAMW-derived Si spreads northwards at the sur-face, whilst Si from other source regions enters the Atlantic within the interior. Diapycnal processes and biological cycling disperse Si from all four source regions through the water column, e.g. the upward transport of DEEP-sourced Si into the thermocline, seen most strongly in HH (Fig. 7c). However, diapycnal Si redistribution is reflected most dramatically by the two source tracers that are tagged in the upper ocean according to density criteria, i.e. SAMW and AAIW. The downward penetration of Si from these sources is
greatest in the North Atlantic north of 40◦N (Fig. 7a, b). A tongue of elevated f (SAMW) and f (AAIW) propagates southwards from these high latitudes at about 1500–1600 m, at densities signif-icantly higher than those at which these tracers are originally tagged (Fig. S5). This mid-depth tongue is the signal of NADW (Fig. 5), and reflects the diapycnal transfer of Si sourced from the shallow Southern Ocean to deep water densities, due to buoyancy loss in the subpolar North Atlantic, the Nordic Seas and the Arc-tic Ocean. The incorporation of SAMW- and AAIW-derived Si into NADW takes place in all three model variants, although their im-portance for its Si inventory varies, due to the differing extent of their transport to the shallow North Atlantic. All three models also exhibit a deep (∼1800 m) tongue of NPAC-sourced Si extending southwards from the subpolar North Atlantic (Fig. 7d). This is Si that has been transported from the North Pacific via the Arctic Ocean, entering the North Atlantic through the models’ represen-tation of the Nordic Sea overflows.
4. Discussion
The Si source tracer distributions reveal the pathways of large-scale Si transport and diapycnal redistribution in the Atlantic Ocean. In the following, we focus on NADW flowing southward from the subpolar North Atlantic, in order to elucidate the pro-cesses responsible for its unique δ30Si signature.
4.1. The isotopic signatures and source composition of NADW
As indicated by the simulated Atlantic δ30Si systematics (Fig. 1a), which show elevated δ30Si values associated with Si-poor wa-ters of the deep North Atlantic, NADW appears prominently in the simulated δ30Si distribution as a high-δ30Si tongue along the western boundary of the mid-depth North Atlantic in all three models (Fig. 8a). The basin-scale structure of the simu-lated δ30Si distributions is broadly consistent with observations of

348 G.F. de Souza et al. / Earth and Planetary Science Letters 432 (2015) 342–353
Fig. 7. Meridional section showing the Atlantic-mean contribution of the four source regions to the Si inventory [mol Si/mol Si, unitless] in the uppermost 2400 m of the three model variants. The three white contours correspond to the density horizons used to determine the tagging regions for SAMW- and AAIW-sourced Si (Fig. 4). Fractions are averaged over the Atlantic basin and over the Southern Ocean from 60◦W to 30◦E.
Fig. 8. Isotopic signatures and source composition of NADW in the North Atlantic Ocean. (a) Distribution of δ30Si at ∼1700 m water depth, illustrating the southward spreading of the high-δ30Si signature of NADW as a deep western boundary current. The white dotted line at ∼43◦N in column a marks the latitude of the depth sections in columns b–d, which show (b) the pre-industrial �14C distribution (�), (c) the δ30Si distribution (�), and (d) the fractional contribution of SAMW- and AAIW-derived Si to the Si inventory (mol Si/mol Si, unitless).

G.F. de Souza et al. / Earth and Planetary Science Letters 432 (2015) 342–353 349
elevated δ30Si values ranging from +1.7 to +1.9� in the west-ern mid-depth North Atlantic (Fig. 1b; de Souza et al., 2012a;Brzezinski and Jones, 2015). Whilst the less diffusive models P2A and LL reproduce the absolute δ30Si values in NADW better than the diffusive model HH (Figs. 8a, c), all three models reproduce the δ30Si systematics of the deep Atlantic with similar fidelity (Fig. 1a), although P2A simulates higher δ30Si values in the subpolar North Atlantic than LL or HH. It is interesting to note that the models re-produce the observed near-linear δ30Si systematics despite the fact that they do not simulate Si isotope fractionation during opal dis-solution. This contrasts somewhat with the recent study by Holzer and Brzezinski (2015), who found that including this process im-proved the linearity of their model’s Atlantic δ30Si systematics by increasing δ30Si in the Si-richest Southern Ocean deep waters. Our results and theirs do, however, agree in suggesting that fraction-ation during opal dissolution is not a major driver of the deep Atlantic δ30Si systematics.
Depth sections across ∼43◦N reveal the isotopic signal of NADW flowing around the Grand Banks as a well-ventilated wa-ter mass: this freshly-ventilated NADW bears a �14C maximum (Fig. 8b) and is recognizable in the δ30Si distribution by its ele-vated δ30Si signature (Fig. 8c) in all models. These isotopic distri-butions are closely mimicked by the fraction of Si sourced from SAMW and AAIW, f (SAMW + AAIW) (Fig. 8d). The fractional con-tribution of SAMW- and AAIW-derived Si is highest above the 27.4 isopycnal, in waters flowing towards the high-latitude North At-lantic in the upper limb of the MOC. However, in each model, there is a secondary f (SAMW + AAIW) maximum at mid-depth, coinci-dent with the δ30Si and �14C signals of NADW. The fraction of NPAC-derived Si also shows a maximum within this volume, but does not exceed 10% (Fig. S6d). Conversely, DEEP-sourced Si is at its minimum within the freshly-ventilated NADW core (Fig. S6c). Thus, irrespective of the large-scale circulation of the models, there is a clear spatial correlation between the maximum contribution of SAMW- and AAIW-derived Si to NADW and the elevated δ30Si signature observed in the most recently ventilated deep waters (Figs. 8c, d and S7). We can quantify this relationship by calcu-lating the contributions of the source regions to the Si inventory of freshly-ventilated NADW.
Recently ventilated NADW exhibits clear signals of gas exchange with the atmosphere in the models’ radiocarbon and oxygen dis-tributions (Figs. 8b, S1 and S2). We exploit these signals to define a volume of freshly-ventilated NADW that extends from the shal-low subpolar North Atlantic (>500 m water depth) to the equator along the western Atlantic boundary (Table 1; see also the Sup-plementary Information). This allows us to calculate the integrated Si inventory of this volume and partition it according to source region (Table 1). In all three model variants, SAMW and AAIW together contribute a major or dominant fraction of the Si in-ventory, ranging from 46% in HH to 62% in P2A. The importance of DEEP-sourced Si varies inversely with this contribution, whilst NPAC-derived Si is of minor importance (5–9%) in all models.
The δ30Si signature of the freshly-ventilated NADW volume rises systematically with the increase in f (SAMW + AAIW) from HH to P2A, and ranges from +1.50� in HH to +1.74� in P2A (Table 1). Thus, not only is there a clear spatial correlation be-tween elevated values of f (SAMW+AAIW) and δ30Si within each model (Fig. S7), but also systematic co-variation between models: the greater the SAMW/AAIW contribution to NADW, the higher its δ30Si value. Together, these correlations strongly suggest that cross-equatorial transport of Si that has been isotopically fraction-ated in the surface Southern Ocean is instrumental in producing the high δ30Si signature of NADW.
Table 1Quantification of Si source contributions to freshly-ventilated NADW. Threshold val-ues of �14C and [O2] used to define the volume of freshly-ventilated North Atlantic Deep Water (see Supplementary Information) in the model variants used in this study, together with integrated δ30Si signature and contributions of the four source regions to the Si inventory of this volume.
HH LL P2A
Radiocarbon threshold [�] −70 −70 −80Oxygen threshold [mmol/m3] 260 260 240
Properties of the NADW volume:NADW δ30Si [�] +1.50 +1.66 +1.74f (SAMW) 0.166 0.124 0.267f (AAIW) 0.292 0.368 0.348f (SAMW + AAIW) 0.457 0.491 0.615f (DEEP) 0.484 0.419 0.331f (NPAC) 0.059 0.090 0.054
Source-region isotope signatures:SAMW δ30Si [�] +1.71 +2.07 +2.31AAIW δ30Si [�] +1.37 +1.47 +1.52DEEP δ30Si [�] +1.19 +1.18 +1.15NPAC δ30Si [�] +1.62 +1.66 +1.57
Source-region signature propagation (Eqn. (1)):NADW δ30Sidistal [�] +1.35 +1.44 +1.61NADW δ30Sidistal – NADW δ30Si [�] −0.14 −0.22 −0.13
Deep Atlantic δ30Si gradient:AABW δ30Si [�] +1.18 +1.16 +1.10NADW δ30Si – AABW δ30Si [�] 0.31 0.50 0.64NADW δ30Sidistal – AABW δ30Si [�] 0.17 0.28 0.51Fraction of δ30Si difference explained by δ30Sidistal 54% 56% 80%
4.2. Distal and proximal fractionation controls on the NADW δ30Si signature
The elevated δ30Si signal of NADW is reproduced by all three models, despite their widely varying MOC configurations. Whilst the analysis above indicates that this signal derives from the con-tribution of SAMW/AAIW to NADW’s Si inventory, we must also consider two additional factors that can produce differences in the NADW δ30Si signature between model variants. These are: (a) the isotopic composition of Si exported from each source region, and (b) Si isotope fractionation at the ocean’s surface during trans-port from the source regions to the North Atlantic. In other words, the NADW δ30Si signature can be conceived of as resulting from a combination of the conservative transport of isotope signatures from distal source regions, and the non-conservative alteration of these isotope signatures en route. We can separate the effects of these two factors with a simple isotope mixing calculation, allow-ing us to assess the extent to which the NADW δ30Si signature is controlled by the conservative transport of distal isotopic signals. We calculate the isotopic composition of Si within each source re-gion (Table 1) as an estimate of the distal isotopic signals being exported towards the North Atlantic. Based on these values and the source tracer contributions at each model grid point, we can then calculate the δ30Si distribution that would result simply from the spreading of these endmember δ30Si signatures:
δ30Sidistal =∑
i
f (i) · δ30Sii,source (1)
where f (i) is the local fractional contribution of the source i, and δ30Sii,source is the isotopic composition in the source region i. We hasten to note that this approach makes the simplifying as-sumption that Si supplied from each source region has a uniform δ30Si value, which is not the case. However, as we show below, it nonetheless serves to provide us with a useful estimate of the influence of the large-scale transport of isotope signals.
The meridional sections in Fig. 9 compare the simulated At-lantic δ30Si distribution at 25◦W (Fig. 9a) with the δ30Sidistal dis-
350 G.F. de Souza et al. / Earth and Planetary Science Letters 432 (2015) 342–353
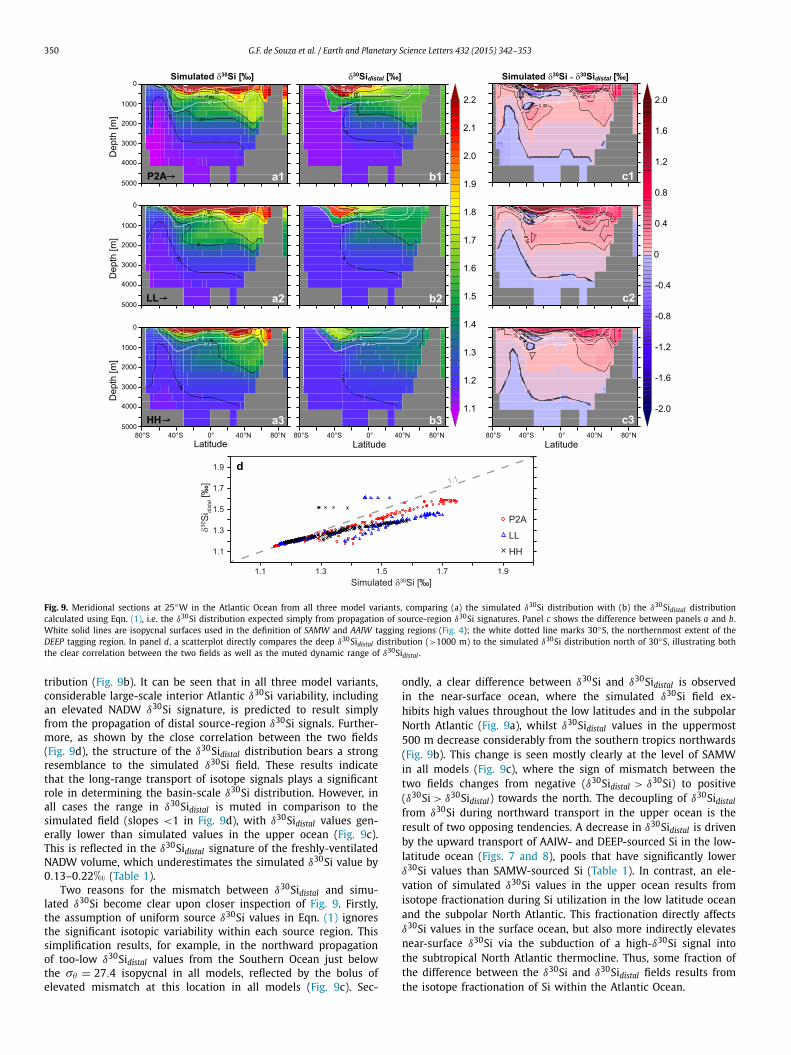
Fig. 9. Meridional sections at 25◦W in the Atlantic Ocean from all three model variants, comparing (a) the simulated δ30Si distribution with (b) the δ30Sidistal distribution calculated using Eqn. (1), i.e. the δ30Si distribution expected simply from propagation of source-region δ30Si signatures. Panel c shows the difference between panels a and b. White solid lines are isopycnal surfaces used in the definition of SAMW and AAIW tagging regions (Fig. 4); the white dotted line marks 30◦S, the northernmost extent of the DEEP tagging region. In panel d, a scatterplot directly compares the deep δ30Sidistal distribution (>1000 m) to the simulated δ30Si distribution north of 30◦S, illustrating both the clear correlation between the two fields as well as the muted dynamic range of δ30Sidistal .
tribution (Fig. 9b). It can be seen that in all three model variants, considerable large-scale interior Atlantic δ30Si variability, including an elevated NADW δ30Si signature, is predicted to result simply from the propagation of distal source-region δ30Si signals. Further-more, as shown by the close correlation between the two fields (Fig. 9d), the structure of the δ30Sidistal distribution bears a strong resemblance to the simulated δ30Si field. These results indicate that the long-range transport of isotope signals plays a significant role in determining the basin-scale δ30Si distribution. However, in all cases the range in δ30Sidistal is muted in comparison to the simulated field (slopes <1 in Fig. 9d), with δ30Sidistal values gen-erally lower than simulated values in the upper ocean (Fig. 9c). This is reflected in the δ30Sidistal signature of the freshly-ventilated NADW volume, which underestimates the simulated δ30Si value by 0.13–0.22� (Table 1).
Two reasons for the mismatch between δ30Sidistal and simu-lated δ30Si become clear upon closer inspection of Fig. 9. Firstly, the assumption of uniform source δ30Si values in Eqn. (1) ignores the significant isotopic variability within each source region. This simplification results, for example, in the northward propagation of too-low δ30Sidistal values from the Southern Ocean just below the σθ = 27.4 isopycnal in all models, reflected by the bolus of elevated mismatch at this location in all models (Fig. 9c). Sec-
ondly, a clear difference between δ30Si and δ30Sidistal is observed in the near-surface ocean, where the simulated δ30Si field ex-hibits high values throughout the low latitudes and in the subpolar North Atlantic (Fig. 9a), whilst δ30Sidistal values in the uppermost 500 m decrease considerably from the southern tropics northwards (Fig. 9b). This change is seen mostly clearly at the level of SAMW in all models (Fig. 9c), where the sign of mismatch between the two fields changes from negative (δ30Sidistal > δ30Si) to positive (δ30Si > δ30Sidistal) towards the north. The decoupling of δ30Sidistal
from δ30Si during northward transport in the upper ocean is the result of two opposing tendencies. A decrease in δ30Sidistal is driven by the upward transport of AAIW- and DEEP-sourced Si in the low-latitude ocean (Figs. 7 and 8), pools that have significantly lower δ30Si values than SAMW-sourced Si (Table 1). In contrast, an ele-vation of simulated δ30Si values in the upper ocean results from isotope fractionation during Si utilization in the low latitude ocean and the subpolar North Atlantic. This fractionation directly affects δ30Si values in the surface ocean, but also more indirectly elevates near-surface δ30Si via the subduction of a high-δ30Si signal into the subtropical North Atlantic thermocline. Thus, some fraction of the difference between the δ30Si and δ30Sidistal fields results from the isotope fractionation of Si within the Atlantic Ocean.

G.F. de Souza et al. / Earth and Planetary Science Letters 432 (2015) 342–353 351
This result implies that the elevated NADW δ30Si signature sim-ulated by the models is not simply the result of distal fractionation in the surface Southern Ocean, but also reflects more proximal iso-tope fractionation as Si is transported towards the NADW forma-tion region in the upper limb of the MOC, i.e. the non-conservativeeffect discussed above. The offset between the δ30Si and δ30Sidistalfields is much smaller at the depth of NADW than in the upper ocean (Fig. 9a, b), showing that the signal of proximal fractionation is damped during NADW formation. This is due to the importance of Si-richer subsurface waters, whose Si inventory is not exposed to isotope fractionation in the surface, in determining the NADW δ30Si value (cf. Sigman et al., 2000).
Due to the uncertainty introduced into our calculation of δ30Sidistal by the assumption of constant source region δ30Si sig-natures, we can only provide an estimate of the extent of the proximal modulation of distal isotope signals. A useful metric for this estimation is the deep Atlantic δ30Si gradient, i.e. the differ-ence between the δ30Si values of NADW and AABW. The three model variants produce Atlantic deep water δ30Si differences of varying strength, ranging from 0.31� in HH to 0.63� in P2A (Ta-ble 1), compared to an observed difference of ∼ 0.5� (de Souza et al., 2012a). By assessing what proportion of this basin-scale δ30Si difference is explained by the δ30Sidistal signature of NADW, we can estimate the fraction that results simply from the propagation of source-region δ30Si signatures. The results shown in Table 1 reveal that this conservative effect explains 54% to 80% of the deep At-lantic δ30Si gradient. Our simulations thus indicate that the high δ30Si value of NADW, and indeed the basin-scale δ30Si distribu-tion, is largely governed by the transport of distal surface Southern Ocean isotope signatures to the North Atlantic in SAMW and AAIW, as postulated by de Souza et al. (2012a).
4.3. Compensatory mechanisms in the Atlantic δ30Si systematics
The above discussion of the distal and proximal controls on the δ30Si distribution also helps elucidate the mechanisms by which the models all produce an elevated NADW δ30Si signal, despite differing pathways of deep water upwelling. The importance of the cross-equatorial transport of distal isotopic signals in produc-ing the Atlantic δ30Si gradient differs between the models, and is least in the highly diffusive model HH, which upwells more interior Si to the surface in the low latitudes (Table 1). This rela-tionship suggests that there are compensatory mechanisms at play in the models’ Atlantic δ30Si systematics: the more diffusive model HH advects less fractionated Si to the North Atlantic from the sur-face Southern Ocean (Figs. 6–8), but produces a high-δ30Si signal more proximally through fractionation of more vigorously supplied deeply-sourced Si in the low-latitude or subarctic Atlantic (Fig. 9), allowing it to produce NADW with a high δ30Si value. Conversely, the more adiabatic models P2A and LL favour distal control on the elevated δ30Si of NADW. The models thus trade off between distal and proximal isotope fractionation as a means of supplying isotopi-cally fractionated Si to the NADW formation region. It is this com-pensation that allows all three models to produce Atlantic δ30Si systematics that are remarkably similar to observations (Fig. 1a), despite their widely-varying MOC pathways. The existence of these interacting controls on the NADW δ30Si signature also means that the presence of an Atlantic δ30Si gradient cannot be uniquely tied to fractionation in the high-latitude Southern Ocean, as suggested by de Souza et al. (2012a). As a result, our simulations indicate that this isotopic feature does not constrain the pathways by which deep water is returned to the upper ocean in the MOC.
More generally, the results of our study contribute to an emerg-ing picture of the role of Southern Ocean Si isotope “distilla-tion” (Brzezinski and Jones, 2015) in governing the marine δ30Si distribution. This distillation results from the combined physical
and biogeochemical dynamics of the Southern Ocean, and leads to the trapping of low-δ30Si silicic acid in the deep Southern Ocean (Holzer et al., 2014; Holzer and Brzezinski, 2015) coupled to a complementary northward export of a high-δ30Si signature in SAMW/AAIW (Fripiat et al., 2011; de Souza et al., 2012b). de Souza et al. (2014) have recently shown that the isotopically light pre-formed and regenerated Si in the deep Southern Ocean is spread throughout the global abyssal ocean by AABW, producing the ob-served hydrographic control on the deep δ30Si distribution. This study has highlighted the large-scale influence of the complemen-tary high δ30Si signal exported in SAMW/AAIW, showing that the Southern Ocean influences the global δ30Si distribution by two separate pathways associated with the upper and lower limbs of the MOC. However, consistent with the recent study by Holzer and Brzezinski (2015), our results also allow a role for fractionation during low-latitude Si cycling in determining the large-scale δ30Si distribution, indicating that other ocean regions may modulate the signals exported from the Southern Ocean.
An important open question that our study does not explic-itly address is the role of the Arctic Ocean, which Brzezinski and Jones (2015) have suggested may represent an important northern counterpart to the Southern Ocean, via its influence on the Nordic Sea overflows. The Arctic Ocean receives fractionated Si primar-ily through shallow inflow from the North Atlantic, and transfers this Si to deep-water densities via buoyancy loss (Jones et al., 1995). Certainly some of the SAMW/AAIW-sourced Si in our mod-els’ NADW has been incorporated in this manner. What remains to be assessed is whether the Arctic Ocean’s role is limited to such di-apycnal Si transfer, or whether a significant additional fractionation signal is imposed by Si cycling within the Arctic itself. Answering this question will require the long-overdue analysis of the Arctic δ30Si distribution.
5. Conclusions
This study has combined models of the marine cycle of Si and its isotopes with a diagnostic scheme that enables us to trace the large-scale transport of Si originating from the high-latitude ocean in a suite of OGCM simulations with varying MOC pathways. These simulations allow an assessment of the role of cross-equatorial transport of SAMW- and AAIW-derived Si in producing the ele-vated δ30Si signature of NADW. We find that Si sourced from the SAMW and AAIW formation regions contributes a major to dom-inant fraction (46–62%) of the freshly-ventilated NADW Si inven-tory irrespective of MOC pathway, and that the δ30Si signature of NADW rises as the contribution of SAMW- and AAIW-derived Si increases. However, the simulations also indicate that more proxi-mal isotope fractionation of Si, within the low-latitude or subpolar North Atlantic, can influence the NADW δ30Si signature. By re-vealing this interplay between distal and proximal processes, our results thus allow us to refine the hypothesis of de Souza et al.(2012a): the high δ30Si signature of NADW is vitally linked to the transport of a fractionated signal from the surface Southern Ocean by SAMW/AAIW, but may also be additionally influenced by Si isotope fractionation that takes place during transport to the NADW formation region. The more adiabatic models in our suite, which conform best to our current understanding of deep-water upwelling pathways (e.g. Talley, 2013), suggest that the proximal contribution is small, although definitive conclusions remain elu-sive given lingering uncertainties regarding the pathways of the MOC (e.g. Talley, 2008).
Acknowledgements
The authors gratefully acknowledge helpful comments on an earlier version of this manuscript by Timothy Conway and Beat-

352 G.F. de Souza et al. / Earth and Planetary Science Letters 432 (2015) 342–353
rice Radden Keefe, and the constructive reviews of two anony-mous reviewers. This work was supported by Swiss National Sci-ence Foundation post-doctoral fellowships PBEZP2-140169 and P300P2-147747 granted to GFDS, NOAA grant NA11OAR4310066 to JLS, and UK NERC grant NE/K00901X/1 to MPH.
Appendix A. Supplementary material
Supplementary material related to this article can be found on-line at http://dx.doi.org/10.1016/j.epsl.2015.10.025.
References
Abouchami, W., Galer, S.J.G., de Baar, H.J.W., Middag, R., Vance, D., Zhao, Y., et al., 2014. Biogeochemical cycling of cadmium isotopes in the Southern Ocean along the Zero Meridian. Geochim. Cosmochim. Acta 127, 348–367.
Beucher, C.P., Brzezinski, M.A., Jones, J.L., 2008. Sources and biological fractiona-tion of Silicon isotopes in the Eastern Equatorial Pacific. Geochim. Cosmochim. Acta 72, 3063–3073.
Broecker, W.S., Peng, T.H., 1982. Tracers in The Sea. Eldigio Press/Lamont-Doherty Geological Observatory, Palisades, NY.
Broecker, W.S., Blanton, S., Smethie, W.M., Ostlund, G., 1991. Radiocarbon decay and oxygen utilization in the deep Atlantic Ocean. Glob. Biogeochem. Cycles 5, 87–117.
Brzezinski, M.A., Dickson, M.L., Nelson, D.M., Sambrotto, R., 2003. Ratios of Si, C and N uptake by microplankton in the Southern Ocean. Deep-Sea Res. II 50, 619–633.
Brzezinski, M.A., Jones, J.L., 2015. Coupling of the distribution of silicon isotopes to the meridional overturning circulation of the North Atlantic Ocean. Deep-Sea Res. II 116, 79–88.
Buesseler, K.O., 1998. The decoupling of production and particulate export in the surface ocean. Glob. Biogeochem. Cycles 12, 297–310.
Cardinal, D., Alleman, L.Y., Dehairs, F., Savoye, N., Trull, T.W., Andre, L., 2005. Rel-evance of silicon isotopes to Si-nutrient utilization and Si-source assessment in Antarctic waters. Glob. Biogeochem. Cycles 19. http://dx.doi.org/10.1029/2004GB002364.
De La Rocha, C.L., Brzezinski, M.A., DeNiro, M.J., 1997. Fractionation of silicon iso-topes by marine diatoms during biogenic silica formation. Geochim. Cosmochim. Acta 61, 5051–5056.
Demarest, M.S., Brzezinski, M.A., Beucher, C.P., 2009. Fractionation of silicon isotopes during biogenic silica dissolution. Geochim. Cosmochim. Acta 73, 5572–5583.
de Souza, G.F., Reynolds, B.C., Rickli, J., Frank, M., Saito, M.A., Gerringa, L.J.A., et al., 2012a. Southern Ocean control of silicon stable isotope distribution in the deep Atlantic Ocean. Glob. Biogeochem. Cycles 26. http://dx.doi.org/10.1029/2011gb004141.
de Souza, G.F., Reynolds, B.C., Johnson, G.C., Bullister, J.L., Bourdon, B., 2012b. Silicon stable isotope distribution traces Southern Ocean export of Si to the eastern South Pacific thermocline. Biogeosciences 9, 4199–4213.
de Souza, G.F., Slater, R.D., Dunne, J.P., Sarmiento, J.L., 2014. Deconvolving the con-trols on the deep ocean’s silicon stable isotope distribution. Earth Planet. Sci. Lett. 398, 66–76.
Fripiat, F., Cavagna, A.-J., Dehairs, F., Speich, S., André, L., Cardinal, D., 2011. Silicon pool dynamics and biogenic silica export in the Southern Ocean, inferred from Si-isotopes. Ocean Sci. 7, 533–547.
Garcia, H.E., Locarnini, R.A., Boyer, T.P., Antonov, J.I., 2010. World Ocean Atlas 2009, Volume 4: Nutrients (Phosphate, Nitrate, Silicate). U.S. Government Printing Of-fice, Washington, DC.
Gent, P.R., Willebrand, J., McDougall, T.J., McWilliams, J.C., 1995. Parametrizing eddy-induced tracer transports in ocean circulation models. J. Phys. Oceanogr. 25, 463–474.
Gnanadesikan, A., 1999. A simple predictive model for the structure of the oceanic pycnocline. Science 283, 2077–2079.
Gnanadesikan, A., Slater, R.D., Gruber, N., Sarmiento, J.L., 2002. Oceanic vertical ex-change and new production: a comparison between models and observations. Deep-Sea Res. II 49, 363–401.
Gnanadesikan, A., Dunne, J., Key, R., Matsumoto, K., Sarmiento, J.L., Slater, R., et al., 2004. Oceanic ventilation and biogeochemical cycling: understanding the phys-ical mechanisms that produce realistic distributions of tracers and productivity. Glob. Biogeochem. Cycles 18. http://dx.doi.org/10.1029/2003GB002097.
Gnanadesikan, A., De Boer, A.M., Mignone, B.K., 2007. A simple theory of the pycn-ocline and overturning revisited. In: Schmittner, A., Chiang, J.C.H., Hemming, S. (Eds.), Ocean Circulation: Mechanisms and Impacts—Past and Future Changes of Meridional Overturning. American Geophysical Union, pp. 19–32.
Gordon, A.L., 1986. Interocean exchange of thermocline water. J. Geophys. Res., Oceans 91, 5037–5046.
Grasse, P., Ehlert, C., Frank, M., 2013. The influence of water mass mixing on the dissolved Si isotope composition in the Eastern Equatorial Pacific. Earth Planet. Sci. Lett. 380, 60–71.
Hain, M.P., Sigman, D.M., Haug, G.H., 2014a. The biological pump in the past. In: Holland, H., Turekian, K.K. (Eds.), Treatise on Geochemistry, second ed.. Elsevier, Amsterdam, pp. 485–517.
Hain, M.P., Sigman, D.M., Haug, G.H., 2014b. Distinct roles of the Southern Ocean and North Atlantic in the deglacial atmospheric radiocarbon decline. Earth Planet. Sci. Lett. 394, 198–208.
Hellerman, S., Rosenstein, M., 1983. Normal monthly wind stress over the world ocean with error estimates. J. Phys. Oceanogr. 13, 1093–1104.
Holzer, M., Primeau, F.W., DeVries, T., Matear, R., 2014. The Southern Ocean silicon trap: data-constrained estimates of regenerated silicic acid, trapping efficien-cies, and global transport paths. J. Geophys. Res., Oceans 119. http://dx.doi.org/10.1002/2013jc009356.
Holzer, M., Brzezinski, M.A., 2015. Controls on the silicon isotope distribution in the ocean: new diagnostics from a data-constrained model. Glob. Biogeochem. Cycles 29. http://dx.doi.org/10.1002/2014GB004967.
Jin, X., Gruber, N., Dunne, J.P., Sarmiento, J.L., Armstrong, R.A., 2006. Diagnosing the contribution of phytoplankton functional groups to the production and ex-port of particulate organic carbon, CaCO3, and opal from global nutrient and alkalinity distributions. Glob. Biogeochem. Cycles 20. http://dx.doi.org/10.1029/2005GB002532.
Jones, E.P., Rudels, B., Anderson, L.G., 1995. Deep waters of the Arctic Ocean: origins and circulation. Deep-Sea Res. I 42, 737–760.
Karleskind, P., Lévy, M., Memery, L., 2011. Subduction of carbon, nitrogen, and oxy-gen in the northeast Atlantic. J. Geophys. Res., Oceans 116. http://dx.doi.org/10.1029/2010jc006446.
Keir, R.S., 1988. On the Late Pleistocene ocean geochemistry and circulation. Pale-oceanography 3, 413–455.
Ledwell, J.R., Watson, A.J., Law, C.S., 1993. Evidence for slow mixing across the pyc-nocline from an open-ocean tracer-release experiment. Nature 364, 701–703.
Ledwell, J.R., Watson, A.J., Law, C.S., 1998. Mixing of a tracer in the pycnocline. J. Geophys. Res., Oceans 103, 21,499–21,529.
Lumpkin, R., Speer, K., 2007. Global ocean meridional overturning. J. Phys. Oceanogr. 37, 2550–2562.
Marinov, I., Gnanadesikan, A., Toggweiler, J.R., Sarmiento, J.L., 2006. The Southern Ocean biogeochemical divide. Nature 441, 964–967.
Marshall, J., Speer, K., 2012. Closure of the meridional overturning circulation through Southern Ocean upwelling. Nat. Geosci. 5, 171–180.
Matsumoto, K., Sarmiento, J.L., Key, R.M., Aumont, O., Bullister, J.L., Caldeira, K., et al., 2004. Evaluation of ocean carbon cycle models with data-based metrics. Geo-phys. Res. Lett. 31. http://dx.doi.org/10.1029/2003gl018970.
Morrison, A.K., Fröhlicher, T.L., Sarmiento, J.L., 2015. Upwelling in the Southern Ocean. Phys. Today 68. http://dx.doi.org/10.1063/PT.1063.2654.
Pacanowski, R.C., Griffies, S.M., 1999. The MOM3 Manual. NOAA/Geophysical Fluid Dynamics Laboratory, Princeton.
Palter, J.B., Lozier, M.S., Barber, R.T., 2005. The effect of advection on the nutrient reservoir in the North Atlantic subtropical gyre. Nature 437, 687–692.
Palter, J.B., Sarmiento, J.L., Gnanadesikan, A., Simeon, J., Slater, R.D., 2010. Fuel-ing export production: nutrient return pathways from the deep ocean and their dependence on the meridional overturning circulation. Biogeosciences 7, 3549–3568.
Palter, J.B., Lozier, M.S., Sarmiento, J.L., Williams, R.G., 2011. The supply of excess phosphate across the Gulf Stream and the maintenance of subtropical nitrogen fixation. Glob. Biogeochem. Cycles 25. http://dx.doi.org/10.1029/2010GB003955.
Polzin, K.L., Toole, J.M., Ledwell, J.R., Schmitt, R.W., 1997. Spatial variability of turbu-lent mixing in the abyssal ocean. Science 276, 93–96.
Raven, J.A., 1983. The transport and function of silicon in plants. Biol. Rev. 58, 179–207.
Reynolds, B.C., Frank, M., Halliday, A.N., 2006. Silicon isotope fractionation during nutrient utilization in the North Pacific. Earth Planet. Sci. Lett. 244, 431–443.
Robinson, A., Stommel, H., 1959. The oceanic thermocline and the associated ther-mohaline circulation. Tellus 11, 295–308.
Robinson, R.S., Sigman, D.M., DiFiore, P.J., Rohde, M.M., Mashiotta, T.A., Lea, D.W., 2005. Diatom-bound 15N/14N: new support for enhanced nutrient consump-tion in the ice age Subantarctic. Paleoceanography 20. http://dx.doi.org/10.1029/2004pa001114.
Sarmiento, J.L., Gruber, N., Brzezinski, M.A., Dunne, J.P., 2004. High-latitude controls of thermocline nutrients and low latitude biological productivity. Nature 427, 56–60.
Sarmiento, J.L., Simeon, J., Gnanadesikan, A., Gruber, N., Key, R.M., Schlitzer, R., 2007. Deep ocean biogeochemistry of silicic acid and nitrate. Glob. Biogeochem. Cy-cles 21. http://dx.doi.org/10.1029/2006GB002720.
Sallée, J.-B., Speer, K., Rintoul, S., Wijffels, S., 2010. Southern Ocean thermocline ven-tilation. J. Phys. Oceanogr. 40, 509–529.
Sigman, D.M., Altabet, M.A., McCorkle, D.C., François, R., Fischer, G., 2000. The δ15N of nitrate in the Southern Ocean: nitrogen cycling and circulation in the ocean interior. J. Geophys. Res., Oceans 105, 19599–19614.
Smetacek, V., 1999. Diatoms and the ocean carbon cycle. Protist 150, 25–32.

G.F. de Souza et al. / Earth and Planetary Science Letters 432 (2015) 342–353 353
Sutton, J.N., Varela, D.E., Brzezinski, M.A., Beucher, C.P., 2013. Species-dependent sil-icon isotope fractionation by marine diatoms. Geochim. Cosmochim. Acta 104, 300–309.
Talley, L.D., 2008. Freshwater transport estimates and the global overturning cir-culation: shallow, deep and throughflow components. Prog. Oceanogr. 78, 257–303.
Talley, L.D., 2013. Closure of the global overturning circulation through the Indian, Pacific, and Southern Oceans: schematics and transports. Oceanography 26, 80–97.
Talley, L.D., Reid, J.L., Robbins, P.E., 2003. Data-based meridional overturning streamfunctions for the global ocean. J. Climate 16, 3213–3226.
Toggweiler, J.R., Samuels, B., 1993. New radiocarbon constraints on the upwelling of abyssal water to the ocean’s surface. In: Heimann, M. (Ed.), The Global Carbon Cycle. Springer, Berlin, pp. 333–366.
Tréguer, P.J., De La Rocha, C.L., 2013. The world ocean silica cycle. Ann. Rev. Mar. Sci. 5, 477–501.
Trenberth, K.E., Olson, J., Large, W., 1989. A global ocean wind stress climatology based on ECMWF analyses. Technical Report NCAR/TN-338+STR. National Center for Atmospheric Research, Boulder, CO.
Wetzel, F., de Souza, G.F., Reynolds, B.C., 2014. What controls silicon isotope frac-tionation during dissolution of diatom opal? Geochim. Cosmochim. Acta 131, 128–137.