Earth and Planetary Science - Harvard Universityphuybers/Doc/Middleton_EPSL2017.pdf · Earth and...
11
Earth and Planetary Science Letters 482 (2018) 12–22 Contents lists available at ScienceDirect Earth and Planetary Science Letters www.elsevier.com/locate/epsl Millennial-scale variations in dustiness recorded in Mid-Atlantic sediments from 0 to 70 ka Jennifer L. Middleton a,b,∗ , Sujoy Mukhopadhyay b , Charles H. Langmuir a , Jerry F. McManus c,d , Peter J. Huybers a a Department of Earth and Planetary Sciences, Harvard University, 20 Oxford Street, Cambridge, MA 02138, USA b Department of Earth and Planetary Sciences, University of California Davis, 1 Shields Avenue, Davis, CA 95616, USA c Lamont-Doherty Earth Observatory of Columbia University, 61 Route 9W, Palisades, NY 10964, USA d Department of Earth and Environmental Sciences, Columbia University, New York, NY 10027, USA a r t i c l e i n f o a b s t r a c t Article history: Received 13 May 2017 Received in revised form 11 October 2017 Accepted 16 October 2017 Available online xxxx Editor: M. Frank Keywords: mineral dust Subtropical North Atlantic helium-3 thorium-232 mass accumulation rate North Africa Sedimentary records of dust deposition in the subtropical Atlantic provide important constraints on millennial- and orbital-scale variability in atmospheric circulation and North African aridity. Constant flux proxies, such as extraterrestrial helium-3, yield dust flux records that are independent of the biases caused by lateral sediment transport and limited resolution that may be associated with age-model- derived mass accumulation rates. However, Atlantic dust records constrained using constant flux proxies are sparsely distributed and generally limited to the past 20 ka. Here we extend the Atlantic record of North African dust deposition to 70 ka using extraterrestrial helium-3 and measurements of titanium, thorium, and terrigenous helium-4 in two sediment cores collected at 26 ◦ N and 29 ◦ N on the Mid- Atlantic Ridge and compare results to model estimates for dust deposition in the subtropical North Atlantic. Dust proxy fluxes between 26 ◦ N and 29 ◦ N are well correlated, despite variability in lateral sediment transport, and underscore the utility of extraterrestrial helium-3 for constraining millennial- scale variability in dust deposition. Similarities between Mid-Atlantic dust flux trends and those observed along the Northwest African margin corroborate previous interpretations of dust flux variability over the past 20 ka and suggest that long distance transport and depositional processes do not overly obscure the signal of North African dust emissions. The 70 ka Mid-Atlantic record reveals a slight increase in North African dustiness from Marine Isotope Stage 4 through the Last Glacial Maximum and a dramatic decrease in dustiness associated with the African Humid Period. On the millennial-scale, the new records exhibit brief dust maxima coincident with North Atlantic cold periods such as the Younger Dryas, and multiple Heinrich Stadials. The correlation between Mid-Atlantic dust fluxes and previous constraints on North African aridity is high. However, precipitation exerts less control on dust flux variability prior to the African Humid Period, when wind variability governs dust emissions from consistently dry dust source regions. Thus, the Mid-Atlantic dust record supports the hypothesis that both aridity and wind strength drive dust flux variability across changing climatic conditions. © 2017 Elsevier B.V. All rights reserved. 1. Introduction Aeolian dust is an influential component of the climate sys- tem due to its radiative effects (Miller and Tegen, 1998; Rosenfeld et al., 2001) and the nutritional boon it brings to otherwise limited ecosystems (Bristow et al., 2010; Jickells et al., 2005; * Corresponding author at: Department of Earth and Planetary Sciences, Harvard University, 20 Oxford Street, Cambridge, MA 02138, USA. E-mail address: [email protected] (J.L. Middleton). Martin, 1990). Constraints on variable dust emissions through changing climatic regimes are essential to understand the past and to forecast future scenarios (Albani et al., 2015, 2016; Evan et al., 2016; Mahowald et al., 2009, 2006; Pausata et al., 2016). The Sahel and Sahara regions of North Africa provide the largest contribution to modern global dust emissions (Goudie and Middleton, 2001; Prospero et al., 2002) and generate dust plumes that influence African and Atlantic surface temperatures, precipitation, and trop- ical cyclone development (Booth et al., 2012; Dunion and Velden, 2004; Evan et al., 2011). https://doi.org/10.1016/j.epsl.2017.10.034 0012-821X/© 2017 Elsevier B.V. All rights reserved.
Transcript of Earth and Planetary Science - Harvard Universityphuybers/Doc/Middleton_EPSL2017.pdf · Earth and...

Earth and Planetary Science Letters 482 (2018) 12–22
Contents lists available at ScienceDirect
Earth and Planetary Science Letters
www.elsevier.com/locate/epsl
Millennial-scale variations in dustiness recorded in Mid-Atlantic
sediments from 0 to 70 ka
Jennifer L. Middleton a,b,∗, Sujoy Mukhopadhyay b, Charles H. Langmuir a, Jerry F. McManus c,d, Peter J. Huybers a
a Department of Earth and Planetary Sciences, Harvard University, 20 Oxford Street, Cambridge, MA 02138, USAb Department of Earth and Planetary Sciences, University of California Davis, 1 Shields Avenue, Davis, CA 95616, USAc Lamont-Doherty Earth Observatory of Columbia University, 61 Route 9W, Palisades, NY 10964, USAd Department of Earth and Environmental Sciences, Columbia University, New York, NY 10027, USA
a r t i c l e i n f o a b s t r a c t
Article history:Received 13 May 2017Received in revised form 11 October 2017Accepted 16 October 2017Available online xxxxEditor: M. Frank
Keywords:mineral dustSubtropical North Atlantichelium-3thorium-232mass accumulation rateNorth Africa
Sedimentary records of dust deposition in the subtropical Atlantic provide important constraints on millennial- and orbital-scale variability in atmospheric circulation and North African aridity. Constant flux proxies, such as extraterrestrial helium-3, yield dust flux records that are independent of the biases caused by lateral sediment transport and limited resolution that may be associated with age-model-derived mass accumulation rates. However, Atlantic dust records constrained using constant flux proxies are sparsely distributed and generally limited to the past 20 ka. Here we extend the Atlantic record of North African dust deposition to 70 ka using extraterrestrial helium-3 and measurements of titanium, thorium, and terrigenous helium-4 in two sediment cores collected at 26◦N and 29◦N on the Mid-Atlantic Ridge and compare results to model estimates for dust deposition in the subtropical North Atlantic. Dust proxy fluxes between 26◦N and 29◦N are well correlated, despite variability in lateral sediment transport, and underscore the utility of extraterrestrial helium-3 for constraining millennial-scale variability in dust deposition. Similarities between Mid-Atlantic dust flux trends and those observed along the Northwest African margin corroborate previous interpretations of dust flux variability over the past 20 ka and suggest that long distance transport and depositional processes do not overly obscure the signal of North African dust emissions. The 70 ka Mid-Atlantic record reveals a slight increase in North African dustiness from Marine Isotope Stage 4 through the Last Glacial Maximum and a dramatic decrease in dustiness associated with the African Humid Period. On the millennial-scale, the new records exhibit brief dust maxima coincident with North Atlantic cold periods such as the Younger Dryas, and multiple Heinrich Stadials. The correlation between Mid-Atlantic dust fluxes and previous constraints on North African aridity is high. However, precipitation exerts less control on dust flux variability prior to the African Humid Period, when wind variability governs dust emissions from consistently dry dust source regions. Thus, the Mid-Atlantic dust record supports the hypothesis that both aridity and wind strength drive dust flux variability across changing climatic conditions.
© 2017 Elsevier B.V. All rights reserved.
1. Introduction
Aeolian dust is an influential component of the climate sys-tem due to its radiative effects (Miller and Tegen, 1998; Rosenfeld et al., 2001) and the nutritional boon it brings to otherwise limited ecosystems (Bristow et al., 2010; Jickells et al., 2005;
* Corresponding author at: Department of Earth and Planetary Sciences, Harvard University, 20 Oxford Street, Cambridge, MA 02138, USA.
E-mail address: [email protected] (J.L. Middleton).
https://doi.org/10.1016/j.epsl.2017.10.0340012-821X/© 2017 Elsevier B.V. All rights reserved.
Martin, 1990). Constraints on variable dust emissions through changing climatic regimes are essential to understand the past and to forecast future scenarios (Albani et al., 2015, 2016; Evan et al., 2016; Mahowald et al., 2009, 2006; Pausata et al., 2016). The Sahel and Sahara regions of North Africa provide the largest contribution to modern global dust emissions (Goudie and Middleton, 2001;Prospero et al., 2002) and generate dust plumes that influence African and Atlantic surface temperatures, precipitation, and trop-ical cyclone development (Booth et al., 2012; Dunion and Velden, 2004; Evan et al., 2011).
J.L. Middleton et al. / Earth and Planetary Science Letters 482 (2018) 12–22 13
Twentieth century records of Atlantic dustiness demonstrate a strong correlation between decreased North African rainfall and increased dust emissions on inter-annual timescales (Chiapello et al., 2005; Mukhopadhyay and Kreycik, 2008; Prospero and Lamb, 2003). Wind strength, however, also influences dustiness and re-cent studies suggest that wind strength, rather than aridity, is the primary driver of inter-annual variability in North African dust emissions (Ridley et al., 2014; Rodríguez et al., 2015). On millen-nial and orbital timescales, significant restructuring of atmospheric circulation may alter the relative importance of wind strength versus aridity in driving dust emissions. Separating these two ef-fects, however, has been difficult because there are few records (Adkins et al., 2006; Bradtmiller et al., 2007; McGee et al., 2013;Tjallingii et al., 2008; Williams et al., 2016) that constrain North African dust deposition with sufficient resolution to evaluate the changing distribution and drivers of emissions associated with millennial-scale climatic oscillations.
Marine sedimentary records of dust deposition can constrain climatic variability in continental aridity, wind strength, and the spatial pattern of atmospheric circulation (Grousset et al., 1998;Kohfeld and Harrison, 2001; McGee et al., 2010a; Parker et al., 2016; Rea, 1994; Ruddiman, 1997; Werner et al., 2002; Winckler et al., 2008). Sedimentary dust records, however, have often been calculated using mass accumulation rates estimated from the sed-iment core age-model and dry bulk density (Adkins et al., 2006;deMenocal et al., 2000; Ruddiman, 1997). Such accumulation esti-mates are limited to the temporal resolution of the age-model and typically assume constant sedimentation rates between chronos-tratigraphic tie-points. Age-model-derived fluxes are additionally subject to biases introduced by lateral sediment transport. These biases complicate the interpretation of age-model-derived records because the magnitude of sediment winnowing or focusing at a given location can vary across climatic cycles (Suman and Bacon, 1989; Costa and McManus, 2017; Higgins et al., 2002; Marcantonio et al., 1996).
In contrast, constant flux proxies, such as excess thorium-230 (Bacon, 1984; Francois et al., 2004; Marcantonio et al., 2001a)and extraterrestrial helium-3 (3HeET; McGee and Mukhopadhyay, 2013), can be used to constrain vertical sediment rain rates that are independent of age-model tie-points and lateral sediment transport. The increased resolution of dust records determined using constant flux proxies permits improved quantification and evaluation of dust flux variability. However, existing records of North African dustiness constrained using constant flux proxies are sparse and limited to the past 20 ka (Adkins et al., 2006;Bradtmiller et al., 2007; McGee et al., 2013; Williams et al., 2016). These records indicate a broad mid-Holocene dust flux minimum (∼5 to 11 ka) in the equatorial Atlantic, the western tropical At-lantic, and along the Northwest African margin, that is coincident with the African Humid Period. On millennial timescales, however, there is less agreement. Dust maxima are observed along the conti-nental margin during the Younger Dryas and Heinrich 1 (McGee et al., 2013), yet the far-field records from the equatorial Atlantic and the Bahamas exhibit a singular early Holocene peak (Bradtmiller et al., 2007; Williams et al., 2016). Increased Atlantic coverage is essential to determine if such far-field locations provide clear records of continental dust generation or if they are affected by long distance transport and depositional processes. Furthermore, new and longer records improve constraints on African emissions in global dust cycle models (Albani et al., 2015, 2016; Mahowald et al., 2009) and are required to determine whether the past 20 ka are representative of typical dust flux variability prior to the Last Glacial Maximum.
Here we present new records of dust flux from two subtropical North Atlantic sediment cores collected at 26◦N and 29◦N on the Mid-Atlantic Ridge. Dust fluxes are determined from analyses of
terrigenous helium-4 using extraterrestrial helium-3 as a constant flux proxy. Flux records of common thorium-232 and titanium are additionally examined to evaluate reproducibility between dust proxies in the Mid-Atlantic sediments. The new data extend the subtropical North Atlantic dust record to 70 ka and allow for eval-uation of orbital- and millennial-scale variations in dust generation and long-distance transport through the last glacial period.
2. Geochemical background
2.1. Dust proxies
Marine sediments include biogenic, authigenic, and lithogenic inputs. Thorium-232 (common Th), terrigenous helium-4 (4Heterr), and titanium have all been used to constrain the lithogenic com-ponent of marine sediments due to relatively high concentrations of these tracers in continental crust (Marcantonio et al., 2001a;Mukhopadhyay and Kreycik, 2008; Murray et al., 2000; Patterson et al., 1999; Winckler et al., 2005). Thorium and 4Heterr are dis-tinctly advantageous as dust proxies because sedimentary concen-trations of Th and 4Heterr are less sensitive than Ti to the presence of volcanic inputs (Gale et al., 2013; Graham, 2002; Patterson et al., 1999). Consequently, Th and 4Heterr have been increasingly utilized in combination with the excess 230Th and extraterres-trial 3He constant flux proxies to constrain aeolian dust fluxes (Adkins et al., 2006; Anderson et al., 2006; Kienast et al., 2016;Marcantonio et al., 2001a; Serno et al., 2014; Winckler et al., 2005, 2008).
Ideally, the conversion of sedimentary Th or 4Heterr concentra-tions into absolute dust concentrations would be based on tightly constrained values of Th or 4Heterr in the dust endmember. How-ever, 4Heterr concentrations of North African dust sources are sel-dom measured (McGee et al., 2016; Mukhopadhyay and Kreycik, 2008) and dust concentrations of 4Heterr, Th, and Ti are each known to vary with grain size and among source regions (Castillo et al., 2008; McGee et al., 2016). Thus, absolute concentrations of sedimentary dust are difficult to constrain from analysis of a sin-gle lithogenic proxy. We examine 4Heterr, Th, and Ti fluxes in the Mid-Atlantic sediments to evaluate the sensitivity of proxy-based dust records to each element of interest.
2.2. Extraterrestrial helium-3 as a constant flux proxy
Helium-4 accumulates in marine sediments primarily via the delivery of terrigenous dust, whereas 3He is primarily delivered to the seafloor via interplanetary dust particles (IDPs; Farley, 1995;Nier and Schlutter, 1992; Takayanagi and Ozima, 1987). Sediment concentrations of extraterrestrial 3He (3HeET) are determined by correcting total 3He for its small terrigenous contribution (see Section 3.3). Previous work has shown that 3HeET can be uti-lized as a constant flux proxy to calculate vertical sediment rain rates throughout much of the Cenozoic (Farley and Eltgroth, 2003;Farley, 1995; Marcantonio et al., 2001b, 1995; Mukhopadhyay et al., 2001; Winckler et al., 2005). The term ‘rain rate’ refers to the vertical sediment flux as distinct from the traditional mass ac-cumulation rate that may reflect the addition or subtraction of laterally advected material.
When the influx of IDP 3HeET from space ( f ) is known, the vertical sediment rain rate (Φsed) can be determined through the relationship:
Φsed = f R
[3HeET] (1)
where R is the fraction of deposited He retained within the sedi-ments (Farley, 1995). Observations of 3HeET retention in ∼480 Ma limestones suggest negligible variations in R over relatively short
14 J.L. Middleton et al. / Earth and Planetary Science Letters 482 (2018) 12–22
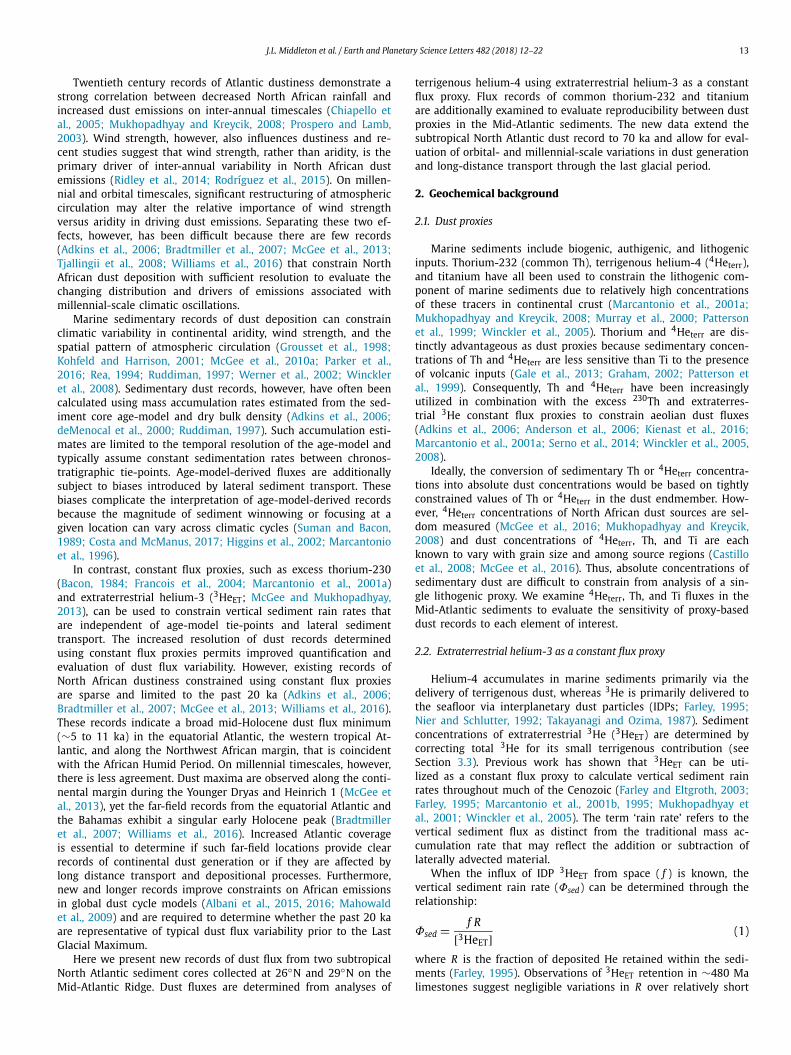
Fig. 1. Map of sediment core locations. Sites for KN207-2 sediment cores used in this study (GGC6 and GGC3) are indicated by yellow stars. Core locations of previous work on Northwest African dust or aridity from ODP Site 658 (deMenocal et al., 2000; Adkins et al., 2006), select OC437-7 cores (McGee et al., 2013; Tierney et al., 2017) and GeoB7920-2 (Tjallingii et al., 2008) are indicated by white circles. Aerosol Optical Depth (AOD) values indicate the time averaged daily 670 nm SeaWiFS satellite data product from January 2004 to December 2009, downloaded from the Giovanni online data system of the NASA Goddard Earth Sciences Data and Information Services Center. AOD values are plotted on a logarithmic-scale to highlight contrasts across the Atlantic. (For interpretation of the references to color in this figure legend, the reader is referred to the web version of this article.)
geologic intervals (Patterson et al., 1998). Previous studies of ma-rine sediments and ice core records have demonstrated a constant Quaternary IDP 3HeET flux and a value of 8.0 ± 1.2 × 10⁻¹³ cm3
STP cm−2 ka−1, reflecting the mean and standard error of compiled marine studies, was used here (McGee and Mukhopadhyay, 2013). Distinct fluxes for individual elements and sedimentary compo-nents (Φx) are computed from vertical rain rates as follows:
Φx = [X]sed ∗ Φsed (2)
where [X]sed is the measured sediment concentration of the ele-ment or component of interest.
Constant flux proxies, such as 3HeET, can also be used to calcu-late the sediment focusing factor (Ψ ) and thus provide a quan-titative constraint on the degree of lateral sediment redistribu-tion affecting a marine sedimentary column (Francois et al., 2004;Higgins et al., 2002; Suman and Bacon, 1989). We adapt the origi-nal definition of Ψ , based on 230Th, to define a ΨHe as follows:
ΨHe =∫ z2
z1[3HeET]ρbdz
f (t2 − t1)(3)
where z is depth in the core, ρb is the sediment dry bulk density, f is the known 3HeET influx from space as above, and t1 and t2are the sediment ages at depths z1 and z2.
3. Sampling and methods
Gravity cores KN207-2-GGC3 (26.14◦N, 44.80◦W, 3433 water depth, 82 cm core length) and KN207-2-GGC6 (29.21◦N, 43.23◦W, 3018 water depth, 147 cm core length) were recovered within the axial valley of the Mid-Atlantic Ridge during cruise KN207-2 of the R/V Knorr in June 2012 (Fig. 1). The cores are located ∼2500 km from the Northwest African coast and ∼2000 km north of the cen-ter of the African dust plume, allowing for investigation into both the pattern of Mid-Atlantic dust deposition and long distance aeo-lian transport over the past 70 ka.
Both cores are dominantly carbonaceous oozes, with carbon-ate content ranging from 70 to 90 wt.% in GGC3 and from 80 to 95 wt.% in GGC6. Three carbonate-rich coarse layers are observed in GGC6 at 6–8 cm, 49–50 cm, and 71–73 cm and may result from small scale sediment redistribution events during which the fine sediment fraction was lost. No such coarse layers are observed in GGC3 (Supplementary Fig. S1). Iron and copper enrichments indi-cate intense hydrothermal deposition in GGC3 between 0–10 cm
and 30–50 cm (Middleton et al., 2016), but analogous examina-tion of GGC6 suggests little to no hydrothermal deposition in the 29◦N sediments. Proximity to hydrothermal activity was not found to interfere with utilization of 3HeET as a constant flux proxy in GGC3 (Middleton et al., 2016). The full length of each core was sampled in continuous 1 to 2 cm intervals and reported values reflect the sampled interval average. Contiguous sampling ensures that any millennial-scale excursion in dust flux preserved within the sediments is captured within the analytical record and thus precludes potential interpretation biases associated with unsam-pled intervals. However, the observed magnitude of each excursion is likely to be underrepresented due to bioturbation and sampling-associated smoothing of the record.
Terrigenous dust concentrations were evaluated using 4Heterr, Th, and Ti. Vertical sediment rain rates were constrained using 3HeET and were used to calculate dust fluxes following Equa-tion (2). Sediment core age-models were determined using a combination of radiocarbon analyses and basin-scale correlations in bulk carbonate content stratigraphy. Additional chronostrati-graphic context for the sedimentary records was provided by ben-thic foraminiferal oxygen isotope (δ18O) and carbon isotope (δ13C) analyses.
3.1. Sediment chronology and age-model-derived mass accumulation rates
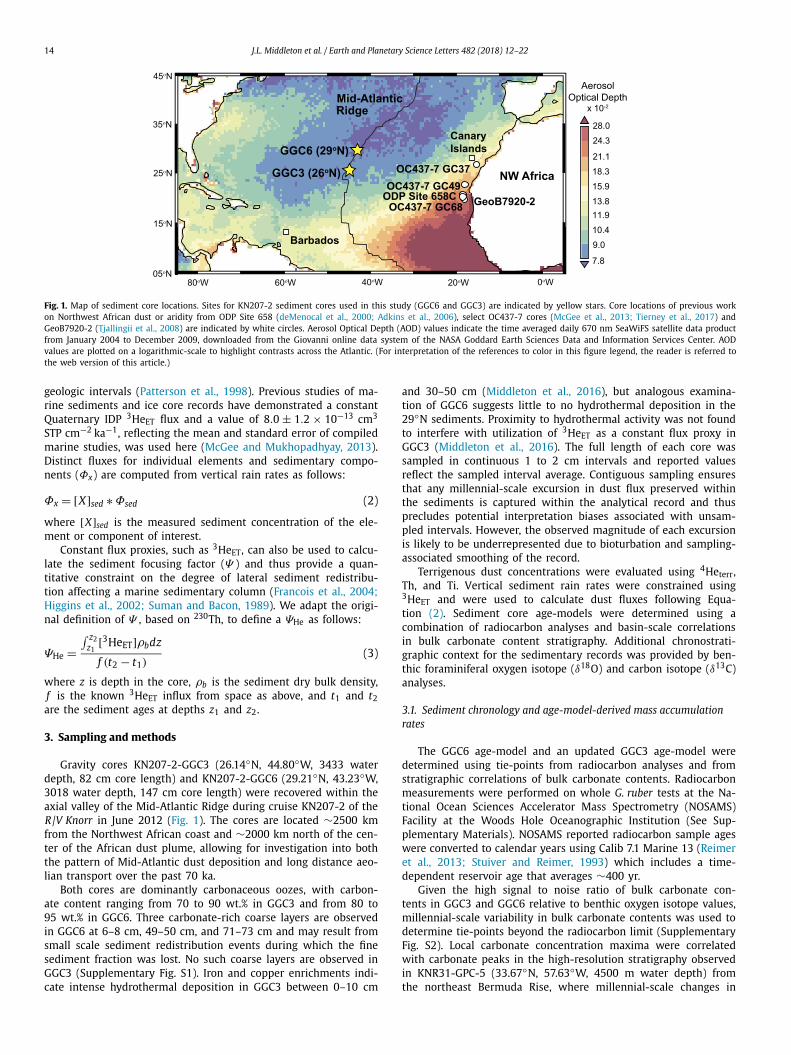
The GGC6 age-model and an updated GGC3 age-model were determined using tie-points from radiocarbon analyses and from stratigraphic correlations of bulk carbonate contents. Radiocarbon measurements were performed on whole G. ruber tests at the Na-tional Ocean Sciences Accelerator Mass Spectrometry (NOSAMS) Facility at the Woods Hole Oceanographic Institution (See Sup-plementary Materials). NOSAMS reported radiocarbon sample ages were converted to calendar years using Calib 7.1 Marine 13 (Reimer et al., 2013; Stuiver and Reimer, 1993) which includes a time-dependent reservoir age that averages ∼400 yr.
Given the high signal to noise ratio of bulk carbonate con-tents in GGC3 and GGC6 relative to benthic oxygen isotope values, millennial-scale variability in bulk carbonate contents was used to determine tie-points beyond the radiocarbon limit (Supplementary Fig. S2). Local carbonate concentration maxima were correlated with carbonate peaks in the high-resolution stratigraphy observed in KNR31-GPC-5 (33.67◦N, 57.63◦W, 4500 m water depth) from the northeast Bermuda Rise, where millennial-scale changes in
J.L. Middleton et al. / Earth and Planetary Science Letters 482 (2018) 12–22 15
Fig. 2. Sediment core age-models and stable isotope values for KN207-2-GGC3 (26◦N, blue squares) and KN207-2-GGC6 (29◦N, brown circles). (a) Bulk carbonate content. Data points indicate the average value of a sedimentary interval spanning ∼1 ka of time. GGC6 carbonate peaks at 3.3, 23.0, and 33.8 ka are associated with anomalously coarse sedimentary layers. The 28 to 15 ka GGC3 carbonate minimum is coincident with significant accumulation of hydrothermal material (Middleton et al., 2016). (b) Individual aliquot (points) and three-point running mean values (lines) of benthic δ18O and (c) δ13C measured in C. wuellerstorfi. Age-model tie-points from radiocarbon data (circles and squares) and from carbonate stratigraphy (triangles; See Supplementary Material) are indicated along the x-axes for GGC6 (top axis) and for GGC3 (bottom axis). Age uncertainties span the width of tie-point markers. Chronological uncertainty increases with distance from the age-model tie-points. (For interpretation of the references to color in this figure legend, the reader is referred to the web version of this article.)
local terrigenous input and basin-wide carbonate dissolution are thought to drive carbonate variability (Keigwin and Jones, 1994). The KNR31-GPC-5 chronology was determined using radiocarbon dates and δ18O stratigraphy (Keigwin and Jones, 1994).
Chronologies for GGC3 and GGC6 were calculated assuming a linear distribution of time between tie-points. Ages for depths be-low the oldest tie-point were estimated assuming the same sedi-mentation rate as the previous tie-point bounded interval. Strati-graphic similarities between the benthic δ18O and δ13C records in GGC3 and GGC6 suggest that the Mid-Atlantic cores record un-perturbed sediment chronologies (Fig. 2). The radiocarbon-derived timing of the Last Glacial Maximum (LGM) matches the occur-rence of maximum δ18O in both GGC3 and GGC6. The carbonate content-derived timing of Marine Isotope Stage 4 (MIS 4) coincides with local minimum values of the δ13C stratigraphy. The estimated chronologies suggest average sedimentation rates of ∼2 cm/ka in both cores.
Traditional mass accumulation rates were also determined in order to compare age-model-derived dust fluxes with dust fluxes derived using 3HeET. Mass accumulation rates (MAR) were calcu-lated from the relationship:
MAR = ρb ∗ z2 − z1
t2 − t1(4)
where ρb , t1, t2, z1 and z2 are as in Equation (3) and using an av-erage dry bulk density for the Mid-Atlantic cores of 0.65 g cm−3
determined by weighing 5 sediment samples of known initial vol-ume.
3.2. Stable isotope and elemental analyses
Benthic oxygen isotope (δ18O) and carbon isotope (δ13C) analy-ses were performed on a dual-inlet Thermo Delta V+ mass spec-trometer at the Lamont-Doherty Earth Observatory of Columbia University (See Supplementary Materials). The average difference in δ18O and in δ13C values between replicated samples from this study was 0.24� for both isotopic systems.
Concentrations of Ti and Th were determined using solution nebulized ICP-MS analyses following the methods of Middleton et al. (2016) and performed on a Thermo X series quadrupole at Harvard University (See Supplementary Materials). The 1σ uncer-tainties in elemental concentrations were 0.05 wt.% and 0.07 ppm for Ti and Th, respectively.
3.3. Helium isotope analyses
Helium analyses were performed on 1.5 g sediment aliquots in the Harvard Noble Gas Laboratory following Middleton et al.(2016). Sample 3HeET and 4Heterr concentrations were calculated assuming a two component mixture of IDP helium ((3He/4He)ET) with a 3He/4He ratio of 170 RA (where RA denotes the ratio nor-malized to the atmospheric 3He/4He value of 1.39 ×10⁻⁶; Nier and Schlutter, 1992) and a typical terrigenous source ((3He/4He)terr) with a 3He/4He ratio of 0.01 RA (Farley and Patterson, 1995) us-ing the following relationships:
[3HeET] = [3Hemsr
](1 − (3He/4He)terr(3He/4He)msr
1 − (3He/4He)terr(3He/4He)ET
)(5)
and
[4Heterr] = [4Hemsr
]( (3He/4He)msr − (3He/4He)ET
(3He/4He)terr − (3He/4He)ET
)(6)
where msr denotes the measured sample value (See Supple-mentary Materials). Using the IDP and terrigenous 3He/4He end-member values listed above, 3HeET represents >98% of total 3He and 4Heterr represents >93% of total 4He in all samples measured. Interpretations of the Mid-Atlantic samples are not sensitive to the presumed value of (3He/4He)terr. For example, assuming a 10×higher (3He/4He)terr value of 0.10 RA (Marcantonio et al., 1998), 3HeET would represent >88% of total 3He in all samples and 94% of total 3He in the sample mean. Calculated values of 4Heterr would change by less than 0.1%.
Reproducibility in [4Heterr] is comparable to analytical uncer-tainty and replicated samples indicate 1σ values of 1–2%. In con-trast, [3HeET] reproducibility is influenced by the distribution of unusually large, helium-rich IDPs that are rare and are conse-quently not representatively sampled in typical sediment aliquots. This ‘nugget effect’ is independent of sedimentary smoothing asso-ciated with bioturbation and increases the uncertainty in [3HeET] substantially beyond that of the analytical uncertainty (Farley et al., 1997). Uncertainties in sediment [3HeET] determined through

16 J.L. Middleton et al. / Earth and Planetary Science Letters 482 (2018) 12–22
replicate analysis of nearly all samples can be reasonably approxi-mated as a Gaussian with a 1σ value of 28% (See Supplementary Materials). Assuming normality, the 1σ uncertainty in [3HeET] in individual samples scales as 0.28/
√n, where n is the number of
aliquots analyzed. Note that this level of uncertainty does not com-promise the conclusions of this study.
Elemental fluxes were calculated by multiplying elemental con-centrations with the 3HeET-derived sediment rain rates follow-ing Equation (2). Propagation of uncertainties associated with the 3HeET flux from space ( f in Equation (1)), elemental con-centration data, and the determination of [3HeET] yield an av-erage 1σ uncertainty of 25% and a maximum uncertainty of 32% in the Mid-Atlantic elemental fluxes. To reduce the statis-tical noise introduced by under-sampling of rare IDPs, elemen-tal fluxes are reported as 3-point running means, representing a smoothing window of ∼6 cm or ∼3 ka, unless otherwise stated.
4. Results
4.1. Dust proxy flux patterns
To first order, the elemental flux patterns of the dust prox-ies (4Heterr and Th) and the lithogenic proxy (Ti) exhibit similar patterns of variability within each sediment core (Fig. 3, see Sup-plemental Fig. S3 for unsmoothed flux records). 4Heterr, Th, and Ti fluxes are all low during the mid-Holocene (4–7 ka) and high during the early Holocene, including distinct peaks at ∼8, ∼12, and ∼17 ka. In detail, 4Heterr and Th have the highest correlation (Supplementary Fig. S4) and exhibit increased variability relative to Ti fluxes. Between the 17 ka peak and the 6 ka minimum, 4Heterrand Th fluxes decrease by a factor of ∼3 to 4, while Ti fluxes de-crease only by a factor of 2. Depending on the element in the 70 ka record from 29◦N, there is either a slightly increasing (4Heterr, Th) or a steady (Ti) level of dustiness from MIS 4 through the LGM and into the early Holocene. Thus, while there is a generally consistent flux pattern suggested by each dust proxy element, the exact mag-nitude of flux variation and relative peak heights vary between 4Heterr, Th, and Ti. Such variations in dust proxy fluxes may be associated with changes in the integrated provenance and compo-sition of dust delivered to the Mid-Atlantic (Castillo et al., 2008;McGee et al., 2016) or with the presence of non-dust components of sedimentary Th and Ti.
Despite slight elemental differences, 4Heterr, Th, and Ti addi-tionally exhibit similar absolute fluxes between the 26◦N and the 29◦N sediment cores (Fig. 3). With the exception of 35 to 45 ka, when 4Heterr and Th fluxes at 26◦N fall to mid-Holocene levels, the 4Heterr and Th fluxes of 26◦N and 29◦N overlap within er-ror between cores over the past 50 ka. Ti fluxes overlap within error throughout the entirety of the coinciding records. Linear in-terpolation of 4Heterr, Th, and Ti flux records from each core to a uniform time series allows for direct comparison of contem-poraneous dust accumulation and highlights the similarities be-tween Mid-Atlantic locations (Fig. 4; See Supplementary Materials). The 4Heterr fluxes, for example, demonstrate a good correlation between the two records over the entire interval of comparison (R = 0.59, p = 0.04), a strong correlation over the past 35 ka (R = 0.81, p < 0.01), and an exceptional correlation over the past 20 ka (R = 0.96, p < 0.01).
Observed flux similarities between the Mid-Atlantic cores are notable given the variations in sediment focusing within each core (Fig. 5). Sediment focusing factors in the Mid-Atlantic cores range from 2 to 8 and are comparable to values of 1–16 observed in Quaternary sediments in the Western subtropical Atlantic (Bacon, 1984; McGee et al., 2010b). The Mid-Atlantic focusing factors fluc-tuate out of sync, with the strongest sediment focusing occurring
Fig. 3. Mid-Atlantic 3HeET-derived dust (4Heterr, Th) and lithogenic (Ti) proxy fluxes. (a) 4Heterr, (b) Th, and (c) Ti fluxes for 26◦N (GGC3, blue squares) and for 29◦N (GGC6, brown circles) as a function of time. Flux values indicate a three point-running mean of sedimentary intervals spanning ∼1 ka (data points) within a 1σerror envelope (solid lines). Coarse carbonate layers of GGC6 are excluded from the three point-running mean. Green bands indicate the timing of the African Humid Period (AHP), the Last Glacial Maximum (LGM), and Marine Isotope Stage 4 (MIS4). Gray bands indicate the timing of 8 ka, the Younger Dryas (YD), and Heinrich events (H1–H6) from Tierney et al. (2017), Rashid et al. (2013), and Sanchez Goñi and Har-rison (2010). GGC3 flux data (Middleton et al., 2016) are presented on a revised age-model. The timing of the YD is highlighted through the suite of flux records for ease of comparison. (For interpretation of the references to color in this figure legend, the reader is referred to the web version of this article.)
at ∼10 and ∼37 ka at 26◦N and at ∼25 and ∼65 ka at 29◦N. It is possible that the high level of sediment focusing observed from 35 to 40 ka at 26◦N could fractionate 3HeET-bearing IDPs from bulk sediment on the seafloor and thus explain the difference in elemental flux patterns between the 26◦N and 29◦N records at this time (Fig. 3). However, evaluation of 3HeET performance in the highly advected sediments of the Blake Ridge found little evidence for such fractionation (McGee et al., 2010b). The strong correlation in dust proxy fluxes observed between cores, despite distinct variability in the sediment focusing at each location, em-phasizes the utility of the 3HeET constant flux proxy to constrain millennial-scale vertical dust deposition rates in complex sedimen-tary environments.

J.L. Middleton et al. / Earth and Planetary Science Letters 482 (2018) 12–22 17
Fig. 4. Correlation of elemental flux records between Mid-Atlantic sediment cores. (a) 4Heterr, (b) Th, and (c) Ti flux record comparisons between 26◦N (y-axes) and 29◦N (x-axes) after linear interpolation to a uniform time series (see Supplementary Materials). P -values are 0.04, 0.06, and <0.01, for the correlations reported in a, b, and c, respectively. Grayscale shading indicates the age of each flux data point. A 1:1 line is indicated on each plot for comparison.
Fig. 5. Extraterrestrial helium-3 based sediment focusing factors calculated between age model tie-points for GGC3 (26◦N, blue dashed line) and GGC6 (29◦N, red solid line) following Equation (3). The timing of the African Humid Period (AHP), the Last Glacial Maximum (LGM), and Marine Isotope Stage 4 (MIS4) are as in Fig. 3. (For interpretation of the references to color in this figure legend, the reader is referred to the web version of this article.)
4.2. Absolute dust fluxes
Absolute Mid-Atlantic dust fluxes were estimated from the 4Heterr flux (Fig. 6) using a constant endmember dust 4Heterr con-centration of 5600 ncc g−1 (ODP Site 658C; Mukhopadhyay and Kreycik, 2008). Over the past 70 ka, Mid-Atlantic 4Heterr-based dust flux values range from 15 to 60 mg cm−2 ka−1 (or 0.15–0.60 g m−2 yr−1). At 29◦N, the 4Hterr-based dust fluxes account for 60–100% of the total non-carbonate sediment flux, which ranges from 25 to 70 mg cm−2 ka−1. Dust fluxes were also computed
Fig. 6. Comparison of Atlantic dust flux records. 4Heterr-based dust records from the Mid-Atlantic constrained using the 3HeET constant flux proxy (GGC3 and GGC6, this study) and select dust flux records from the Northwest African Margin (GC37, GC49, and GC68; Fig. 1) constrained using grain size analysis and the excess 230Th con-stant flux proxy (McGee et al., 2013). The Mid-Atlantic flux values indicate a three point-running mean as in Fig. 3. The timing of the African Humid Period (AHP), the Last Glacial Maximum (LGM), Marine Isotope Stage 4 (MIS4), 8 ka, the Younger Dryas (YD), and Heinrich events (H1–H6) are as in Fig. 3. Error bars have been removed for clarity. Despite ∼2500 km of separation, the Mid-Atlantic dust flux records exhibit similar patterns of variability to those from the continental margin over the past 20 ka.
from the Th and Ti data using average endmember Northwest African dust concentrations of 14 ppm for Th (Castillo et al., 2008;McGee et al., 2016) and 0.50 wt.% for Ti (Castillo et al., 2008). However, the prescribed endmember Th and Ti values yield ab-solute dust fluxes that range from 35 to 105 mg cm−2 ka−1 and 45 to 110 mg cm−2 ka−1, respectively, and consistently exceed the to-tal non-carbonate sediment flux in 29◦N sediments younger than 60 ka (Supplementary Fig. S5).
Overestimation of Th and Ti-derived dust fluxes likely results from an underestimation of the representative Th and Ti concen-trations within dust delivered to the subtropical North Atlantic. Th and Ti concentrations vary by grain size and among local-ities within North African dust source regions and span 10 to 37 ppm Th and 0.36 to 0.78 wt.% Ti (Castillo et al., 2008). Al-ternatively, Ti-bearing sedimentary basalt chips or the deposition of authigenic Th supplied by the advection of Th-rich bottom wa-ters (e.g., Rowland et al., 2017) could potentially supply significant components of non-dust Ti and Th to the Mid-Atlantic sediments.
18 J.L. Middleton et al. / Earth and Planetary Science Letters 482 (2018) 12–22
However, significant components of non-dust Th are not consis-tent with the excellent correlations between 4Heterr and Th ob-served in both cores. As the exact Ti and Th concentrations of the North African endmember within the core sites remain uncertain, remaining discussion will focus exclusively on 4Heterr-based dust flux values. Importantly, the relative pattern of Mid-Atlantic dust variability is not affected by the choice of 4Heterr-based versus Th-based dust concentrations.
5. Discussion
5.1. Helium-based Mid-Atlantic records reflect North African dust emissions
Mid-Atlantic dust fluxes derived using the 3HeET constant flux proxy yield a high resolution, spatially consistent pattern of dusti-ness that is similar to the dust flux patterns constrained using ex-cess 230Th along the Northwest African margin over the past 20 ka (Fig. 6; Adkins et al., 2006; McGee et al., 2013). The Mid-Atlantic records and those from the margin each exhibit a mid-Holocene dust minimum at ∼6 ka and prominent dust peaks coinciding with the Younger Dryas (YD) and Heinrich 1. Further, the Mid-Atlantic records at 26◦N and 29◦N indicate YD dust fluxes of 54 ±8and 60 ± 8 mg cm−2 ka−1 that are 3 to 4-fold higher than mini-mum dust fluxes at ∼6 ka of 20 ± 3 and 15 ± 2 mg cm−2 ka−1, respectively. The amplitude of variability recorded in the slowly accumulating (∼2 cm/ka) Mid-Atlantic cores may be relatively muted by the effects of bioturbation or temporal smoothing of the 3HeET-derived data (see Section 5.5). Nonetheless, these values are comparable to those observed from 23◦N to 31◦N along the continental margin, where dust deposition rates are 1.5 to 7.5-fold higher during the YD than at ∼6 ka (McGee et al., 2013). The rel-ative change in Mid-Atlantic dustiness is notably similar to the contemporaneous 4.5-fold change from 415 to 90 mg cm−2 ka−1
observed on the margin at 27◦N (McGee et al., 2013).Although absolute dust flux values are somewhat sensitive to
the presumed dust endmember composition (see Section 4.2), the 15 to 60 mg cm−2 ka−1 range of the helium-based dust fluxes is reasonable, given the distance between the cores and the center of the African dust plume (Fig. 1). The Mid-Atlantic dust fluxes are approximately ten times lower than coincident dust fluxes from similar latitudes on the Northwest African margin, which range from 70 to 950 mg cm−2 ka−1 (Fig. 6; McGee et al., 2013). This apparent tenfold reduction between the continental margin and the Mid-Atlantic is comparable to modern atmospheric ob-servations. Aerosol collection data from 2004 to 2009 reveal an average fivefold decrease in dust concentrations between the Ca-nary Islands, located at 28◦N on the African margin, and Barbados, located at 13◦N in the Caribbean (Gelado-Caballero et al., 2012;Prospero and Mayol-Bracero, 2013). While comparable aerosol col-lection data is unavailable for the Mid-Atlantic, aerosol optical depth (AOD) values from satellite observations suggest that the Mid-Atlantic core sites (AOD of 0.07 and 0.08) receive much lower dust levels than either the Canary Islands (AOD of 0.14) or Barba-dos (AOD of 0.13; Fig. 1; Kaufman et al., 2005).
Hence, the observed tenfold decrease in dust deposition be-tween the continental margin and the subtropical Mid-Atlantic agrees with the predicted spatial gradient of at least a fivefold change.
Agreement in relative changes in dust deposition between the Mid-Atlantic records and those closer to the continental dust sources suggests that Mid-Atlantic dust flux variability is heavily influenced by changes in North African dust emissions.
Fig. 7. Comparison of Mid-Atlantic dust fluxes derived using the age-model (left axes, open points) and using 3HeET as a constant flux proxy (right axes, solid points) for 29◦N (upper panel) and 26◦N (lower panel). All plots represent three point-running mean fluxes. The timing of the African Humid Period (AHP), the Last Glacial Maximum (LGM), Marine Isotope Stage 4 (MIS4), 8 ka, the Younger Dryas (YD), and Heinrich events (H1–H6) are as in Fig. 3. A green band highlights the timing of the LGM for ease of comparison between the records. Note that age-model derived dust fluxes, which are sensitive to climatically driven changes in lateral sediment transport, suggest significantly higher rates of dust deposition with more spatial variability and a weaker influence of millennial-scale events than those determined using 3HeET. (For interpretation of the references to color in this figure legend, the reader is referred to the web version of this article.)
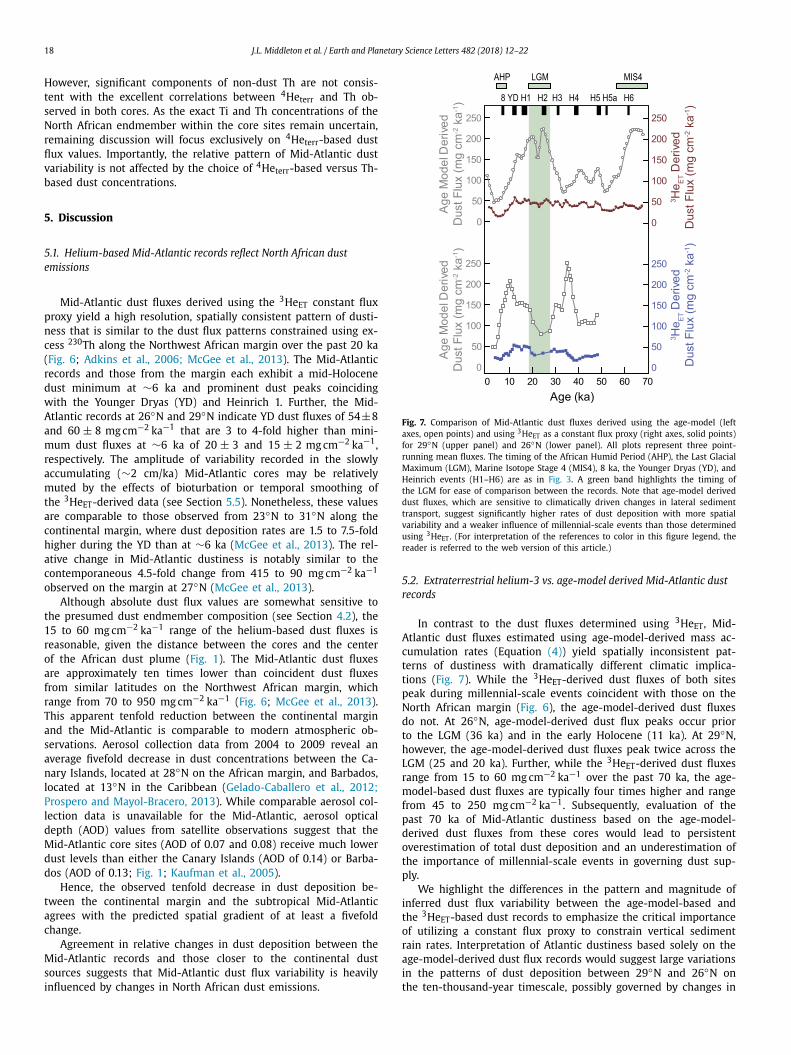
5.2. Extraterrestrial helium-3 vs. age-model derived Mid-Atlantic dust records
In contrast to the dust fluxes determined using 3HeET, Mid-Atlantic dust fluxes estimated using age-model-derived mass ac-cumulation rates (Equation (4)) yield spatially inconsistent pat-terns of dustiness with dramatically different climatic implica-tions (Fig. 7). While the 3HeET-derived dust fluxes of both sites peak during millennial-scale events coincident with those on the North African margin (Fig. 6), the age-model-derived dust fluxes do not. At 26◦N, age-model-derived dust flux peaks occur prior to the LGM (36 ka) and in the early Holocene (11 ka). At 29◦N, however, the age-model-derived dust fluxes peak twice across the LGM (25 and 20 ka). Further, while the 3HeET-derived dust fluxes range from 15 to 60 mg cm−2 ka−1 over the past 70 ka, the age-model-based dust fluxes are typically four times higher and range from 45 to 250 mg cm−2 ka−1. Subsequently, evaluation of the past 70 ka of Mid-Atlantic dustiness based on the age-model-derived dust fluxes from these cores would lead to persistent overestimation of total dust deposition and an underestimation of the importance of millennial-scale events in governing dust sup-ply.
We highlight the differences in the pattern and magnitude of inferred dust flux variability between the age-model-based and the 3HeET-based dust records to emphasize the critical importance of utilizing a constant flux proxy to constrain vertical sediment rain rates. Interpretation of Atlantic dustiness based solely on the age-model-derived dust flux records would suggest large variations in the patterns of dust deposition between 29◦N and 26◦N on the ten-thousand-year timescale, possibly governed by changes in

J.L. Middleton et al. / Earth and Planetary Science Letters 482 (2018) 12–22 19
Earth’s orbital configuration (Fig. 7). Such interpretation is discor-dant with the more reliable 3HeET-derived dust fluxes. Thus, we exclusively refer to the 3HeET-derived dust fluxes for the remain-der of the discussion.
5.3. Glacial variability
The new Mid-Atlantic data extend the record of North African dust emissions from 20 to 70 ka and suggest major fluctuations in Atlantic dustiness coincident with known variations in Northern Hemisphere climate (Fig. 6). On the orbital timescale, dust fluxes to the Mid-Atlantic generally increase from MIS 4 through the LGM and into the early Holocene. Millennial-scale dust peaks in the Mid-Atlantic records centered at ∼13, 17, 27, 31, 42, 48, and 61 ka appear to coincide, within reasonable age-model uncertainty, with short-term Northern Hemisphere cold periods such as the YD and many of the past seven Heinrich Stadial events (Rashid et al., 2003;Sanchez Goñi and Harrison, 2010). Excluding the dust peak at ∼61 ka, the 29◦N record indicates a MIS 4 dust flux of 40 ±6 mg cm−2 ka−1, ∼80% of the LGM value of 50 ± 7 mg cm−2 ka−1. Notably, the highest levels of Mid-Atlantic dustiness occur during the millennial-scale cold periods, rather than during the LGM or the near-glacial MIS 4 (see Section 5.5).
The most dramatic feature of the Mid-Atlantic records is the de-crease in dust fluxes from the YD to 6 ka. This mid-Holocene dust decrease is coincident with the African Humid Period (AHP; ∼5 to 11 ka), when lake levels, West African river output, and fossil pollen records suggest a wet and vegetated continent (Gasse, 2000;Jolly et al., 1998; Ritchie et al., 1985; Street and Grove, 1976;Weldeab et al., 2007). The AHP is also associated with significant decreases in dust flux in multiple sedimentary records from the Northwest African margin (deMenocal et al., 2000; Gasse, 2000;Adkins et al., 2006; McGee et al., 2013; Tierney et al., 2017).
The AHP is associated with increased low-latitude insolation and sea surface temperatures in the tropical North Atlantic and is thought to reflect changes in the West African monsoon (Kutzbach and Liu, 1997). Sedimentary proxies of Northwest African arid-ity all indicate that the AHP was the wettest interval of the past 70 ka (Tjallingii et al., 2008; Weldeab et al., 2007). Feedbacks be-tween increased precipitation and vegetation cover and decreased mineral aerosol concentrations may have amplified dust emissions reductions associated with the wet AHP (Claussen et al., 1999;Pausata et al., 2016). The effect of such a decrease in continen-tal dust sources is consistent with the low dust fluxes observed during the mid-Holocene at both 26◦N and 29◦N. Interestingly, dust fluxes at 26◦N at ∼40 ka appear comparably low to the mid-Holocene minimum, despite the absence of an equivalent period of African humidity, while those at 29◦N do not. This divergence in dust fluxes at ∼40 ka may be related to a change in dust emission conditions within the southern Sahara and Sahel regions relative to northern dust sources. However, additional long-term dust flux records from more southern latitudes in the North Atlantic are re-quired to evaluate this hypothesis
5.4. Comparison to model estimates for Mid-Atlantic dust deposition
The subtropical Mid-Atlantic flux estimates provide new tempo-ral and spatial constraints on Atlantic dustiness that can be used to test and improve models of atmospheric transport and aeolian iron deposition across climatic changes (e.g., Albani et al., 2015, 2016; Mahowald et al., 2009). For example, recent modeling efforts have employed existing dust flux records and the Community Earth Sys-tem Model to estimate variability in the global dust cycle and fine grained (<10 μm) aeolian deposition to the oceans from the LGM to the preindustrial period (Albani et al., 2016, 2015).
The Mid-Atlantic data reveal subtropical North Atlantic dust fluxes that are at least three times lower than estimates from the Albani et al. (2016) model over the past 21 ka. During the LGM (at 21 ka), the Albani et al. model predicts dust deposition rates of 180 and 160 mg cm−2 ka−1 to the grid cells hosting the 26◦N and 29◦N cores, respectively. These predicted values are three to six times higher than the LGM values of 30 ± 5 (at 26◦N) and 50 ± 7(at 29◦N) mg cm−2 ka−1 recorded in the Mid-Atlantic sediments at 21 ka. The model-data offset is slightly higher during the dust minimum of the AHP. At 6 ka, the Albani et al. model estimates dust deposition rates of 135 (at 26◦N) and 100 mg cm−2 ka−1 (at 29◦N), whereas the Mid-Atlantic records reflect dust fluxes of only 20 ±4 mg cm−2 ka−1. Thus, the global dust model suggests a ∼30% drop in subtropical North Atlantic dust deposition from the LGM into the AHP, while the sedimentary data suggest a larger decrease of ∼50% over the same interval. Consequently, although the ampli-tude of dust flux variability recorded in the Mid-Atlantic sediments may have been smoothed by bioturbation, the data suggest larger changes in Northwest African dust emissions over the past 21 ka than the recent model predicts. Muted variability of North African dust emissions within the Albani et al. global model suggests that incorporation of additional processes, such as dynamic vegetation and variable flooding of dry lake beds (Tegen et al., 2002), could be important for improving model representation of dust emissions across variable climatic conditions.
5.5. Millennial-scale variability in Atlantic dustiness
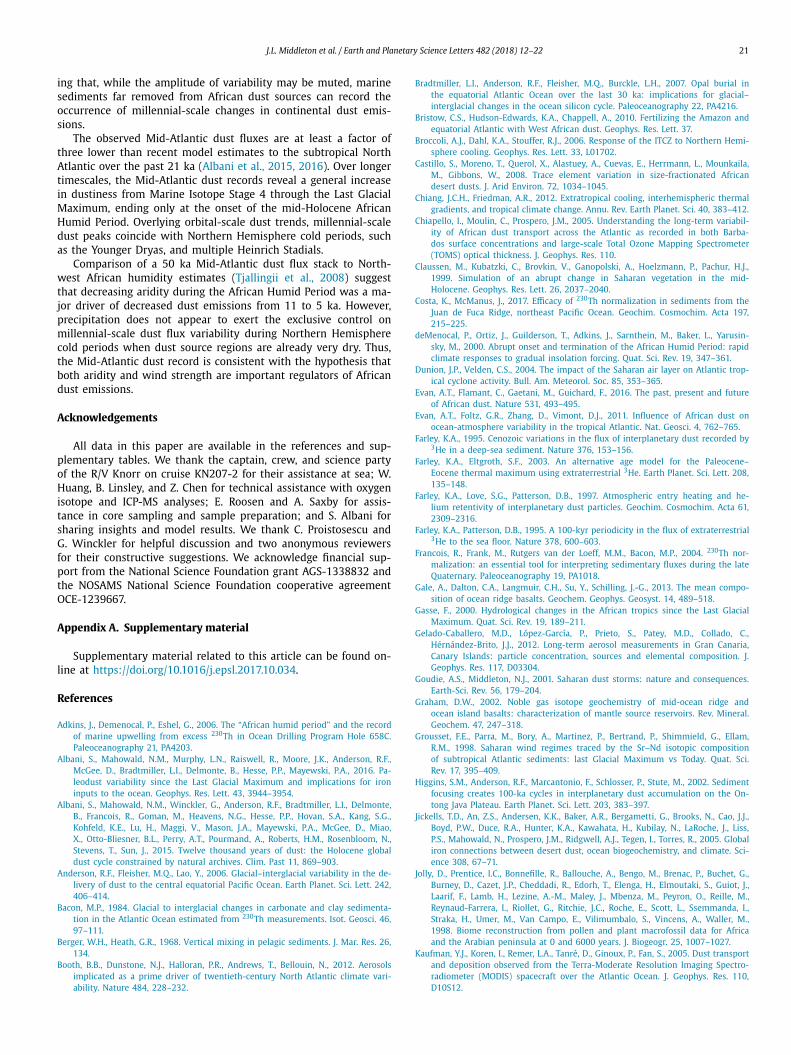
The occurrence of millennial-scale dust peaks within the Mid-Atlantic records is consistent with previous observations from the African margin and allows for the evaluation of the effects of short-term climatic variability on North African dust emissions prior to the LGM. While temporal averaging of 3HeET-derived flux data, as employed above, allows for examination of distinct spatial patterns between the Mid-Atlantic core locations, temporal averag-ing decreases the perceived magnitude of dust flux changes across millennial-scale events. Similarly, spatial averaging of the sedimen-tary dust flux data preserves temporal resolution at the expense of spatial variability. Thus, to better examine the occurrence of millennial-scale variability in North African dust emissions, the unsmoothed dust flux data from 26◦N and 29◦N were averaged together to generate a Mid-Atlantic dust flux stack (Fig. 8, Supple-mentary Fig. S3).
Over the past 50 ka, millennial-scale peaks in Mid-Atlantic dust deposition occur at ∼13, 17, 27, 31, 34, 42 and 48 ka, reaching maximum dust fluxes equivalent to 150%, 155%, 130%, 110%, 115%, 95%, and 105% of the LGM (21 ka) flux of 45 ± 6 mg cm−2 ka−1, respectively. Excluding the peaks at 34 and 42 ka, these events co-incide with the YD and Heinrich Stadials 1–3 and 5 (Sanchez Goñi and Harrison, 2010). The dramatic decrease in Mid-Atlantic dust flux into the AHP is punctuated at ∼8 ka. This feature may be re-lated to a pronounced dry spell that interrupted the relatively wet conditions of the AHP (Tierney et al., 2017). The apparent absence of a Mid-Atlantic dust peak during Heinrich Stadial 4 (38–40 ka) may result from either weak emission conditions particular to this event or from age model error in the chronology of the ∼42 ka dust peak. The increasing trend in maximum dust emissions dur-ing millennial-scale Northern Hemisphere cold periods from 50 ka through the LGM is consistent with the general increase in back-ground dustiness across this interval.
The effects of bioturbation on the Mid-Atlantic records were ex-amined using a bioturbation model (e.g., Berger and Heath, 1968;McGee et al., 2013) in which an abrupt input signal was deposited in 0.005 ka timesteps onto an accumulating sediment column with a completely homogenized mixed layer (see Supplementary Mate-rials). The input signal was prescribed to approximate, after 1 ka
20 J.L. Middleton et al. / Earth and Planetary Science Letters 482 (2018) 12–22
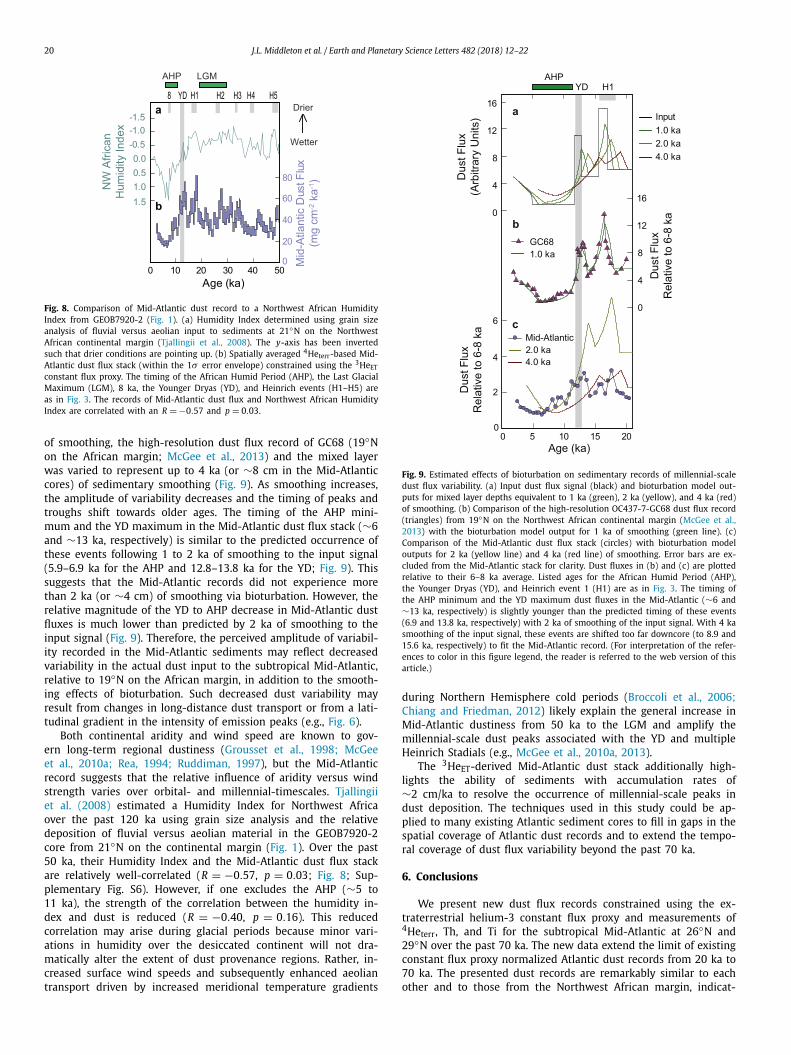
Fig. 8. Comparison of Mid-Atlantic dust record to a Northwest African Humidity Index from GEOB7920-2 (Fig. 1). (a) Humidity Index determined using grain size analysis of fluvial versus aeolian input to sediments at 21◦N on the Northwest African continental margin (Tjallingii et al., 2008). The y-axis has been inverted such that drier conditions are pointing up. (b) Spatially averaged 4Heterr-based Mid-Atlantic dust flux stack (within the 1σ error envelope) constrained using the 3HeET
constant flux proxy. The timing of the African Humid Period (AHP), the Last Glacial Maximum (LGM), 8 ka, the Younger Dryas (YD), and Heinrich events (H1–H5) are as in Fig. 3. The records of Mid-Atlantic dust flux and Northwest African Humidity Index are correlated with an R = −0.57 and p = 0.03.
of smoothing, the high-resolution dust flux record of GC68 (19◦N on the African margin; McGee et al., 2013) and the mixed layer was varied to represent up to 4 ka (or ∼8 cm in the Mid-Atlantic cores) of sedimentary smoothing (Fig. 9). As smoothing increases, the amplitude of variability decreases and the timing of peaks and troughs shift towards older ages. The timing of the AHP mini-mum and the YD maximum in the Mid-Atlantic dust flux stack (∼6 and ∼13 ka, respectively) is similar to the predicted occurrence of these events following 1 to 2 ka of smoothing to the input signal (5.9–6.9 ka for the AHP and 12.8–13.8 ka for the YD; Fig. 9). This suggests that the Mid-Atlantic records did not experience more than 2 ka (or ∼4 cm) of smoothing via bioturbation. However, the relative magnitude of the YD to AHP decrease in Mid-Atlantic dust fluxes is much lower than predicted by 2 ka of smoothing to the input signal (Fig. 9). Therefore, the perceived amplitude of variabil-ity recorded in the Mid-Atlantic sediments may reflect decreased variability in the actual dust input to the subtropical Mid-Atlantic, relative to 19◦N on the African margin, in addition to the smooth-ing effects of bioturbation. Such decreased dust variability may result from changes in long-distance dust transport or from a lati-tudinal gradient in the intensity of emission peaks (e.g., Fig. 6).
Both continental aridity and wind speed are known to gov-ern long-term regional dustiness (Grousset et al., 1998; McGee et al., 2010a; Rea, 1994; Ruddiman, 1997), but the Mid-Atlantic record suggests that the relative influence of aridity versus wind strength varies over orbital- and millennial-timescales. Tjallingii et al. (2008) estimated a Humidity Index for Northwest Africa over the past 120 ka using grain size analysis and the relative deposition of fluvial versus aeolian material in the GEOB7920-2 core from 21◦N on the continental margin (Fig. 1). Over the past 50 ka, their Humidity Index and the Mid-Atlantic dust flux stack are relatively well-correlated (R = −0.57, p = 0.03; Fig. 8; Sup-plementary Fig. S6). However, if one excludes the AHP (∼5 to 11 ka), the strength of the correlation between the humidity in-dex and dust is reduced (R = −0.40, p = 0.16). This reduced correlation may arise during glacial periods because minor vari-ations in humidity over the desiccated continent will not dra-matically alter the extent of dust provenance regions. Rather, in-creased surface wind speeds and subsequently enhanced aeolian transport driven by increased meridional temperature gradients
Fig. 9. Estimated effects of bioturbation on sedimentary records of millennial-scale dust flux variability. (a) Input dust flux signal (black) and bioturbation model out-puts for mixed layer depths equivalent to 1 ka (green), 2 ka (yellow), and 4 ka (red) of smoothing. (b) Comparison of the high-resolution OC437-7-GC68 dust flux record (triangles) from 19◦N on the Northwest African continental margin (McGee et al., 2013) with the bioturbation model output for 1 ka of smoothing (green line). (c) Comparison of the Mid-Atlantic dust flux stack (circles) with bioturbation model outputs for 2 ka (yellow line) and 4 ka (red line) of smoothing. Error bars are ex-cluded from the Mid-Atlantic stack for clarity. Dust fluxes in (b) and (c) are plotted relative to their 6–8 ka average. Listed ages for the African Humid Period (AHP), the Younger Dryas (YD), and Heinrich event 1 (H1) are as in Fig. 3. The timing of the AHP minimum and the YD maximum dust fluxes in the Mid-Atlantic (∼6 and ∼13 ka, respectively) is slightly younger than the predicted timing of these events (6.9 and 13.8 ka, respectively) with 2 ka of smoothing of the input signal. With 4 ka smoothing of the input signal, these events are shifted too far downcore (to 8.9 and 15.6 ka, respectively) to fit the Mid-Atlantic record. (For interpretation of the refer-ences to color in this figure legend, the reader is referred to the web version of this article.)
during Northern Hemisphere cold periods (Broccoli et al., 2006;Chiang and Friedman, 2012) likely explain the general increase in Mid-Atlantic dustiness from 50 ka to the LGM and amplify the millennial-scale dust peaks associated with the YD and multiple Heinrich Stadials (e.g., McGee et al., 2010a, 2013).
The 3HeET-derived Mid-Atlantic dust stack additionally high-lights the ability of sediments with accumulation rates of∼2 cm/ka to resolve the occurrence of millennial-scale peaks in dust deposition. The techniques used in this study could be ap-plied to many existing Atlantic sediment cores to fill in gaps in the spatial coverage of Atlantic dust records and to extend the tempo-ral coverage of dust flux variability beyond the past 70 ka.
6. Conclusions
We present new dust flux records constrained using the ex-traterrestrial helium-3 constant flux proxy and measurements of 4Heterr, Th, and Ti for the subtropical Mid-Atlantic at 26◦N and 29◦N over the past 70 ka. The new data extend the limit of existing constant flux proxy normalized Atlantic dust records from 20 ka to 70 ka. The presented dust records are remarkably similar to each other and to those from the Northwest African margin, indicat-
J.L. Middleton et al. / Earth and Planetary Science Letters 482 (2018) 12–22 21
ing that, while the amplitude of variability may be muted, marine sediments far removed from African dust sources can record the occurrence of millennial-scale changes in continental dust emis-sions.
The observed Mid-Atlantic dust fluxes are at least a factor of three lower than recent model estimates to the subtropical North Atlantic over the past 21 ka (Albani et al., 2015, 2016). Over longer timescales, the Mid-Atlantic dust records reveal a general increase in dustiness from Marine Isotope Stage 4 through the Last Glacial Maximum, ending only at the onset of the mid-Holocene African Humid Period. Overlying orbital-scale dust trends, millennial-scale dust peaks coincide with Northern Hemisphere cold periods, such as the Younger Dryas, and multiple Heinrich Stadials.
Comparison of a 50 ka Mid-Atlantic dust flux stack to North-west African humidity estimates (Tjallingii et al., 2008) suggest that decreasing aridity during the African Humid Period was a ma-jor driver of decreased dust emissions from 11 to 5 ka. However, precipitation does not appear to exert the exclusive control on millennial-scale dust flux variability during Northern Hemisphere cold periods when dust source regions are already very dry. Thus, the Mid-Atlantic dust record is consistent with the hypothesis that both aridity and wind strength are important regulators of African dust emissions.
Acknowledgements
All data in this paper are available in the references and sup-plementary tables. We thank the captain, crew, and science party of the R/V Knorr on cruise KN207-2 for their assistance at sea; W. Huang, B. Linsley, and Z. Chen for technical assistance with oxygen isotope and ICP-MS analyses; E. Roosen and A. Saxby for assis-tance in core sampling and sample preparation; and S. Albani for sharing insights and model results. We thank C. Proistosescu and G. Winckler for helpful discussion and two anonymous reviewers for their constructive suggestions. We acknowledge financial sup-port from the National Science Foundation grant AGS-1338832 and the NOSAMS National Science Foundation cooperative agreement OCE-1239667.
Appendix A. Supplementary material
Supplementary material related to this article can be found on-line at https://doi.org/10.1016/j.epsl.2017.10.034.
References
Adkins, J., Demenocal, P., Eshel, G., 2006. The “African humid period” and the record of marine upwelling from excess 230Th in Ocean Drilling Program Hole 658C. Paleoceanography 21, PA4203.
Albani, S., Mahowald, N.M., Murphy, L.N., Raiswell, R., Moore, J.K., Anderson, R.F., McGee, D., Bradtmiller, L.I., Delmonte, B., Hesse, P.P., Mayewski, P.A., 2016. Pa-leodust variability since the Last Glacial Maximum and implications for iron inputs to the ocean. Geophys. Res. Lett. 43, 3944–3954.
Albani, S., Mahowald, N.M., Winckler, G., Anderson, R.F., Bradtmiller, L.I., Delmonte, B., Francois, R., Goman, M., Heavens, N.G., Hesse, P.P., Hovan, S.A., Kang, S.G., Kohfeld, K.E., Lu, H., Maggi, V., Mason, J.A., Mayewski, P.A., McGee, D., Miao, X., Otto-Bliesner, B.L., Perry, A.T., Pourmand, A., Roberts, H.M., Rosenbloom, N., Stevens, T., Sun, J., 2015. Twelve thousand years of dust: the Holocene global dust cycle constrained by natural archives. Clim. Past 11, 869–903.
Anderson, R.F., Fleisher, M.Q., Lao, Y., 2006. Glacial–interglacial variability in the de-livery of dust to the central equatorial Pacific Ocean. Earth Planet. Sci. Lett. 242, 406–414.
Bacon, M.P., 1984. Glacial to interglacial changes in carbonate and clay sedimenta-tion in the Atlantic Ocean estimated from 230Th measurements. Isot. Geosci. 46, 97–111.
Berger, W.H., Heath, G.R., 1968. Vertical mixing in pelagic sediments. J. Mar. Res. 26, 134.
Booth, B.B., Dunstone, N.J., Halloran, P.R., Andrews, T., Bellouin, N., 2012. Aerosols implicated as a prime driver of twentieth-century North Atlantic climate vari-ability. Nature 484, 228–232.
Bradtmiller, L.I., Anderson, R.F., Fleisher, M.Q., Burckle, L.H., 2007. Opal burial in the equatorial Atlantic Ocean over the last 30 ka: implications for glacial–interglacial changes in the ocean silicon cycle. Paleoceanography 22, PA4216.
Bristow, C.S., Hudson-Edwards, K.A., Chappell, A., 2010. Fertilizing the Amazon and equatorial Atlantic with West African dust. Geophys. Res. Lett. 37.
Broccoli, A.J., Dahl, K.A., Stouffer, R.J., 2006. Response of the ITCZ to Northern Hemi-sphere cooling. Geophys. Res. Lett. 33, L01702.
Castillo, S., Moreno, T., Querol, X., Alastuey, A., Cuevas, E., Herrmann, L., Mounkaila, M., Gibbons, W., 2008. Trace element variation in size-fractionated African desert dusts. J. Arid Environ. 72, 1034–1045.
Chiang, J.C.H., Friedman, A.R., 2012. Extratropical cooling, interhemispheric thermal gradients, and tropical climate change. Annu. Rev. Earth Planet. Sci. 40, 383–412.
Chiapello, I., Moulin, C., Prospero, J.M., 2005. Understanding the long-term variabil-ity of African dust transport across the Atlantic as recorded in both Barba-dos surface concentrations and large-scale Total Ozone Mapping Spectrometer (TOMS) optical thickness. J. Geophys. Res. 110.
Claussen, M., Kubatzki, C., Brovkin, V., Ganopolski, A., Hoelzmann, P., Pachur, H.J., 1999. Simulation of an abrupt change in Saharan vegetation in the mid-Holocene. Geophys. Res. Lett. 26, 2037–2040.
Costa, K., McManus, J., 2017. Efficacy of 230Th normalization in sediments from the Juan de Fuca Ridge, northeast Pacific Ocean. Geochim. Cosmochim. Acta 197, 215–225.
deMenocal, P., Ortiz, J., Guilderson, T., Adkins, J., Sarnthein, M., Baker, L., Yarusin-sky, M., 2000. Abrupt onset and termination of the African Humid Period: rapid climate responses to gradual insolation forcing. Quat. Sci. Rev. 19, 347–361.
Dunion, J.P., Velden, C.S., 2004. The impact of the Saharan air layer on Atlantic trop-ical cyclone activity. Bull. Am. Meteorol. Soc. 85, 353–365.
Evan, A.T., Flamant, C., Gaetani, M., Guichard, F., 2016. The past, present and future of African dust. Nature 531, 493–495.
Evan, A.T., Foltz, G.R., Zhang, D., Vimont, D.J., 2011. Influence of African dust on ocean-atmosphere variability in the tropical Atlantic. Nat. Geosci. 4, 762–765.
Farley, K.A., 1995. Cenozoic variations in the flux of interplanetary dust recorded by 3He in a deep-sea sediment. Nature 376, 153–156.
Farley, K.A., Eltgroth, S.F., 2003. An alternative age model for the Paleocene–Eocene thermal maximum using extraterrestrial 3He. Earth Planet. Sci. Lett. 208, 135–148.
Farley, K.A., Love, S.G., Patterson, D.B., 1997. Atmospheric entry heating and he-lium retentivity of interplanetary dust particles. Geochim. Cosmochim. Acta 61, 2309–2316.
Farley, K.A., Patterson, D.B., 1995. A 100-kyr periodicity in the flux of extraterrestrial 3He to the sea floor. Nature 378, 600–603.
Francois, R., Frank, M., Rutgers van der Loeff, M.M., Bacon, M.P., 2004. 230Th nor-malization: an essential tool for interpreting sedimentary fluxes during the late Quaternary. Paleoceanography 19, PA1018.
Gale, A., Dalton, C.A., Langmuir, C.H., Su, Y., Schilling, J.-G., 2013. The mean compo-sition of ocean ridge basalts. Geochem. Geophys. Geosyst. 14, 489–518.
Gasse, F., 2000. Hydrological changes in the African tropics since the Last Glacial Maximum. Quat. Sci. Rev. 19, 189–211.
Gelado-Caballero, M.D., López-García, P., Prieto, S., Patey, M.D., Collado, C., Hérnández-Brito, J.J., 2012. Long-term aerosol measurements in Gran Canaria, Canary Islands: particle concentration, sources and elemental composition. J. Geophys. Res. 117, D03304.
Goudie, A.S., Middleton, N.J., 2001. Saharan dust storms: nature and consequences. Earth-Sci. Rev. 56, 179–204.
Graham, D.W., 2002. Noble gas isotope geochemistry of mid-ocean ridge and ocean island basalts: characterization of mantle source reservoirs. Rev. Mineral. Geochem. 47, 247–318.
Grousset, F.E., Parra, M., Bory, A., Martinez, P., Bertrand, P., Shimmield, G., Ellam, R.M., 1998. Saharan wind regimes traced by the Sr–Nd isotopic composition of subtropical Atlantic sediments: last Glacial Maximum vs Today. Quat. Sci. Rev. 17, 395–409.
Higgins, S.M., Anderson, R.F., Marcantonio, F., Schlosser, P., Stute, M., 2002. Sediment focusing creates 100-ka cycles in interplanetary dust accumulation on the On-tong Java Plateau. Earth Planet. Sci. Lett. 203, 383–397.
Jickells, T.D., An, Z.S., Andersen, K.K., Baker, A.R., Bergametti, G., Brooks, N., Cao, J.J., Boyd, P.W., Duce, R.A., Hunter, K.A., Kawahata, H., Kubilay, N., LaRoche, J., Liss, P.S., Mahowald, N., Prospero, J.M., Ridgwell, A.J., Tegen, I., Torres, R., 2005. Global iron connections between desert dust, ocean biogeochemistry, and climate. Sci-ence 308, 67–71.
Jolly, D., Prentice, I.C., Bonnefille, R., Ballouche, A., Bengo, M., Brenac, P., Buchet, G., Burney, D., Cazet, J.P., Cheddadi, R., Edorh, T., Elenga, H., Elmoutaki, S., Guiot, J., Laarif, F., Lamb, H., Lezine, A.-M., Maley, J., Mbenza, M., Peyron, O., Reille, M., Reynaud-Farrera, I., Riollet, G., Ritchie, J.C., Roche, E., Scott, L., Ssemmanda, I., Straka, H., Umer, M., Van Campo, E., Vilimumbalo, S., Vincens, A., Waller, M., 1998. Biome reconstruction from pollen and plant macrofossil data for Africa and the Arabian peninsula at 0 and 6000 years. J. Biogeogr. 25, 1007–1027.
Kaufman, Y.J., Koren, I., Remer, L.A., Tanré, D., Ginoux, P., Fan, S., 2005. Dust transport and deposition observed from the Terra-Moderate Resolution Imaging Spectro-radiometer (MODIS) spacecraft over the Atlantic Ocean. J. Geophys. Res. 110, D10S12.
22 J.L. Middleton et al. / Earth and Planetary Science Letters 482 (2018) 12–22
Keigwin, L.D., Jones, G.A., 1994. Western North Atlantic evidence for millennial-scale changes in ocean circulation and climate. J. Geophys. Res. 99, 12397–12410.
Kienast, S.S., Winckler, G., Lippold, J., Albani, S., Mahowald, N.M., 2016. Tracing dust input to the global ocean using thorium isotopes in marine sediments: ThoroMap. Glob. Biogeochem. Cycles 30, 1526–1541.
Kohfeld, K.E., Harrison, S.P., 2001. DIRTMAP: the geological record of dust. Earth-Sci. Rev. 54, 81–114.
Kutzbach, J.E., Liu, Z., 1997. Response of the African monsoon to orbital forcing and ocean feedbacks in the middle Holocene. Science 278, 440–443.
Mahowald, N.M., Engelstaedter, S., Luo, C., Sealy, A., Artaxo, P., Benitez-Nelson, C., Bonnet, S., Chen, Y., Chuang, P.Y., Cohen, D.D., Dulac, F., Herut, B., Johansen, A.M., Kubilay, N., Losno, R., Maenhaut, W., Paytan, A., Prospero, J.M., Shank, L.M., Siefert, R.L., 2009. Atmospheric iron deposition: global distribution, variability, and human perturbations. Annu. Rev. Mar. Sci. 1, 245–278.
Mahowald, N.M., Muhs, D.R., Levis, S., Rasch, P.J., Yoshioka, M., Zender, C.S., Luo, C., 2006. Change in atmospheric mineral aerosols in response to climate: last glacial period, preindustrial, modern, and doubled carbon dioxide climates. J. Geophys. Res. 111.
Marcantonio, F., Kumar, N., Stute, M., Anderson, R.F., Seidl, M.A., Schlosser, P., Mix, A., 1995. A comparative study of accumulation rates derived by He and Th isotope analysis of marine sediments. Earth Planet. Sci. Lett. 133, 549–555.
Marcantonio, F., Anderson, R.F., Stute, M., Kumar, N., Schlosser, P., Mix, A., 1996. Extraterrestrial 3He as a tracer of marine sediment transport and accumulation. Nature 383, 705–707.
Marcantonio, F., Higgins, S., Anderson, R.F., Stute, M., Schlosser, P., Rasbury, E.T., 1998. Terrigenous helium in deep-sea sediments. Geochim. Cosmochim. Acta 62, 1535–1543.
Marcantonio, F., Anderson, R.F., Higgins, S., Fleisher, M.Q., Stute, M., Schlosser, P., 2001a. Abrupt intensification of the SW Indian Ocean monsoon during the last deglaciation: constraints from Th, Pa, and He isotopes. Earth Planet. Sci. Lett. 184, 505–514.
Marcantonio, F., Anderson, R.F., Higgins, S., Stute, M., Schlosser, P., Kubik, P., 2001b. Sediment focusing in the central equatorial Pacific Ocean. Paleoceanography 16, 260–267.
Martin, J.H., 1990. Glacial–interglacial CO2 change: the iron hypothesis. Paleoceanog-raphy 5, 1–13.
McGee, D., Broecker, W.S., Winckler, G., 2010a. Gustiness: the driver of glacial dusti-ness? Quat. Sci. Rev. 29, 2340–2350.
McGee, D., Marcantonio, F., McManus, J.F., Winckler, G., 2010b. The response of excess 230Th and extraterrestrial 3He to sediment redistribution at the Blake Ridge, western North Atlantic. Earth Planet. Sci. Lett. 299, 138–149.
McGee, D., Mukhopadhyay, S., 2013. Extraterrestrial He in sediments: from recorder of asteroid collisions to timekeeper of global environmental changes. In: The Noble Gases as Geochemical Tracers. Springer-Verlag, Heidelberg, pp. 155–176.
McGee, D., Winckler, G., Borunda, A., Serno, S., Anderson, R.F., Recasens, C., Bory, A., Gaiero, D., Jaccard, S.L., Kaplan, M., McManus, J.F., Revel, M., Sun, Y., 2016. Track-ing eolian dust with helium and thorium: impacts of grain size and provenance. Geochim. Cosmochim. Acta 175, 47–67.
McGee, D., Winckler, G., Stuut, J.B.W., Bradtmiller, L.I., 2013. The magnitude, tim-ing and abruptness of changes in North African dust deposition over the last 20,000 yr. Earth Planet. Sci. Lett. 371, 163–176.
Middleton, J.L., Langmuir, C.H., Mukhopadhyay, S., McManus, J.F., Mitrovica, J.X., 2016. Hydrothermal iron flux variability following rapid sea level changes. Geo-phys. Res. Lett. 43, 3848–3856.
Miller, R., Tegen, I., 1998. Climate response to soil dust aerosols. J. Climate 11, 3247–3267.
Mukhopadhyay, S., Farley, K.A., Montanari, A., 2001. A short duration of the Cretaceous–Tertiary boundary event: evidence from extraterrestrial helium-3. Science 291, 1952–1955.
Mukhopadhyay, S., Kreycik, P., 2008. Dust generation and drought patterns in Africa from helium-4 in a modern Cape Verde coral. Geophys. Res. Lett. 35.
Murray, R.W., Knowlton, C., Leinen, M., Mix, A.C., Polsky, C.H., 2000. Export produc-tion and carbonate dissolution in the central equatorial Pacific Ocean over the past 1 Myr. Paleoceanography 15, 570–592.
Nier, A.O., Schlutter, D.J., 1992. Extraction of helium from individual interplanetary dust particles by step-heating. Meteoritics 27, 166–173.
Parker, A.O., Schmidt, M.W., Jobe, Z.R., Slowey, N.C., 2016. A new perspective on West African hydroclimate during the last deglaciation. Earth Planet. Sci. Lett. 449, 79–88.
Patterson, D.B., Farley, K.A., Norman, M.D., 1999. 4He as a tracer of continental dust: a 1.9 million year record of aeolian flux to the west equatorial Pacific Ocean. Geochim. Cosmochim. Acta 63, 615–625.
Patterson, D.B., Farley, K.A., Schmitz, B., 1998. Preservation of extraterrestrial 3He in 480-Ma-old marine limestones. Earth Planet. Sci. Lett. 163, 315–325.
Pausata, F.S., Messori, G., Zhang, Q., 2016. Impacts of dust reduction on the north-ward expansion of the African monsoon during the Green Sahara period. Earth Planet. Sci. Lett. 434, 298–307.
Prospero, J.M., Ginoux, P., Torres, O., Nicholson, S.E., Gill, T.E., 2002. Environmental characterization of global sources of atmospheric soil dust identified with the Nimbus 7 Total Ozone Mapping Spectrometer (TOMS) absorbing aerosol prod-uct. Rev. Geophys. 40.
Prospero, J.M., Lamb, P.J., 2003. African droughts and dust transport to the Caribbean: climate change implications. Science 302, 1024–1027.
Prospero, J.M., Mayol-Bracero, O.L., 2013. Understanding the transport and impact of African dust on the Caribbean basin. Bull. Am. Meteorol. Soc. 94, 1329–1337.
Rashid, H., Hesse, R., Piper, D.J.W., 2003. Evidence for an additional Heinrich event between H5 and H6 in the Labrador Sea. Paleoceanography 18, 1077.
Rea, D.K., 1994. The paleoclimatic record provided by eolian deposition in the deep sea: the geologic history of wind. Rev. Geophys. 32, 159–195.
Reimer, P.J., Bard, E., Bayliss, A., Beck, J.W., Blackwell, P.G., Bronk Ramsey, C., Buck, C.E., Cheng, H., Edwards, R.L., Friedrich, M., Grootes, P.M., Guilderson, T.P., Hafl-idason, H., Hajdas, I., Hatte, C., Heaton, T.J., Hoffmann, D.L., Hogg, A.G., Hughen, K.A., Kaiser, K.F., Kromer, B., Manning, S.W., Niu, M., Reimer, R.W., Richards, D.A., Scott, E.M., Southon, J.R., Staff, R.A., Turney, C.S.M., van der Plicht, J., 2013. Int-Cal13 and Marine13 radiocarbon age calibration curves 0–50,000 years cal BP. Radiocarbon 55, 1869–1887.
Ridley, D.A., Heald, C.L., Prospero, J.M., 2014. What controls the recent changes in African mineral dust aerosol across the Atlantic? Atmos. Chem. Phys. 14, 5735–5747.
Ritchie, J.C., Eyles, C.H., Haynes, C.V., 1985. Sediment and pollen evidence for an early to mid-Holocene humid period in the eastern Sahara. Nature 314, 352–355.
Rodríguez, S., Cuevas, E., Prospero, J.M., Alastuey, A., Querol, X., López-Solano, J., Gar-cía, M.I., Alonso-Pérez, S., 2015. Modulation of Saharan dust export by the North African dipole. Atmos. Chem. Phys. 15, 7471–7486.
Rosenfeld, D., Rudich, Y., Lahav, R., 2001. Desert dust suppressing precipita-tion: a possible desertification feedback loop. Proc. Natl. Acad. Sci. USA 98, 5975–5980.
Rowland, G.H., Ng, H.C., Robinson, L.F., McManus, J.F., Mohamed, K.J., McGee, D., 2017. Investigating the use of 232Th/230Th as a dust proxy using co-located sea-water and sediment samples from the low-latitude North Atlantic. Geochim. Cosmochim. Acta 214, 143–156.
Ruddiman, W.F., 1997. Tropical Atlantic terrigenous fluxes since 25,000 yrs BP. Mar. Geol. 136, 189–207.
Sanchez Goñi, M.F., Harrison, S.P., 2010. Millennial-scale climate variability and veg-etation changes during the Last Glacial: concepts and terminology. Quat. Sci. Rev. 29, 2823–2827.
Serno, S., Winckler, G., Anderson, R.F., Hayes, C.T., McGee, D., Machalett, B., Ren, H., Straub, S.M., Gersonde, R., Haug, G.H., 2014. Eolian dust input to the Subarctic North Pacific. Earth Planet. Sci. Lett. 387, 252–263.
Street, F.A., Grove, A.T., 1976. Environmental and climatic implications of late Qua-ternary lake-level fluctuations in Africa. Nature 261, 385–390.
Stuiver, M., Reimer, P.J., 1993. Extended 14C data base and revised CALIB 3.0 14C age calibration program. Radiocarbon 35, 215–230.
Suman, D.O., Bacon, M.P., 1989. Variations in Holocene sedimentation in the North-American Basin determined from Th-230 measurements. Deep-Sea Res., Part 1, Oceanogr. Res. Pap. 36, 869–878.
Takayanagi, M., Ozima, M., 1987. Temporal variation of 3He/4He ratio recorded in deep-sea sediment cores. J. Geophys. Res. 92, 12531–12538.
Tegen, I., Harrison, S.P., Kohfeld, K., Prentice, I.C., Coe, M., Heimann, M., 2002. Impact of vegetation and preferential source areas on global dust aerosol: results from a model study. J. Geophys. Res. 107, 4576. https://doi.org/10.1029/2001JD000963.
Tierney, J.E., Pausata, F.S.R., deMenocal, P.B., 2017. Rainfall regimes of the Green Sa-hara. Sci. Adv. 3, e1601503.
Tjallingii, R., Claussen, M., Stuut, J.-B.W., Fohlmeister, J., Jahn, A., Bickert, T., Lamy, F., Röhl, U., 2008. Coherent high-and low-latitude control of the northwest African hydrological balance. Nat. Geosci. 1, 670–675.
Weldeab, S., Lea, D.W., Schneider, R.R., Andersen, N., 2007. 155,000 years of West African monsoon and ocean thermal evolution. Science 316, 1303–1307.
Werner, M., Tegen, I., Harrison, S.P., Kohfeld, K.E., Prentice, I.C., Balkanski, Y., Rodhe, H., Roelandt, C., 2002. Seasonal and interannual variability of the mineral dust cycle under present and glacial climate conditions. J. Geophys. Res., Atmos. 107.
Williams, R.H., McGee, D., Kinsley, C.W., Ridley, D.A., Hu, S., Fedorov, A., Tal, I., Mur-ray, R.W., deMenocal, P.B., 2016. Glacial to Holocene changes in trans-Atlantic Saharan dust transport and dust-climate feedbacks. Sci. Adv. 2, e1600445.
Winckler, G., Anderson, R.F., Fleisher, M.Q., McGee, D., Mahowald, N., 2008. Co-variant glacial–interglacial dust fluxes in the Equatorial Pacific and Antarctica. Science 320, 93–96.
Winckler, G., Anderson, R.F., Schlosser, P., 2005. Equatorial Pacific productivity and dust flux during the mid-Pleistocene climate transition. Paleoceanography 20, PA4025.