Earnings Release: Credit Suisse Group reports 1Q14 results · CREDIT SUISSE GROUP AG Paradeplatz 8...
37
CREDIT SUISSE GROUP AG Paradeplatz 8 P.O. Box CH-8070 Zurich Switzerland Telephone +41 844 33 88 44 Fax +41 44 333 88 77 [email protected] Earnings Release Credit Suisse 1Q14 Core pre-tax income of CHF 1,940 million for strategic businesses; reported Core pre-tax income of CHF 1,400 million Return on equity of 14% for strategic businesses; reported return on equity of 8% Strong performance in Private Banking & Wealth Management with increased pre-tax income of CHF 1,012 million; lower expenses and substantial asset inflows with strategic net new assets of CHF 16 billion and total net new assets of CHF 13.7 billion Solid returns in Investment Banking with pre-tax income of CHF 827 million; strong performance in key businesses Improved profitability in Private Banking & Wealth Management: p Total reported pre-tax income of CHF 1,012 million; good profitability in strategic businesses with pre-tax income of CHF 965 million, up 28% compared to 1Q13, and a return on capital of 33% p Significantly increased cost efficiency, with improved cost/income ratio of 68% compared to 72% in 1Q13 p Improved Wealth Management Clients net margin to 29 basis points from 23 basis points in 4Q13 p Strong net new assets from strategic businesses of CHF 16.0 billion and total net new assets of CHF 13.7 billion in Private Banking & Wealth Management, with continued strong inflows in Wealth Management Clients from Asia Pacific and Switzerland, and in Asset Management in alternative investments and index strategies Solid returns in Investment Banking: p Total reported pre-tax income of CHF 827 million amid challenging market conditions p Strategic businesses with pre-tax income of CHF 1,124 million; strategic return on capital of 21% p Strong performance in key businesses including securitized products, credit, underwriting and advisory and solid equities results, offset by significantly reduced first quarter seasonal contribution from rates and certain emerging markets than experienced in previous years Resilient capital base and leverage ratio: p Look-through Basel III CET1 ratio at 10.0% as of the end of 1Q14; Look-through Basel III total capital ratio at 15.1% as of end of 1Q14; strong capital position notwithstanding impact of progress in resolving litigation matters in 4Q13 and external methodology uplifts to risk-weighted assets of CHF 13.5 billion in 1Q14 p Leverage exposure at CHF 1,140 billion as of end of 1Q14; phase-in Swiss leverage ratio of 4.8% as of the end of 1Q14; Look-through Swiss leverage ratio of 3.7% as of end of 1Q14, within reach of the 2019 requirement of 4% Continued progress toward cost reduction targets: p Delivered CHF 3.4 billion of adjusted annualized savings; maintaining momentum towards target of over CHF 4.5 billion by end 2015 On track to achieve targeted run-off of non-strategic units: p Leverage reduction of CHF 11 billion and risk-weighted asset reduction of CHF 4 billion for the non-strategic portfolio, excluding adjustments for methodology changes p Progress in resolving key legacy litigation issues in 2014 to date; continued focus on resolving the US tax matter with the United States Department of Justice
Transcript of Earnings Release: Credit Suisse Group reports 1Q14 results · CREDIT SUISSE GROUP AG Paradeplatz 8...
CREDIT SUISSE GROUP AGParadeplatz 8P.O. BoxCH-8070 ZurichSwitzerland
Telephone +41 844 33 88 44Fax +41 44 333 88 [email protected]
Earnings Release
Credit Suisse 1Q14 Core pre-tax income of CHF 1,940 million for strategic businesses; reported Core pre-tax income of CHF 1,400 million
Return on equity of 14% for strategic businesses; reported return on equity of 8%
Strong performance in Private Banking & Wealth Management with increased pre-tax income of CHF 1,012 million; lower expenses and substantial asset inflows with strategic net new assets of CHF 16 billion and total net new assets of CHF 13.7 billion
Solid returns in Investment Banking with pre-tax income of CHF 827 million; strong performance in key businesses
Improved profitability in Private Banking & Wealth Management:p Totalreportedpre-taxincomeofCHF 1,012million;goodprofitabilityinstrategicbusinesseswithpre-tax
incomeofCHF 965million,up28%comparedto1Q13,andareturnoncapitalof33%p Significantlyincreasedcostefficiency,withimprovedcost/incomeratioof68%comparedto72%in1Q13p ImprovedWealthManagementClientsnetmarginto29basispointsfrom23basispointsin4Q13p StrongnetnewassetsfromstrategicbusinessesofCHF 16.0billionandtotalnetnewassetsofCHF13.7
billioninPrivateBanking&WealthManagement,withcontinuedstronginflowsinWealthManagementClientsfromAsiaPacificandSwitzerland,andinAssetManagementinalternativeinvestmentsandindexstrategies
Solid returns in Investment Banking: p Totalreportedpre-taxincomeofCHF 827millionamidchallengingmarketconditionsp Strategicbusinesseswithpre-taxincomeofCHF 1,124million;strategicreturnoncapitalof21%p Strongperformanceinkeybusinessesincludingsecuritizedproducts,credit,underwritingandadvisoryand
solidequitiesresults,offsetbysignificantlyreducedfirstquarterseasonalcontributionfromratesandcertainemergingmarketsthanexperiencedinpreviousyears
Resilient capital base and leverage ratio:p Look-throughBaselIIICET1ratioat10.0%asoftheendof1Q14;Look-throughBaselIIItotalcapitalratio
at15.1%asofendof1Q14;strongcapitalpositionnotwithstandingimpactofprogressinresolvinglitigationmattersin4Q13andexternalmethodologyupliftstorisk-weightedassetsofCHF 13.5billionin1Q14
p LeverageexposureatCHF 1,140billionasofendof1Q14;phase-inSwissleverageratioof4.8%asoftheendof1Q14;Look-throughSwissleverageratioof3.7%asofendof1Q14,withinreachofthe2019requirementof4%
Continued progress toward cost reduction targets:p DeliveredCHF 3.4billionofadjustedannualizedsavings;maintainingmomentumtowardstargetofover
CHF4.5billionbyend2015
On track to achieve targeted run-off of non-strategic units:p LeveragereductionofCHF 11billionandrisk-weightedassetreductionofCHF 4billionforthenon-strategic
portfolio,excludingadjustmentsformethodologychangesp Progressinresolvingkeylegacylitigationissuesin2014todate;continuedfocusonresolvingtheUStax
matterwiththeUnitedStatesDepartmentofJustice

Earnings ReleaseApril16,2014
Page2
April16,2014Credit Suisse Group reports 1Q14 results.
BradyW.Dougan,ChiefExecutiveOfficer,said:“Forthefirstquarter,weachievedareturnonequityof14%inourstrategicbusinesses,wellwithinreachofour15%through-the-cycletarget.ThisstrongperformancewasdrivenbysignificantlyimprovedprofitabilityinPrivateBanking&WealthManagement,solidreturnsinInvestmentBankingandcontinuedeffectivecostandcapitalmanagement.Wesawcontinuedmomentumwithclientsacrossmanyofourkeybusinesses,includingthehighestnetassetinflowsinourstrategicbusinessessincethefirstquarterof2011andameaningfulincreaseintheshareofassetsundermanagementfromultra-high-net-worthclients.”
CommentingonPrivateBanking&WealthManagement,hesaid:“Wesubstantiallyimprovedtheprofitabilityofourstrategicbusinessesinthequarter,withanincreaseinpre-taxincomeof28%comparedtotheprior-yearquarter.TheWealthManagementClientsbusinessincreaseditsnetmarginto29basispointsfrom23basispointsintheprior-yearquarterandincreasedtheshareofassetsundermanagementfromultra-high-net-worthclientsto46%inthefirstquarterfrom43%ayearago.Corporate&InstitutionalClientscontinuedtomakeastrongcontributiontothedivision’soverallperformance,andAssetManagementmorethandoubleditspre-taxincomecomparedtothefirstquarterof2013asaresultofitsmorefocusedapproach.InPrivateBanking&WealthManagement,werecordednetnewassetsfromstrategicbusinessesofCHF 16.0billioninthequarter.TheseinflowsreflectourstrengthinkeyemergingmarketswithinAsiaPacific,whichgrewata17%annualizedrate,LatinAmericaandtheMiddleEast,ourstrongpositioninourSwisshomemarketaswellassignificantinflowsinalternativeinvestmentsandindexstrategieswithinourAssetManagementbusiness.”
CommentingonInvestmentBanking,hesaid:“OurInvestmentBankingresultsdemonstratethestrengthofourdiversifiedfranchise,withourstrategicbusinessesreportingareturnoncapitalof21%.Wesawstrongperformanceinsecuritizedproducts,creditandunderwritingandadvisory,aswellassolidresultsinequities.Atthesametime,thefirstquarterseasonalcontributionfromourratesandcertainemergingmarketsbusinesseswassignificantlylowercomparedtoprioryears.Wefurtherexpandedourstrongmarketsharepositioninequitiesandsawgoodmomentumwithclientsinourunderwritingandadvisoryfranchises.”
Commentingonstrategicprogress,headded:“Wecontinuedtooptimizeresourceallocationtogrowourhigh-returningbusinesses,particularlyinPrivateBanking&WealthManagement,andmadeprogressinwindingdownpositionsinournon-strategicunits.Atthesametime,wemaintainedresilientleverageandcapitalpositionsandremainontracktomeetourlong-termtargets,notwithstandingmethodologychangeswhichincreasedrisk-weightedassetsinthequarter.Wealsomadegoodprogresstowardresolvinglegacylitigationmattersandonincreasingtheefficiencyofouroperations.Givenallofthesepositivedevelopmentsandprogressinourstrategyexecution,ourintentionremainstodelivercashreturnstoourshareholdersatorabove2013levels.”
Earnings ReleaseApril 16, 2014
Page 3
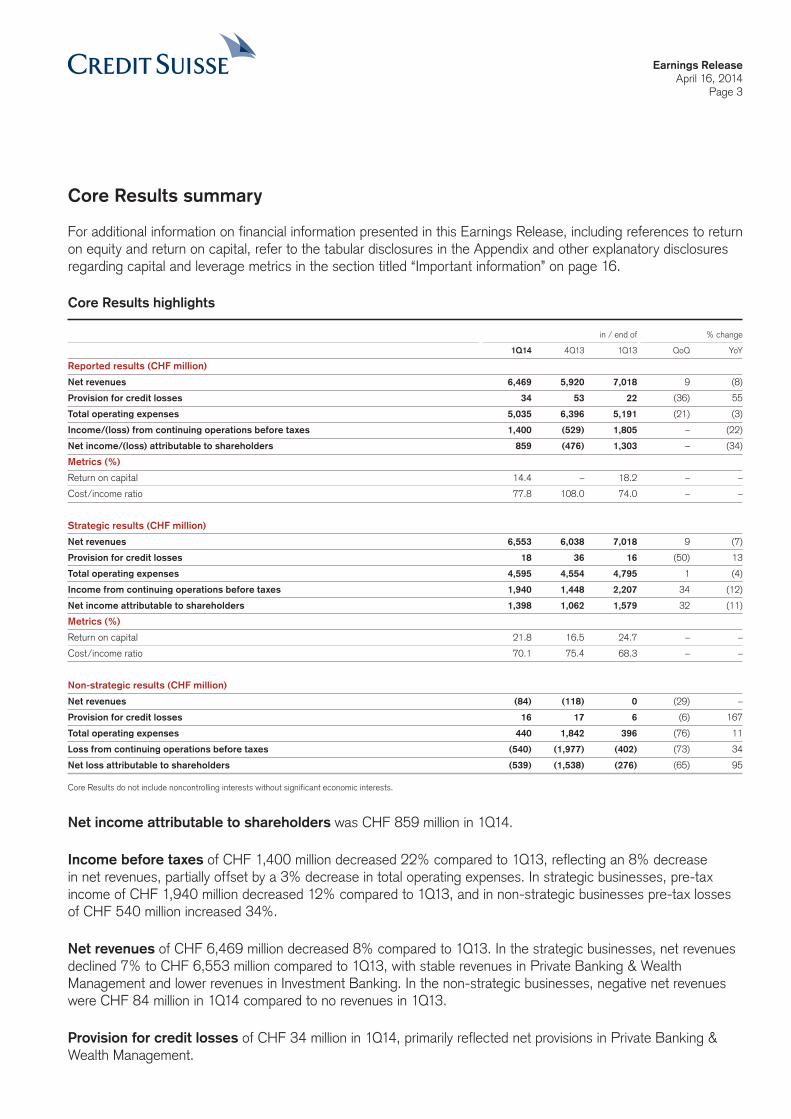
Core Results summary
For additional information on financial information presented in this Earnings Release, including references to return on equity and return on capital, refer to the tabular disclosures in the Appendix and other explanatory disclosures regarding capital and leverage metrics in the section titled “Important information” on page 16.
Core Results highlights
in / end of % change
1Q14 4Q13 1Q13 QoQ YoY
Reported results (CHF million)
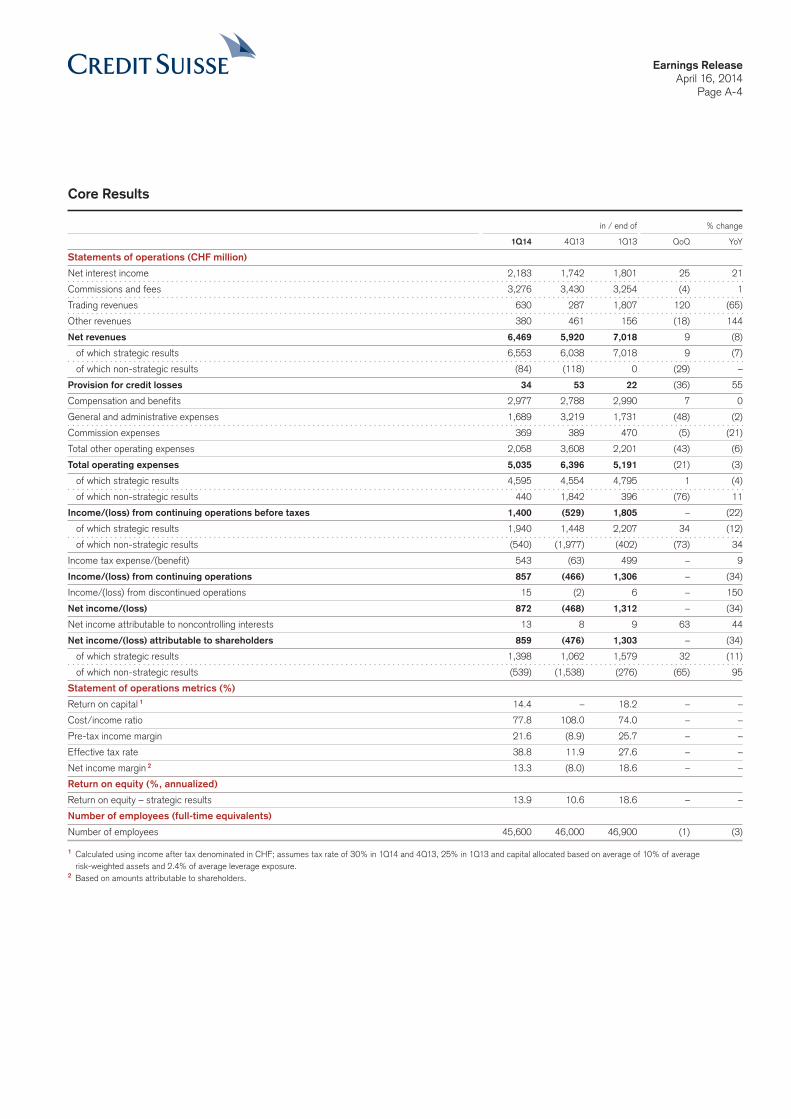
Net revenues 6,469 5,920 7,018 9 (8)
Provision for credit losses 34 53 22 (36) 55
Total operating expenses 5,035 6,396 5,191 (21) (3)
Income/(loss) from continuing operations before taxes 1,400 (529) 1,805 – (22)
Net income/(loss) attributable to shareholders 859 (476) 1,303 – (34)
Metrics (%)
Return on capital 14.4 – 18.2 – –
Cost/income ratio 77.8 108.0 74.0 – –
Strategic results (CHF million)
Net revenues 6,553 6,038 7,018 9 (7)
Provision for credit losses 18 36 16 (50) 13
Total operating expenses 4,595 4,554 4,795 1 (4)
Income from continuing operations before taxes 1,940 1,448 2,207 34 (12)
Net income attributable to shareholders 1,398 1,062 1,579 32 (11)
Metrics (%)
Return on capital 21.8 16.5 24.7 – –
Cost/income ratio 70.1 75.4 68.3 – –
Non-strategic results (CHF million)
Net revenues (84) (118) 0 (29) –
Provision for credit losses 16 17 6 (6) 167
Total operating expenses 440 1,842 396 (76) 11
Loss from continuing operations before taxes (540) (1,977) (402) (73) 34
Net loss attributable to shareholders (539) (1,538) (276) (65) 95
Core Results do not include noncontrolling interests without significant economic interests.
Net income attributable to shareholders was CHF 859 million in 1Q14.
Income before taxes of CHF 1,400 million decreased 22% compared to 1Q13, reflecting an 8% decrease in net revenues, partially offset by a 3% decrease in total operating expenses. In strategic businesses, pre-tax income of CHF 1,940 million decreased 12% compared to 1Q13, and in non-strategic businesses pre-tax losses of CHF 540 million increased 34%.
Net revenues of CHF 6,469 million decreased 8% compared to 1Q13. In the strategic businesses, net revenues declined 7% to CHF 6,553 million compared to 1Q13, with stable revenues in Private Banking & Wealth Management and lower revenues in Investment Banking. In the non-strategic businesses, negative net revenues were CHF 84 million in 1Q14 compared to no revenues in 1Q13.
Provision for credit losses of CHF 34 million in 1Q14, primarily reflected net provisions in Private Banking & Wealth Management.

Earnings ReleaseApril 16, 2014
Page 4
Total operating expenses of CHF 5,035 million were down 3% compared to 1Q13, primarily reflecting lower commission expenses and 2% lower general and administrative expenses. In strategic businesses, total operating expenses of CHF 4,595 million decreased 4% compared to 1Q13, mainly reflecting a 7% decline in general and administrative expenses. In non-strategic businesses total operating expenses of CHF 440 million increased 11% compared to 1Q13, primarily reflecting a 32% increase in general and administrative expenses. In 1Q14, Credit Suisse recorded net litigation provisions of CHF 107 million. Business realignment costs recognized in the Corporate Center in 1Q14 were CHF 62 million.
Income tax expense of CHF 543 million recorded in 1Q14 reflected the impact of the geographical mix of results and the impact of a New York state tax law change of CHF 151 million. Overall, net deferred tax assets decreased CHF 535 million to CHF 5,256 million as of the end of 1Q14 compared to 4Q13. Deferred tax assets on net operating losses increased CHF 56 million to CHF 1,436 million during 1Q14. The Core Results effective tax rate was 38.8% in 1Q14, compared to 11.9% in 4Q13. Excluding the impact of the New York state tax law change, the Core Results effective tax rate for 1Q14 was 28.0%.
Diluted earnings per share from continuing operations were CHF 0.47 for 1Q14 compared to CHF 0.75 in 1Q13 and compared to a loss per share of CHF 0.37 in 4Q13. As of the end of 1Q14, Credit Suisse had 1,596.1 million shares issued, unchanged from the end of 4Q13.
Capital and leverage. As of the end of 1Q14, Credit Suisse reported a Look-through Basel III common equity tier 1 (CET1) ratio of 10.0%, unchanged compared to the end of 4Q13. As of the end of 1Q14, the Look-through Basel III total capital ratio was 15.1%, unchanged from the end of 4Q13.
The Basel III CET1 ratio as of the end of 1Q14 was 14.3%, compared to 15.7% as of the end of 4Q13, reflecting a decrease in CET1 capital and an increase in risk-weighted assets. Basel III risk-weighted assets for the Group increased 4%, from CHF 273.8 billion as of the end of 4Q13 to CHF 286.0 billion as of the end of 1Q14, reflecting increases from methodology and policy changes partially offset by business reductions.
As of the end of 1Q14, Credit Suisse’s leverage exposure amounted to CHF 1,140 billion, compared to an updated long-term target of approximately CHF 1,000 billion. The Look-through Swiss leverage ratio was 3.7% as of the end of 1Q14, compared to the 4% requirement for 2019.
Benefits of the integrated bank. In 1Q14, Credit Suisse generated CHF 1.0 billion of collaboration revenues from the integrated bank. This corresponds to 15.9% of Core net revenues in 1Q14.
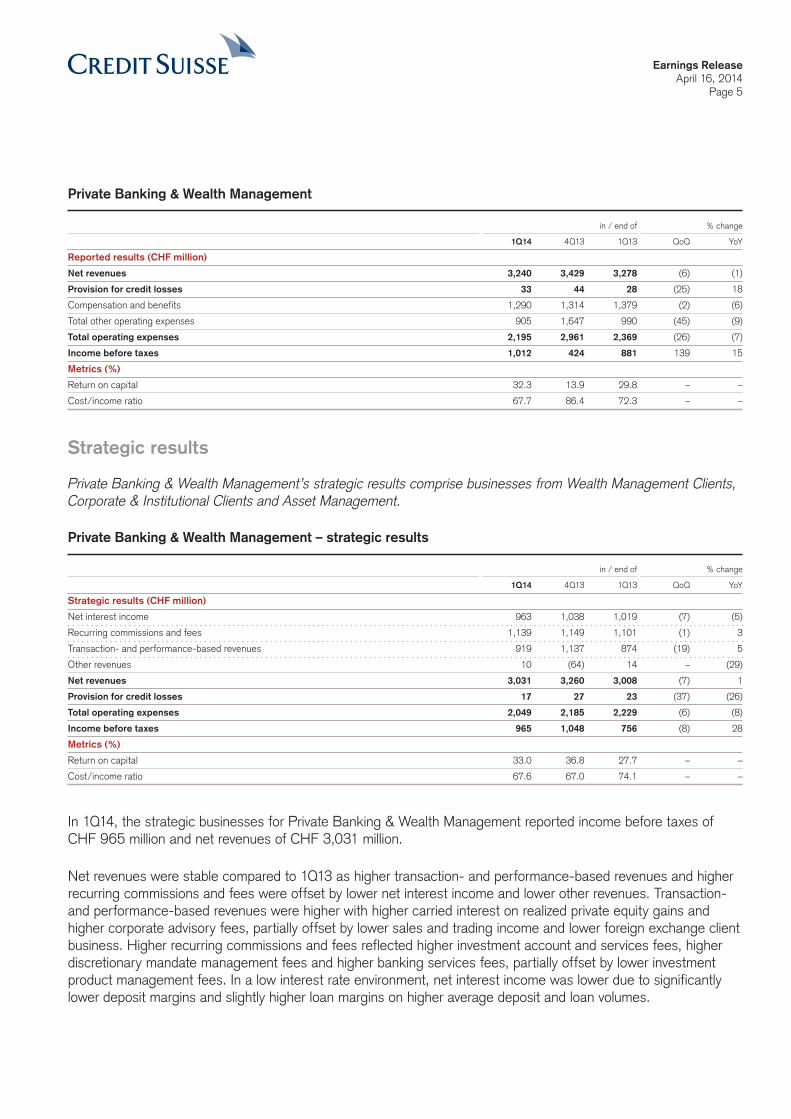
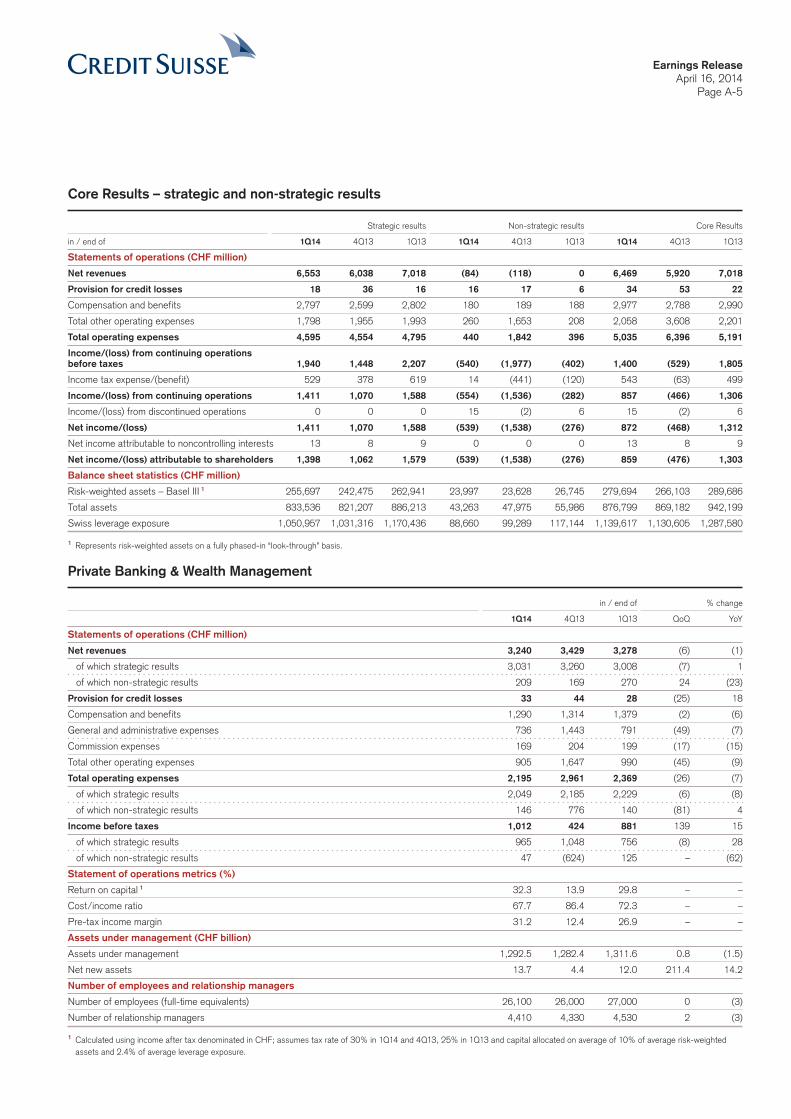
Private Banking & Wealth Management
In 1Q14, Private Banking & Wealth Management reported income before taxes of CHF 1,012 million and net revenues of CHF 3,240 million. In its strategic businesses, Private Banking & Wealth Management reported income before taxes of CHF 965 million and net revenues of CHF 3,031 million. Net revenues were lower compared to 4Q13 mainly due to seasonally higher fourth-quarter transaction- and performance-based revenues and lower net interest income. Compared to 1Q13, income before taxes increased 28%, driven by lower operating expenses. In its non-strategic businesses, Private Banking & Wealth Management reported income before taxes of CHF 47 million, while in 4Q13, it reported losses before taxes of CHF 624 million, reflecting substantial litigation provisions in connection with the US tax matter. In 1Q14, assets under management for the division were CHF 1,292.5 billion and the division attracted net new assets of CHF 13.7 billion.
Earnings ReleaseApril 16, 2014
Page 5
Private Banking & Wealth Management
in / end of % change
1Q14 4Q13 1Q13 QoQ YoY
Reported results (CHF million)
Net revenues 3,240 3,429 3,278 (6) (1)
Provision for credit losses 33 44 28 (25) 18
Compensation and benefits 1,290 1,314 1,379 (2) (6)
Total other operating expenses 905 1,647 990 (45) (9)
Total operating expenses 2,195 2,961 2,369 (26) (7)
Income before taxes 1,012 424 881 139 15
Metrics (%)
Return on capital 32.3 13.9 29.8 – –
Cost/income ratio 67.7 86.4 72.3 – –
Strategic results
Private Banking & Wealth Management’s strategic results comprise businesses from Wealth Management Clients, Corporate & Institutional Clients and Asset Management.
Private Banking & Wealth Management – strategic results
in / end of % change
1Q14 4Q13 1Q13 QoQ YoY
Strategic results (CHF million)
Net interest income 963 1,038 1,019 (7) (5)
Recurring commissions and fees 1,139 1,149 1,101 (1) 3
Transaction- and performance-based revenues 919 1,137 874 (19) 5
Other revenues 10 (64) 14 – (29)
Net revenues 3,031 3,260 3,008 (7) 1
Provision for credit losses 17 27 23 (37) (26)
Total operating expenses 2,049 2,185 2,229 (6) (8)
Income before taxes 965 1,048 756 (8) 28
Metrics (%)
Return on capital 33.0 36.8 27.7 – –
Cost/income ratio 67.6 67.0 74.1 – –
In 1Q14, the strategic businesses for Private Banking & Wealth Management reported income before taxes of CHF 965 million and net revenues of CHF 3,031 million.
Net revenues were stable compared to 1Q13 as higher transaction- and performance-based revenues and higher recurring commissions and fees were offset by lower net interest income and lower other revenues. Transaction- and performance-based revenues were higher with higher carried interest on realized private equity gains and higher corporate advisory fees, partially offset by lower sales and trading income and lower foreign exchange client business. Higher recurring commissions and fees reflected higher investment account and services fees, higher discretionary mandate management fees and higher banking services fees, partially offset by lower investment product management fees. In a low interest rate environment, net interest income was lower due to significantly lower deposit margins and slightly higher loan margins on higher average deposit and loan volumes.
Earnings ReleaseApril 16, 2014
Page 6
Compared to 4Q13, net revenues were 7% lower, reflecting significantly lower transaction- and performance-based revenues and lower net interest income, partially offset by higher other revenues. Significantly lower transaction- and performance-based revenues reflected seasonally higher performance fees in Asset Management in 4Q13, partially offset by higher brokerage and product issuing fees and higher sales and trading income in 1Q14. Lower net interest income reflected lower deposit margins on stable average deposit volumes and slightly higher loan margins on slightly higher loan volumes. Higher other revenues mainly reflected an impairment related to Asset Management Finance LLC (AMF) in 4Q13. Stable recurring commissions and fees mainly reflected lower asset management fees and lower investment product management fees, offset by higher banking services fees and higher discretionary mandate management fees.
Provision for credit losses was CHF 17 million.
Total operating expenses were lower compared to both 1Q13 and 4Q13. Compared to 1Q13, compensation and benefits decreased 6%, mainly reflecting lower salary expenses, mostly as a result of the lower headcount, and general and administrative expenses decreased 10%, primarily reflecting lower expense provisions and lower occupancy fees. Compared to 4Q13, compensation and benefits were stable as slightly lower discretionary performance-related compensation and lower salary expenses were offset by slightly higher deferred compen-sation. General and administrative expenses decreased 12%, primarily reflecting lower professional fees, lower expense provisions and lower advertising and marketing costs.
The cost/income ratio for strategic results was 68% in 1Q14, down seven percentage points compared to 1Q13 and up one percentage point compared to 4Q13.
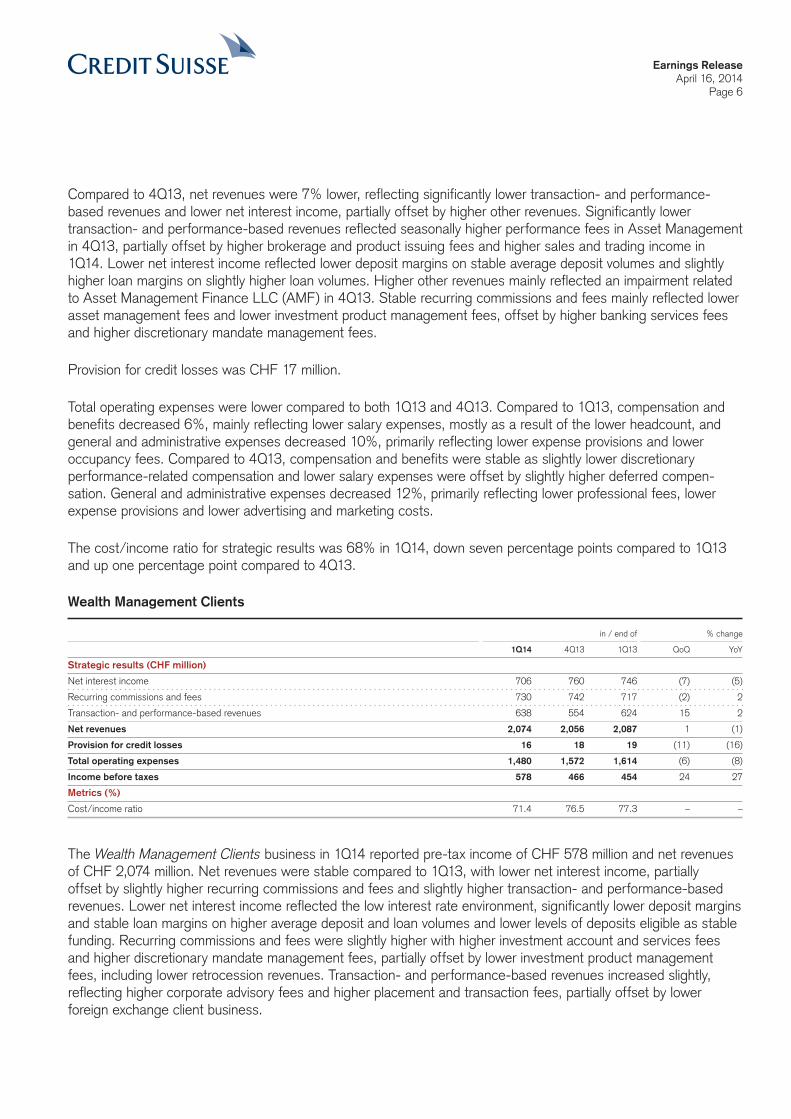
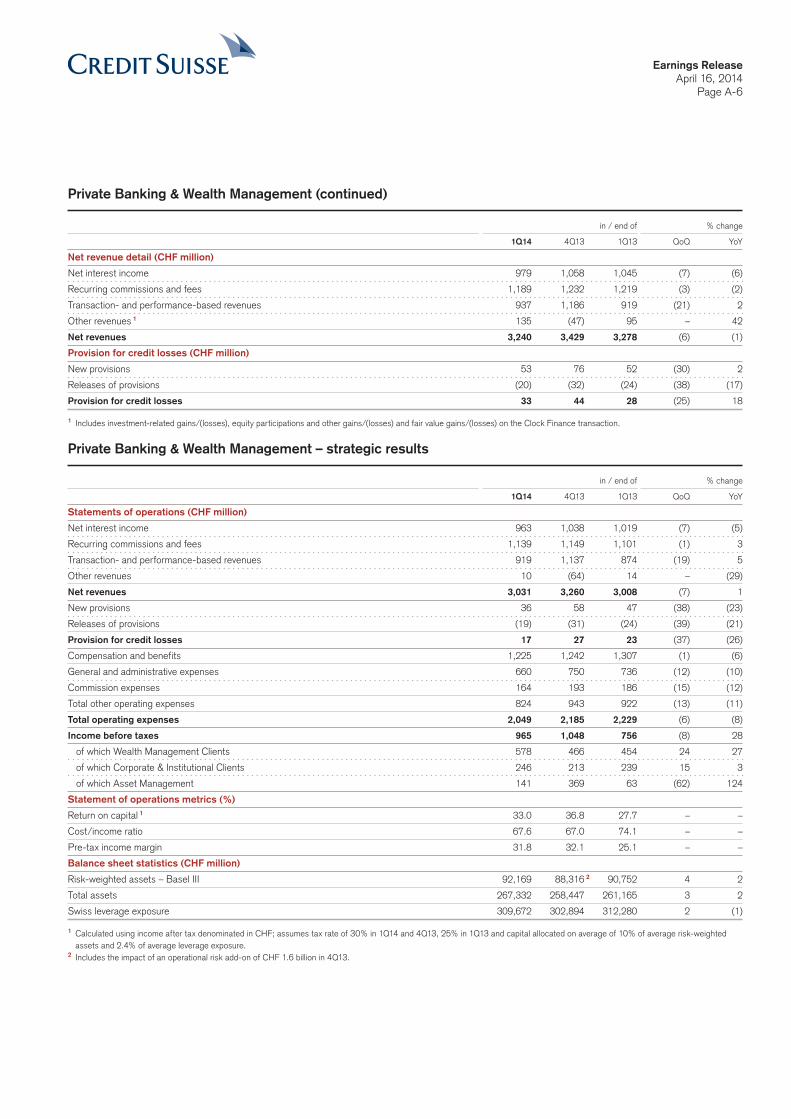
Wealth Management Clients
in / end of % change
1Q14 4Q13 1Q13 QoQ YoY
Strategic results (CHF million)
Net interest income 706 760 746 (7) (5)
Recurring commissions and fees 730 742 717 (2) 2
Transaction- and performance-based revenues 638 554 624 15 2
Net revenues 2,074 2,056 2,087 1 (1)
Provision for credit losses 16 18 19 (11) (16)
Total operating expenses 1,480 1,572 1,614 (6) (8)
Income before taxes 578 466 454 24 27
Metrics (%)
Cost/income ratio 71.4 76.5 77.3 – –
The Wealth Management Clients business in 1Q14 reported pre-tax income of CHF 578 million and net revenues of CHF 2,074 million. Net revenues were stable compared to 1Q13, with lower net interest income, partially offset by slightly higher recurring commissions and fees and slightly higher transaction- and performance-based revenues. Lower net interest income reflected the low interest rate environment, significantly lower deposit margins and stable loan margins on higher average deposit and loan volumes and lower levels of deposits eligible as stable funding. Recurring commissions and fees were slightly higher with higher investment account and services fees and higher discretionary mandate management fees, partially offset by lower investment product management fees, including lower retrocession revenues. Transaction- and performance-based revenues increased slightly, reflecting higher corporate advisory fees and higher placement and transaction fees, partially offset by lower foreign exchange client business.

Earnings ReleaseApril 16, 2014
Page 7
Compared to 4Q13, net revenues were stable, with a 15% increase in transaction- and performance-based revenues offset by a 7% decline in net interest income and a slight decrease in recurring commissions and fees. The increase in transaction- and performance-based revenues was driven by higher brokerage and product issuing fees and higher sales and trading revenues, partially offset by lower performance fees. Lower net interest income reflected lower deposit margins and slightly higher loan margins on stable average deposit and loan volumes. Recurring commissions and fees were slightly lower with lower investment product management fees, partially offset by higher discretionary mandate management fees.
In 1Q14, the gross margin was 104 basis points, three basis points lower compared to 1Q13, mainly reflecting a continued adverse interest rate environment. Compared to 4Q13, the gross margin was stable, with higher transaction- and performance-based revenues offset by lower net interest income.
Wealth Management Clients net margin was 29 basis points in 1Q14, six basis points higher compared to 1Q13 and six basis points higher compared to 4Q13, reflecting a lower expense base.
Corporate & Institutional Clients
in / end of % change
1Q14 4Q13 1Q13 QoQ YoY
Strategic results (CHF million)
Net interest income 257 278 273 (8) (6)
Recurring commissions and fees 122 108 111 13 10
Transaction- and performance-based revenues 117 102 121 15 (3)
Other revenues (4) (3) (5) 33 (20)
Net revenues 492 485 500 1 (2)
Provision for credit losses 1 9 4 (89) (75)
Total operating expenses 245 263 257 (7) (5)
Income before taxes 246 213 239 15 3
Metrics (%)
Cost/income ratio 49.8 54.2 51.4 – –
The Corporate & Institutional Clients business reported pre-tax income of CHF 246 million in 1Q14 and net revenues of CHF 492 million. Net revenues were slightly lower compared to 1Q13, mainly driven by lower net interest income as a result of the low interest rate environment, and slightly lower transaction- and performance-based revenues, partially offset by a 10% increase in recurring commissions and fees. The increase in recurring commissions and fees primarily reflected higher banking services fees.
Compared to 4Q13, net revenues were stable, with higher transaction- and performance-based revenues and higher recurring commissions and fees offset by an 8% decline in net interest income. Higher transaction- and performance-based revenues reflected higher sales and trading revenues, higher brokerage and product issuing fees and higher corporate advisory fees. The increase in recurring commissions and fees primarily reflected higher banking services fees, partially offset by lower investment account and services fees.

Earnings ReleaseApril 16, 2014
Page 8
Asset Management
in / end of % change
1Q14 4Q13 1Q13 QoQ YoY
Strategic results (CHF million)
Recurring commissions and fees 287 299 273 (4) 5
Transaction- and performance-based revenues 164 481 129 (66) 27
Other revenues 14 (61) 19 – (26)
Net revenues 465 719 421 (35) 10
of which fee-based revenues 438 769 387 (43) 13
Provision for credit losses 0 0 0 – –
Total operating expenses 324 350 358 (7) (9)
Income before taxes 141 369 63 (62) 124
Metrics (%)
Cost/income ratio 69.7 48.7 85.0 – –
The Asset Management business reported pre-tax income of CHF 141 million in 1Q14, with net revenues of CHF 465 million. Net revenues increased 10% compared to 1Q13, with fee-based revenues increasing 13%, reflecting higher carried interest on realized private equity gains and higher asset management fees. Net revenues declined 35% compared to 4Q13, with lower fee-based revenues from seasonally lower performance fees and private equity placement fees, partially offset by an impairment of CHF 68 million relating to AMF in 4Q13.
The fee-based margin was 49 basis points in 1Q14, compared to 46 basis points in 1Q13 and 87 basis points in 4Q13, primarily reflecting the movements in fee-based revenues. Average assets under management increased 6.2% and 1.3% compared to 1Q13 and 4Q13, respectively.
Non-strategic results
The non-strategic results for Private Banking & Wealth Management include positions relating to the restructuring of the former Asset Management division, run-off operations relating to the small markets exit initiative and certain legacy cross-border related run-off operations, litigation costs, primarily related to the US tax matter, the impact of restructuring of the German onshore operations, other smaller non-strategic positions formerly in the Corporate & Institutional Clients business and the run-off and active reduction of selected products.
Private Banking & Wealth Management – non-strategic results
in / end of % change
1Q14 4Q13 1Q13 QoQ YoY
Non-strategic results (CHF million)
Net revenues 209 169 270 24 (23)
Provision for credit losses 16 17 5 (6) 220
Total operating expenses 146 776 140 (81) 4
Income/(loss) before taxes 47 (624) 125 – (62)
Metrics (%)
Cost/income ratio 69.9 459.2 51.9 – –
In 1Q14, the non-strategic businesses reported income before taxes of CHF 47 million, including an equity partici-pation gain of CHF 91 million from the sale in January 2014 of Customized Fund Investment Group, the division’s private equity fund of funds and co-investment business. In 4Q13, Private Banking & Wealth Management’s

Earnings ReleaseApril 16, 2014
Page 9
non-strategic businesses reported a loss before taxes of CHF 624 million, reflecting litigation provisions of CHF 600 million in connection with the US tax matter, including CHF 175 million in connection with the settlement with the SEC in February 2014.
Assets under management – Private Banking & Wealth Management
Assets under management of CHF 1,292.5 billion increased CHF 10.1 billion compared to the end of 4Q13, as net new assets and positive market movements were partially offset by structural effects mostly arising from disposals of businesses in the non-strategic unit, and adverse foreign exchange-related movements.
Net new assets: Private Banking & Wealth Management recorded net new assets of CHF 13.7 billion in 1Q14. In the strategic portfolio, Wealth Management Clients contributed net new assets of CHF 10.6 billion in 1Q14 with continued strong inflows from emerging markets, particularly in Asia Pacific, partially offset by Western European cross-border outflows. Asset Management reported net new assets of CHF 6.9 billion in 1Q14, driven by inflows in credit products and traditional products, with substantial contribution from index strategies, partially offset by net asset outflows in fixed income products. Corporate & Institutional Clients in Switzerland reported net new assets of CHF 0.4 billion in 1Q14. In the non-strategic portfolio, net asset outflows of CHF 2.3 billion reflected the exit of certain businesses, of which CHF 1.0 billion were classified as discontinued operations.
Assets under management – Private Banking & Wealth Management
in / end of % change
1Q14 4Q13 1Q13 QoQ YoY
Assets under management by business (CHF billion)
Wealth Management Clients 804.9 790.7 794.4 1.8 1.3
Corporate & Institutional Clients 254.4 250.0 238.7 1.8 6.6
Asset Management 363.4 352.3 347.0 3.2 4.7
Non-strategic 25.9 44.4 85.4 (41.7) (69.7)
Assets managed across businesses (156.1) (155.0) (153.9) 0.7 1.4
Assets under management 1,292.5 1,282.4 1,311.6 0.8 (1.5)
Average assets under management (CHF billion)
Average assets under management 1,282.1 1,284.6 1,285.4 (0.2) (0.3)
Net new assets by business (CHF billion)
Wealth Management Clients 10.6 1.7 5.7 – 86.0
Corporate & Institutional Clients 0.4 4.0 4.5 (90.0) (91.1)
Asset Management 6.9 (0.5) 8.5 – (18.8)
Non-strategic (2.3) (1.0) (2.3) 130.0 0.0
Assets managed across businesses (1.9) 0.2 (4.4) – (56.8)
Net new assets 13.7 4.4 12.0 211.4 14.2
Net new asset growth rate (%)
Net new asset growth rate – Wealth Management Clients 5.4 0.9 3.0 – –
Net new asset growth rate – Asset Management 7.8 (0.6) 10.5 – –
Earnings ReleaseApril 16, 2014
Page 10
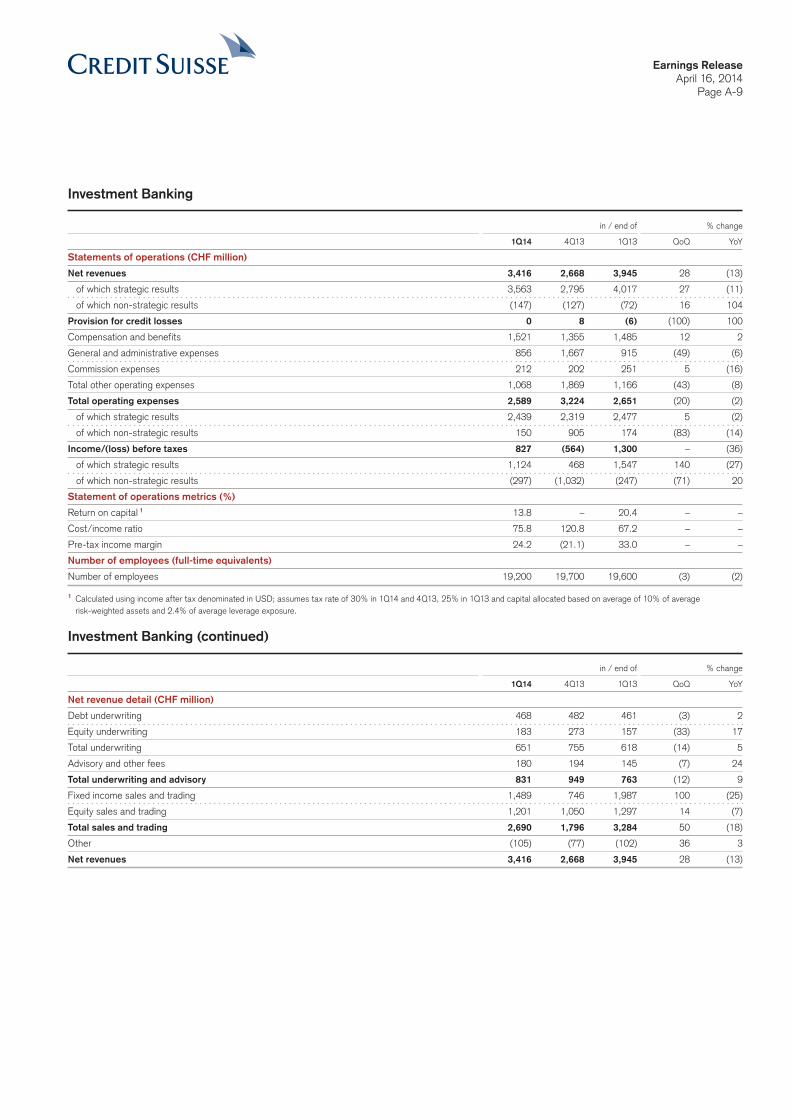
Investment Banking
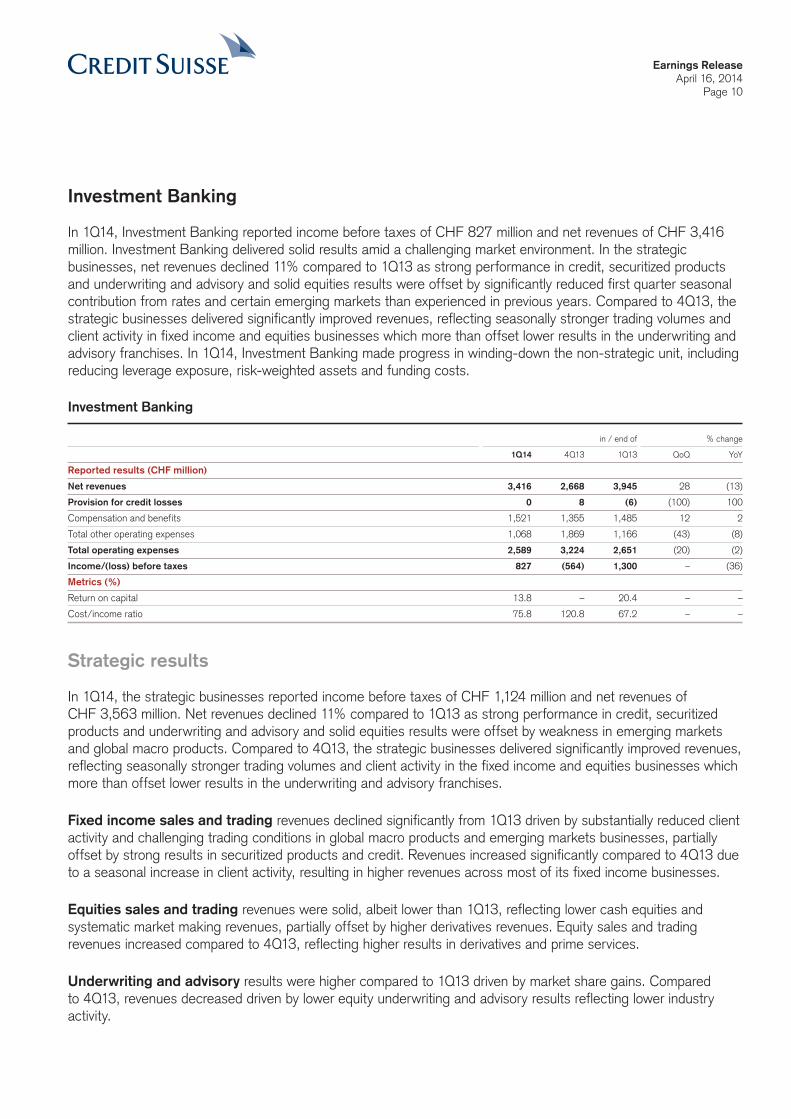
In 1Q14, Investment Banking reported income before taxes of CHF 827 million and net revenues of CHF 3,416 million. Investment Banking delivered solid results amid a challenging market environment. In the strategic businesses, net revenues declined 11% compared to 1Q13 as strong performance in credit, securitized products and underwriting and advisory and solid equities results were offset by significantly reduced first quarter seasonal contribution from rates and certain emerging markets than experienced in previous years. Compared to 4Q13, the strategic businesses delivered significantly improved revenues, reflecting seasonally stronger trading volumes and client activity in fixed income and equities businesses which more than offset lower results in the underwriting and advisory franchises. In 1Q14, Investment Banking made progress in winding-down the non-strategic unit, including reducing leverage exposure, risk-weighted assets and funding costs.
Investment Banking
in / end of % change
1Q14 4Q13 1Q13 QoQ YoY
Reported results (CHF million)
Net revenues 3,416 2,668 3,945 28 (13)
Provision for credit losses 0 8 (6) (100) 100
Compensation and benefits 1,521 1,355 1,485 12 2
Total other operating expenses 1,068 1,869 1,166 (43) (8)
Total operating expenses 2,589 3,224 2,651 (20) (2)
Income/(loss) before taxes 827 (564) 1,300 – (36)
Metrics (%)
Return on capital 13.8 – 20.4 – –
Cost/income ratio 75.8 120.8 67.2 – –
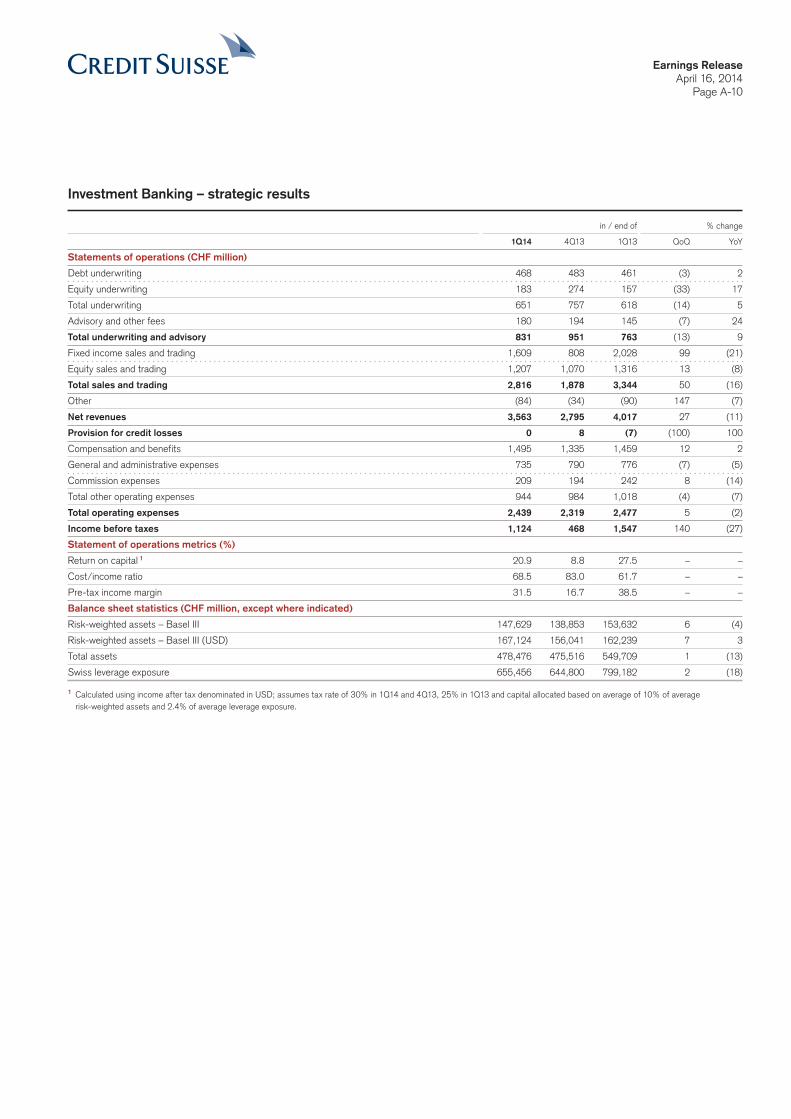
Strategic results
In 1Q14, the strategic businesses reported income before taxes of CHF 1,124 million and net revenues of CHF 3,563 million. Net revenues declined 11% compared to 1Q13 as strong performance in credit, securitized products and underwriting and advisory and solid equities results were offset by weakness in emerging markets and global macro products. Compared to 4Q13, the strategic businesses delivered significantly improved revenues, reflecting seasonally stronger trading volumes and client activity in the fixed income and equities businesses which more than offset lower results in the underwriting and advisory franchises.
Fixed income sales and trading revenues declined significantly from 1Q13 driven by substantially reduced client activity and challenging trading conditions in global macro products and emerging markets businesses, partially offset by strong results in securitized products and credit. Revenues increased significantly compared to 4Q13 due to a seasonal increase in client activity, resulting in higher revenues across most of its fixed income businesses.
Equities sales and trading revenues were solid, albeit lower than 1Q13, reflecting lower cash equities and systematic market making revenues, partially offset by higher derivatives revenues. Equity sales and trading revenues increased compared to 4Q13, reflecting higher results in derivatives and prime services.
Underwriting and advisory results were higher compared to 1Q13 driven by market share gains. Compared to 4Q13, revenues decreased driven by lower equity underwriting and advisory results reflecting lower industry activity.
Earnings ReleaseApril 16, 2014
Page 11
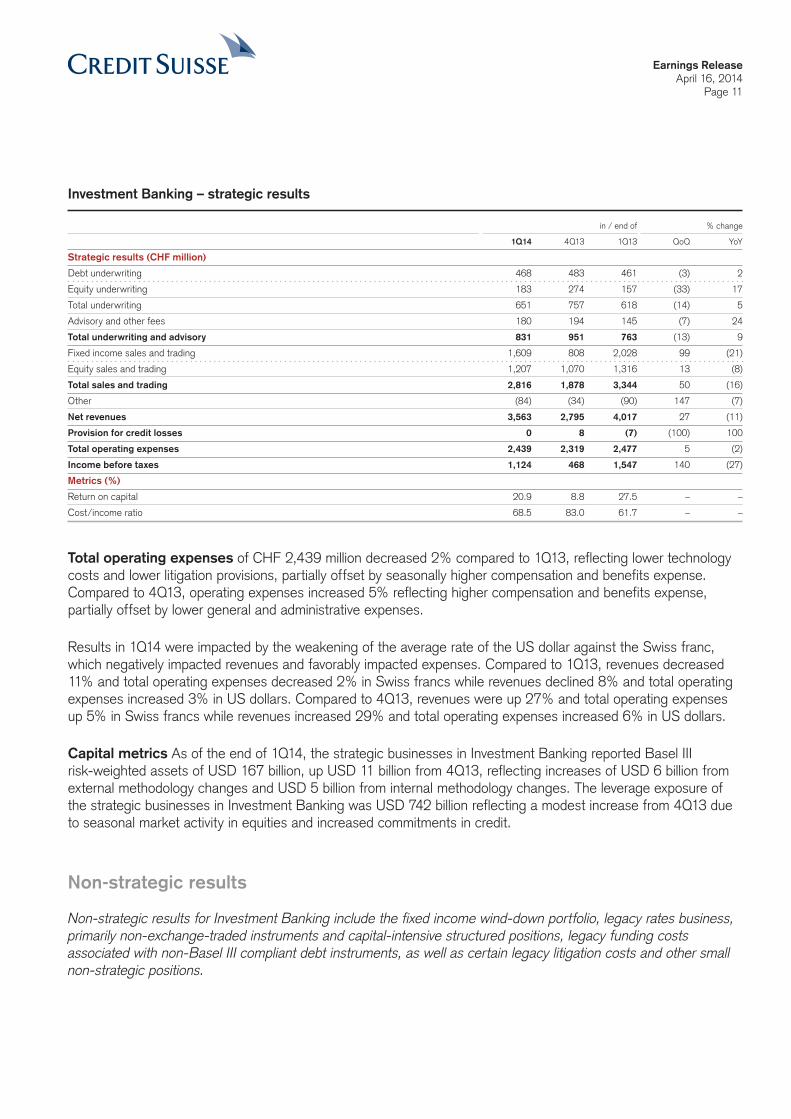
Investment Banking – strategic results
in / end of % change
1Q14 4Q13 1Q13 QoQ YoY
Strategic results (CHF million)
Debt underwriting 468 483 461 (3) 2
Equity underwriting 183 274 157 (33) 17
Total underwriting 651 757 618 (14) 5
Advisory and other fees 180 194 145 (7) 24
Total underwriting and advisory 831 951 763 (13) 9
Fixed income sales and trading 1,609 808 2,028 99 (21)
Equity sales and trading 1,207 1,070 1,316 13 (8)
Total sales and trading 2,816 1,878 3,344 50 (16)
Other (84) (34) (90) 147 (7)
Net revenues 3,563 2,795 4,017 27 (11)
Provision for credit losses 0 8 (7) (100) 100
Total operating expenses 2,439 2,319 2,477 5 (2)
Income before taxes 1,124 468 1,547 140 (27)
Metrics (%)
Return on capital 20.9 8.8 27.5 – –
Cost/income ratio 68.5 83.0 61.7 – –
Total operating expenses of CHF 2,439 million decreased 2% compared to 1Q13, reflecting lower technology costs and lower litigation provisions, partially offset by seasonally higher compensation and benefits expense. Compared to 4Q13, operating expenses increased 5% reflecting higher compensation and benefits expense, partially offset by lower general and administrative expenses.
Results in 1Q14 were impacted by the weakening of the average rate of the US dollar against the Swiss franc, which negatively impacted revenues and favorably impacted expenses. Compared to 1Q13, revenues decreased 11% and total operating expenses decreased 2% in Swiss francs while revenues declined 8% and total operating expenses increased 3% in US dollars. Compared to 4Q13, revenues were up 27% and total operating expenses up 5% in Swiss francs while revenues increased 29% and total operating expenses increased 6% in US dollars.
Capital metrics As of the end of 1Q14, the strategic businesses in Investment Banking reported Basel III risk-weighted assets of USD 167 billion, up USD 11 billion from 4Q13, reflecting increases of USD 6 billion from external methodology changes and USD 5 billion from internal methodology changes. The leverage exposure of the strategic businesses in Investment Banking was USD 742 billion reflecting a modest increase from 4Q13 due to seasonal market activity in equities and increased commitments in credit.
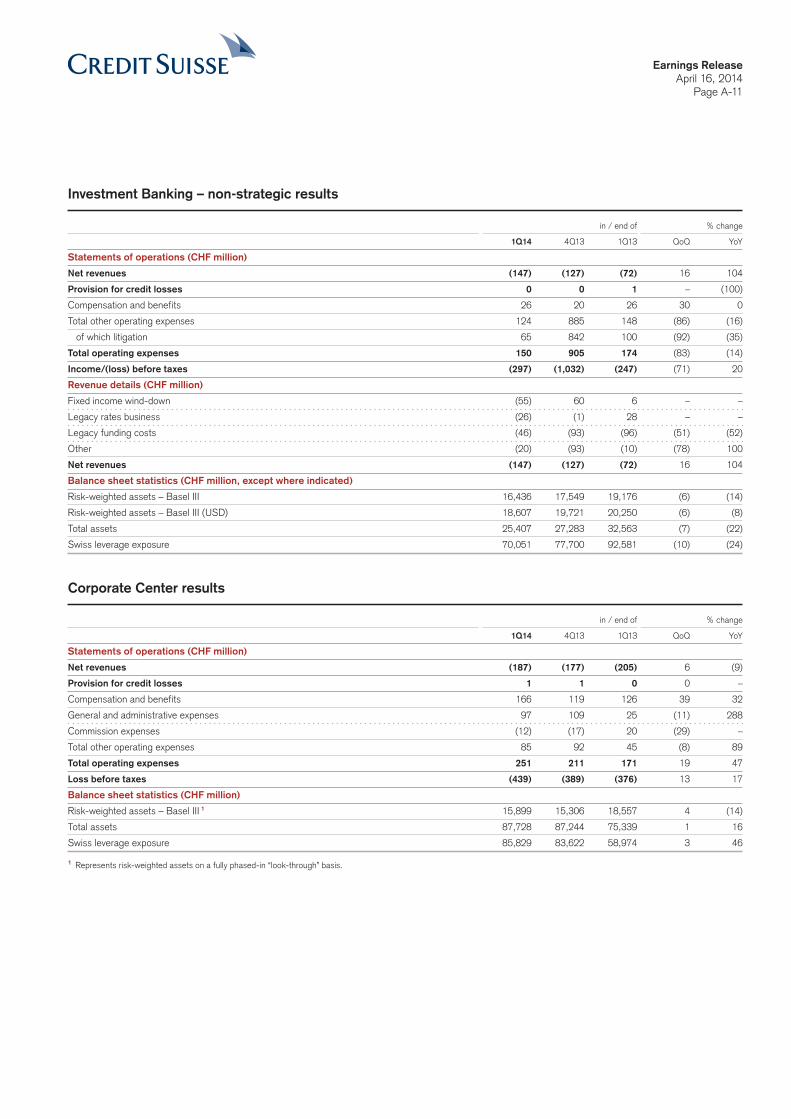
Non-strategic results
Non-strategic results for Investment Banking include the fixed income wind-down portfolio, legacy rates business, primarily non-exchange-traded instruments and capital-intensive structured positions, legacy funding costs associated with non-Basel III compliant debt instruments, as well as certain legacy litigation costs and other small non-strategic positions.
Earnings ReleaseApril 16, 2014
Page 12
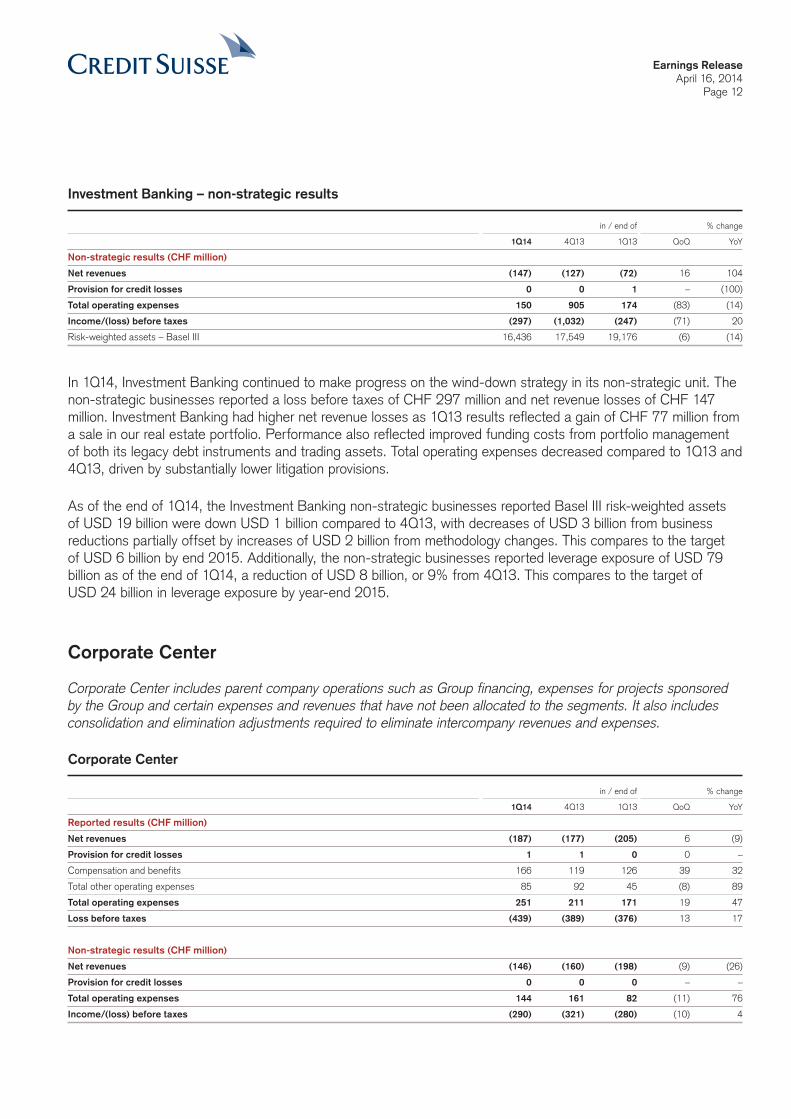
Investment Banking – non-strategic results
in / end of % change
1Q14 4Q13 1Q13 QoQ YoY
Non-strategic results (CHF million)
Net revenues (147) (127) (72) 16 104
Provision for credit losses 0 0 1 – (100)
Total operating expenses 150 905 174 (83) (14)
Income/(loss) before taxes (297) (1,032) (247) (71) 20
Risk-weighted assets – Basel III 16,436 17,549 19,176 (6) (14)
In 1Q14, Investment Banking continued to make progress on the wind-down strategy in its non-strategic unit. The non-strategic businesses reported a loss before taxes of CHF 297 million and net revenue losses of CHF 147 million. Investment Banking had higher net revenue losses as 1Q13 results reflected a gain of CHF 77 million from a sale in our real estate portfolio. Performance also reflected improved funding costs from portfolio management of both its legacy debt instruments and trading assets. Total operating expenses decreased compared to 1Q13 and 4Q13, driven by substantially lower litigation provisions.
As of the end of 1Q14, the Investment Banking non-strategic businesses reported Basel III risk-weighted assets of USD 19 billion were down USD 1 billion compared to 4Q13, with decreases of USD 3 billion from business reductions partially offset by increases of USD 2 billion from methodology changes. This compares to the target of USD 6 billion by end 2015. Additionally, the non-strategic businesses reported leverage exposure of USD 79 billion as of the end of 1Q14, a reduction of USD 8 billion, or 9% from 4Q13. This compares to the target of USD 24 billion in leverage exposure by year-end 2015.
Corporate Center
Corporate Center includes parent company operations such as Group financing, expenses for projects sponsored by the Group and certain expenses and revenues that have not been allocated to the segments. It also includes consolidation and elimination adjustments required to eliminate intercompany revenues and expenses.
Corporate Center
in / end of % change
1Q14 4Q13 1Q13 QoQ YoY
Reported results (CHF million)
Net revenues (187) (177) (205) 6 (9)
Provision for credit losses 1 1 0 0 –
Compensation and benefits 166 119 126 39 32
Total other operating expenses 85 92 45 (8) 89
Total operating expenses 251 211 171 19 47
Loss before taxes (439) (389) (376) 13 17
Non-strategic results (CHF million)
Net revenues (146) (160) (198) (9) (26)
Provision for credit losses 0 0 0 – –
Total operating expenses 144 161 82 (11) 76
Income/(loss) before taxes (290) (321) (280) (10) 4
Earnings ReleaseApril 16, 2014
Page 13
The Corporate Center recorded a loss before taxes of CHF 439 million in 1Q14, including fair value losses on own debt of CHF 92 million, debit valuation adjustment losses on certain structured notes liabilities of CHF 4 million and fair value losses on stand-alone derivatives of CHF 24 million, resulting in overall fair value losses on own credit spreads of CHF 120 million in 1Q14. 1Q14 results also included business realignment costs of CHF 62 million, IT architecture simplification expenses of CHF 61 million and a gain on sale of real estate of CHF 34 million. This compares to a loss before taxes of CHF 376 million in 1Q13 and a loss before taxes of CHF 389 million in 4Q13.
Balance sheet, shareholders’ equity and regulatory capital
Balance sheetAs of the end of 1Q14, total assets of CHF 878.1 billion were stable compared to 4Q13, reflecting a slight increase in operating activities, partially offset by the foreign exchange translation impact. Excluding the foreign exchange translation impact, total assets increased CHF 9.7 billion.
Total shareholders’ equityCredit Suisse’s total shareholders’ equity increased to CHF 43.2 billion as of the end of 1Q14 compared to CHF 42.2 billion as of the end of 4Q13. Total shareholders’ equity was impacted by net income, the effect of share-based compensation and the purchase of subsidiary shares from non-controlling interests, relating to the redemption of tier 1 participation securities. These increases were partially offset by the impact of foreign exchange-related movements on cumulative translation adjustments and treasury shares purchases and sales.
Capital issuances and redemptionsIn March 2014, pursuant to a tender offer, Credit Suisse repurchased USD 1.4 billion of outstanding 7.875% perpetual series B subordinated tier 1 participation securities. Credit Suisse subsequently exercised a regulatory call of the USD 99 million of such securities that had not been tendered, with the result that no such securities remain outstanding. Prior to the announcement of the tender offer and as advised by FINMA, these tier 1 partici-pation securities formed part of Swiss CET1 capital under the Swiss Requirements, whereas under Basel III, these instruments were included in additional tier 1 instruments subject to phase out. These transactions were approved by FINMA.
In March 2014, CHF 0.5 billion of Contingent Capital Awards (CCA) were granted to certain employees as part of their 2013 deferred variable compensation. Also in March, employees holding 2011 Partner Asset Facility (PAF2) awards, which were restructured, reallocated a portion of their PAF2 holdings to CCA. CCA qualify as high-trigger regulatory capital.
Regulatory capital and ratios – Basel IIIThe CET1 ratio was 14.3% as of the end of 1Q14, compared to 15.7% as of the end of 4Q13, due to an increase in RWA and a decrease in CET1 capital. Credit Suisse’ tier 1 ratio was 15.6% as of the end of 1Q14, compared to 16.8% as of the end of 4Q13. The total capital ratio decreased to 19.1% as of the end of 1Q14 compared to 20.6% as of the end of 4Q13.
CET1 capital was CHF 40.9 billion as of the end of 1Q14 compared to CHF 43.0 billion as of the end of 4Q13, mainly reflecting the 20% phase in of regulatory deductions from CET1 including goodwill and other intangible assets and certain deferred tax assets and a 20% decrease in the adjustment for the accounting treatment of pension plans, pursuant to phase-in requirements. CET1 capital was also impacted by a quarterly dividend accrual and a negative foreign exchange translation impact, partially offset by net income and the impact of share-based compensation.
Earnings ReleaseApril 16, 2014
Page 14
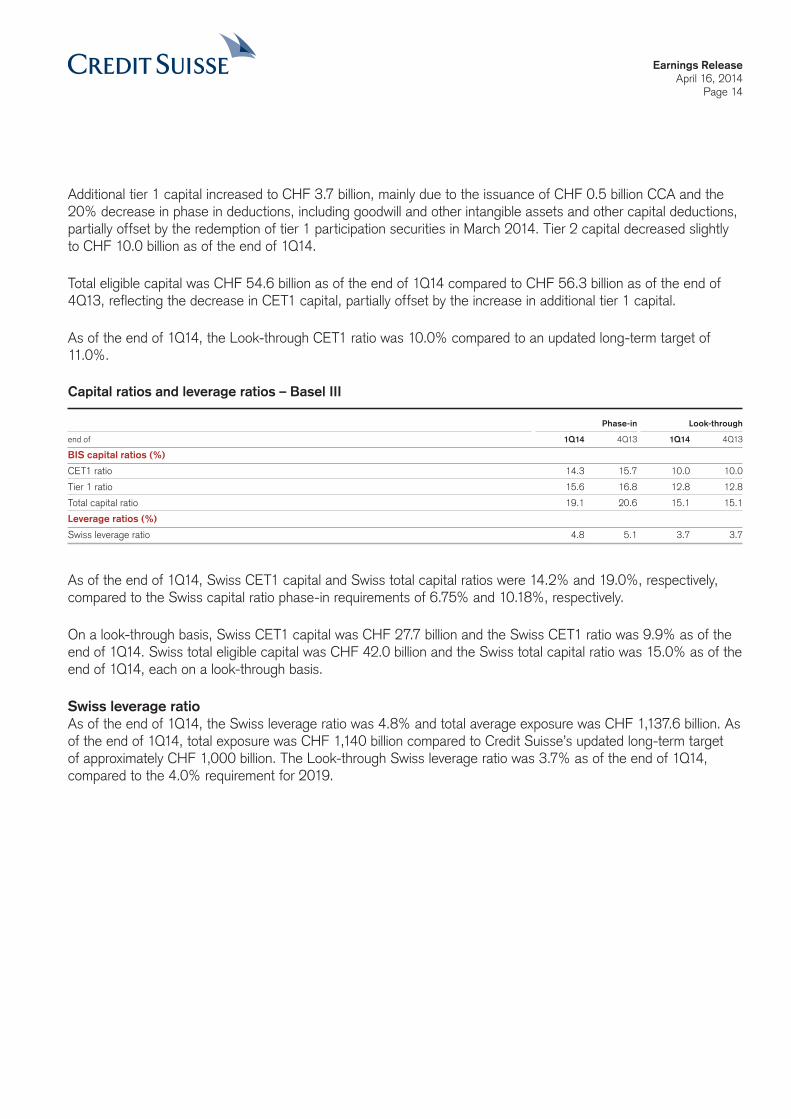
Additional tier 1 capital increased to CHF 3.7 billion, mainly due to the issuance of CHF 0.5 billion CCA and the 20% decrease in phase in deductions, including goodwill and other intangible assets and other capital deductions, partially offset by the redemption of tier 1 participation securities in March 2014. Tier 2 capital decreased slightly to CHF 10.0 billion as of the end of 1Q14.
Total eligible capital was CHF 54.6 billion as of the end of 1Q14 compared to CHF 56.3 billion as of the end of 4Q13, reflecting the decrease in CET1 capital, partially offset by the increase in additional tier 1 capital.
As of the end of 1Q14, the Look-through CET1 ratio was 10.0% compared to an updated long-term target of 11.0%.
Capital ratios and leverage ratios – Basel III
Phase-in Look-through
end of 1Q14 4Q13 1Q14 4Q13
BIS capital ratios (%)
CET1 ratio 14.3 15.7 10.0 10.0
Tier 1 ratio 15.6 16.8 12.8 12.8
Total capital ratio 19.1 20.6 15.1 15.1
Leverage ratios (%)
Swiss leverage ratio 4.8 5.1 3.7 3.7
As of the end of 1Q14, Swiss CET1 capital and Swiss total capital ratios were 14.2% and 19.0%, respectively, compared to the Swiss capital ratio phase-in requirements of 6.75% and 10.18%, respectively.
On a look-through basis, Swiss CET1 capital was CHF 27.7 billion and the Swiss CET1 ratio was 9.9% as of the end of 1Q14. Swiss total eligible capital was CHF 42.0 billion and the Swiss total capital ratio was 15.0% as of the end of 1Q14, each on a look-through basis.
Swiss leverage ratioAs of the end of 1Q14, the Swiss leverage ratio was 4.8% and total average exposure was CHF 1,137.6 billion. As of the end of 1Q14, total exposure was CHF 1,140 billion compared to Credit Suisse’s updated long-term target of approximately CHF 1,000 billion. The Look-through Swiss leverage ratio was 3.7% as of the end of 1Q14, compared to the 4.0% requirement for 2019.
Earnings ReleaseApril 16, 2014
Page 15
Quarterly results documentation
The Results Presentation Slides are available for download from 06:45 CEST today at: https://www.credit-suisse.com/results
The 1Q14 Financial Report will be available for download on or about May 2, 2014 at: https://www.credit-suisse.com/results
Hard copies of the 1Q14 Financial Report may be ordered free of charge at: https://publications.credit-suisse.com/index.cfm/publikationen-shop/quarterly-reports/
Presentation – Wednesday, April 16, 2014
Event Analyst, investor and media presentation
Time 09:00 Zurich
08:00 London
03:00 New York
Speakers Brady W. Dougan, Chief Executive Officer David Mathers, Chief Financial Officer
Language The presentation will be held in English
Access via Internet Audio webcast www.credit-suisse.com/results
Access via Telephone +41 44 580 40 01 (Switzerland) +44 1452 565 510 (Europe) +1 866 389 9771 (US) Reference: Credit Suisse Group quarterly results
Q&A Session Following the presentations, you will have the opportunity to ask questions via the telephone conference.
Playback Replay available approximately two hours after the event by visiting
www.credit-suisse.com/results or by dialing: +41 44 580 34 56 (Switzerland) +44 1452 550 000 (Europe) +1 866 247 4222 (US) Conference ID: 25863345#
Contacts
Media Relations Credit Suisse, telephone +41 844 33 88 44, [email protected] Relations Credit Suisse, telephone +41 44 333 71 49, [email protected]
Earnings ReleaseApril 16, 2014
Page 16
Important information The Group has not finalized its 1Q14 Financial Report and the Group’s independent registered public accounting firm has not completed its review of the condensed consolidated financial statements (unaudited) for the period. Accordingly, the financial information contained in this Earnings Release is subject to completion of quarter-end procedures, which may result in changes to that information.
For purposes of this Earnings Release, unless the context otherwise requires, the terms “Credit Suisse” and “the Group” mean Credit Suisse Group AG and its consolidated subsidiaries. The business of Credit Suisse AG, the Swiss bank subsidiary of the Group, is substantially similar to the Group, and these terms are used to refer to both when the subject is the same or substantially similar. The term “the Bank” is used when referring to Credit Suisse AG, the Swiss bank subsidiary of the Group, and its consolidated subsidiaries.
Information referenced in this Earnings Release, whether via website links or otherwise, are not incorporated into this Earnings Release.
As of January 1, 2013, Basel III was implemented in Switzerland along with the Swiss “Too Big to Fail” legislation and regulations thereunder. The related disclosures are in accordance with Credit Suisse’s current interpretation of such requirements, including relevant assumptions. Changes in the interpretation of these requirements in Switzerland or in any of Credit Suisse’s assumptions or estimates could result in different numbers from those shown herein.
References to phase-in and look-through included herein refer to Basel III requirements. Phase-in reflects that for the years 2014 – 2018, there will be a five-year (20% per annum) phase in of goodwill and other intangible assets and other capital deductions (e.g., certain deferred tax assets and participations in financial institutions) and for the years 2013 – 2022, there will be a phase out of certain capital instruments. Look-through assumes the full phase-in of goodwill and other intangible assets and other regulatory adjustments and the full phase out of certain capital instruments.
Unless otherwise noted, leverage ratio, leverage exposure and total capital amounts included herein are based on the current FINMA framework. The Swiss leverage ratio is calculated as Swiss total eligible capital, divided by a three-month average leverage exposure, which consists of balance sheet assets, off-balance sheet exposures, which consist of guarantees and commitments, and regulatory adjustments, which include cash collateral netting reversals and derivative add-ons.
Return on equity for strategic results is calculated by dividing annualized strategic net income by average strategic shareholders’ equity (derived by deducting 10% of non-strategic risk-weighted assets from reported shareholders’ equity). Return on capital is calculated using income after tax and capital allocated based on the average of 10% of average risk-weighted assets and 2.4% of average leverage exposure.
All expense reduction metrics against 6M11 annualized total expenses are measured at constant foreign exchange rates and exclude realignment and other significant expense items and variable compensation expenses. For further information regarding these measures, see the 1Q14 Results Presentation Slides.
In various tables, use of “–” indicates not meaningful or not applicable.
Earnings ReleaseApril 16, 2014
Page A-1
Appendix
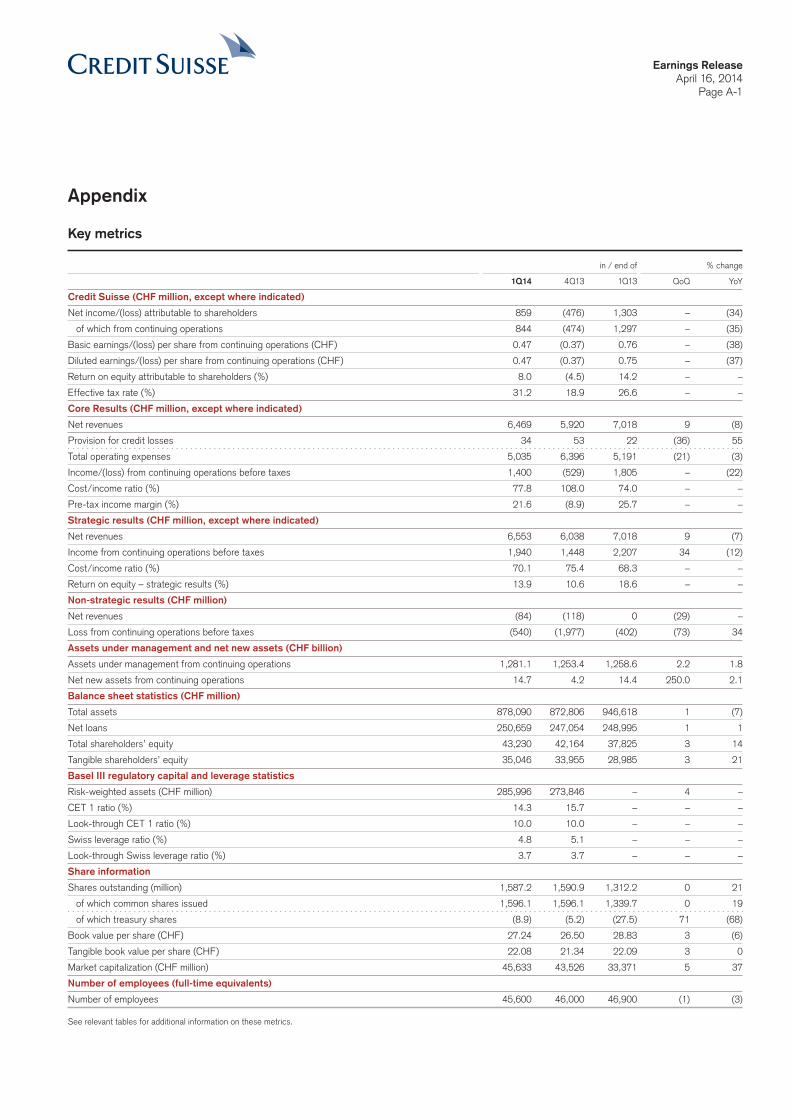
Key metrics
in / end of % change
1Q14 4Q13 1Q13 QoQ YoY
Credit Suisse (CHF million, except where indicated)
Net income/(loss) attributable to shareholders 859 (476) 1,303 – (34)
of which from continuing operations 844 (474) 1,297 – (35)
Basic earnings/(loss) per share from continuing operations (CHF) 0.47 (0.37) 0.76 – (38)
Diluted earnings/(loss) per share from continuing operations (CHF) 0.47 (0.37) 0.75 – (37)
Return on equity attributable to shareholders (%) 8.0 (4.5) 14.2 – –
Effective tax rate (%) 31.2 18.9 26.6 – –
Core Results (CHF million, except where indicated)
Net revenues 6,469 5,920 7,018 9 (8)
Provision for credit losses 34 53 22 (36) 55
Total operating expenses 5,035 6,396 5,191 (21) (3)
Income/(loss) from continuing operations before taxes 1,400 (529) 1,805 – (22)
Cost/income ratio (%) 77.8 108.0 74.0 – –
Pre-tax income margin (%) 21.6 (8.9) 25.7 – –
Strategic results (CHF million, except where indicated)
Net revenues 6,553 6,038 7,018 9 (7)
Income from continuing operations before taxes 1,940 1,448 2,207 34 (12)
Cost/income ratio (%) 70.1 75.4 68.3 – –
Return on equity – strategic results (%) 13.9 10.6 18.6 – –
Non-strategic results (CHF million)
Net revenues (84) (118) 0 (29) –
Loss from continuing operations before taxes (540) (1,977) (402) (73) 34
Assets under management and net new assets (CHF billion)
Assets under management from continuing operations 1,281.1 1,253.4 1,258.6 2.2 1.8
Net new assets from continuing operations 14.7 4.2 14.4 250.0 2.1
Balance sheet statistics (CHF million)
Total assets 878,090 872,806 946,618 1 (7)
Net loans 250,659 247,054 248,995 1 1
Total shareholders’ equity 43,230 42,164 37,825 3 14
Tangible shareholders’ equity 35,046 33,955 28,985 3 21
Basel III regulatory capital and leverage statistics
Risk-weighted assets (CHF million) 285,996 273,846 – 4 –
CET 1 ratio (%) 14.3 15.7 – – –
Look-through CET 1 ratio (%) 10.0 10.0 – – –
Swiss leverage ratio (%) 4.8 5.1 – – –
Look-through Swiss leverage ratio (%) 3.7 3.7 – – –
Share information
Shares outstanding (million) 1,587.2 1,590.9 1,312.2 0 21
of which common shares issued 1,596.1 1,596.1 1,339.7 0 19
of which treasury shares (8.9) (5.2) (27.5) 71 (68)
Book value per share (CHF) 27.24 26.50 28.83 3 (6)
Tangible book value per share (CHF) 22.08 21.34 22.09 3 0
Market capitalization (CHF million) 45,633 43,526 33,371 5 37
Number of employees (full-time equivalents)
Number of employees 45,600 46,000 46,900 (1) (3)
See relevant tables for additional information on these metrics.

Earnings ReleaseApril 16, 2014
Page A-2
Credit Suisse
in / end of % change
1Q14 4Q13 1Q13 QoQ YoY
Statements of operations (CHF million)
Net revenues 6,829 6,139 7,089 11 (4)
Provision for credit losses 34 53 22 (36) 55
Compensation and benefits 2,993 2,807 2,991 7 0
General and administrative expenses 1,690 3,223 1,732 (48) (2)
Commission expenses 369 389 470 (5) (21)
Total other operating expenses 2,059 3,612 2,202 (43) (6)
Total operating expenses 5,052 6,419 5,193 (21) (3)
Income/(loss) from continuing operations before taxes 1,743 (333) 1,874 – (7)
Income tax expense/(benefit) 543 (63) 499 – 9
Income/(loss) from continuing operations 1,200 (270) 1,375 – (13)
Income/(loss) from discontinued operations 15 (2) 6 – 150
Net income/(loss) 1,215 (272) 1,381 – (12)
Net income attributable to noncontrolling interests 356 204 78 75 356
Net income/(loss) attributable to shareholders 859 (476) 1,303 – (34)
of which from continuing operations 844 (474) 1,297 – (35)
of which from discontinued operations 15 (2) 6 – 150
Earnings per share (CHF)
Basic earnings/(loss) per share from continuing operations 0.47 (0.37) 0.76 – (38)
Basic earnings/(loss) per share 0.48 (0.37) 0.76 – (37)
Diluted earnings/(loss) per share from continuing operations 0.47 (0.37) 0.75 – (37)
Diluted earnings/(loss) per share 0.48 (0.37) 0.75 – (36)
Return on equity (%, annualized)
Return on equity attributable to shareholders 8.0 (4.5) 14.2 – –
Return on tangible equity attributable to shareholders 1 10.0 (5.6) 18.6 – –
Number of employees (full-time equivalents)
Number of employees 45,600 46,000 46,900 (1) (3)
1 Based on tangible shareholders’ equity attributable to shareholders, a non-GAAP financial measure, which is calculated by deducting goodwill and other intangible assets from total shareholders’ equity attributable to shareholders. Management believes that the return on tangible shareholders’ equity attributable to shareholders is meaningful as it allows consistent measurement of the performance of businesses without regard to whether the businesses were acquired.

Earnings ReleaseApril 16, 2014
Page A-3
Private Banking & Wealth Management
Investment Banking
Non- controlling interest without significant economic interest
Corporate Center
Credit Suisse
Core Results
Strategic results
Non- strategic results
Credit Suisse reporting structure
Wealth Management Clients
Corporate & Institutional Clients
Asset Management
Non-strategic unit Private Banking & Wealth Management
Non-strategic unit Investment Banking
Non-strategic items
Credit Suisse and Core Results
Core Results Noncontrolling interests without SEI Credit Suisse
in 1Q14 4Q13 1Q13 1Q14 4Q13 1Q13 1Q14 4Q13 1Q13
Statements of operations (CHF million)
Net revenues 6,469 5,920 7,018 360 219 71 6,829 6,139 7,089
Provision for credit losses 34 53 22 0 0 0 34 53 22
Compensation and benefits 2,977 2,788 2,990 16 19 1 2,993 2,807 2,991
General and administrative expenses 1,689 3,219 1,731 1 4 1 1,690 3,223 1,732
Commission expenses 369 389 470 0 0 0 369 389 470
Total other operating expenses 2,058 3,608 2,201 1 4 1 2,059 3,612 2,202
Total operating expenses 5,035 6,396 5,191 17 23 2 5,052 6,419 5,193
Income/(loss) from continuing operations
before taxes 1,400 (529) 1,805 343 196 69 1,743 (333) 1,874
Income tax expense/(benefit) 543 (63) 499 0 0 0 543 (63) 499
Income/(loss) from continuing operations 857 (466) 1,306 343 196 69 1,200 (270) 1,375
Income/(loss) from discontinued operations 15 (2) 6 0 0 0 15 (2) 6
Net income/(loss) 872 (468) 1,312 343 196 69 1,215 (272) 1,381
Net income attributable to noncontrolling interests 13 8 9 343 196 69 356 204 78
Net income/(loss) attributable to shareholders 859 (476) 1,303 – – – 859 (476) 1,303
of which from continuing operations 844 (474) 1,297 – – – 844 (474) 1,297
of which from discontinued operations 15 (2) 6 – – – 15 (2) 6
Statement of operations metrics (%)
Cost/income ratio 77.8 108.0 74.0 – – – 74.0 104.6 73.3
Pre-tax income margin 21.6 (8.9) 25.7 – – – 25.5 (5.4) 26.4
Effective tax rate 38.8 11.9 27.6 – – – 31.2 18.9 26.6
Net income margin 1 13.3 (8.0) 18.6 – – – 12.6 (7.8) 18.4
1 Based on amounts attributable to shareholders.
Credit Suisse results include revenues and expenses from the consolidation of certain private equity funds and other entities in which we have noncontrolling interests without significant economic interest (SEI) in such revenues and expenses. Core Results include the results of our two segments and the Corporate Center and discontinued operations, but do not include noncontrolling interests without SEI.
Earnings ReleaseApril 16, 2014
Page A-4
Core Results
in / end of % change
1Q14 4Q13 1Q13 QoQ YoY
Statements of operations (CHF million)
Net interest income 2,183 1,742 1,801 25 21
Commissions and fees 3,276 3,430 3,254 (4) 1
Trading revenues 630 287 1,807 120 (65)
Other revenues 380 461 156 (18) 144
Net revenues 6,469 5,920 7,018 9 (8)
of which strategic results 6,553 6,038 7,018 9 (7)
of which non-strategic results (84) (118) 0 (29) –
Provision for credit losses 34 53 22 (36) 55
Compensation and benefits 2,977 2,788 2,990 7 0
General and administrative expenses 1,689 3,219 1,731 (48) (2)
Commission expenses 369 389 470 (5) (21)
Total other operating expenses 2,058 3,608 2,201 (43) (6)
Total operating expenses 5,035 6,396 5,191 (21) (3)
of which strategic results 4,595 4,554 4,795 1 (4)
of which non-strategic results 440 1,842 396 (76) 11
Income/(loss) from continuing operations before taxes 1,400 (529) 1,805 – (22)
of which strategic results 1,940 1,448 2,207 34 (12)
of which non-strategic results (540) (1,977) (402) (73) 34
Income tax expense/(benefit) 543 (63) 499 – 9
Income/(loss) from continuing operations 857 (466) 1,306 – (34)
Income/(loss) from discontinued operations 15 (2) 6 – 150
Net income/(loss) 872 (468) 1,312 – (34)
Net income attributable to noncontrolling interests 13 8 9 63 44
Net income/(loss) attributable to shareholders 859 (476) 1,303 – (34)
of which strategic results 1,398 1,062 1,579 32 (11)
of which non-strategic results (539) (1,538) (276) (65) 95
Statement of operations metrics (%)
Return on capital 1 14.4 – 18.2 – –
Cost/income ratio 77.8 108.0 74.0 – –
Pre-tax income margin 21.6 (8.9) 25.7 – –
Effective tax rate 38.8 11.9 27.6 – –
Net income margin 2 13.3 (8.0) 18.6 – –
Return on equity (%, annualized)
Return on equity – strategic results 13.9 10.6 18.6 – –
Number of employees (full-time equivalents)
Number of employees 45,600 46,000 46,900 (1) (3)
1 Calculated using income after tax denominated in CHF; assumes tax rate of 30% in 1Q14 and 4Q13, 25% in 1Q13 and capital allocated based on average of 10% of average risk-weighted assets and 2.4% of average leverage exposure.
2 Based on amounts attributable to shareholders.
Earnings ReleaseApril 16, 2014
Page A-5
Core Results – strategic and non-strategic results
Strategic results Non-strategic results Core Results
in / end of 1Q14 4Q13 1Q13 1Q14 4Q13 1Q13 1Q14 4Q13 1Q13
Statements of operations (CHF million)
Net revenues 6,553 6,038 7,018 (84) (118) 0 6,469 5,920 7,018
Provision for credit losses 18 36 16 16 17 6 34 53 22
Compensation and benefits 2,797 2,599 2,802 180 189 188 2,977 2,788 2,990
Total other operating expenses 1,798 1,955 1,993 260 1,653 208 2,058 3,608 2,201
Total operating expenses 4,595 4,554 4,795 440 1,842 396 5,035 6,396 5,191
Income/(loss) from continuing operations
before taxes 1,940 1,448 2,207 (540) (1,977) (402) 1,400 (529) 1,805
Income tax expense/(benefit) 529 378 619 14 (441) (120) 543 (63) 499
Income/(loss) from continuing operations 1,411 1,070 1,588 (554) (1,536) (282) 857 (466) 1,306
Income/(loss) from discontinued operations 0 0 0 15 (2) 6 15 (2) 6
Net income/(loss) 1,411 1,070 1,588 (539) (1,538) (276) 872 (468) 1,312
Net income attributable to noncontrolling interests 13 8 9 0 0 0 13 8 9
Net income/(loss) attributable to shareholders 1,398 1,062 1,579 (539) (1,538) (276) 859 (476) 1,303
Balance sheet statistics (CHF million)
Risk-weighted assets – Basel III 1 255,697 242,475 262,941 23,997 23,628 26,745 279,694 266,103 289,686
Total assets 833,536 821,207 886,213 43,263 47,975 55,986 876,799 869,182 942,199
Swiss leverage exposure 1,050,957 1,031,316 1,170,436 88,660 99,289 117,144 1,139,617 1,130,605 1,287,580
1 Represents risk-weighted assets on a fully phased-in “look-through” basis.
Private Banking & Wealth Management
in / end of % change
1Q14 4Q13 1Q13 QoQ YoY
Statements of operations (CHF million)
Net revenues 3,240 3,429 3,278 (6) (1)
of which strategic results 3,031 3,260 3,008 (7) 1
of which non-strategic results 209 169 270 24 (23)
Provision for credit losses 33 44 28 (25) 18
Compensation and benefits 1,290 1,314 1,379 (2) (6)
General and administrative expenses 736 1,443 791 (49) (7)
Commission expenses 169 204 199 (17) (15)
Total other operating expenses 905 1,647 990 (45) (9)
Total operating expenses 2,195 2,961 2,369 (26) (7)
of which strategic results 2,049 2,185 2,229 (6) (8)
of which non-strategic results 146 776 140 (81) 4
Income before taxes 1,012 424 881 139 15
of which strategic results 965 1,048 756 (8) 28
of which non-strategic results 47 (624) 125 – (62)
Statement of operations metrics (%)
Return on capital 1 32.3 13.9 29.8 – –
Cost/income ratio 67.7 86.4 72.3 – –
Pre-tax income margin 31.2 12.4 26.9 – –
Assets under management (CHF billion)
Assets under management 1,292.5 1,282.4 1,311.6 0.8 (1.5)
Net new assets 13.7 4.4 12.0 211.4 14.2
Number of employees and relationship managers
Number of employees (full-time equivalents) 26,100 26,000 27,000 0 (3)
Number of relationship managers 4,410 4,330 4,530 2 (3)
1 Calculated using income after tax denominated in CHF; assumes tax rate of 30% in 1Q14 and 4Q13, 25% in 1Q13 and capital allocated on average of 10% of average risk-weighted assets and 2.4% of average leverage exposure.
Earnings ReleaseApril 16, 2014
Page A-6
Private Banking & Wealth Management (continued)
in / end of % change
1Q14 4Q13 1Q13 QoQ YoY
Net revenue detail (CHF million)
Net interest income 979 1,058 1,045 (7) (6)
Recurring commissions and fees 1,189 1,232 1,219 (3) (2)
Transaction- and performance-based revenues 937 1,186 919 (21) 2
Other revenues 1 135 (47) 95 – 42
Net revenues 3,240 3,429 3,278 (6) (1)
Provision for credit losses (CHF million)
New provisions 53 76 52 (30) 2
Releases of provisions (20) (32) (24) (38) (17)
Provision for credit losses 33 44 28 (25) 18
1 Includes investment-related gains/(losses), equity participations and other gains/(losses) and fair value gains/(losses) on the Clock Finance transaction.
Private Banking & Wealth Management – strategic results
in / end of % change
1Q14 4Q13 1Q13 QoQ YoY
Statements of operations (CHF million)
Net interest income 963 1,038 1,019 (7) (5)
Recurring commissions and fees 1,139 1,149 1,101 (1) 3
Transaction- and performance-based revenues 919 1,137 874 (19) 5
Other revenues 10 (64) 14 – (29)
Net revenues 3,031 3,260 3,008 (7) 1
New provisions 36 58 47 (38) (23)
Releases of provisions (19) (31) (24) (39) (21)
Provision for credit losses 17 27 23 (37) (26)
Compensation and benefits 1,225 1,242 1,307 (1) (6)
General and administrative expenses 660 750 736 (12) (10)
Commission expenses 164 193 186 (15) (12)
Total other operating expenses 824 943 922 (13) (11)
Total operating expenses 2,049 2,185 2,229 (6) (8)
Income before taxes 965 1,048 756 (8) 28
of which Wealth Management Clients 578 466 454 24 27
of which Corporate & Institutional Clients 246 213 239 15 3
of which Asset Management 141 369 63 (62) 124
Statement of operations metrics (%)
Return on capital 1 33.0 36.8 27.7 – –
Cost/income ratio 67.6 67.0 74.1 – –
Pre-tax income margin 31.8 32.1 25.1 – –
Balance sheet statistics (CHF million)
Risk-weighted assets – Basel III 92,169 88,316 2 90,752 4 2
Total assets 267,332 258,447 261,165 3 2
Swiss leverage exposure 309,672 302,894 312,280 2 (1)
1 Calculated using income after tax denominated in CHF; assumes tax rate of 30% in 1Q14 and 4Q13, 25% in 1Q13 and capital allocated on average of 10% of average risk-weighted assets and 2.4% of average leverage exposure.
2 Includes the impact of an operational risk add-on of CHF 1.6 billion in 4Q13.
Earnings ReleaseApril 16, 2014
Page A-7
Wealth Management Clients
in / end of % change
1Q14 4Q13 1Q13 QoQ YoY
Statements of operations (CHF million)
Net revenues 2,074 2,056 2,087 1 (1)
Provision for credit losses 16 18 19 (11) (16)
Total operating expenses 1,480 1,572 1,614 (6) (8)
Income before taxes 578 466 454 24 27
Statement of operations metrics (%)
Cost/income ratio 71.4 76.5 77.3 – –
Pre-tax income margin 27.9 22.7 21.8 – –
Net revenue detail (CHF million)
Net interest income 706 760 746 (7) (5)
Recurring commissions and fees 730 742 717 (2) 2
Transaction- and performance-based revenues 638 554 624 15 2
Net revenues 2,074 2,056 2,087 1 (1)
Gross margin (annualized) (bp) 1
Net interest income 35 38 38 – –
Recurring commissions and fees 37 38 37 – –
Transaction- and performance-based revenues 32 28 32 – –
Gross margin 104 104 107 – –
Number of relationship managers
Switzerland 1,690 1,590 1,610 6 5
EMEA 1,150 1,180 1,290 (3) (11)
Americas 560 560 630 0 (11)
Asia Pacific 460 440 430 5 7
Number of relationship managers 3,860 3,770 3,960 2 (3)
Beginning in 2Q13, fees collected in an agent role in connection with certain customized fund services we provide to clients where those fees are passed on directly to a third-party investment manager are now presented on a net basis per the applicable accounting standards. These fees were previously recorded on a gross basis as fee income and commission expense. Prior periods have been restated to conform to the current presentation.1 Net revenues divided by average assets under management.
Corporate & Institutional Clients
in / end of % change
1Q14 4Q13 1Q13 QoQ YoY
Statements of operations (CHF million)
Net revenues 492 485 500 1 (2)
Provision for credit losses 1 9 4 (89) (75)
Total operating expenses 245 263 257 (7) (5)
Income before taxes 246 213 239 15 3
Statement of operations metrics (%)
Cost/income ratio 49.8 54.2 51.4 – –
Pre-tax income margin 50.0 43.9 47.8 – –
Net revenue detail (CHF million)
Net interest income 257 278 273 (8) (6)
Recurring commissions and fees 122 108 111 13 10
Transaction- and performance-based revenues 117 102 121 15 (3)
Other revenues (4) (3) (5) 33 (20)
Net revenues 492 485 500 1 (2)
Number of relationship managers
Number of relationship managers (Switzerland) 550 560 570 (2) (4)

Earnings ReleaseApril 16, 2014
Page A-8
Asset Management
in / end of % change
1Q14 4Q13 1Q13 QoQ YoY
Statements of operations (CHF million)
Net revenues 465 719 421 (35) 10
Provision for credit losses 0 0 0 – –
Total operating expenses 324 350 358 (7) (9)
Income before taxes 141 369 63 (62) 124
Statement of operations metrics (%)
Cost/income ratio 69.7 48.7 85.0 – –
Pre-tax income margin 30.3 51.3 15.0 – –
Net revenue detail (CHF million)
Recurring commissions and fees 287 299 273 (4) 5
Transaction- and performance-based revenues 164 481 129 (66) 27
Other revenues 14 (61) 19 – (26)
Net revenues 465 719 421 (35) 10
Net revenue detail by type (CHF million)
Asset management fees 287 299 273 (4) 5
Placement, transaction and other fees 56 116 60 (52) (7)
Performance fees and carried interest 80 342 44 (77) 82
Equity participations income 15 12 10 25 50
Fee-based revenues 438 769 387 (43) 13
Investment-related gains/(losses) 19 19 33 0 (42)
Equity participations and other gains/(losses) 0 (68) 0 100 –
Other revenues 1 8 (1) 1 – –
Net revenues 465 719 421 (35) 10
Fee-based margin on assets under management (annualized) (bp)
Fee-based margin 2 49 87 46 – –
1 Includes allocated funding costs.2 Fee-based revenues divided by average assets under management.
Private Banking & Wealth Management – non-strategic results
in / end of % change
1Q14 4Q13 1Q13 QoQ YoY
Statements of operations (CHF million)
Net revenues 209 169 270 24 (23)
Provision for credit losses 16 17 5 (6) 220
Compensation and benefits 65 72 72 (10) (10)
Total other operating expenses 81 704 68 (88) 19
Total operating expenses 146 776 140 (81) 4
Income/(loss) before taxes 47 (624) 125 – (62)
Revenue details (CHF million)
Restructuring of select onshore businesses 22 28 74 (21) (70)
Legacy cross-border business and small markets 44 52 51 (15) (14)
Restructuring of former Asset Management division 134 54 111 148 21
Other 9 35 34 (74) (74)
Net revenues 209 169 270 24 (23)
Balance sheet statistics (CHF million)
Risk-weighted assets – Basel III 7,561 6,079 7,569 24 0
Total assets 17,856 20,692 23,423 (14) (24)
Swiss leverage exposure 18,609 21,589 24,563 (14) (24)
Earnings ReleaseApril 16, 2014
Page A-9
Investment Banking
in / end of % change
1Q14 4Q13 1Q13 QoQ YoY
Statements of operations (CHF million)
Net revenues 3,416 2,668 3,945 28 (13)
of which strategic results 3,563 2,795 4,017 27 (11)
of which non-strategic results (147) (127) (72) 16 104
Provision for credit losses 0 8 (6) (100) 100
Compensation and benefits 1,521 1,355 1,485 12 2
General and administrative expenses 856 1,667 915 (49) (6)
Commission expenses 212 202 251 5 (16)
Total other operating expenses 1,068 1,869 1,166 (43) (8)
Total operating expenses 2,589 3,224 2,651 (20) (2)
of which strategic results 2,439 2,319 2,477 5 (2)
of which non-strategic results 150 905 174 (83) (14)
Income/(loss) before taxes 827 (564) 1,300 – (36)
of which strategic results 1,124 468 1,547 140 (27)
of which non-strategic results (297) (1,032) (247) (71) 20
Statement of operations metrics (%)
Return on capital 1 13.8 – 20.4 – –
Cost/income ratio 75.8 120.8 67.2 – –
Pre-tax income margin 24.2 (21.1) 33.0 – –
Number of employees (full-time equivalents)
Number of employees 19,200 19,700 19,600 (3) (2)
1 Calculated using income after tax denominated in USD; assumes tax rate of 30% in 1Q14 and 4Q13, 25% in 1Q13 and capital allocated based on average of 10% of average risk-weighted assets and 2.4% of average leverage exposure.
Investment Banking (continued)
in / end of % change
1Q14 4Q13 1Q13 QoQ YoY
Net revenue detail (CHF million)
Debt underwriting 468 482 461 (3) 2
Equity underwriting 183 273 157 (33) 17
Total underwriting 651 755 618 (14) 5
Advisory and other fees 180 194 145 (7) 24
Total underwriting and advisory 831 949 763 (12) 9
Fixed income sales and trading 1,489 746 1,987 100 (25)
Equity sales and trading 1,201 1,050 1,297 14 (7)
Total sales and trading 2,690 1,796 3,284 50 (18)
Other (105) (77) (102) 36 3
Net revenues 3,416 2,668 3,945 28 (13)
Earnings ReleaseApril 16, 2014
Page A-10
Investment Banking – strategic results
in / end of % change
1Q14 4Q13 1Q13 QoQ YoY
Statements of operations (CHF million)
Debt underwriting 468 483 461 (3) 2
Equity underwriting 183 274 157 (33) 17
Total underwriting 651 757 618 (14) 5
Advisory and other fees 180 194 145 (7) 24
Total underwriting and advisory 831 951 763 (13) 9
Fixed income sales and trading 1,609 808 2,028 99 (21)
Equity sales and trading 1,207 1,070 1,316 13 (8)
Total sales and trading 2,816 1,878 3,344 50 (16)
Other (84) (34) (90) 147 (7)
Net revenues 3,563 2,795 4,017 27 (11)
Provision for credit losses 0 8 (7) (100) 100
Compensation and benefits 1,495 1,335 1,459 12 2
General and administrative expenses 735 790 776 (7) (5)
Commission expenses 209 194 242 8 (14)
Total other operating expenses 944 984 1,018 (4) (7)
Total operating expenses 2,439 2,319 2,477 5 (2)
Income before taxes 1,124 468 1,547 140 (27)
Statement of operations metrics (%)
Return on capital 1 20.9 8.8 27.5 – –
Cost/income ratio 68.5 83.0 61.7 – –
Pre-tax income margin 31.5 16.7 38.5 – –
Balance sheet statistics (CHF million, except where indicated)
Risk-weighted assets – Basel III 147,629 138,853 153,632 6 (4)
Risk-weighted assets – Basel III (USD) 167,124 156,041 162,239 7 3
Total assets 478,476 475,516 549,709 1 (13)
Swiss leverage exposure 655,456 644,800 799,182 2 (18)
1 Calculated using income after tax denominated in USD; assumes tax rate of 30% in 1Q14 and 4Q13, 25% in 1Q13 and capital allocated based on average of 10% of average risk-weighted assets and 2.4% of average leverage exposure.
Earnings ReleaseApril 16, 2014
Page A-11
Investment Banking – non-strategic results
in / end of % change
1Q14 4Q13 1Q13 QoQ YoY
Statements of operations (CHF million)
Net revenues (147) (127) (72) 16 104
Provision for credit losses 0 0 1 – (100)
Compensation and benefits 26 20 26 30 0
Total other operating expenses 124 885 148 (86) (16)
of which litigation 65 842 100 (92) (35)
Total operating expenses 150 905 174 (83) (14)
Income/(loss) before taxes (297) (1,032) (247) (71) 20
Revenue details (CHF million)
Fixed income wind-down (55) 60 6 – –
Legacy rates business (26) (1) 28 – –
Legacy funding costs (46) (93) (96) (51) (52)
Other (20) (93) (10) (78) 100
Net revenues (147) (127) (72) 16 104
Balance sheet statistics (CHF million, except where indicated)
Risk-weighted assets – Basel III 16,436 17,549 19,176 (6) (14)
Risk-weighted assets – Basel III (USD) 18,607 19,721 20,250 (6) (8)
Total assets 25,407 27,283 32,563 (7) (22)
Swiss leverage exposure 70,051 77,700 92,581 (10) (24)
Corporate Center results
in / end of % change
1Q14 4Q13 1Q13 QoQ YoY
Statements of operations (CHF million)
Net revenues (187) (177) (205) 6 (9)
Provision for credit losses 1 1 0 0 –
Compensation and benefits 166 119 126 39 32
General and administrative expenses 97 109 25 (11) 288
Commission expenses (12) (17) 20 (29) –
Total other operating expenses 85 92 45 (8) 89
Total operating expenses 251 211 171 19 47
Loss before taxes (439) (389) (376) 13 17
Balance sheet statistics (CHF million)
Risk-weighted assets – Basel III 1 15,899 15,306 18,557 4 (14)
Total assets 87,728 87,244 75,339 1 16
Swiss leverage exposure 85,829 83,622 58,974 3 46
1 Represents risk-weighted assets on a fully phased-in “look-through” basis.

Earnings ReleaseApril 16, 2014
Page A-12
Corporate Center – non-strategic results
in / end of % change
1Q14 4Q13 1Q13 QoQ YoY
Statements of operations (CHF million)
Net revenues (146) (160) (198) (9) (26)
Provision for credit losses 0 0 0 – –
Total operating expenses 144 161 82 (11) 76
Income/(loss) before taxes (290) (321) (280) (10) 4
of which fair value impact from movements in own credit spreads (120) (202) (80) (41) 50
of which realignment costs 1 (62) (131) (92) (53) (33)
of which IT architecture simplification expenses (61) (69) – (12) –
of which real estate sales 34 68 – (50) –
of which legacy funding costs 2 (6) 6 (21) – (71)
of which reclassifications to discontinued operations 3 (56) 5 (17) – 229
of which other non-strategic items (19) 2 (70) – (73)
1 Business realignment costs relating to divisional realignment costs are prospectively presented in the relevant divisional non-strategic results beginning in 4Q13.2 Represents legacy funding costs associated with non-Basel III compliant debt instruments.3 Includes reclassifications to discontinued operations of revenues and expenses arising from the sale of ETF, secondary private equity and CFIG businesses and the announced sale of
domestic private banking business booked in Germany.
Impact from movements in own credit spreads
Our Core Results revenues are impacted by changes in credit spreads on fair-valued Credit Suisse long-term vanilla debt and debit valuation adjustments (DVA) relating to certain structured notes liabilities carried at fair value. Our Core Results are also impacted by fair value gains/(losses) on stand-alone derivatives relating to certain of our funding liabilities and reflect the volatility of cross-currency swaps and yield curve volatility and, over the life of the derivatives, will result in no net gains/(losses). These fair value gains/(losses) are recorded in the Corporate Center.
in 1Q14 4Q13 1Q13
Impact from movements in own credit spreads (CHF million)
Fair value gains/(losses) from movements in own credit spreads (120) (202) (80)
of which fair value gains/(losses) on own long-term vanilla debt (92) (180) (37)
of which fair value gains/(losses) from DVA on structured notes (4) (69) (41)
of which fair value gains/(losses) on stand-alone derivatives (24) 47 (2)
Assets under management – Group
end of % change
1Q14 4Q13 1Q13 QoQ YoY
Assets under management (CHF billion)
Wealth Management Clients 804.9 790.7 794.4 1.8 1.3
Corporate & Institutional Clients 254.4 250.0 238.7 1.8 6.6
Asset Management 363.4 352.3 347.0 3.2 4.7
Non-strategic 25.9 44.4 85.4 (41.7) (69.7)
Assets managed across businesses (156.1) (155.0) (153.9) 0.7 1.4
Assets under management 1,292.5 1,282.4 1,311.6 0.8 (1.5)
of which continuing operations 1,281.1 1,253.4 1,258.6 2.2 1.8
of which discontinued operations 11.4 29.0 53.0 (60.7) (78.5)
Assets under management from continuing operations 1,281.1 1,253.4 1,258.6 2.2 1.8
of which discretionary assets 410.7 397.6 388.1 3.3 5.8
of which advisory assets 870.4 855.8 870.5 1.7 0.0

Earnings ReleaseApril 16, 2014
Page A-13
Net new assets – Group
in 1Q14 4Q13 1Q13
Net new assets (CHF billion)
Wealth Management Clients 10.6 1.7 5.7
Corporate & Institutional Clients 0.4 4.0 4.5
Asset Management 6.9 (0.5) 8.5
Non-strategic (2.3) (1.0) (2.3)
Assets managed across businesses 1 (1.9) 0.2 (4.4)
Net new assets 13.7 4.4 12.0
of which continuing operations 14.7 4.2 14.4
of which discontinued operations (1.0) 0.2 (2.4)
1 Assets managed by Asset Management for Wealth Management Clients, Corporate & Institutional Clients and the non-strategic businesses.
BIS statistics – Basel III – Group
Phase-in Look-through
% change % change
end of 1Q14 4Q13 QoQ 1Q14 4Q13 QoQ
Eligible capital (CHF million)
Total shareholders’ equity 43,230 42,164 3 43,230 42,164 3
Regulatory adjustments 1 (1,213) (1,069) 13 (1,213) (1,069) 13
Adjustments subject to phase in (1,114) 2 1,894 3 – (14,159) (14,615) (3)
CET1 capital 40,903 42,989 (5) 27,858 26,480 5
Additional tier 1 instruments 8,000 4 7,484 7 8,000 7,484 7
Additional tier 1 instruments subject to phase out 5 2,088 3,652 (43) – – –
Deductions from additional tier 1 capital (6,414) 6 (8,064) (20) – – –
Additional tier 1 capital 3,674 3,072 20 8,000 7,484 7
Total tier 1 capital 44,577 46,061 (3) 35,858 33,964 6
Tier 2 instruments 6,340 7 6,263 1 6,340 6,263 1
Tier 2 instruments subject to phase out 3,924 4,321 (9) – – –
Deductions from tier 2 capital (263) (357) (26) (2) (18) (89)
Tier 2 capital 10,001 10,227 (2) 6,338 6,245 1
Total eligible capital 54,578 56,288 (3) 42,196 40,209 5
Risk-weighted assets (CHF million)
Credit risk 187,609 175,631 7 181,307 167,888 8
Market risk 34,143 39,133 (13) 34,143 39,133 (13)
Operational risk 58,400 53,075 10 58,400 53,075 10
Non-counterparty risk 5,844 6,007 (3) 5,844 6,007 (3)
Risk-weighted assets 285,996 273,846 4 279,694 266,103 5
Capital ratios (%)
CET1 ratio 14.3 15.7 – 10.0 10.0 –
Tier 1 ratio 15.6 16.8 – 12.8 12.8 –
Total capital ratio 19.1 20.6 – 15.1 15.1 –
1 Includes regulatory adjustments not subject to phase in, including a cumulative dividend accrual.2 Reflects 20% phase-in deductions including goodwill and other intangible assets and certain deferred tax assets and 80% of an adjustment for the accounting treatment of pension
plans pursuant to phase-in requirements.3 Includes an adjustment for the accounting treatment of pension plans pursuant to phase-in requirements and other regulatory adjustments.4 Consists of high-trigger and low-trigger capital instruments. Of this amount, CHF 5.7 billion consists of capital instruments with a capital ratio write-down trigger of 7% and CHF 2.3
billion consists of capital instruments with a capital ratio write-down trigger of 5.125%.5 Includes hybrid capital instruments that are subject to phase out.6 Includes 80% of goodwill and other intangible assets (CHF 6.5 billion) and other capital deductions, including gains/(losses) due to changes in own credit risks on fair valued financial
liabilities, that will be deducted from CET1 once Basel III is fully implemented.7 Consists of high-trigger and low-trigger capital instruments. Of this amount, CHF 2.5 billion consists of capital instruments with a capital ratio write-down trigger of 7% and CHF 3.8
billion consists of capital instruments with a capital ratio write-down trigger of 5%.
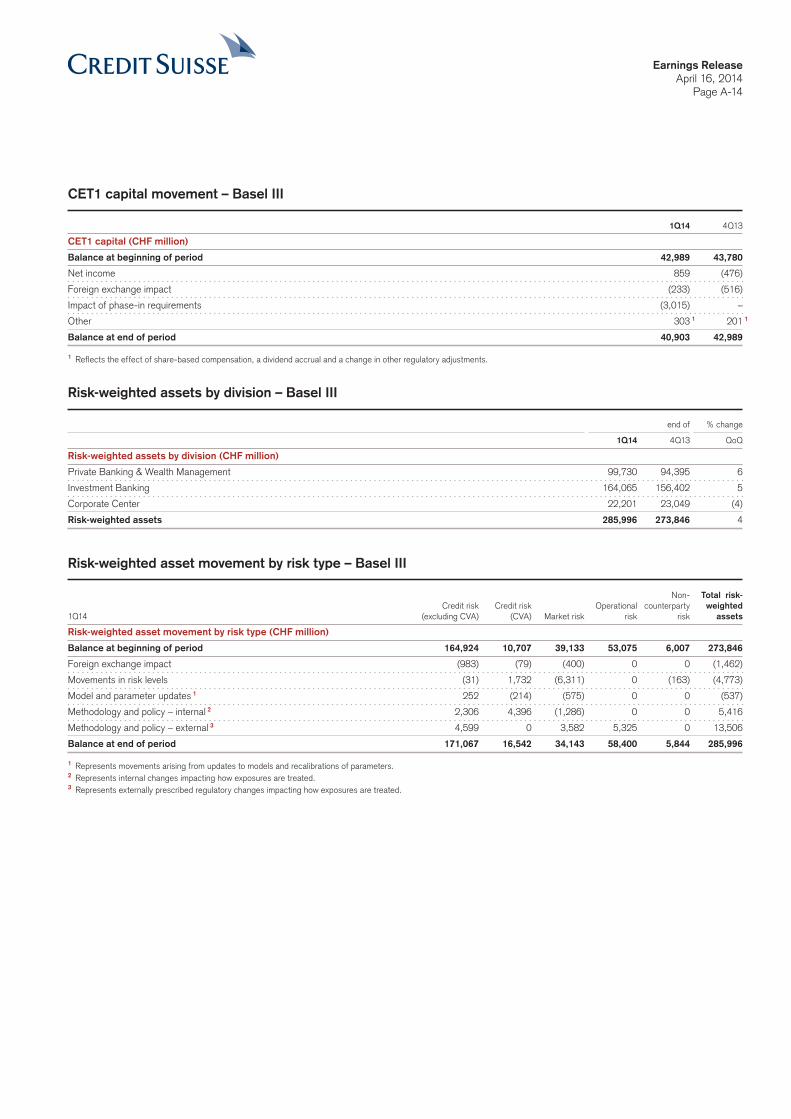
Earnings ReleaseApril 16, 2014
Page A-14
CET1 capital movement – Basel III
1Q14 4Q13
CET1 capital (CHF million)
Balance at beginning of period 42,989 43,780
Net income 859 (476)
Foreign exchange impact (233) (516)
Impact of phase-in requirements (3,015) –
Other 303 1 201 1
Balance at end of period 40,903 42,989
1 Reflects the effect of share-based compensation, a dividend accrual and a change in other regulatory adjustments.
Risk-weighted assets by division – Basel III
end of % change
1Q14 4Q13 QoQ
Risk-weighted assets by division (CHF million)
Private Banking & Wealth Management 99,730 94,395 6
Investment Banking 164,065 156,402 5
Corporate Center 22,201 23,049 (4)
Risk-weighted assets 285,996 273,846 4
Risk-weighted asset movement by risk type – Basel III
Non- Total risk-
Credit risk Credit risk Operational counterparty weighted
1Q14 (excluding CVA) (CVA) Market risk risk risk assets
Risk-weighted asset movement by risk type (CHF million)
Balance at beginning of period 164,924 10,707 39,133 53,075 6,007 273,846
Foreign exchange impact (983) (79) (400) 0 0 (1,462)
Movements in risk levels (31) 1,732 (6,311) 0 (163) (4,773)
Model and parameter updates 1 252 (214) (575) 0 0 (537)
Methodology and policy – internal 2 2,306 4,396 (1,286) 0 0 5,416
Methodology and policy – external 3 4,599 0 3,582 5,325 0 13,506
Balance at end of period 171,067 16,542 34,143 58,400 5,844 285,996
1 Represents movements arising from updates to models and recalibrations of parameters.2 Represents internal changes impacting how exposures are treated.3 Represents externally prescribed regulatory changes impacting how exposures are treated.
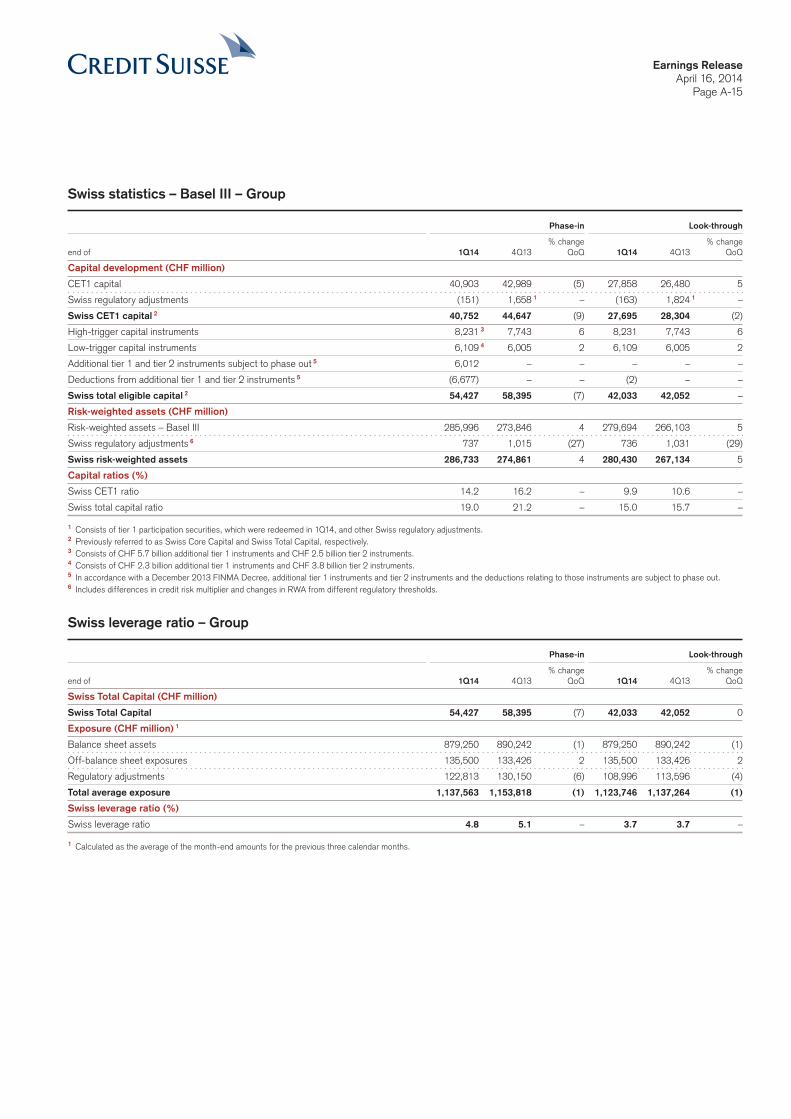
Earnings ReleaseApril 16, 2014
Page A-15
Swiss statistics – Basel III – Group
Phase-in Look-through
% change % change
end of 1Q14 4Q13 QoQ 1Q14 4Q13 QoQ
Capital development (CHF million)
CET1 capital 40,903 42,989 (5) 27,858 26,480 5
Swiss regulatory adjustments (151) 1,658 1 – (163) 1,824 1 –
Swiss CET1 capital 2 40,752 44,647 (9) 27,695 28,304 (2)
High-trigger capital instruments 8,231 3 7,743 6 8,231 7,743 6
Low-trigger capital instruments 6,109 4 6,005 2 6,109 6,005 2
Additional tier 1 and tier 2 instruments subject to phase out 5 6,012 – – – – –
Deductions from additional tier 1 and tier 2 instruments 5 (6,677) – – (2) – –
Swiss total eligible capital 2 54,427 58,395 (7) 42,033 42,052 –
Risk-weighted assets (CHF million)
Risk-weighted assets – Basel III 285,996 273,846 4 279,694 266,103 5
Swiss regulatory adjustments 6 737 1,015 (27) 736 1,031 (29)
Swiss risk-weighted assets 286,733 274,861 4 280,430 267,134 5
Capital ratios (%)
Swiss CET1 ratio 14.2 16.2 – 9.9 10.6 –
Swiss total capital ratio 19.0 21.2 – 15.0 15.7 –
1 Consists of tier 1 participation securities, which were redeemed in 1Q14, and other Swiss regulatory adjustments.2 Previously referred to as Swiss Core Capital and Swiss Total Capital, respectively.3 Consists of CHF 5.7 billion additional tier 1 instruments and CHF 2.5 billion tier 2 instruments.4 Consists of CHF 2.3 billion additional tier 1 instruments and CHF 3.8 billion tier 2 instruments.5 In accordance with a December 2013 FINMA Decree, additional tier 1 instruments and tier 2 instruments and the deductions relating to those instruments are subject to phase out.6 Includes differences in credit risk multiplier and changes in RWA from different regulatory thresholds.
Swiss leverage ratio – Group
Phase-in Look-through
% change % change
end of 1Q14 4Q13 QoQ 1Q14 4Q13 QoQ
Swiss Total Capital (CHF million)
Swiss Total Capital 54,427 58,395 (7) 42,033 42,052 0
Exposure (CHF million) 1
Balance sheet assets 879,250 890,242 (1) 879,250 890,242 (1)
Off-balance sheet exposures 135,500 133,426 2 135,500 133,426 2
Regulatory adjustments 122,813 130,150 (6) 108,996 113,596 (4)
Total average exposure 1,137,563 1,153,818 (1) 1,123,746 1,137,264 (1)
Swiss leverage ratio (%)
Swiss leverage ratio 4.8 5.1 – 3.7 3.7 –
1 Calculated as the average of the month-end amounts for the previous three calendar months.

Earnings ReleaseApril 16, 2014
Page A-16
One-day, 98% risk management VaR and one-day, 99% regulatory VaR (CHF)
Risk management Regulatory
VaR (98%) VaR (99%)
Diversi-
Interest Credit Foreign fication
in / end of rate spread exchange Commodity Equity benefit Total Total
1Q14 (CHF million)
Average 13 31 10 3 19 (35) 41 35
Minimum 9 29 5 1 14 – 1 36 26
Maximum 17 33 17 4 24 – 1 46 45
End of period 14 31 9 2 15 (29) 42 34
4Q13 (CHF million)
Average 12 34 8 2 17 (33) 40 32
Minimum 8 32 3 1 13 – 1 33 22
Maximum 16 37 15 3 24 – 1 45 44
End of period 10 32 6 3 24 (30) 45 31
1Q13 (CHF million)
Average 23 38 11 2 17 (51) 40 48
Minimum 17 33 6 1 12 – 1 34 32
Maximum 45 41 24 3 36 – 1 55 77
End of period 17 37 8 3 15 (43) 37 32
Excludes risks associated with counterparty and own credit exposures.1 As the maximum and minimum occur on different days for different risk types, it is not meaningful to calculate a portfolio diversification benefit.

Earnings ReleaseApril 16, 2014
Page A-17
Consolidated statements of operations
in 1Q14 4Q13 1Q13
Consolidated statements of operations (CHF million)
Interest and dividend income 4,445 4,073 4,822
Interest expense (2,267) (2,326) (3,016)
Net interest income 2,178 1,747 1,806
Commissions and fees 3,275 3,425 3,248
Trading revenues 638 295 1,815
Other revenues 738 672 220
Net revenues 6,829 6,139 7,089
Provision for credit losses 34 53 22
Compensation and benefits 2,993 2,807 2,991
General and administrative expenses 1,690 3,223 1,732
Commission expenses 369 389 470
Total other operating expenses 2,059 3,612 2,202
Total operating expenses 5,052 6,419 5,193
Income/(loss) from continuing operations before taxes 1,743 (333) 1,874
Income tax expense/(benefit) 543 (63) 499
Income/(loss) from continuing operations 1,200 (270) 1,375
Income/(loss) from discontinued operations, net of tax 15 (2) 6
Net income/(loss) 1,215 (272) 1,381
Net income attributable to noncontrolling interests 356 204 78
Net income/(loss) attributable to shareholders 859 (476) 1,303
of which from continuing operations 844 (474) 1,297
of which from discontinued operations 15 (2) 6
Basic earnings per share (CHF)
Basic earnings/(loss) per share from continuing operations 0.47 (0.37) 0.76
Basic earnings/(loss) per share from discontinued operations 0.01 0.00 0.00
Basic earnings/(loss) per share 0.48 (0.37) 0.76
Diluted earnings per share (CHF)
Diluted earnings/(loss) per share from continuing operations 0.47 (0.37) 0.75
Diluted earnings/(loss) per share from discontinued operations 0.01 0.00 0.00
Diluted earnings/(loss) per share 0.48 (0.37) 0.75
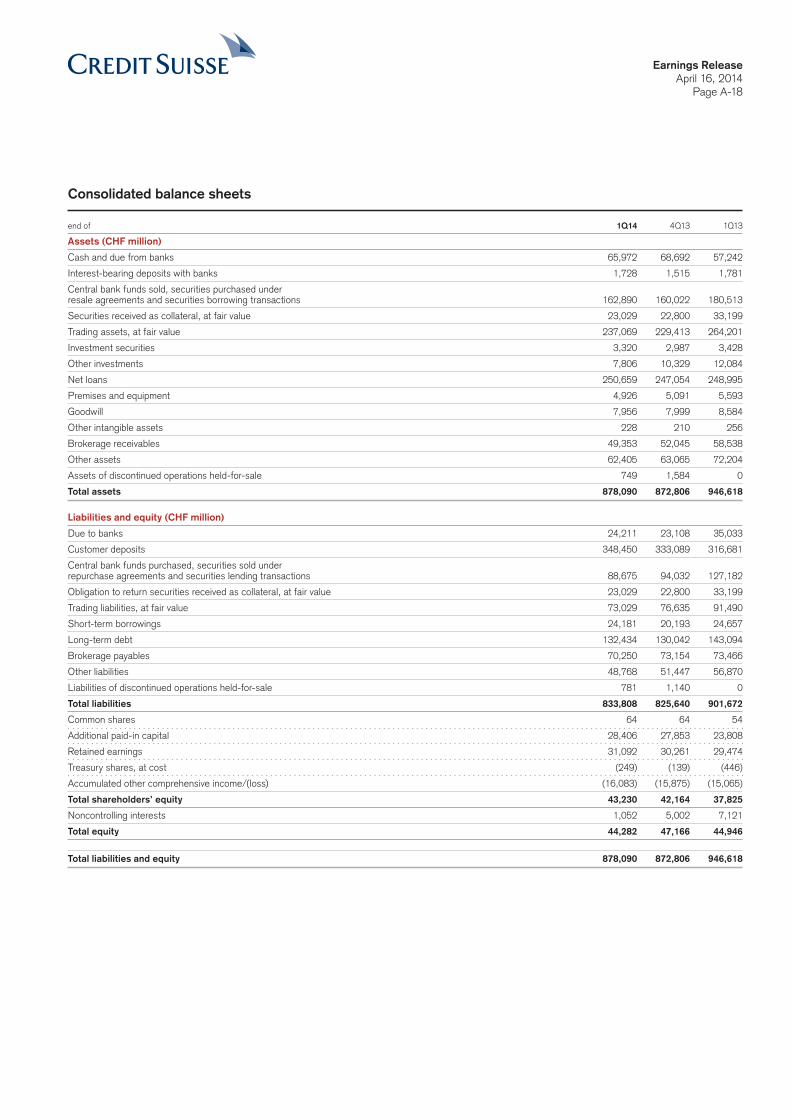
Earnings ReleaseApril 16, 2014
Page A-18
Consolidated balance sheets
end of 1Q14 4Q13 1Q13
Assets (CHF million)
Cash and due from banks 65,972 68,692 57,242
Interest-bearing deposits with banks 1,728 1,515 1,781
Central bank funds sold, securities purchased under
resale agreements and securities borrowing transactions 162,890 160,022 180,513
Securities received as collateral, at fair value 23,029 22,800 33,199
Trading assets, at fair value 237,069 229,413 264,201
Investment securities 3,320 2,987 3,428
Other investments 7,806 10,329 12,084
Net loans 250,659 247,054 248,995
Premises and equipment 4,926 5,091 5,593
Goodwill 7,956 7,999 8,584
Other intangible assets 228 210 256
Brokerage receivables 49,353 52,045 58,538
Other assets 62,405 63,065 72,204
Assets of discontinued operations held-for-sale 749 1,584 0
Total assets 878,090 872,806 946,618
Liabilities and equity (CHF million)
Due to banks 24,211 23,108 35,033
Customer deposits 348,450 333,089 316,681
Central bank funds purchased, securities sold under
repurchase agreements and securities lending transactions 88,675 94,032 127,182
Obligation to return securities received as collateral, at fair value 23,029 22,800 33,199
Trading liabilities, at fair value 73,029 76,635 91,490
Short-term borrowings 24,181 20,193 24,657
Long-term debt 132,434 130,042 143,094
Brokerage payables 70,250 73,154 73,466
Other liabilities 48,768 51,447 56,870
Liabilities of discontinued operations held-for-sale 781 1,140 0
Total liabilities 833,808 825,640 901,672
Common shares 64 64 54
Additional paid-in capital 28,406 27,853 23,808
Retained earnings 31,092 30,261 29,474
Treasury shares, at cost (249) (139) (446)
Accumulated other comprehensive income/(loss) (16,083) (15,875) (15,065)
Total shareholders’ equity 43,230 42,164 37,825
Noncontrolling interests 1,052 5,002 7,121
Total equity 44,282 47,166 44,946
Total liabilities and equity 878,090 872,806 946,618
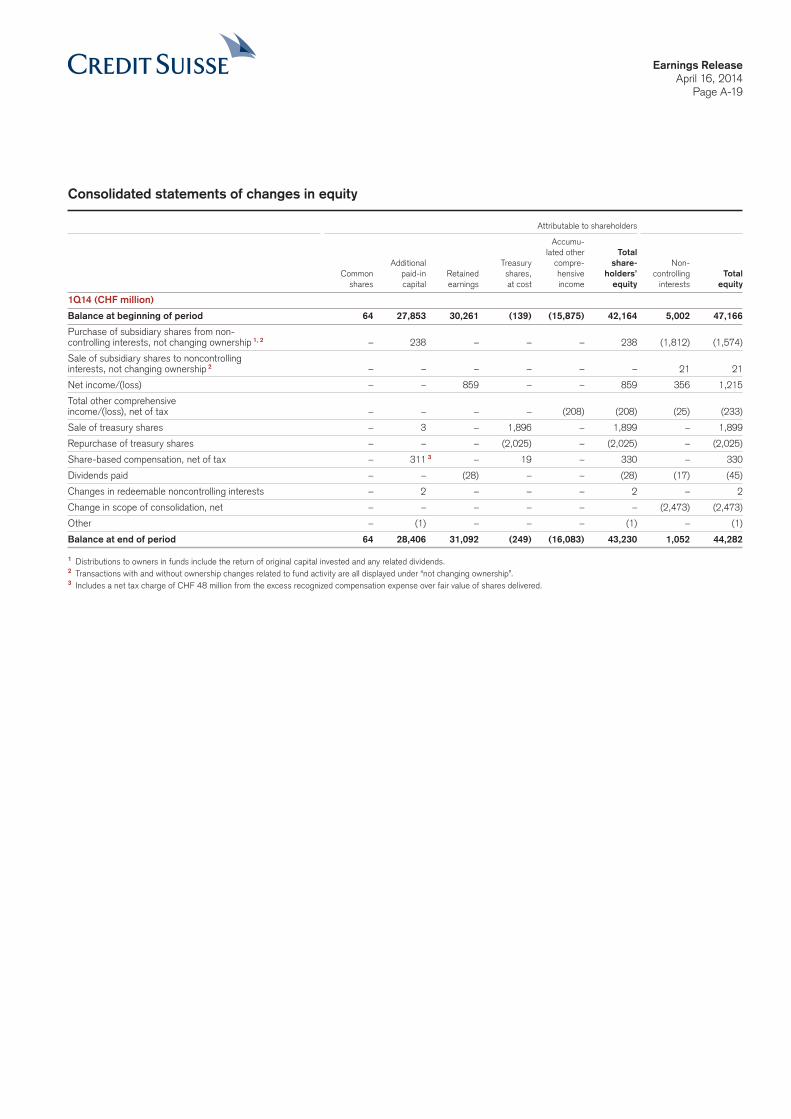
Earnings ReleaseApril 16, 2014
Page A-19
Consolidated statements of changes in equity
Attributable to shareholders
Accumu-
lated other Total
Additional Treasury compre- share- Non-
Common paid-in Retained shares, hensive holders’ controlling Total shares capital earnings at cost income equity interests equity
1Q14 (CHF million)
Balance at beginning of period 64 27,853 30,261 (139) (15,875) 42,164 5,002 47,166
Purchase of subsidiary shares from non-
controlling interests, not changing ownership 1,2 – 238 – – – 238 (1,812) (1,574)
Sale of subsidiary shares to noncontrolling
interests, not changing ownership 2 – – – – – – 21 21
Net income/(loss) – – 859 – – 859 356 1,215
Total other comprehensive
income/(loss), net of tax – – – – (208) (208) (25) (233)
Sale of treasury shares – 3 – 1,896 – 1,899 – 1,899
Repurchase of treasury shares – – – (2,025) – (2,025) – (2,025)
Share-based compensation, net of tax – 311 3 – 19 – 330 – 330
Dividends paid – – (28) – – (28) (17) (45)
Changes in redeemable noncontrolling interests – 2 – – – 2 – 2
Change in scope of consolidation, net – – – – – – (2,473) (2,473)
Other – (1) – – – (1) – (1)
Balance at end of period 64 28,406 31,092 (249) (16,083) 43,230 1,052 44,282
1 Distributions to owners in funds include the return of original capital invested and any related dividends.2 Transactions with and without ownership changes related to fund activity are all displayed under “not changing ownership”.3 Includes a net tax charge of CHF 48 million from the excess recognized compensation expense over fair value of shares delivered.
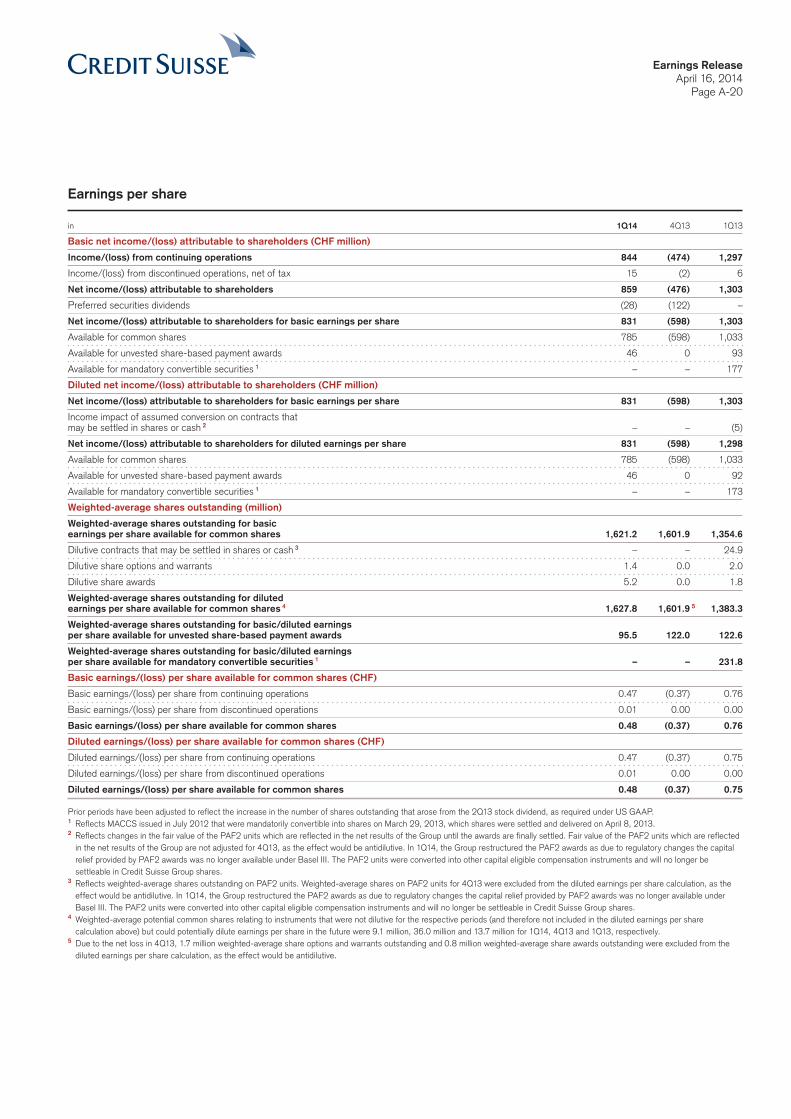
Earnings ReleaseApril 16, 2014
Page A-20
Earnings per share
in 1Q14 4Q13 1Q13
Basic net income/(loss) attributable to shareholders (CHF million)
Income/(loss) from continuing operations 844 (474) 1,297
Income/(loss) from discontinued operations, net of tax 15 (2) 6
Net income/(loss) attributable to shareholders 859 (476) 1,303
Preferred securities dividends (28) (122) –
Net income/(loss) attributable to shareholders for basic earnings per share 831 (598) 1,303
Available for common shares 785 (598) 1,033
Available for unvested share-based payment awards 46 0 93
Available for mandatory convertible securities 1 – – 177
Diluted net income/(loss) attributable to shareholders (CHF million)
Net income/(loss) attributable to shareholders for basic earnings per share 831 (598) 1,303
Income impact of assumed conversion on contracts that
may be settled in shares or cash 2 – – (5)
Net income/(loss) attributable to shareholders for diluted earnings per share 831 (598) 1,298
Available for common shares 785 (598) 1,033
Available for unvested share-based payment awards 46 0 92
Available for mandatory convertible securities 1 – – 173
Weighted-average shares outstanding (million)
Weighted-average shares outstanding for basic
earnings per share available for common shares 1,621.2 1,601.9 1,354.6
Dilutive contracts that may be settled in shares or cash 3 – – 24.9
Dilutive share options and warrants 1.4 0.0 2.0
Dilutive share awards 5.2 0.0 1.8
Weighted-average shares outstanding for diluted
earnings per share available for common shares 4 1,627.8 1,601.9 5 1,383.3
Weighted-average shares outstanding for basic/diluted earnings
per share available for unvested share-based payment awards 95.5 122.0 122.6
Weighted-average shares outstanding for basic/diluted earnings
per share available for mandatory convertible securities 1 – – 231.8
Basic earnings/(loss) per share available for common shares (CHF)
Basic earnings/(loss) per share from continuing operations 0.47 (0.37) 0.76
Basic earnings/(loss) per share from discontinued operations 0.01 0.00 0.00
Basic earnings/(loss) per share available for common shares 0.48 (0.37) 0.76
Diluted earnings/(loss) per share available for common shares (CHF)
Diluted earnings/(loss) per share from continuing operations 0.47 (0.37) 0.75
Diluted earnings/(loss) per share from discontinued operations 0.01 0.00 0.00
Diluted earnings/(loss) per share available for common shares 0.48 (0.37) 0.75
Prior periods have been adjusted to reflect the increase in the number of shares outstanding that arose from the 2Q13 stock dividend, as required under US GAAP.1 Reflects MACCS issued in July 2012 that were mandatorily convertible into shares on March 29, 2013, which shares were settled and delivered on April 8, 2013.2 Reflects changes in the fair value of the PAF2 units which are reflected in the net results of the Group until the awards are finally settled. Fair value of the PAF2 units which are reflected
in the net results of the Group are not adjusted for 4Q13, as the effect would be antidilutive. In 1Q14, the Group restructured the PAF2 awards as due to regulatory changes the capital relief provided by PAF2 awards was no longer available under Basel III. The PAF2 units were converted into other capital eligible compensation instruments and will no longer be settleable in Credit Suisse Group shares.
3 Reflects weighted-average shares outstanding on PAF2 units. Weighted-average shares on PAF2 units for 4Q13 were excluded from the diluted earnings per share calculation, as the effect would be antidilutive. In 1Q14, the Group restructured the PAF2 awards as due to regulatory changes the capital relief provided by PAF2 awards was no longer available under Basel III. The PAF2 units were converted into other capital eligible compensation instruments and will no longer be settleable in Credit Suisse Group shares.
4 Weighted-average potential common shares relating to instruments that were not dilutive for the respective periods (and therefore not included in the diluted earnings per share calculation above) but could potentially dilute earnings per share in the future were 9.1 million, 36.0 million and 13.7 million for 1Q14, 4Q13 and 1Q13, respectively.
5 Due to the net loss in 4Q13, 1.7 million weighted-average share options and warrants outstanding and 0.8 million weighted-average share awards outstanding were excluded from the diluted earnings per share calculation, as the effect would be antidilutive.
Earnings ReleaseApril 16, 2014
Page A-21
Cautionary statement regarding forward-looking information This press release contains statements that constitute forward-looking statements within the meaning of the Private Securities Litigation Reform Act of 1995. In addition, in the future we, and others on our behalf, may make statements that constitute forward-looking statements. Such forward-looking statements may include, without limitation, statements relating to the following:p our plans, objectives or goals;p our future economic performance or prospects;p the potential effect on our future performance of certain contingencies; andp assumptions underlying any such statements.p Words such as “believes,” “anticipates,” “expects,” “intends” and “plans” and similar expressions are intended to identify forward-looking statements
but are not the exclusive means of identifying such statements. We do not intend to update these forward-looking statements except as may be required by applicable securities laws. By their very nature, forward-looking statements involve inherent risks and uncertainties, both general and specific, and risks exist that predictions, forecasts, projections and other outcomes described or implied in forward-looking statements will not be achieved. We caution you that a number of important factors could cause results to differ materially from the plans, objectives, expectations, esti-mates and intentions expressed in such forward-looking statements. These factors include:
p the ability to maintain sufficient liquidity and access capital markets;p market and interest rate fluctuations and interest rate levels;p the strength of the global economy in general and the strength of the economies of the countries in which we conduct our operations, in particular
the risk of continued slow economic recovery or downturn in the US or other developed countries in 2014 and beyond;p the direct and indirect impacts of continuing deterioration or slow recovery in residential and commercial real estate markets;p adverse rating actions by agencies in respect of sovereign issuers, structured credit products or other credit-related exposures;p the ability to achieve our objectives, including improved performance, reduced risks, lower costs, and more efficient use of capital;p the ability of counterparties to meet their obligations to us;p the effects of, and changes in, fiscal, monetary, trade and tax policies, and currency fluctuations;p political and social developments, including war, civil unrest or terrorist activity;p the possibility of foreign exchange controls, expropriation, nationalizations or confiscations in countries where we conduct operations;p operational factors such as systems failure, human error, or the failure to implement procedures properly;p actions taken by regulators with respect to our business and practices in one or more of the countries where we conduct operations;p the effects of changes in laws, regulations or accounting policies or practices;p competition in geographic and business areas in which we conduct our operations;p the ability to retain and recruit qualified personnel;p the ability to maintain our reputation and promote our brand;p the ability to increase market share and control expenses;p technological changes;p the timely development and acceptance of our new products and services and the perceived overall value of these products and services by users;p acquisitions, including the ability to integrate businesses successfully, and divestitures, including the ability to sell non-core assets;p the adverse resolution of litigation and other contingencies;p the ability to achieve our cost efficiency goals and cost targets; andp our success at managing the risks involved in the foregoing.
We caution you that the foregoing list of important factors is not exclusive. When evaluating forward-looking statements, you should carefully consider the foregoing factors and other uncertainties and events, including the information set forth in “Risk Factors” in I – Information on the company in our Annual Report 2013.