Earnings Call 1Q21 Presentation QTD
23
Q1’21 Earnings Call Presentation November 3, 2020
Transcript of Earnings Call 1Q21 Presentation QTD

Q1’21 Earnings Call PresentationNovember 3, 2020

2
Agenda
John Chiminski, Chair & Chief Executive Officer• Q1’21 review
Wetteny Joseph, Senior VP & Chief Financial Officer• Q1’21 business segment financial performance• EBITDA & Adjusted EBITDA• Adjusted Net Income and Adjusted Net Income per Share• Capitalization review• FY’21 financial guidance
Question & Answer Session

3
Disclaimer Statement
Forward-Looking Statements
This presentation contains both historical and forward-looking statements. All statements other than statements of historical fact are, or may be deemed to be, forward-looking statements within the meaning of Section 27A of the Securities Act of 1933, as amended, and Section 21E of the Securities Exchange Act of 1934, as amended. These forward-looking statements generally can be identified by the use of statements that include phrases such as “believe,” “expect,” “anticipate”, “intend”, “estimate”, “plan”, “project”, “foresee”, “likely”, “may”, “will”, “would” or other words or phrases with similar meanings. Similarly, statements that describe our objectives, plans or goals are, or may be, forward-looking statements. These statements are based on current expectations of future events. If underlying assumptions prove inaccurate or unknown risks or uncertainties materialize, actual results could vary materially from our expectations and projections. Some of the factors that could cause actual results to differ include, but are not limited to, the following: the current or future effects of the COVID-19 pandemic on our and clients' businesses; general industry conditions and competition; product or other liability risk inherent in the design, development, manufacture, and marketing of our offerings; difficulties in providing goods and services meeting the quality standards expected by our customers or our regulators; interruptions of, or other difficulties in procuring needed inputs from, our supply chain; inability to enhance our existing or introduce new technology or services in a timely manner; economic conditions, such as interest rate and currency exchange rate fluctuations; technological advances and patents attained by competitors; risks generally associated with advanced electronic information systems; our substantial debt and debt service requirements, which may restrict our operating and financial flexibility and impose significant interest and financial costs; and risks associated with timely and successfully completing, and correctly anticipating the future demand predicted for, capital expansion projects at our existing facilities, or difficulty in completing acquisitions or integrating them into our existing business, thereby reducing or eliminating their anticipated benefits.
For a more detailed discussion of these and other factors, see the information under the caption “Risk Factors” in our Annual Report on Form 10-K for the fiscal year ended June 30, 2020 filed with the Securities and Exchange Commission. All forward-looking statements in this presentation speak only as of the date of this presentation or as of the date they are made, and we do not undertake to update any forward-looking statement as a result of new information or future events or developments unless and to the extent required by law.

4
Disclaimer Statement - Continued
Non-GAAP Financial Measures
Management measures operating performance based on consolidated earnings from operations before interest expense, expense/(benefit) for income taxes, and depreciation and amortization, adjusted for the income or loss attributable to non-controlling interests (“EBITDA from operations”). EBITDA from operations is not defined under U.S. GAAP, is not a measure of operating income, operating performance, or liquidity presented in accordance with U.S. GAAP, and is subject to important limitations.
We believe that the presentation of EBITDA from operations enhances an investor’s understanding of our financial performance. We believe this measure is a useful financial metric to assess our operating performance across periods by excluding certain items that it believes are not representative of our core business and uses this measure for business planning purposes.
In addition, given the significant investments that Catalent has made in the past in property, plant and equipment, depreciation and amortization expenses represent a meaningful portion of our cost structure. We believe that EBITDA from operations will provide investors with a useful tool for assessing the comparability between periods of our ability to generate cash from operations sufficient to pay taxes, to service debt, and to undertake capital expenditures because it eliminates non-cash depreciation and amortization expense. We present EBITDA from operations in order to provide supplemental information that it considers relevant for the readers of our consolidated financial statements, and such information is not meant to replace or supersede U.S. GAAP measures. Our definition of EBITDA from operations may not be the same as similarly titled measures used by other companies.
We evaluate the performance of our segments based on segment earnings before non-controlling interest, other (income)/expense, impairments, restructuring costs, interest expense, income tax expense/(benefit), and depreciation and amortization (“segment EBITDA”). Moreover, under our credit agreement, our ability to engage in certain activities, such as incurring certain additional indebtedness, making certain investments and paying certain dividends, is tied to ratios based on Adjusted EBITDA, which is not defined under U.S. GAAP, is not a measure of operating income, operating performance, or liquidity presented in accordance with U.S. GAAP, and is subject to important limitations. Adjusted EBITDA is the covenant compliance measure used in the credit agreement governing debt incurrence and restricted payments. Because not all companies use identical calculations, our presentation of Adjusted EBITDA may not be comparable to other similarly titled measures of other companies.

5
Disclaimer Statement - Continued
Management also measures operating performance based on Adjusted Net Income/(Loss) and Adjusted Net Income/(Loss) per share. Adjusted Net Income/(Loss) is not defined under U.S. GAAP, is not a measure of operating income, operating performance, or liquidity presented in accordance with U.S. GAAP, and is subject to important limitations. We believe that the presentation of Adjusted Net Income/(Loss) and Adjusted Net Income/(Loss) per share enhances an investor’s understanding of our financial performance. We believe these measures are useful financial metrics to assess our operating performance across periods by excluding certain items that we believe are not representative of our core business and we use these measures for business planning purposes. We define Adjusted Net Income/(Loss) as net earnings/(loss) adjusted for amortization attributable to purchase accounting and adjustments for other cash and non-cash items included in the table below, partially offset by our estimate of the tax effects of such cash and non-cash items. We believe that Adjusted Net Income/(Loss) and Adjusted Net Income/(Loss) per share provides investors with a useful tool for assessing the comparability between periods of our ability to generate cash from operations available to our stockholders. Our definition of Adjusted Net Income/(Loss) may not be the same as similarly titled measures used by other companies.
The most directly comparable U.S. GAAP measure to EBITDA from operations is operating earnings/(loss). The most directly comparable U.S. GAAP measure to Adjusted EBITDA and Adjusted Net Income/(Loss) is net earnings/(loss). Included in this release is a reconciliation of operating earnings/(loss) to EBITDA and a reconciliation of net earnings/(loss) to Adjusted EBITDA and Adjusted Net Income.
We do not provide a reconciliation of forward-looking non-GAAP financial measures to our comparable U.S. GAAP financial measures because it could not do so without unreasonable effort due to the unavailability of the information needed to calculate reconciling items and due to the variability, complexity and limited visibility of the adjusting items that would be excluded from the non-GAAP financial measures in future periods. When planning, forecasting, and analyzing future periods, we do so primarily on a non-GAAP basis without preparing a U.S. GAAP analysis as that would require estimates for various cash and non-cash reconciling items that would be difficult to predict with reasonable accuracy. For example, equity compensation expense would be difficult to estimate because it depends on our future hiring and retention needs, as well as the future fair market value of our common stock, all of which are difficult to predict and subject to constant change. It is equally difficult to anticipate the need for or magnitude of a presently unforeseen one-time restructuring expense or the values of end-of-period foreign currency exchange rates. As a result, we do not believe that a U.S. GAAP reconciliation would provide meaningful supplemental information about our outlook.

6
1st Quarter Fiscal 2021 Financial Summary1
(Dollars in millions, except per-share data)Period-over-period growth As Reported %: Constant Currency %
27%:26% 37%:35%
93%
Organic Growth – Q1 FY'21
Net Revenue 20 %
Adjusted EBITDA 23 %
65%
Net Revenue$845.7
$664.7
Q1 2021 Q1 2020
Adjusted EBITDA$174.4
$127.1
Q1 2021 Q1 2020
Adjusted Net Incomeper Diluted Share
$0.43
$0.26
Q1 2021 Q1 2020
Adjusted Net Income$78.1
$40.5
Q1 2021 Q1 2020
Organic revenue and Adjusted EBITDA growth exclude the impact of foreign currency, acquisitions of operating or legal entities, and divestitures within the year.
1For reconciliation of non-GAAP measures to the most directly comparable GAAP measure, see slides 12 and 13

7
1st Quarter Fiscal 2021 Highlights
Segment Performance
• Robust demand in Biologics across drug product, drug substance, and cell and gene therapy, in part driven by COVID-19 response projects
• Demand softness in SOT and OSD, in part due to COVID-19 pandemic• CSS returns to growth as global clinical trials resume
COVID-19 Response
• COVID-19 response wins now involving more than 60 compounds, including some with projects in multiple segments
Highlighted Growth Projects
• Drug Product (Bloomington): New $50M high-speed vial line (Apr'21); $14M acquisition/build-out of nearby facility for clinical fill/finish (Jan'21)
• Gene therapy (BWI): $130M expansion in adjacent facility for 5 new suites; making 15 suites in total when all completed in CY'22
• Cell therapy (Belgium): Agreement to acquire 41k sq ft facility
Highlighted Innovation
• Partnership with Exelixis to develop antibody-drug conjugates• Cell therapy manufacturing for potential ALS treatment• OptiGel® DR: new tech for delayed/enteric release softgels
S&P 500 • Added to S&P 500® Index on September 21st
FY 2021 Guidance
• Raising guidance to reflect performance in Q1 and to account for higher underlying net demand

Quarter Ended As ReportedInc. / (Dec.)
Constant CurrencyInc. / (Dec.)
Organic Growth Constant Currency
(USD M) Sep 30, 2020 Sep 30, 2019 $ % $ % %
Biologics
Net Revenue 377.1 188.6 188.5 100 % 185.1 98 % 83 %
Segment EBITDA 106.5 35.8 70.7 197 % 69.5 194 % 179 %
EBITDA Margin 28.2 % 19.0 % 920 bps 918 bps
8
Biologics Segment
• Robust demand for global drug product, drug substance, and cell and gene therapy offerings
• COVID-19-related programs were a notable contributor to net revenue and Segment EBITDA growth
• Acquisitions contributed 15 percentage points of growth to both net revenue and Segment EBITDA
• Substantial margin expansion driven by higher utilization, and addition of new gene therapy suite (BWI), which became operational in Q1'21
• Biologics segment represented 44% of total net revenue in Q1'21, compared to 28% in Q1'20
Biologics revenue doubles due to robust demand and COVID-19 programsRevenue Stream
$89.9 $64.4
$287.2
$124.2
Manufacturing & CommercialProduct SupplyDevelopment Services
Q1 2021 Q1 2020

9
• Reduced demand for prescription products within North America
• Lower global demand in consumer health (CH) products, particularly in cough, cold, and over-the-counter pain relief products
• Margin decrease due in part to COVID-19-related costs and prevention efforts, including less efficient production workflows
• Q2'20 divestiture of CH site in Australia hurt net revenue and Segment EBITDA growth, but enhanced EBITDA margin
• 41% increase in development revenue is a good indicator for longer-term growth
Softgel and Oral Technologies (SOT) Segment
Quarter Ended As ReportedInc. / (Dec.)
Constant CurrencyInc. / (Dec.)
Organic Growth Constant Currency
(USD M) Sep 30, 2020 Sep 30, 2019 $ % $ % %
Softgel and Oral Technologies
Net Revenue 221.1 263.7 (42.6) (16) % (44.6) (17) % (12) %
Segment EBITDA 37.8 46.4 (8.6) (18) % (9.4) (20) % (21) %
EBITDA Margin 17.1 % 17.6 % (50) bps (71) bps
Reduced volumes in Rx and CH drive decline in Q1'21Revenue Stream
$190.6$242.0
$30.5
$21.7
Manufacturing & CommercialProduct SupplyDevelopment Services
Q1 2021 Q1 2020
Quarter Ended As ReportedInc. / (Dec.)
Constant CurrencyInc. / (Dec.)
Organic Growth Constant Currency
(USD M) Sep 30, 2020 Sep 30, 2019 $ % $ % %
Oral and Specialty Delivery
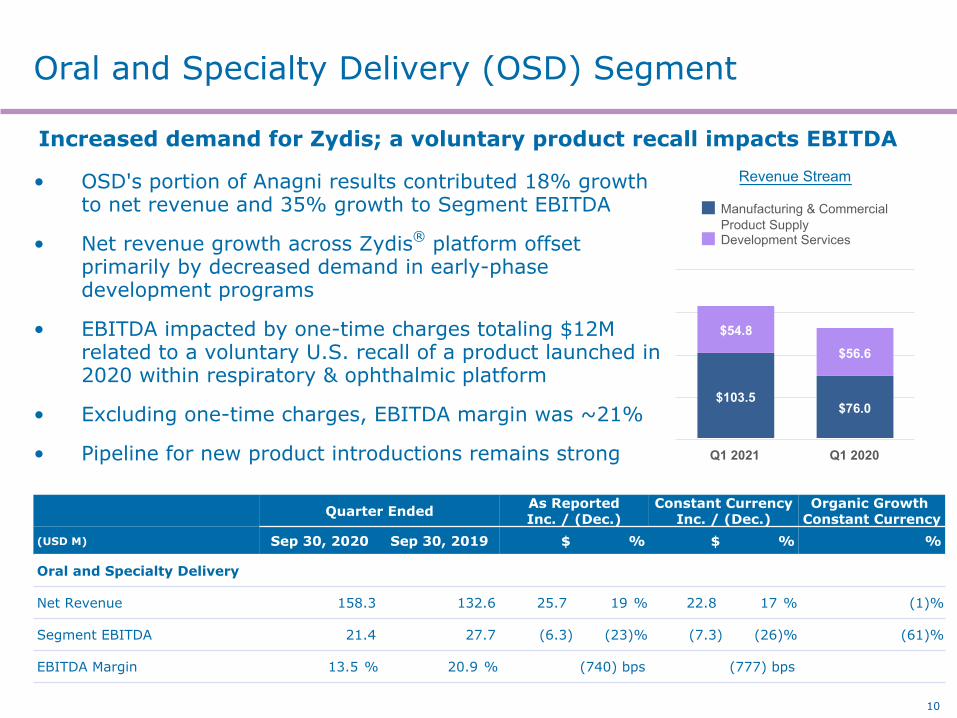
Net Revenue 158.3 132.6 25.7 19 % 22.8 17 % (1) %
Segment EBITDA 21.4 27.7 (6.3) (23) % (7.3) (26) % (61) %
EBITDA Margin 13.5 % 20.9 % (740) bps (777) bps
10
Oral and Specialty Delivery (OSD) Segment
• OSD's portion of Anagni results contributed 18% growth to net revenue and 35% growth to Segment EBITDA
• Net revenue growth across Zydis® platform offset primarily by decreased demand in early-phase development programs
• EBITDA impacted by one-time charges totaling $12M related to a voluntary U.S. recall of a product launched in 2020 within respiratory & ophthalmic platform
• Excluding one-time charges, EBITDA margin was ~21%
• Pipeline for new product introductions remains strong
Increased demand for Zydis; a voluntary product recall impacts EBITDARevenue Stream
$103.5$76.0
$54.8
$56.6
Manufacturing & CommercialProduct SupplyDevelopment Services
Q1 2021 Q1 2020

11
• Strong demand in storage and distribution offerings across all regions, offset, in part, by decreased demand for manufacturing and packaging within North America
• Backlog of $428M at Sept 30, 2020, compared to $425M at June 30, 2020 and $374M at Sept 30, 2019
• Net new business wins of $99M, a 6% increase over the prior-year period; LTM book-to-bill ratio of 1.1x
Clinical Supply Services (CSS) Segment
Quarter Ended As ReportedInc. / (Dec.)
Constant CurrencyInc. / (Dec.)
Organic Growth Constant Currency
(USD M) Sep 30, 2020 Sep 30, 2019 $ % $ % %
Clinical Supply Services
Net Revenue 92.7 84.6 8.1 10 % 6.6 8 % 8 %
Segment EBITDA 25.0 21.6 3.4 16 % 2.7 13 % 13 %
EBITDA Margin 27.0 % 25.5 % 150 bps 114 bps
Return to growth in Q1'21 following disruption of clinical trials in Q4'20
Revenue Stream
$92.7 $84.6
Clinical Supply Services
Q1 2021 Q1 2020

12
Adjusted EBITDA
Quarter Ended(USD M) Sep 30,
2019Dec 31,
2019Mar 31,
2020Jun 30,
2020Sep 30,
2020
Net earnings $ 0.1 $ 45.5 $ 20.9 $ 154.2 $ 82.4
Interest expense, net 36.3 34.9 34.4 20.5 25.3
Income tax expense/(benefit) (6.9) 13.0 8.8 24.8 (15.0)
Depreciation and amortization 60.6 61.9 64.8 66.4 69.1
EBITDA from operations $ 90.1 $ 155.3 $ 128.9 $ 265.9 $ 161.8
Equity compensation 16.6 10.3 8.6 12.6 18.7
Impairment charges and (gain)/loss on sale of assets (0.2) 1.7 0.6 3.4 1.8
Financing-related expenses and other 0.1 — 16.0 0.2 —
U.S. GAAP restructuring and other 0.7 0.5 1.3 3.0 0.9
Acquisition, integration, and other special items 11.1 7.5 7.5 10.6 4.0
Foreign exchange loss/(gain) (included in other, net) (0.1) 5.5 (3.8) (0.1) (3.8)
Other adjustments 8.8 (9.8) 26.3 (28.2) (9.0)
Adjusted EBITDA $ 127.1 $ 171.0 $ 185.4 $ 267.4 $ 174.4
FX impact 2.2
Adjusted EBITDA at constant currency $ 172.2

13
Adjusted Net Income and ANI per Share
Quarter Ended
(In millions, except per share data) Sep 30, 2019
Dec 31, 2019
Mar 31, 2020
Jun 30, 2020
Sep 30, 2020
Net earnings $ 0.1 $ 45.5 $ 20.9 $ 154.2 $ 82.4
Amortization 21.5 21.8 23.0 22.5 22.9
Equity compensation 16.6 10.3 8.6 12.6 18.7
Impairment charges and (gain)/loss on sale of assets (0.2) 1.7 0.6 3.4 1.8
Financing-related expenses and other 0.1 — 16.0 0.2 —
U.S. GAAP restructuring and other 0.7 0.5 1.4 3.0 0.9
Acquisition, integration, and other special items 11.1 7.5 7.6 10.6 4.0
Foreign exchange loss/(gain) (included in other, net) (0.1) 5.5 (3.9) (0.1) (3.8)
Other adjustments 8.8 (9.8) 26.2 (28.3) (9.0)
Estimated tax effect of adjustments (12.1) (10.5) (17.7) (7.0) (8.6)
Discrete income tax expense items (6.0) (0.5) 0.2 (16.7) (31.2)
Adjusted Net Income (ANI) $ 40.5 $ 72.0 $ 82.9 $ 154.4 $ 78.1
Weighted average diluted shares outstanding 160.9 179.6
Adjusted Net Income per diluted share $ 0.26 $ 0.43

14
Debt and Capital Allocation
Debt Structure
• Long-term net leverage target of 3.0x
• Covenant-light structure for all senior debt, with attractive cost of capital and maturity profile
• No significant maturity until 2026
• Rates fixed on 85% of debt
• Weighted average interest rate <3.7%
Capital Allocation
• FY’21 capex expected to be 15-16% of net revenue, driven by investments in the Biologics segment
• Ongoing capital allocation will be focused on:
– Capex to drive organic growth
– M&A to supplement organic growth
– Debt reduction
(USD M) 9/30/19 6/30/20 9/30/20
Incremental Term Loan, due 2026 (USD) 934 929 927
Term Loan, due 2024 (EUR) 333 — —
Total Secured Debt 1,267 929 927
Senior Notes, due 2024 (EUR), 4.750% 412 — —
Senior Notes, due 2026 (USD), 4.875% 445 445 446
Senior Notes, due 2027 (USD), 5.000% 492 493 493
Senior Notes, due 2028 (EUR), 2.375% — 910 945
Finance Leases / Other 172 143 151
Deferred Purchase Price 145 98 98
Total Unsecured Debt 1,666 2,089 2,133
Total Debt 2,933 3,018 3,060
Cash and Cash Equivalents 243 953 1,007
Total Net Debt 2,690 2,065 2,053
LTM Adjusted EBITDA 627 751 798
Net Sr. Secured Debt / Adj. EBITDA 1.6x n.a.1 n.a.1
Net Debt / Adj. EBITDA 4.3x 2.8x 2.6x
Total net leverage ratio of 2.6x at end of Q1'21
1Cashandcashequivalentsexceedtotalsecureddebt

Revised Guidance Notes and Assumptions:
• Raising guidance to reflect performance in Q1 and to account for higher net underlying demand, including increased demand related to potential COVID-19 treatments and vaccines as well as lower demand attributed to the effects of the pandemic in some offerings
• Guidance continues to assume no major external change to the current status of the COVID-19 pandemic and its current effect on our business
• Guidance does not assume regulatory approval for our customers’ COVID-19 vaccine candidates, but does include the effects of take-or-pay terms in their agreements
• Ranges are broader than in recent years due to the increased uncertainty created by the COVID-19 pandemic
• Exchange rates: 1.28 USD/GBP, 1.17 USD/EUR
1 Share count is fully diluted and represents the weighted average as of June 30; includes ~13M of as-if converted shares from the May 2019 issuance of Series A convertible preferred stock
(USD M) FY'20 FY'21 Guidance
Actual Prior Revised % GrowthRange Low Mid High Low Mid High
Net Revenue $ 3,094 $ 3,450-3,600 $ 3,580 $ 3,680 $ 3,780 16 % 19 % 22 %
Adjusted EBITDA $ 751 $ 840-890 $ 880 $ 915 $ 950 17 % 22 % 26 %
Adj. Net Income $ 350 $ 390-435 $ 410 $ 440 $ 470 17 % 26 % 34 %
Share Count(1) 165M 178-180M 178M 179M 180M
Fiscal 2021 Guidance Increased
15

16
Appendix

Q1’21 by Business Segment
(USD M) Quarter Ended
Quarter Ended Increase/ (Decrease)
Excluding FXIncrease/ (Decrease)
Sep 30,2020
Sep 30,2019 $ % $ %
Biologics
Net revenue 377.1 188.6 188.5 100 % 185.1 98 %Segment EBITDA 106.5 35.8 70.7 197 % 69.5 194 %
Softgel and Oral Technologies
Net revenue 221.1 263.7 (42.6) (16) % (44.6) (17) %Segment EBITDA 37.8 46.4 (8.6) (18) % (9.4) (20) %
Oral and Specialty Delivery
Net revenue 158.3 132.6 25.7 19 % 22.8 17 %Segment EBITDA 21.4 27.7 (6.3) (23) % (7.3) (26) %
Clinical Supply Services
Net revenue 92.7 84.6 8.1 10 % 6.6 8 %Segment EBITDA 25.0 21.6 3.4 16 % 2.7 13 %
Revenue elimination (3.5) (4.8) 1.3 27 % 1.4 29 %Unallocated costs (28.9) (41.4) 12.5 30 % 14.2 34 %Combined totals
Net revenue 845.7 664.7 181.0 27 % 171.3 26 %EBITDA from operations 161.8 90.1 71.7 80 % 69.7 77 %
17

Quarterly Net Revenue by Type of Activity and Geography
18
(USD M) Q1'19 Q2'19 Q3'19 Q4'19 Q1'20 Q2'20 Q3'20 Q4'20 Q1'21
Manufacturing&CommercialProductSupply2
$ 332.4 $ 379.5 $ 399.4 $ 454.6 $ 379.2 $ 416.4 $ 430.0 $ 511.9 $ 384.0
DevelopmentServices2
144.2 165.8 142.1 192.2 202.6 219.9 243.7 355.8 372.5
ClinicalSupplyServices
77.7 80.8 77.8 85.1 84.6 87.9 88.9 83.6 92.7
Subtotal $ 554.3 $ 626.1 $ 619.3 $ 731.9 $ 666.4 $ 724.2 $ 762.6 $ 951.3 $ 849.2
Intercompanyrevenueelimination2
(2.5) (3.1) (1.8) (6.2) (1.7) (2.8) (2.0) (3.7) (3.5)
Netrevenue $ 551.8 $ 623.0 $ 617.5 $ 725.7 $ 664.7 $ 721.4 $ 760.6 $ 947.6 $ 845.7
$554.3$626.1 $619.3
$731.9$666.4
$762.6$724.2
$951.3
18
$849.2
(USD M) YTDQ1'21
UnitedStates $ 516.9
Europe 281.4
InternationalOther 68.8
Subtotal $ 867.1
Eliminationofrevenueattributabletomultiplelocations
(21.4)
Total $ 845.7
1Allcharteddataisshownpriortointercompanyeliminations
Net Revenue by Geographic Source1
Net Revenue by Type of Activity1
2Netrevenuebyactivitytypehasbeenadjustedfrompriorfilingsduetoanupdateinrevenueeliminations
(USD M)

Quarterly Net Revenue by Segment
19
(USD M) Q1'19 Q2'19 Q3'19 Q4'19 Q1'20 Q2'20 Q3'20 Q4'20 Q1'21
Biologics $ 125.7 $ 136.4 $ 133.7 $ 177.5 $ 188.6 $ 225.2 $ 250.0 $ 357.8 $ 377.1
Softgel&OralTechnologies1 240.1 254.4 254.0 290.7 260.6 267.9 242.3 291.2 221.1
Oral&SpecialtyDelivery 110.8 154.5 153.8 178.6 132.6 143.2 181.4 218.7 158.3
ClinicalSupplyServices 77.7 80.8 77.8 85.1 84.6 87.9 88.9 83.6 92.7
Subtotal $ 554.3 $ 626.1 $ 619.3 $ 731.9 $ 666.4 $ 724.2 $ 762.6 $ 951.3 $ 849.2
Inter-segmentrevenueelimination1
(2.5) (3.1) (1.8) (6.2) (1.7) (2.8) (2.0) (3.7) (3.5)
Netrevenue $ 551.8 $ 623.0 $ 617.5 $ 725.7 $ 664.7 $ 721.4 $ 760.6 $ 947.6 $ 845.7
$554.3
$626.1 $619.3
$731.9
$666.4$724.2
$762.6
$951.3
$849.2
1Netrevenuebysegmenthasbeenadjustedfrompriorfilingsduetoanupdateinrevenueeliminations
(USD M)

Quarterly EBITDA from Operations by Segment
20
(USD M) Q1'19 Q2'19 Q3'19 Q4'19 Q1'20 Q2'20 Q3'20 Q4'20 Q1'21
Biologics $ 27.0 $ 39.1 $ 35.8 $ 45.0 $ 35.8 $ 63.0 $ 51.9 $ 86.9 $ 106.5
Softgel&OralTechnologies 41.3 54.7 56.3 84.0 46.4 64.5 60.1 85.5 37.8
Oral&SpecialtyDelivery 18.9 46.0 49.0 61.2 27.7 33.1 56.2 83.8 21.4
ClinicalSupplyServices 20.2 21.0 20.3 22.9 21.6 24.0 24.6 21.0 25.0
Subtotal $ 107.4 $ 160.8 $ 161.4 $ 213.1 $ 131.5 $ 184.6 $ 192.8 $ 277.2 $ 190.7
Unallocatedcosts (39.8) (29.4) (26.0) (47.7) (41.4) (29.4) (63.9) (11.3) (28.9)
EBITDAfromoperations1 $ 67.6 $ 131.4 $ 135.4 $ 165.4 $ 90.1 $ 155.2 $ 128.9 $ 265.9 $ 161.8
$107.4
$161.4$160.8
$213.1
$131.5
$184.6$192.8
$277.2
1ForreconciliationsofEBITDAfromoperationsforFY’20andFY'21tonetearnings,themostdirectlycomparablemeasureunderU.S.GAAP,seeslide12
$190.7
(USD M)

FX Impact on Net Revenue
21

CSS - Backlog and order trends
(USD M) Q1'20 Q2'20 Q3'20 Q4'20 Q1'21
Netnewbusinesswins
$93 $104 $96 $104 $99
TTMbook-to-bill 1.2x 1.2x 1.1x 1.1x 1.1x
Backlogatquarterend
$374 $390 $396 $425 $428
22

discover more.CATALENT, INC.14 SCHOOLHOUSE ROADSOMERSET, NJ 08873+ 1 866 720 3148www.catalent.com