Earnhardt 2009
24
Zoo Biology 28: 230–252 (2 009) RESEARCH ARTICLE Extinction Risk Assessment for the Species Survival Plan (SSP s ) Population of the Bali Mynah (Leucopsar rothschildi ) Joanne M. Earnhardt, Steven D. Thompson, and Lisa J. Faust Alexander Center for Applied Population Biology, Lincoln Park Zoological Gardens, Chicago, Illinois The Bal i myn ah Speci es Sur viva l Pla n (SSP s ), an As soci at ion of Zoos and Aquariums program, strives to maintain the genetic and demographic health of it s po pulati on, avoi d unpl anne d changes in si ze, and mi ni mi ze th e ri sk of popul ati on ext inc tio n. The SSP popul ati on meets current demogr aph ic and genetic objectives with a population size of 209 birds at 61 institutions and 96% genetic diversity (GD) retained from the source population. However, participat- ing ins tit ut ion s hav e exp res sed con cer ns reg ard ing spa ce all oca tio n, tar get population size (TPS), breeding restrictions, inbreeding depression, and harvest in relation to future population availability and viability. Based on these factors, we assess five ques ti ons wi th a quanti tative ri sk assessme nt , speci fically a population viability analysis (PVA) using ZooRisk software. Using an individual- based stochastic model, we project potential population changes under different conditions (e.g. changes in TPS and genetic management) to identify the most eff ect ive man age men t act ion s. Our pro jec tio ns ind icate that und er current management conditions, population decline and extinction are unlikely and that although GD will decline over 100 years the projected loss does not exceed levels accept able to popu lation managers (l ess than 90% GD retained). Mode l simulations indicate that the combination of two genetic management strategies (i.e. priority breeding based on mean kinship and inbreeding avoidance) benefits the retention of GD and reduces the accumulation of inbreeding. The current TPS (250) is greater than necessary to minimize the risk of extinction for the SSP po pulati on bu t any re duct ion in TPS must be accompanied by cont inue d Publis hed online 20 January 2009 in Wiley InterScien ce (www.i ntersc ience. wiley. com). DOI 10.1002/z oo.20228 Received 17 July 2007; Revised 14 October 2008; Accepted 2 December 2008 Correspondence to: Joanne Earnhardt, Alexander Center for Applied Population Biology, Lincoln Park Zoo, 2001 N Clark St., Chicago, IL 60614. E-mail: [email protected] 2009 Wiley-Liss, Inc.
-
Upload
annisa-dwi-septiani -
Category
Documents
-
view
218 -
download
0
Transcript of Earnhardt 2009

8/17/2019 Earnhardt 2009
http://slidepdf.com/reader/full/earnhardt-2009 1/23
Zoo Biology 28 : 230–252 (2009)
RESEARCH ARTICLE
Extinction Risk Assessment for theSpecies Survival Plan (SSPs)
Population of the Bali Mynah(Leucopsar rothschildi )Joanne M. Earnhardt, Steven D. Thompson, and Lisa J. Faust
Alexander Center for Applied Population Biology, Lincoln Park Zoological Gardens,Chicago, Illinois
The Bali mynah Species Survival Plan (SSPs), an Association of Zoos andAquariums program, strives to maintain the genetic and demographic health of its population, avoid unplanned changes in size, and minimize the risk of
population extinction. The SSP population meets current demographic andgenetic objectives with a population size of 209 birds at 61 institutions and 96%genetic diversity (GD) retained from the source population. However, participat-ing institutions have expressed concerns regarding space allocation, targetpopulation size (TPS), breeding restrictions, inbreeding depression, and harvestin relation to future population availability and viability. Based on these factors,we assess five questions with a quantitative risk assessment, specifically apopulation viability analysis (PVA) using ZooRisk software. Using an individual-based stochastic model, we project potential population changes under differentconditions (e.g. changes in TPS and genetic management) to identify the mosteffective management actions. Our projections indicate that under currentmanagement conditions, population decline and extinction are unlikely and thatalthough GD will decline over 100 years the projected loss does not exceed levelsacceptable to population managers (less than 90% GD retained). Modelsimulations indicate that the combination of two genetic management strategies(i.e. priority breeding based on mean kinship and inbreeding avoidance) benefitsthe retention of GD and reduces the accumulation of inbreeding. The current TPS(250) is greater than necessary to minimize the risk of extinction for the SSPpopulation but any reduction in TPS must be accompanied by continued
Published online 20 January 2009 in Wiley InterScience (www.interscience.wiley.com).
DOI 10.1002/zoo.20228
Received 17 July 2007; Revised 14 October 2008; Accepted 2 December 2008
Correspondence to: Joanne Earnhardt, Alexander Center for Applied Population Biology, Lincoln Park
Zoo, 2001 N Clark St., Chicago, IL 60614. E-mail: [email protected]
2009 Wiley-Liss, Inc.

8/17/2019 Earnhardt 2009
http://slidepdf.com/reader/full/earnhardt-2009 2/23
application of genetic management. If carefully planned, birds can be harvestedfor transfer to Bali for a reintroduction program without jeopardizing the SSPpopulation. Zoo Biol 28:230–252, 2009. r 2009 Wiley-Liss, Inc.
Keywords: demography; genetic diversity; population management; population viability
analysis; stochasticity; ZooRisk
INTRODUCTION
The Bali mynah Species Survival Plan (SSPs), an Association of Zoos and
Aquariums (AZA) cooperative breeding and management program, strives to
maintain a captive population size that can meet the program’s educational
and conservation goals far into the future (http://www.aza.org/ConScience/
ConScienceSSPFact/index.html). Almost all captive populations are small [sensu
Soule ´ , 1987] and thus at risk of extinction from demographic and environmentalstochasticity [Lacy, 1987], loss of genetic diversity (GD), and the interactions of
population structure, stochasticity, and GD [Schaffer, 1981; Gilpin and Soule ´ , 1986].
To minimize the risk of extinction, SSPs actively manage captive populations to
minimize the loss of GD [Lacy, 1987, 1994; Ballou and Lacy, 1995] and avoid large
fluctuations in population size and structure [Ballou and Foose, 1996]. Ideally, these
management strategies lead to captive populations that are self-sustaining and, when
appropriate, able to provide animals for reintroduction into the wild [e.g. Lacy,
1994]. Since the early 1980s the population size and composition of the Bali Mynah
SSP has met AZA’s standard genetic and demographic objectives [Ballou and Foose,
1996; Long et al., 2005]; however, SSP participants are concerned about the ability tosustain this population into the future. The current practice regulates population
growth by limiting the number of birds allowed to breed; managers perceive this
regulation as a risk that may compromise their ability to have a self-sustaining
population in the future. The purpose of this study is to conduct a simulation-based
extinction risk assessment of the SSP population and evaluate a range of possible
management strategies with respect to their impact on population size and extinction
risk.
AZA’s SSP management practices require substantial investments in planning,
husbandry, exchange of animals between institutions, and veterinary care. The Bali
Mynah SSP holds annual meetings to determine which birds should breed [Ballouand Lacy, 1995] and how many offspring are needed to meet objectives for
population size, GD, and population structure [Ballou and Foose, 1996]. Every year
a Breeding and Transfer Plan containing recommendations for each bird to either (1)
breed or not breed and/or (2) to move or remain at its current facility is distributed
to all AZA institutions holding Bali mynahs. For example, to meet the SSP
population size objective of 209 birds in 2005, 39 pairs were recommended to breed
and to meet the genetic objective, 22 of those were new pairs many of which required
transfers between zoos [Long et al., 2005]. Although the AZA PACT (Passerine
Taxon Advisory Group) has recommended that AZA members provide space for a
total of 250 Bali mynahs (PACT RCP, 2002), since 1997 the SSP has controlled
reproduction to maintain a population size of around 200 birds because additionalspace has not been available [Long et al., 2005]. Thus, the target population size
231Bali Mynah Risk Assessment
Zoo Biology

8/17/2019 Earnhardt 2009
http://slidepdf.com/reader/full/earnhardt-2009 3/23
(TPS5 250) established by the TAG is greater than the functional carrying capacity
(K) of AZA institutions.
One of the SSP’s long-term goals is to maintain a captive population that can
be used to supplement the wild population of Bali mynahs. The Bali mynah
(Leucopsar rothschildi ) is endemic to the island of Bali, Indonesia. Once thought tohave numbered in the thousands, the wild population has hovered near extinction for
at least 25 years [PHPA/Bird Life International IP, 1997]. The species is thought to
have declined because of extrinsic anthropogenic factors, primarily poaching for the
pet trade (habitat loss may also have been a contributing factor), but as its size
decreased, intrinsic small population factors (e.g. stochasticity, loss of GD)
undoubtedly contributed to the observed large fluctuations in population size. The
sole wild population, in Bali Barat National Park, numbered only 12 birds in 1990
but in subsequent years has been variously reported to have varied from 0 to about
25 birds [R. Seibels, personal communication]. In the late 1980s, the SSP transferred
birds from the SSP population to Bali; these birds or their subsequent offspring were
reintroduced to augment the wild population. However, those supplementations hadlittle or no impact on the size or persistence of the wild population, possibly because
poaching pressure was not mitigated. The SSP anticipates that when the possibility
of poaching is eliminated or at least greatly reduced, the SSP population could again
act as a direct or indirect source for reintroduction; this would require that the SSP
population must remain self-sustaining while birds that are demographically,
behaviorally, and genetically appropriate for reintroduction are harvested from the
captive population. Thus, a key aspect of long-term planning is an assessment of the
SSP’s ability to provide birds for reintroduction.
Planning for the future of the Bali mynah SSP population requires: (1) an
evaluation of the current genetic and demographic status and risk of extinction of the population in the context of available space, (2) clearly identified goals and
objectives for future population sizes and population persistence, (3) identification of
factors (especially threats) that drive population dynamics and (4) identification and
prioritization of resources and actions necessary to meet those goals and objectives.
Risk assessment is a general method used to identify threats to a population and
assess the ability to meet program objectives; all SSP planning includes some type of
risk assessment. However, most SSP programs use a deterministic assessment from
PM2000 software [Pollak et al., 2005] that treats genetic and demographic risks
separately rather than considering stochasticity (i.e. random variation in a system) or
the potential negative impact of inbreeding depression (ID) [Lacy, 1987]. Populationviability analysis (PVA) is a specific type of risk assessment used to assess future
changes in population size as a function of different management actions and/or
environmental conditions [Beissinger and McCullough, 2002; Morris and Doak,
2002]. Most PVA approaches now include assessments of stochasticity through a
simulation approach that provides results as the mean of multiple iterations.
We conducted a multifaceted risk assessment of the Bali Mynah SSP
population using ZooRisk 2.53 software [Earnhardt et al., 2005], an individual-
based stochastic simulation model that incorporates the demographic, genetic, and
management processes [Lacy, 1987; Ballou and Foose, 1996] that can impact the
dynamics of small populations [Faust and Earnhardt, 2005]. ZooRisk was developed
specifically to assess viability in discrete, closed populations, such as those in zoos
and aquariums; through multiple iterations per simulation, it can incorporate
232 Earnhardt et al.
Zoo Biology

8/17/2019 Earnhardt 2009
http://slidepdf.com/reader/full/earnhardt-2009 4/23
demographic stochasticity, genetic variation, inbreeding and ID into projections of
future population size and structure. Thus, ZooRisk provides systematic,
quantitative assessments of extinction risk and can categorize a population’s risk
of extinction as Critical, Endangered, Vulnerable, or Low Risk in captivity [Faust
and Earnhardt, 2005].Our analyses address five questions of specific interest to the managers of the SSP:
(1) under current practices for reproduction and genetic management [Ballou and
Foose, 1996], what is the risk of population decline or extinction? (2) if the space
available to this program were reduced below 200–250, how would this reduction
impact the risk of extinction? (3) what level of change in fecundity and/or mortality
would cause an undesirable population decline and/or an increase in extinction risk? (4)
what is the impact of current genetic management tactics (Ballou and Foose, 1996] on
the loss of GD? and (5) in the future, could birds be removed from the zoo population
(i.e. harvested) for a reintroduction program without a substantial risk of SSP
population decline? We evaluate these questions for the short-term (25 years) and long-
term (100 years) prospects of the Bali mynah population to provide managers withscience-based information as they evaluate trade-offs in different management options.
METHODS
We used data from the population’s historic records in combination with the
current status and management approach for the SSP population to create a Baseline
Scenario. This Baseline Scenario became the standard against which all other
management scenarios were compared and contrasted. Results from the Baseline
Scenario address our question about the level of extinction risk under the current
conditions. For other questions, we varied parameter values from the Baseline toconstruct Alternate Scenarios. The results, using the comparison of management
strategies in the Baseline and Alternate Scenarios, help managers decide which
management strategies are likely to result in desirable or undesirable changes in
population size and/or extinction risk.
For all scenarios, the initial population size and structure were those individuals
living (N 5 209) as of July 14, 2005, in AZA institutions based on studbook data and
included in the 2005 Bali Mynah SSP Population Analysis and Breeding Transfer Plan
[Long et al., 2005]. We applied a monogamous breeding system and a birth sex ratio of
0.5 (equal probability of males and females produced at birth). In the analysis we first
conducted a deterministic projection to obtain a lambda (i.e. population growth rate)that would provide an indication of the underlying pattern of population change over
time [Beissinger and Westphal, 1998; Cromsigt et al., 2002]. In all other simulations, we
conducted stochastic projections (for the Baseline Scenario, we used 500 iterations and
for the Alternate Scenarios, 200 iterations) that included variation in event outcomes
for births, deaths, birth sex ratio, and annual number of offspring (ANO) [Faust and
Earnhardt, 2005]. We report the mean and standard deviation to indicate the
distribution of possible outcomes.
Baseline Scenario
To parameterize the model we extracted data from the North American
Regional Studbook for the Bali Mynah [Thompson, 2005], a database containing
comprehensive demographic and genetic data on individual animals over the history
233Bali Mynah Risk Assessment
Zoo Biology
8/17/2019 Earnhardt 2009
http://slidepdf.com/reader/full/earnhardt-2009 5/23
of the population; these data are maintained in the Single Population Analysis and
Record Keeping Software [ISIS, 2002]. To determine an appropriate timeframe for
extraction of age-specific vital rates for fecundity and mortality, we deconstructed
factors associated with changes in population size during the history of the Bali
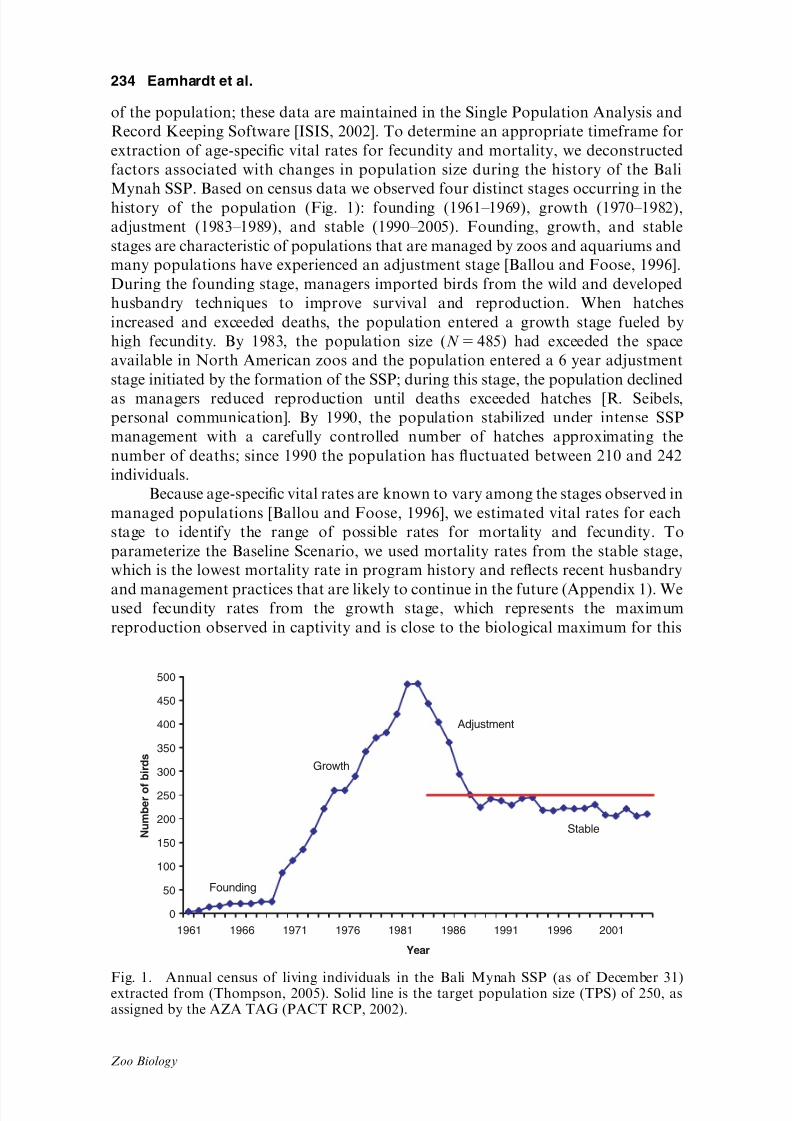
Mynah SSP. Based on census data we observed four distinct stages occurring in thehistory of the population (Fig. 1): founding (1961–1969), growth (1970–1982),
adjustment (1983–1989), and stable (1990–2005). Founding, growth, and stable
stages are characteristic of populations that are managed by zoos and aquariums and
many populations have experienced an adjustment stage [Ballou and Foose, 1996].
During the founding stage, managers imported birds from the wild and developed
husbandry techniques to improve survival and reproduction. When hatches
increased and exceeded deaths, the population entered a growth stage fueled by
high fecundity. By 1983, the population size (N 5 485) had exceeded the space
available in North American zoos and the population entered a 6 year adjustment
stage initiated by the formation of the SSP; during this stage, the population declined
as managers reduced reproduction until deaths exceeded hatches [R. Seibels,personal communication]. By 1990, the population stabilized under intense SSP
management with a carefully controlled number of hatches approximating the
number of deaths; since 1990 the population has fluctuated between 210 and 242
individuals.
Because age-specific vital rates are known to vary among the stages observed in
managed populations [Ballou and Foose, 1996], we estimated vital rates for each
stage to identify the range of possible rates for mortality and fecundity. To
parameterize the Baseline Scenario, we used mortality rates from the stable stage,
which is the lowest mortality rate in program history and reflects recent husbandry
and management practices that are likely to continue in the future (Appendix 1). Weused fecundity rates from the growth stage, which represents the maximum
reproduction observed in captivity and is close to the biological maximum for this
0
50
100
150
200
250
300
350
400
450
500
1961 1966 1971 1976 1981 1986 1991 2001
Year
N u m b e r o f
b i r d s
Founding
Adjustment
Stable
Growth
1996
Fig. 1. Annual census of living individuals in the Bali Mynah SSP (as of December 31)extracted from (Thompson, 2005). Solid line is the target population size (TPS) of 250, asassigned by the AZA TAG (PACT RCP, 2002).
234 Earnhardt et al.
Zoo Biology
8/17/2019 Earnhardt 2009
http://slidepdf.com/reader/full/earnhardt-2009 6/23
species (i.e. 5–6 clutches per year per bird: S. Thompson, personal communication.).
This timeframe is appropriate because ZooRisk explicitly models constraints on
reproduction via implementation of a carrying capacity (K ) (i.e. the model allows
hatches each year only when the projected population size is below K ). ZooRisk
models fecundity as an interaction between two variables: a female’s probability of breeding (P(B)) at a specific age and the ANO she could produce (i.e. the distribution
of the total number of offspring an individual female could produce in a year; see
Faust and Earnhardt, 2005). Although during the growth stage, no females bred
after age 15, we extended the range of breeding ages (e.g. ages with probability of
breeding40) from 13 to 15 years of age because during the stable stage females bred
until age 15 (Long et al., 2005). Thus, fecundity for age classes 0–13 was based on
1970–1983 and for ages 13–15 on 1990–2005 (Appendix 1). For the ANO, we
assumed that three clutches per year were the maximum number advisors would
recommend [S. Thompson, M. Ross, R. Seibels, personal communication]. Because
one–three was the range of chicks hatched per clutch, we restricted the maximum
ANO to nine chicks (Appendix 2). The abundant data on the Bali mynah populationmakes this species particularly suitable for a PVA as it improves the estimation of
vital rates; even with subsetting the data by time frame, sample sizes were large
enough (N hatches during growth stage5 1053 and N deaths during stable stage5 690) that we felt
these rates were representative of the probable biological and management rates
necessary for the Baseline.
We included two additional standard zoo population management factors in
the Baseline Scenario: carrying capacity (space constraints) and genetic management
based on mean kinship and inbreeding avoidance [Ballou and Foose, 1996]. ZooRisk
can impose a spatial carrying capacity by limiting reproduction (e.g. the number of
pairings) so that the expected number of offspring would not increase populationsize above that set by the carrying capacity; this is the same process used in SSP
planning [Faust and Earnhardt, 2005; Long et al., 2005]. We used the TPS of 250 set
by the PACT TAG for Bali mynah as the K in the Baseline Scenario (PACT RCP,
2002). In SSP planning, pairings are selected by matching individuals with the lowest
mean kinships (mk) whose offspring would have inbreeding coefficients (F ) below
population mean kinship [Ballou and Foose, 1996]; this genetic management strategy
has been used in all Bali Mynah SSP plans since 1997 [S. Thompson, personal
communication]. In the Baseline Scenario, we used ZooRisk settings to prioritize
pairings based on mean kinships with lowest mk birds selected for breeding before
higher mk birds (see Faust and Earnhardt, 2005) and with F equal to or less than0.07 (5 population mean kinship in 1997). The Bali Mynah SSP excludes individuals
with unknown pedigrees from breeding and thus minimizes unknown relationships.
For the Baseline and all other scenarios, we excluded seven individuals from
breeding because of unknown pedigrees [per Long et al., 2005] but allowed ZooRisk
to track these animals as nonbreeders and include them in the population size
calculations until their simulated deaths.
Alternate Scenarios
We constructed 37 Alternate Scenarios to investigate the impact of changes in
management as outlined in our five questions (Table 1). By systematically altering
values for a specific parameter while keeping all other variables constant, we assessed
the potential biological impact on the population of change in that parameter [e.g.
235Bali Mynah Risk Assessment
Zoo Biology
8/17/2019 Earnhardt 2009
http://slidepdf.com/reader/full/earnhardt-2009 7/23
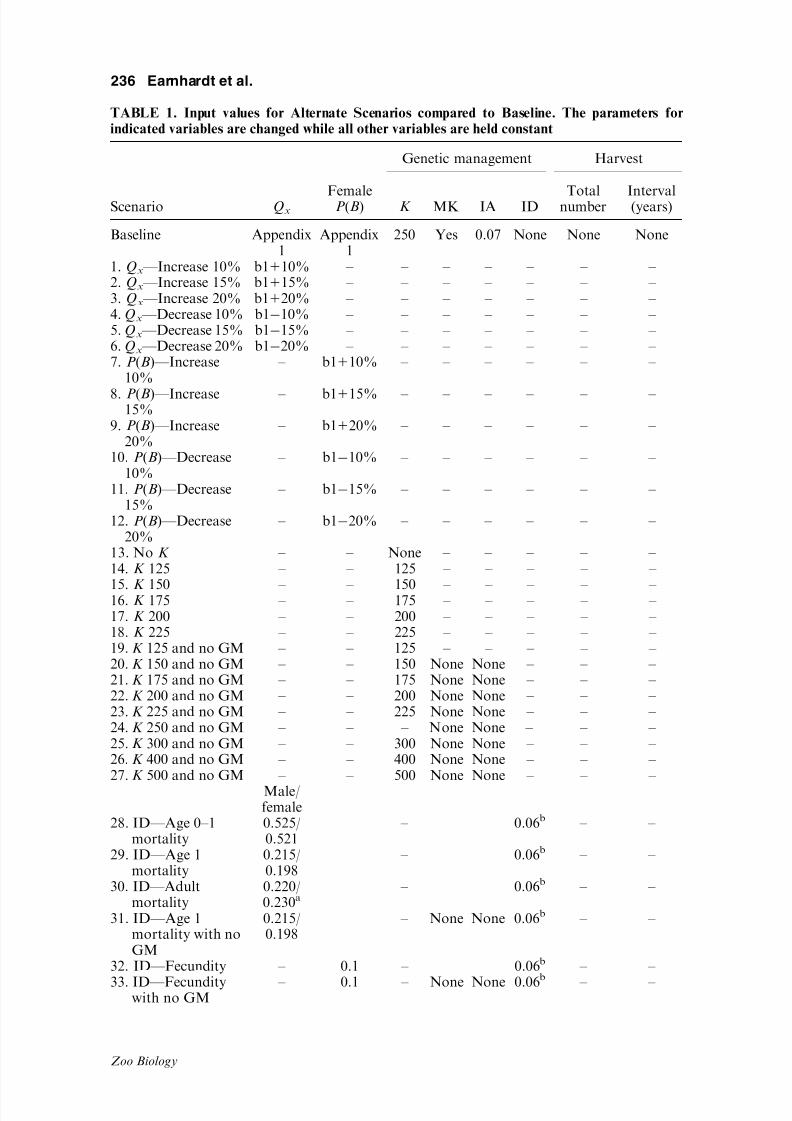
TABLE 1. Input values for Alternate Scenarios compared to Baseline. The parameters forindicated variables are changed while all other variables are held constant
Genetic management Harvest
Scenario Qx
FemaleP(B) K MK IA ID Totalnumber Interval(years)
Baseline Appendix1
Appendix1
250 Yes 0.07 None None None
1. Qx —Increase 10% b1110% – – – – – – –
2. Qx —Increase 15% b1115% – – – – – – –
3. Qx —Increase 20% b1120% – – – – – – –
4. Qx —Decrease 10% b110% – – – – – – –
5. Qx —Decrease 15% b115% – – – – – – –
6. Qx —Decrease 20% b120% – – – – – – –
7. P(B)—Increase10%
– b1110% – – – – – –
8. P(B)—Increase15%
– b1115% – – – – – –
9. P(B)—Increase20%
– b1120% – – – – – –
10. P(B)—Decrease10%
– b110% – – – – – –
11. P(B)—Decrease15%
– b115% – – – – – –
12. P(B)—Decrease20%
– b120% – – – – – –
13. No K – – None – – – – – 14. K 125 – – 125 – – – – –
15. K 150 – – 150 – – – – – 16. K 175 – – 175 – – – – – 17. K 200 – – 200 – – – – – 18. K 225 – – 225 – – – – – 19. K 125 and no GM – – 125 – – – – – 20. K 150 and no GM – – 150 None None – – – 21. K 175 and no GM – – 175 None None – – – 22. K 200 and no GM – – 200 None None – – – 23. K 225 and no GM – – 225 None None – – – 24. K 250 and no GM – – – None None – – – 25. K 300 and no GM – – 300 None None – – – 26. K 400 and no GM – – 400 None None – – – 27. K 500 and no GM – – 500 None None – – –
Male/female
28. ID—Age 0–1mortality
0.525/0.521
– 0.06b – –
29. ID—Age 1mortality
0.215/0.198
– 0.06b – –
30. ID—Adultmortality
0.220/0.230a
– 0.06b – –
31. ID—Age 1mortality with noGM
0.215/0.198
– None None 0.06b – –
32. ID—Fecundity – 0.1 – 0.06b – –
33. ID—Fecunditywith no GM
– 0.1 – None None 0.06b
– –
236 Earnhardt et al.
Zoo Biology

8/17/2019 Earnhardt 2009
http://slidepdf.com/reader/full/earnhardt-2009 8/23
Morris and Doak, 2002]. For example, the Baseline Scenario could indicate that the
population has the potential to increase in size but an Alternative Scenario can
compare and assess how a management action such as a smaller TPS can impact
demographic and genetic characteristics.
We conducted a vital rate analysis by increasing and decreasing the probability
of breeding and mortality rates by 10, 15, and 20% (Table 1: Scenarios 1–12). Thisanalysis would answer Question 3 (i.e. what level of change in the vital rates would
cause an undesirable population decline). Although the vital rates produced by these
changes may be neither desirable nor biologically feasible, this is an approach
intended to assess the impact of a specific vital rate on the model projections (e.g. the
new rate would produce a substantial change in the projected population size).
Because Bali mynah SSP managers experience difficulty securing institutional
space for the current number of individuals, it is important to understand how
carrying capacities below the current available space (2001) or TAG recommended
TPS (250) impact extinction risk. We explored reductions in K with increments of 25
(Question 2) (Table 1: Scenarios 14–18).Because genetic management requires an investment of resources (e.g. transfers,
quarantine, and introductions), managers want to assess the relative benefits of
genetic management options (Question 4). To address this question, we created a
series of Alternate Scenarios to compare the impact of different management
strategies on GD. The standard genetic management strategy [Ballou and Foose,
1996] prioritizes birds for breeding based on mean kinship and avoids pairs that
would produce inbred offspring above a specified level. In Scenario 24 (Table 1), no
genetic management was applied (i.e. birds were paired for breeding randomly). In
Scenarios 19–23 we reduced K to understand the impact of a combined reduction in K
and lack of genetic management. In Scenarios 25, 26, and 27 we assessed the degree to
which reasonable increases in maximum allowable population size (via a larger K of
300–500) could compensate for a lack of genetic management (Table 1).
TABLE 1. Continued
Genetic management Harvest
Scenario Qx
Female
P(B) K MK IA ID
Total
number
Interval
(years)34. Harvest 10 – – – – – – 10 335. Harvest 20 – – – – – – 20 336. Harvest 30 – – – – – – 30 337. Harvest 30—5yr – – – – – – 30 5
aNew adult mortality rate applied across age classed 2–13 for males and females.bIndividuals with an inbreeding coefficient above a threshold of 0.06 have new vital rateapplied.b1, baseline value; GM, genetic management; IA, genetic management strategy that makespairs that avoid inbreeding at defined threshold; ID, inbreeding depression; K , carrying; MK,genetic management strategy that prioritizes pairs by mean kinship; P(B) probability of
breeding; Qx, age-specific mortality rate change; % unk, percent of the pedigree that isunknown. –, No change from Baseline Scenario.
237Bali Mynah Risk Assessment
Zoo Biology

8/17/2019 Earnhardt 2009
http://slidepdf.com/reader/full/earnhardt-2009 9/23
Because small avian populations are susceptible to ID [Keller, 1998; Kruuk
et al., 2002; Jamieson et al., 2007], we created Alternate Scenarios that modeled ID
as a feedback on two rates, fecundity and mortality. Because no information exists
on genetic load carried by the Bali Mynah SSP population, we based our ID
scenarios on studies of ID in other passerine that consistently found a reduction inhatching and in juvenile survival rates species [Keller, 1998; Kruuk et al., 2002;
Jamieson et al., 2007]. Scenarios 28–33 tested ID impacts on those rates as well as
chick and adult stage survival rates. In Scenarios 28–31 (Table 1), survival was
reduced by 28% for individuals with F greater than 0.06; the new survival rate was in
proportion to a reduction in survival found by Jamieson et al. [2007]. In Scenarios 32
and 33 (Table 1), the probability of breeding (P(B)) was reduced to 0.1 for
individuals with F greater than 0.06. To assess the impact of genetic management
when ID is applied genetic management was omitted in Scenarios 31 and 33
(Table 1).
We constructed four Alternate Scenarios (34–37) to assess the ability of the
SSP to provide birds for a reintroduction program under various harvesting regimeswithout jeopardizing the future viability of the source population (Question 5)
[IUCN RSG guidelines, 1998]. Birds harvested from the SSP could be used for
breeding in an existing facility in Bali Barat National Park and/or for release directly
into the wild. Harvesting events were initiated in model year 6 and were repeated
every 3 or 5 years, with equal numbers of males and females between the ages of 2–5
years harvested from the source population and varying the number of released
animals from 10 to 30 (Table 1).
We report results for demographic analyses with 25 and 100-year time frames
and results for genetic and extinction analyses with a 100-year time frame.
Although a 100-year time frame has been a convention for zoo populationmanagement and for general conservation programs [Ballou and Foose, 1996], we
also include the shorter time frame because projections over 100 years can be
impractical from a manager’s perspective; managers need to anticipate imminent
changes in population size and structure. Different time frames are especially
informative for declining population trajectories, which may be extant at 25 years
but extinct at 100 years. In these cases, we report the metric for median time to
extinction, which can provide insight into the probable longevity of the population.
In some of the analyses, we summarize a scenario’s results using ZooRisk’s
standardized Risk Categories: Low Risk in captivity, Vulnerable in captivity, Critical
in captivity, and Endangered in captivity (for a detailed description of risk categoriessee ZooRisk manual, Faust and Earnhardt, 2005). A population’s risk category
summarizes its results for five risk tests, which evaluate different aspects of a
population’s demography, genetics, and management that might put the population
at risk; these tests are based on a combination of criteria applied in the Red Lists of
the IUCN (IUCN, 2006) and factors specific to zoo breeding programs (see Table 2).
ZooRisk has established boundaries for each test and each level of risk. For example,
in Risk Test 2, the Bali mynah population is distributed across 31 zoos making it
Low Risk in captivity because any distribution across more than three zoos is
categorized as Low Risk (Table 2). The most severe result of the five tests becomes
the overall risk category (similar to the Red Lists). This approach standardizes
assessments across species and allows managers to compare species programs using
the same framework.
238 Earnhardt et al.
Zoo Biology

8/17/2019 Earnhardt 2009
http://slidepdf.com/reader/full/earnhardt-2009 10/23
RESULTS
Baseline Scenario
ZooRisk’s risk categorization method rates the Bali Mynah SSP population as
Low Risk in captivity (Table 2) and its quantitative assessment of extinction and
gene diversity indicate that, if managed under baseline conditions, the population is
unlikely to go extinct within the next 100 years (Table 3).
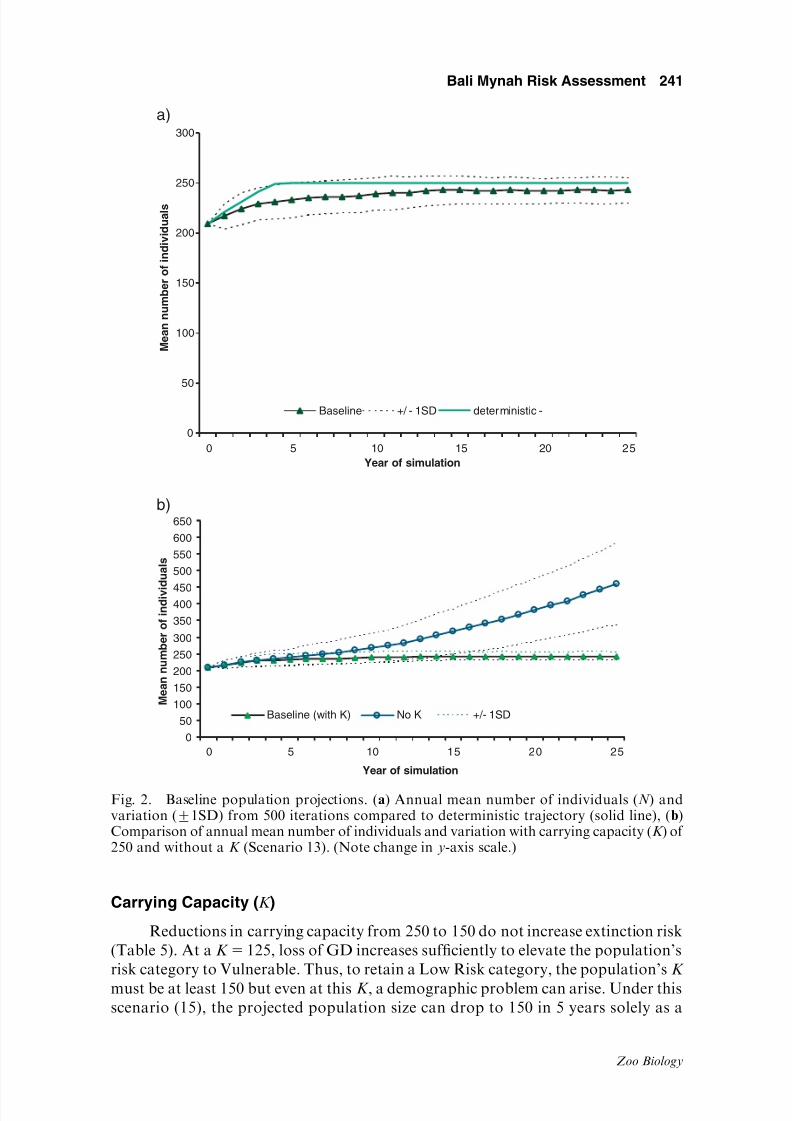
Under baseline conditions, the population increased rapidly with the
deterministic projection reaching carrying capacity at year 4 and the stochastic
mean population size stabilizing just below carrying capacity (N 5 243713.2)
by year 14 (Fig. 2a; Table 3). In Scenario 13 (baseline conditions with nocarrying capacity), the population projections reach a mean of 4617123 individuals
after only 25 years, which is almost double the size of the population under baseline
conditions (Fig. 2b). In Scenario 17 (K set at current population size; Table 1) the
mean population size is 190710.0, again just below the carrying capacity.
Carrying capacity acts as an absorbing boundary so population size can
increase initially but then fluctuates slightly below the carrying capacity; thus, the
variation around the mean population size decreases as time increases (Fig. 2a). In
contrast, when there is no carrying capacity (e.g. Scenario 13), variation around
mean population size increases as time increases (Fig. 2b).
With the Baseline Scenario, the population’s age structure by year 25 appears
more stable than the initial structure (Fig. 3). With many individuals in the earlier
age classes, this structure is typical of a population with strong growth. This age
TABLE 2. Risk results for the five standardized risk tests using the Bali mynah BaselineScenario. A description of the Category Boundaries for each result are listed for that Category.The Overall Risk Score is the most severe of the risk tests; the Bali mynah SSP population iscategorized as Low Risk in captivity
Risk tests Risk results Categoryboundaries Category
1. Probability of extinction (P(E ))in 100 yrs
P(E )5 0% within100 years
0–9% P(E ) within100 years
Low Risk incaptivity
2. Distribution of breeding-aged,mixed-sex groups
31 zoos withbreeding-aged,mixed-sex groups
43 Zoos Low Risk incaptivity
3. Current number of breeding-aged animals (m.f)
105.97 breeding-aged animals
More than 10.10 Low Risk incaptivity
4. Reproduction in the lastgeneration
31 pairsreproducingin the last
generation(T 5 6.5 years)
Consistent success:More than 9 pairsreproducing
Low Risk incaptivity
5. Gene diversity (GD) of startingpopulation or modeledpopulation in 100 years
StartingpopulationGD5 0.9618Modeled GD at100 years5 0.9387
Starting GD 40.9 ormodeled GD in 100years 40.9
Low Risk incaptivity
f, females; m, males; GD, gene diversity; P(E ), probability of extinction; T , mean generation time.
239Bali Mynah Risk Assessment
Zoo Biology

8/17/2019 Earnhardt 2009
http://slidepdf.com/reader/full/earnhardt-2009 11/23
structure persists for the 100 years that were modeled, indicating that the populationis capable of growth and stability over the long term.
In the Baseline Scenario, mean gene diversity remains above 90%, the
level established as a risk threshold for most managed AZA populations [Soule ´
et al., 1986; Willis and Wiese, 1993; Ballou and Foose, 1996], but declines
from the current level with a concomitant increase in inbreeding (Table 3). However,
because this increased level of inbreeding is relatively low and the population is
large, management for inbreeding avoidance does not limit reproduction (e.g.
sufficient pairs can always be made to reach and maintain the population at carrying
capacity).
Vital Rate Analysis
In 12 Alternate Scenarios, we tested the impact of six negative and six positive
changes in mortality rate and the probability of breeding. Of the six Alternate
Scenarios with rates changed in a negative direction, four scenarios retain a positive
growth rate and even increase from the initial size but fail to achieve the mean
population size of the Baseline at 25 years; the other two scenarios with 20%
negative change in vital rates decline from the initial size (Table 4). A 20% decrease
in probability of breeding is equivalent to eight fewer hatches each year; a 20%
increase in mortality is equivalent to three more deaths each year. In contrast,
positive changes in vital rates have little impact on the population size at 25 years
compared with the Baseline Scenario.
TABLE 3. Risk assessment metrics from projections of the Baseline Scenario for the Balimynah SSP population
Demographicmetrics—25 years Genetic metrics—100 years Extinction metrics—100 years
Lambda(deterministic)
1.0072 GD initial (%retained)
96.18 Populations surviving (500iterations)
500
Lambda(stochastic)
1.0061 Mean GD final 93.87 Probability of extinction(P(E )) %
0
SD (Lambda) 70.0025 SD (GD final) 71.44 Median time to extinction N/AN (initial) 209 Mean time to 90% N/AMean N (final) 243 SD (Mean time to
90%)N/A
SD (N final) 713.2% Known initial 90.00Mean % knownfinal
92.22
SD (% knownfinal)
70.7
F initial 0.0137Mean F final 0.05SD (F final) 70.0162
F , mean population inbreeding coefficient; GD, gene diversity retained; N , population size;N/A, not applicable; SD, 1 Standard deviation; %, Known, the proportion of the pedigreesknown within the population.
240 Earnhardt et al.
Zoo Biology
8/17/2019 Earnhardt 2009
http://slidepdf.com/reader/full/earnhardt-2009 12/23
Carrying Capacity (K )
Reductions in carrying capacity from 250 to 150 do not increase extinction risk
(Table 5). At a K 5 125, loss of GD increases sufficiently to elevate the population’s
risk category to Vulnerable. Thus, to retain a Low Risk category, the population’s K
must be at least 150 but even at this K , a demographic problem can arise. Under this
scenario (15), the projected population size can drop to 150 in 5 years solely as a
0
50
100
150
200
250
300
0 10 15 20 25
Year of simulation
M e a n n u m b e r o f i n d i v i d u a l s
Baseline +/ - -1SD deterministic
0
50
100
150
200
250
300
350
400450
500
550
600
650
0 10 15 20 25
Year of simulation
M e a n n u m b e r o f i n d i v i d u a l s
Baseline (with K) No K +/- 1SD
5
5
a)
b)
Fig. 2. Baseline population projections. (a) Annual mean number of individuals (N ) andvariation (71SD) from 500 iterations compared to deterministic trajectory (solid line), (b)Comparison of annual mean number of individuals and variation with carrying capacity (K ) of 250 and without a K (Scenario 13). (Note change in y-axis scale.)
241Bali Mynah Risk Assessment
Zoo Biology

8/17/2019 Earnhardt 2009
http://slidepdf.com/reader/full/earnhardt-2009 13/23
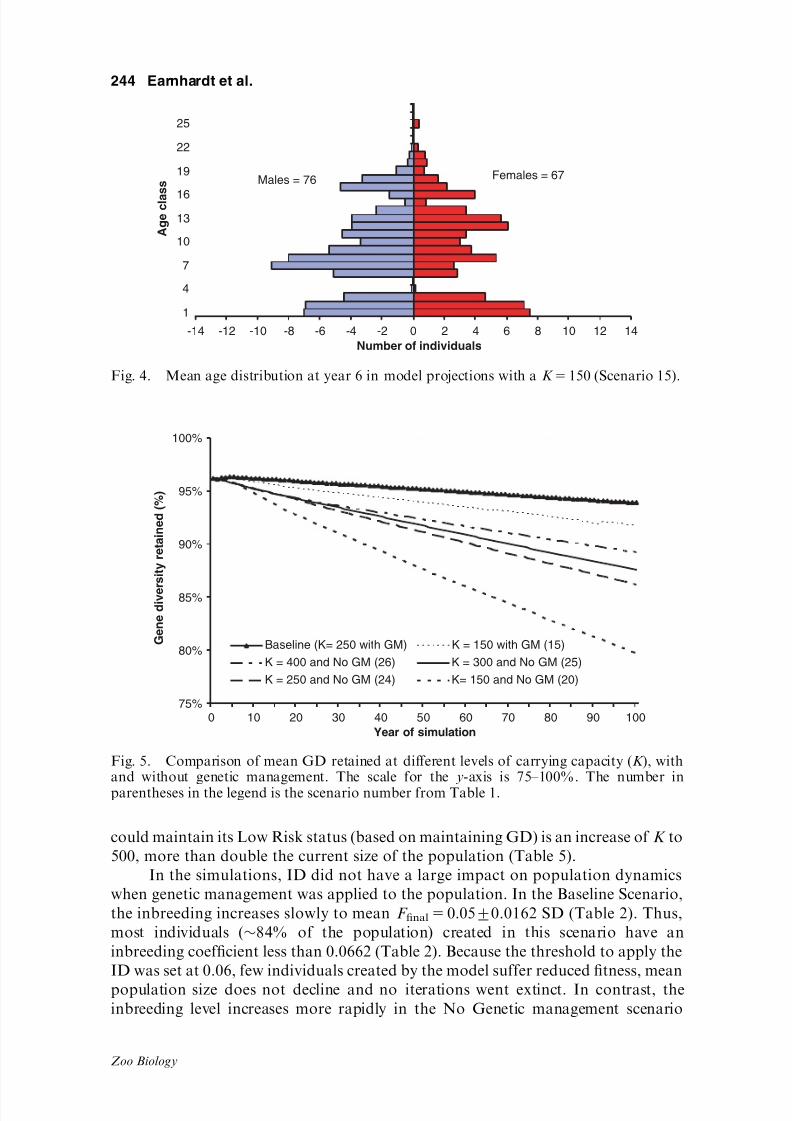
result of typical mortality rates because no birds reproduce in this scenario.
However, this complete breeding cessation would produce a 3-year gap in the age
structure (Fig. 4); as these vacant classes move into prime reproductive ages during
the next decade, population growth was projected to temporarily decline below
150–131 (model years 13 through 17) before the dynamics can recover and the
-14 -12 -10 -8 -6 -4 -2 0 2 4 6 8 10 12 14
1
5
9
13
17
21
25
A g e c l a s s
Number of individuals
Males = 108 Females = 101
-14 -12 -10 -8 -6 -4 -2 0 2 4 6 8 10 12 14
1
5
9
13
17
21
25
A g e c l a s s
Mean number of individuals
Males = 122 Females = 122
-14 -12 -10 -8 -6 -4 -2 0 2 4 6 8 10 12 14
14
7
10
13
16
19
22
25
A g e c l a s s
Mean number of individuals
Males = 122 Females = 121
a)
b)
c)
Fig. 3. Comparison of age pyramids. (a) initial (2005), (b) mean number of individualssimulated at year 25, and (c) mean number of individuals simulated at year 100.
242 Earnhardt et al.
Zoo Biology

8/17/2019 Earnhardt 2009
http://slidepdf.com/reader/full/earnhardt-2009 14/23
population settles at its final size (mean N 100yr5
1421
/18 SD). Owing to thispotential for disruption in age structure, managers might want to avoid a severe
breeding moratorium if they set a K of 150 and allow a few hatches (i.e. a slower
decline in size) each year, which would minimize gaps in future reproductive age
classes.
Genetic Management
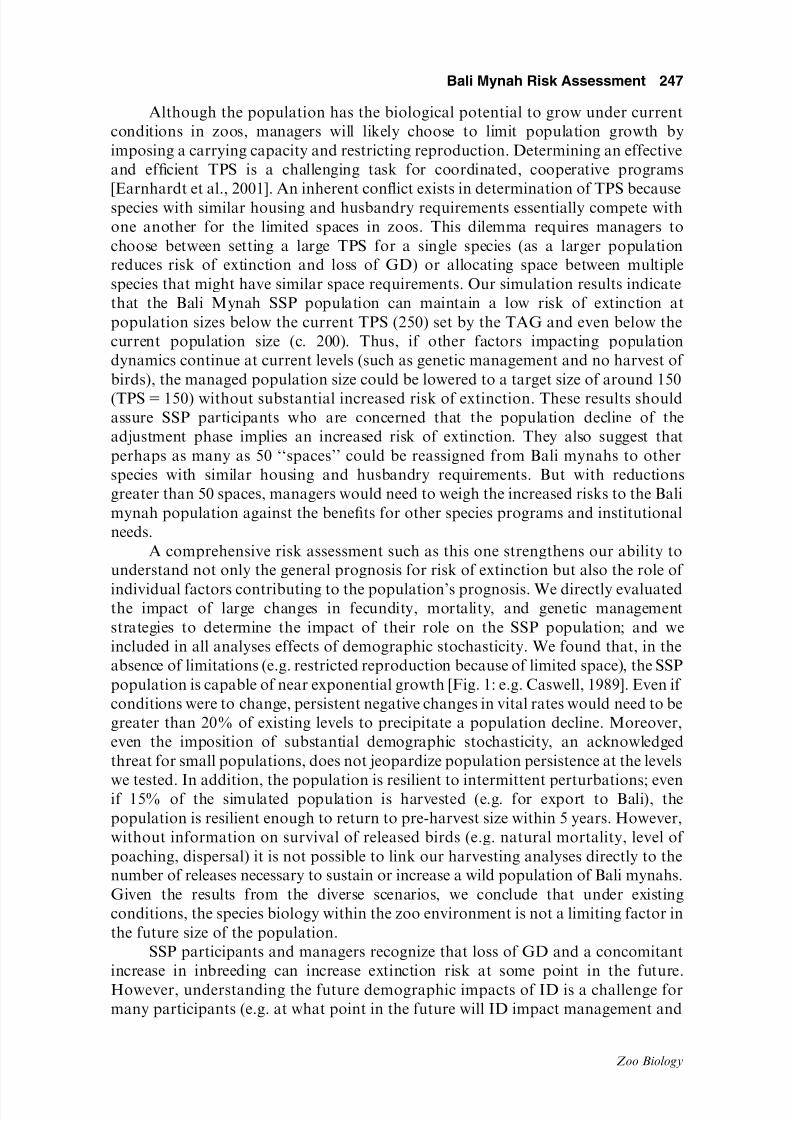
Genetic management strategies clearly impact retention of GD. The Baseline
Scenario retains 93.8771.44% GD at 100 years and is at Low Risk for extinction
(Tables 2 and 3). In contrast, without any genetic management (Scenario 24) only
86.275.6% GD is retained and extinction categorization increases to Vulnerable
(Fig. 5; Table 5). If genetic management was suspended, the only way the population
TABLE 4. Sensitivity analysis of mortality and probability of breeding rates. In each scenario,one variable is increased or decreased in value while other variables are held constant. Ratechanges are applied across all age classes
Scenario
Mean N (7SD) at
25 years
Net change form initial
size (209) LambdaBaseline 243 (11.8) 34 1.006Negative changeMortality increase 10% 232 (22.6) 23 1.004Increase 15% 211 (37.2) 2 1.000Increase 20% 188 (43.3) 21 0.995Breeding decrease 10% 231 (24.3) 22 1.004Decrease 15% 220 (36.5) 11 1.001Decrease 20% 197 (43.6) 12 0.997Positive changeMortality decrease 10% 245 (8.4) 36 1.006Decrease 15% 245 (9.1) 36 1.006
Decrease 20% 245 (8.4) 36 1.006Breeding increase 10% 243 (11.3) 34 1.006Increase 15% 241 (12.8) 32 1.006Increase 20% 242 (12.6) 33 1.006
TABLE 5. Impact on the level of Risk category from changes in the carrying capacity (K ) withand without genetic management. The number in parentheses is the scenario # from Table 1
K Risk category—withgenetic management
Risk category—nogenetic management
500 Low Risk Low Risk (27)400 Low Risk Vulnerable (26)300 Low Risk Vulnerable (25)250 Low Risk (Baseline) Vulnerable (24)225 Low Risk (18) Vulnerable (23)200 Low Risk (17) Vulnerable (22)175 Low Risk (16) Vulnerable (21)150 Low Risk (15) Vulnerable (20)125 Vulnerable (14) Vulnerable (19)
243Bali Mynah Risk Assessment
Zoo Biology
8/17/2019 Earnhardt 2009
http://slidepdf.com/reader/full/earnhardt-2009 15/23
could maintain its Low Risk status (based on maintaining GD) is an increase of K to
500, more than double the current size of the population (Table 5).
In the simulations, ID did not have a large impact on population dynamics
when genetic management was applied to the population. In the Baseline Scenario,
the inbreeding increases slowly to mean F final5 0.0570.0162 SD (Table 2). Thus,
most individuals (84% of the population) created in this scenario have an
inbreeding coefficient less than 0.0662 (Table 2). Because the threshold to apply the
ID was set at 0.06, few individuals created by the model suffer reduced fitness, mean
population size does not decline and no iterations went extinct. In contrast, the
inbreeding level increases more rapidly in the No Genetic management scenario
-14 -12 -10 -8 -6 -4 -2 0 6 10 12 14
1
4
7
10
13
16
19
22
25
A g e c l a s s
Number of individuals
Males = 76 Females = 67
2 4 8
Fig. 4. Mean age distribution at year 6 in model projections with a K 5 150 (Scenario 15).
75%
80%
85%
90%
95%
100%
0 10 20 30 40 50 60 70 80 90 100
Year of simulation
G e n e d i v e r s i t y r e t a i n e d ( % )
Baseline (K= 250 with GM) K = 150 with GM (15)
K = 400 and No GM (26) K = 300 and No GM (25)
K = 250 and No GM (24) K= 150 and No GM (20)
Fig. 5. Comparison of mean GD retained at different levels of carrying capacity (K ), withand without genetic management. The scale for the y-axis is 75–100%. The number inparentheses in the legend is the scenario number from Table 1.
244 Earnhardt et al.
Zoo Biology

8/17/2019 Earnhardt 2009
http://slidepdf.com/reader/full/earnhardt-2009 16/23
(Table 1: Scenario 24) to mean F final5 0.131/0.06 SD; thus when ID occurs in the
two scenarios with no genetic management (Table 1: Scenarios 31 and 33), more
individuals experience reduced fitness in mortality or fecundity (Fig. 6a and b) and
population sizes decline. In the scenario where inbreeding impacted mortality
(Scenario 31) the population size declines to 1567
53.3 at 100 years and in thescenario where inbreeding reduced fecundity (Scenario 33), the mean population size
declines to 10 in extant iterations at 100 years with 38% of the iterations going
extinct (median time to extinction5 91 years).
0
50
100
150
200
250
300
M e a n n u m b e r o f i n d i v i d u a l s
ID, Age 0 to 1, increase in mortality with GM (28)
ID, Age 1, increase in mortality with GM (29)
ID, increase in adult mortality with GM (30)
ID, Age 1, increase in mortality and No GM (31)
Age 1 mortality and No genetic management (31)
Scenarios 28-30
0
50
100
150
200
250
300
0 10 20 30 40 50 60 70 80 90 100
Year of simulation
0 10 20 30 40 50 60 70 80 90 100
Year of simulation
M e a n n u m
b e r o f i n d i v i d u a l s
ID, Decrease in fecundity with GM (32)
ID, Decrease in fecundity and No GM (33)
a)
b)
Fig. 6. Comparison of inbreeding depression (ID) scenarios with different genetic manage-ment (GM) strategies. (a) impact on population size from an increase in mortality for
individuals with F greater than 0.06 and (b) impact on population size from a decrease infecundity for females with F greater than 0.06. The number in parentheses is the scenarionumber from Table 1.
245Bali Mynah Risk Assessment
Zoo Biology

8/17/2019 Earnhardt 2009
http://slidepdf.com/reader/full/earnhardt-2009 17/23
Harvest Scenarios
The results from the harvest scenarios (Table 1: Scenarios 34–37) indicate that
despite the population’s underlying ability to grow, either removing too many
individuals or harvesting too frequently can create a population decline, jeopardizing
the future of the zoo population (Fig. 7). Although removing 20 or 30 individuals at3-year intervals causes the population to decline, removing 10 individuals at 3-year
intervals or 30 individuals at 5-year intervals gave the population time to recover to
its self-sustaining size. Thus, a comparison of scenarios using different ranges of
number and time intervals indicate either a harvest of fewer individuals (e.g. 10 vs.
20) or a harvest at longer intervals (e.g. 5 vs. 3 years) can improve prospects for a
self-sustaining SSP population. When the threats to the wild population have been
eliminated and reintroductions are appropriate, the specific trade-offs between the
number of birds that can be harvested from a self-sustaining SSP population and the
number of birds to release for population recovery should be modeled again.
DISCUSSION
The qualitative and quantitative results in this PVA indicate a low level risk of
population decline or extinction for the Bali Mynah SSP. Although most population
biologists would consider 200 to be a small population size and thus highly
vulnerable to the threats common to small populations [e.g. Soule ´ et al., 1986; Lacy,
1987; Soule ´ , 1987], our analyses indicate few or no intrinsic or extrinsic threats to
this population’s future viability. These results reinforce perceptions of population
managers about long-term viability [Long et al., 2005] and should allay concerns of
Bali Mynah SSP participants about the risk of unplanned future population size
decline or extinction.
0
50
100
150
200
250
300
0 10 15 20 25
Year of simulation
M e a n n u m b e r o f i
n d i v i d u a l s
Baseline harvest 30 at 5yr intervals (37)
harvest 10 at 3yr intervals (34) harvest 20 at 3yr intervals (35)
harvest 30 at 3yr intervals (36)
(36)
(35)
(37)
(34)
5
Fig. 7. Comparison of Baseline and four Alternate scenarios that harvest birds. Equalnumbers (5, 10, or 15) of males and females between 2 and 5 years of age were removed fromthe population at 3- or 5-year intervals beginning in year 6. The number in parentheses is thescenario number from Table 1.
246 Earnhardt et al.
Zoo Biology
8/17/2019 Earnhardt 2009
http://slidepdf.com/reader/full/earnhardt-2009 18/23
Although the population has the biological potential to grow under current
conditions in zoos, managers will likely choose to limit population growth by
imposing a carrying capacity and restricting reproduction. Determining an effective
and efficient TPS is a challenging task for coordinated, cooperative programs
[Earnhardt et al., 2001]. An inherent conflict exists in determination of TPS becausespecies with similar housing and husbandry requirements essentially compete with
one another for the limited spaces in zoos. This dilemma requires managers to
choose between setting a large TPS for a single species (as a larger population
reduces risk of extinction and loss of GD) or allocating space between multiple
species that might have similar space requirements. Our simulation results indicate
that the Bali Mynah SSP population can maintain a low risk of extinction at
population sizes below the current TPS (250) set by the TAG and even below the
current population size (c. 200). Thus, if other factors impacting population
dynamics continue at current levels (such as genetic management and no harvest of
birds), the managed population size could be lowered to a target size of around 150
(TPS5 150) without substantial increased risk of extinction. These results shouldassure SSP participants who are concerned that the population decline of the
adjustment phase implies an increased risk of extinction. They also suggest that
perhaps as many as 50 ‘‘spaces’’ could be reassigned from Bali mynahs to other
species with similar housing and husbandry requirements. But with reductions
greater than 50 spaces, managers would need to weigh the increased risks to the Bali
mynah population against the benefits for other species programs and institutional
needs.
A comprehensive risk assessment such as this one strengthens our ability to
understand not only the general prognosis for risk of extinction but also the role of
individual factors contributing to the population’s prognosis. We directly evaluatedthe impact of large changes in fecundity, mortality, and genetic management
strategies to determine the impact of their role on the SSP population; and we
included in all analyses effects of demographic stochasticity. We found that, in the
absence of limitations (e.g. restricted reproduction because of limited space), the SSP
population is capable of near exponential growth [Fig. 1: e.g. Caswell, 1989]. Even if
conditions were to change, persistent negative changes in vital rates would need to be
greater than 20% of existing levels to precipitate a population decline. Moreover,
even the imposition of substantial demographic stochasticity, an acknowledged
threat for small populations, does not jeopardize population persistence at the levels
we tested. In addition, the population is resilient to intermittent perturbations; evenif 15% of the simulated population is harvested (e.g. for export to Bali), the
population is resilient enough to return to pre-harvest size within 5 years. However,
without information on survival of released birds (e.g. natural mortality, level of
poaching, dispersal) it is not possible to link our harvesting analyses directly to the
number of releases necessary to sustain or increase a wild population of Bali mynahs.
Given the results from the diverse scenarios, we conclude that under existing
conditions, the species biology within the zoo environment is not a limiting factor in
the future size of the population.
SSP participants and managers recognize that loss of GD and a concomitant
increase in inbreeding can increase extinction risk at some point in the future.
However, understanding the future demographic impacts of ID is a challenge for
many participants (e.g. at what point in the future will ID impact management and
247Bali Mynah Risk Assessment
Zoo Biology

8/17/2019 Earnhardt 2009
http://slidepdf.com/reader/full/earnhardt-2009 19/23
population size?). Managers of the Bali Mynah SSP assume that ID would
jeopardize the population’s long-term viability [Long et al., 2005], but our results
suggest that, under standard SSP management practices [Ballou and Foose, 1996;
Long et al., 2005], ID may not be a critical factor for the future of the Bali
mynah population. The current population is large and genetically diverseallowing managers to maintain a slow rate of loss in GD and minimize inbreeding
through prudent genetic management. However, our model simulations indicate
that if genetic management is reduced in rigor or scope or discontinued, inbreeding
would increase rapidly and ID could have significant negative impacts on future
viability.
Given that the wild population is on the brink of extinction, sound scientific
management of the SSP seems warranted. Regrettably, understanding the absolute
value of genetic management using a model is difficult. Although ZooRisk models
genetic management more accurately than any other existing models, its approach
produces results more optimistic than can actually be achieved because prioritized
pairs are the successful breeders. However, without genetic management applied (i.e.random breeding), ZooRisk still produces overly optimistic results because left to
their own devices zoological managers often selectively pair ‘proven breeders’ (i.e. a
nonrandom strategy). Despite these caveats, our results support theory and
expectation that the retention of GD resulting from genetic management reduces
the relative level of risk for this population.
Managers of free-ranging populations have used risk assessments for
over 20 years [Beissinger and McCullough, 2002]; for these populations, the
PVA process is well developed and widely although not unconditionally accepted
[Groom and Pascual, 1998; Ralls et al., 2002]. Although managers have rarely
conducted PVAs of captive populations [but see Bustamante 1996—beardedvultures; Wiese, 2000—Asian elephants; Faust et al., 2006—Asian elephants;
Rodriguez-Clark and Sanchez Mercado, 2006—Andean bears], we found this
PVA approach to be a valuable method to assess the future genetic, demographic,
and risk status of the Bali Mynah SSP. In contrast to typical free-ranging
wildlife populations, many zoo populations possess long term, comprehensive data,
experience less environmental variation [Faust, 2006], and can be readily managed
for genetic and demographic characteristics; thus, PVAs for zoo populations avoid
common criticisms leveled at PVAs for free-ranging populations.
In summary, the projected low risk of population decline and extinction should
alleviate concerns of participants regarding the future of the Bali mynah SSPpopulation and its preservation and use for conservation purposes. Understanding
the population’s high probability of persistence in the short- and long term should
strengthen the resolve of population managers to continue the strong, consistent
science-based management of the Bali mynah SSP. From a broader perspective, this
risk assessment provides additional value to avian population management. Within
the zoo community, doubts have existed that long-term programs for bird
populations, especially passerines, can be developed [CBSG: AZA wild bird
acquisition workshop group, 2004]. The Bali mynah results can dispel some of
these doubts. Although many avian AZA populations are currently at a smaller size
than the Bali mynah population and thus more vulnerable to unplanned declines,
they may retain the potential to build populations comparable to the Bali mynah
SSP; to realize this potential will require cooperative and scientific management and
248 Earnhardt et al.
Zoo Biology

8/17/2019 Earnhardt 2009
http://slidepdf.com/reader/full/earnhardt-2009 20/23
a commitment to providing husbandry and space similar to the long-term
management of this SSP. Risk assessments such as this PVA can assist as avian
managers develop programs for less established species. In fact, for any program
striving to meet self-sustaining population goals a comprehensive risk assessment
provides quantitative data to identify a population’s risk of decline and its threatfactors as well as identify potential actions that might benefit long-term population
persistence.
CONCLUSIONS AND RECOMMENDATIONS
1. The Bali mynah SSP population is at Low Risk of extinction under existing
conditions. Because existing fecundity and mortality rates can sustain the
population and do not jeopardize the future SSP population, efforts should be
directed to maintaining husbandry practices and managers should avoid factors
(e.g. introduction of disease) that could increase mortality.
2. Under current management practices, our analysis indicates that the TPS of 250 islarger than necessary to retain a Low Risk in captivity category for the Bali
mynah SSP population. Managers who make the ultimate decision ;about the
population’s TPS need to consider whether a TPS of 250 should exist for reasons
other than the risk level. If managers do decide to reduce the TPS and seek to
retain a Low Risk level, genetic management is essential.
3. Genetic management can retain gene diversity and minimize inbreeding
benefiting the genetic health of the Bali mynah population into the future.
Efforts to complete individual recommendations produced by the annual
breeding and transfer plan should be pursued to retain the maximal genetic
diversity.4. At the current TPS, the Bali mynah SSP population can be self-sustaining even if
birds are harvested. If managers decide to participate in a reintroduction program
in Bali by contributing birds from the SSP, they should avoid large harvests (i.e.
above 30 individuals) and short intervals (i.e. less than 5 years); these actions
should reduce risk for the zoo population.
5. A risk assessment using qualitative and quantitative approaches revealed
factors that are likely and unlikely to impact the Bali mynah population
dynamics. These impacts, which arise from the diversity of factors, their
interactions, and the potential management actions, are not intuitive and require
a comprehensive risk assessment. When risk assessments are repeated at regular
intervals, new data or changes in rates can be incorporated to understand
potential changes to the population dynamics, and management can be reviewed
and adapted relative to those changes. For the Bali mynah SSP future risk
assessments conducted on the same schedule as a Regional Collection Plan would
be an appropriate time frame.
ACKNOWLEDGMENTS
We thank Bob Seibels and Carrie Schloss for their valuable comments
on an early version of this manuscript. Comments from the reviewers providedexcellent guidance for improvements. We appreciate efforts of those institutions
249Bali Mynah Risk Assessment
Zoo Biology
8/17/2019 Earnhardt 2009
http://slidepdf.com/reader/full/earnhardt-2009 21/23
that contribute data on their specimens and cooperate with SSP population
management.
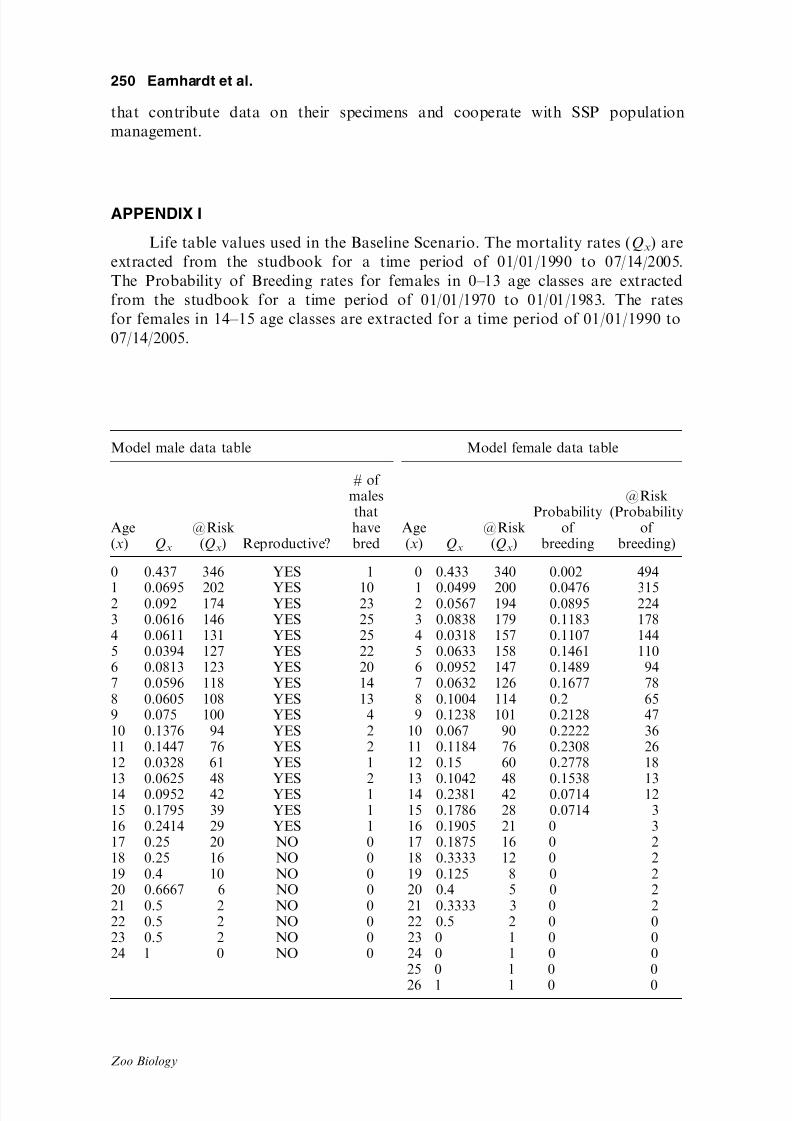
APPENDIX I
Life table values used in the Baseline Scenario. The mortality rates (Qx
) are
extracted from the studbook for a time period of 01/01/1990 to 07/14/2005.
The Probability of Breeding rates for females in 0–13 age classes are extracted
from the studbook for a time period of 01/01/1970 to 01/01/1983. The rates
for females in 14–15 age classes are extracted for a time period of 01/01/1990 to
07/14/2005.
Model male data table Model female data table
Age(x) Q
x
@Risk(Q
x) Reproductive?
# of malesthathavebred
Age(x) Q
x
@Risk(Q
x)
Probabilityof
breeding
@Risk(Probability
of breeding)
0 0.437 346 YES 1 0 0.433 340 0.002 494
1 0.0695 202 YES 10 1 0.0499 200 0.0476 3152 0.092 174 YES 23 2 0.0567 194 0.0895 2243 0.0616 146 YES 25 3 0.0838 179 0.1183 1784 0.0611 131 YES 25 4 0.0318 157 0.1107 1445 0.0394 127 YES 22 5 0.0633 158 0.1461 1106 0.0813 123 YES 20 6 0.0952 147 0.1489 947 0.0596 118 YES 14 7 0.0632 126 0.1677 788 0.0605 108 YES 13 8 0.1004 114 0.2 659 0.075 100 YES 4 9 0.1238 101 0.2128 4710 0.1376 94 YES 2 10 0.067 90 0.2222 3611 0.1447 76 YES 2 11 0.1184 76 0.2308 2612 0.0328 61 YES 1 12 0.15 60 0.2778 18
13 0.0625 48 YES 2 13 0.1042 48 0.1538 1314 0.0952 42 YES 1 14 0.2381 42 0.0714 1215 0.1795 39 YES 1 15 0.1786 28 0.0714 316 0.2414 29 YES 1 16 0.1905 21 0 317 0.25 20 NO 0 17 0.1875 16 0 218 0.25 16 NO 0 18 0.3333 12 0 219 0.4 10 NO 0 19 0.125 8 0 220 0.6667 6 NO 0 20 0.4 5 0 221 0.5 2 NO 0 21 0.3333 3 0 222 0.5 2 NO 0 22 0.5 2 0 023 0.5 2 NO 0 23 0 1 0 024 1 0 NO 0 24 0 1 0 0
25 0 1 0 0
26 1 1 0 0
250 Earnhardt et al.
Zoo Biology
8/17/2019 Earnhardt 2009
http://slidepdf.com/reader/full/earnhardt-2009 22/23
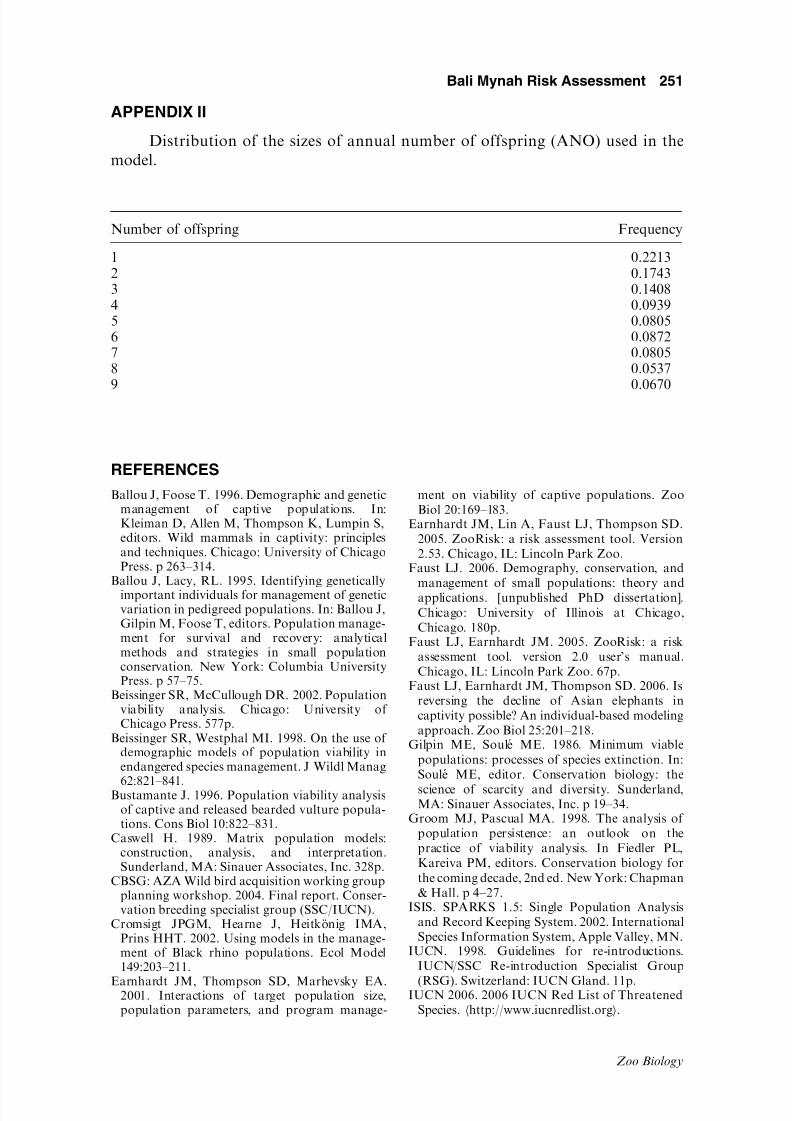
APPENDIX II
Distribution of the sizes of annual number of offspring (ANO) used in the
model.
REFERENCES
Ballou J, Foose T. 1996. Demographic and geneticmanagement of captive populations. In:Kleiman D, Allen M, Thompson K, Lumpin S,editors. Wild mammals in captivity: principlesand techniques. Chicago: University of ChicagoPress. p 263–314.
Ballou J, Lacy, RL. 1995. Identifying geneticallyimportant individuals for management of geneticvariation in pedigreed populations. In: Ballou J,Gilpin M, Foose T, editors. Population manage-ment for survival and recovery: analyticalmethods and strategies in small populationconservation. New York: Columbia UniversityPress. p 57–75.
Beissinger SR, McCullough DR. 2002. Populationviability analysis. Chicago: University of Chicago Press. 577p.
Beissinger SR, Westphal MI. 1998. On the use of demographic models of population viability inendangered species management. J Wildl Manag
62:821–841.Bustamante J. 1996. Population viability analysisof captive and released bearded vulture popula-tions. Cons Biol 10:822–831.
Caswell H. 1989. Matrix population models:construction, analysis, and interpretation.Sunderland, MA: Sinauer Associates, Inc. 328p.
CBSG: AZA Wild bird acquisition working groupplanning workshop. 2004. Final report. Conser-vation breeding specialist group (SSC/IUCN).
Cromsigt JPGM, Hearne J, Heitko ¨ nig IMA,Prins HHT. 2002. Using models in the manage-ment of Black rhino populations. Ecol Model149:203–211.
Earnhardt JM, Thompson SD, Marhevsky EA.2001. Interactions of target population size,population parameters, and program manage-
ment on viability of captive populations. Zoo
Biol 20:169–183.Earnhardt JM, Lin A, Faust LJ, Thompson SD.
2005. ZooRisk: a risk assessment tool. Version
2.53. Chicago, IL: Lincoln Park Zoo.Faust LJ. 2006. Demography, conservation, and
management of small populations: theory andapplications. [unpublished PhD dissertation].
Chicago: University of Illinois at Chicago,
Chicago. 180p.Faust LJ, Earnhardt JM. 2005. ZooRisk: a risk
assessment tool. version 2.0 user’s manual.
Chicago, IL: Lincoln Park Zoo. 67p.Faust LJ, Earnhardt JM, Thompson SD. 2006. Is
reversing the decline of Asian elephants in
captivity possible? An individual-based modeling
approach. Zoo Biol 25:201–218.Gilpin ME, Soule ´ ME. 1986. Minimum viable
populations: processes of species extinction. In:
Soule ´ ME, editor. Conservation biology: the
science of scarcity and diversity. Sunderland,MA: Sinauer Associates, Inc. p 19–34.
Groom MJ, Pascual MA. 1998. The analysis of
population persistence: an outlook on the
practice of viability analysis. In Fiedler PL,
Kareiva PM, editors. Conservation biology for
the coming decade, 2nd ed. New York: Chapman
& Hall. p 4–27.ISIS. SPARKS 1.5: Single Population Analysis
and Record Keeping System. 2002. International
Species Information System, Apple Valley, MN.IUCN. 1998. Guidelines for re-introductions.
IUCN/SSC Re-introduction Specialist Group
(RSG). Switzerland: IUCN Gland. 11p.IUCN 2006. 2006 IUCN Red List of Threatened
Species. hhttp://www.iucnredlist.orgi.
Number of offspring Frequency
1 0.22132 0.17433 0.14084 0.09395 0.08056 0.08727 0.08058 0.05379 0.0670
251Bali Mynah Risk Assessment
Zoo Biology
8/17/2019 Earnhardt 2009
http://slidepdf.com/reader/full/earnhardt-2009 23/23
Jamieson IG, Tracy LN, Fletcher D, Armstrong DP.2007. Moderate inbreeding depression in a reintro-duced population of North Island robins. AnimCons 10:95–102.
Keller LF. 1998. Inbreeding and its fitness effectsin an insular population of song sparrows
(Melospiza melodia). Evolution 52:240–250.Kruuk LEB, Sheldon BC, Merila J. 2002. Severe
inbreeding depression in collared flycatchers(Ficedula albicollis). Proc R Soc Lond 269:1581–1589.
Lacy RL. 1987. Loss of genetic diversity frommanaged populations: interacting effects of drift,mutation, immigration, selection, and populationsubdivision. Cons Biol 1:143–158.
Lacy RL. 1994. Managing genetic diversity incaptive populations of animals. In: Bowles ML,Whelan C, editors. Restoration of endangeredspecies: conceptual issues, planning and imple-mentation. Cambridge: Cambridge UniversityPress. p 63–89.
Long S, Thompson SD, Ross M, Seibels R. 2005.Population analysis and breeding and transferplan, Bal Mynah Species Survival Plan. Chicago:AZA Population Management Center. 42p.
Morris W, Doak D. 2002. Quantitative conserva-tion biology: theory and practice of populationviability analysis. Sunderland, MA: SinauerAssociates, Inc. 480p.
PACT TAG, Passerine Taxon Advisory Group.2002. Regional Collection Plan (RCP). SilverSprings, MD: Association of Zoos and Aqua-riums.
PHPA/Bird Life International IP. 1997. Balimynah recovery plan. Bogor: PHPA/Bird LifeInternational-Indonesia Programme. 24p.
Pollak JP, Lacy RC, Ballou JD. 2005. Population
management 2000, version 1.211. Brookfield, IL:
Chicago Zoological Society.Ralls K, Beissinger SR, Cochrane JF. 2002.
Guidelines for using population viability analysis
in endangered species management. In:
Beissinger SR, McCullough DR, editors. Popu-
lation viability analysis. Chicago: University of
Chicago Press. p 521–550.Rodriguez-Clark KM, Sanchez Mercado, A. 2006.
Population management of threatened taxa in
captivity within their natural ranges: lessons
from Andean bears (Tremarctos ornatus) in
Venezuela. Biol Cons 129:134–148.Schaffer ML. 1981. Minimum population sizes for
species conservation. BioScience 31:131–134.Soule ´ M. 1987. Introduction. In: Soule ´ ME, editor.
Viable populations for conservation. Cambridge:
Cambridge University Press. p 1–10.
Soule ´ ME, Gilpin M, Conway W, Foose T. 1986.
The millennium ark: how long a voyage, how
many staterooms, how many passengers? Zoo
Biol 5:101–113.
Thompson SD. 2005. North American regional
studybook for the Bali mynah. Chicago: Lincoln
Park Zoo.Wiese RJ. 2000. Asian elephants are not self-
sustaining in North America. Zoo Biol
19:299–309.
Willis K, Wiese RJ. 1993. Effect of new founders
on retention of gene diversity in captive popula-
tions: a formalization of the nucleus population
concept. Zoo Biol 12:535–548.
252 Earnhardt et al.
Zoo Biology