E-Invoicing / E-Billing International Market Overview ... · PDF fileE-Invoicing / E-Billing...
26
E-Invoicing / E-Billing International Market Overview & Forecast Bruno Koch February 2015
Transcript of E-Invoicing / E-Billing International Market Overview ... · PDF fileE-Invoicing / E-Billing...
E-Invoicing / E-Billing
International Market
Overview & Forecast
Bruno Koch
February 2015

page 218.02.2015
Global overview
© Bruno Koch, Billentis - Reproduction is authorised provided the source is acknowledged.
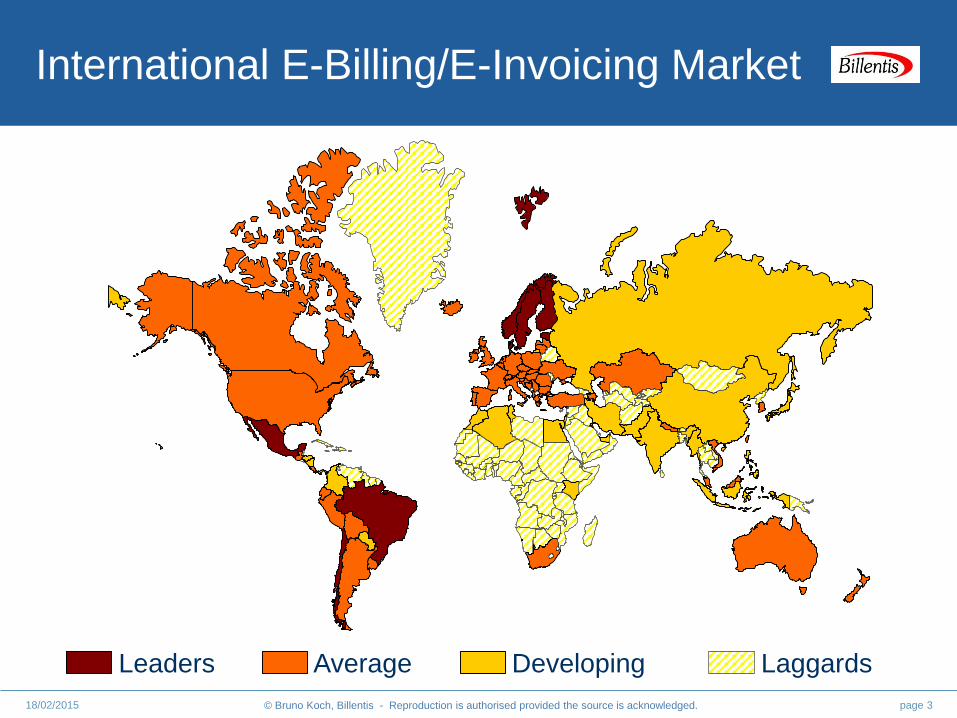
International E-Billing/E-Invoicing Market
page 318/02/2015
Leaders Average LaggardsDeveloping
© Bruno Koch, Billentis - Reproduction is authorised provided the source is acknowledged.
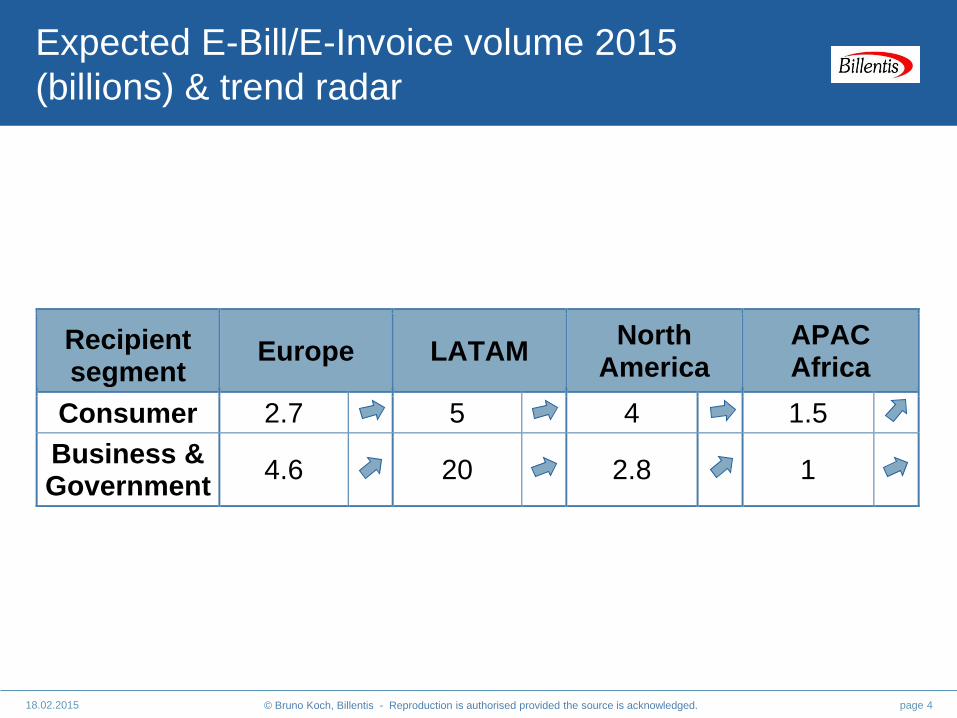
Expected E-Bill/E-Invoice volume 2015
(billions) & trend radar
page 418.02.2015
Recipient segment
Europe LATAM North
America APAC Africa
Consumer 2.7 5 4 1.5
Business & Government
4.6 20 2.8 1
© Bruno Koch, Billentis - Reproduction is authorised provided the source is acknowledged. page 518/02/2015
North America
• 24% of all U.S. consumer bills are sent electronically only (Source:
Annual survey of Fiserv)
• Payment, Trade Finance, Dynamic Discounting and Procurement
as main drivers in the B2B segment
• Preference for optimization of internal operations (AR and AP
management); Increasing focus on collaboration and electronic
interaction between trading partners
• Direct exchange of E-Invoices among trading partners still
dominates; compared to Europe and LATAM, 3rd party operators
still not yet very numerous, but the number meanwhile surpassed
130
• E-Invoicing gains more traction; B2B volume increase of around
20% predicted
© Bruno Koch, Billentis - Reproduction is authorised provided the source is acknowledged. page 618/02/2015
Latin America
• E-Invoicing pushed by public sector
• Real-time audit or invoice data mining by tax authorities with the
aim of combating tax evasion
• Obligations for E-Invoicing announced/planned/live in Argentina
(obligation for additional industry), Bolivia, Brazil, Chile, Costa
Rica, Ecuador, Guatemala, Mexico, Peru (full mandatory E-
Invoicing planned by 2017) and Uruguay.
• Brazil, Mexico and Chile as market leaders
• Next step in invoice-related digitalization: currently used fiscal
printers in the retail segment will be replaced by a fully electronic
solution, based on an XML file with a digital signature. Each
transaction is authorized online before the sales process.
© Bruno Koch, Billentis - Reproduction is authorised provided the source is acknowledged. page 718/02/2015
Asia & Pacific
• First steps with B2C E-Billing; B2B legislation missing in many
countries; sometimes, EDI invoices & paper originals
• Many advanced countries are more likely to adopt the (tax)
control focussed LATAM model than the liberal European model
• Russia with tremendous relative growth rates (multiplies volume)
• Some other countries mandate the market participants to
exchange invoices in electronic format, e.g. Kazakhstan (likely
2016), Singapore, critical industries in Turkey, Vietnam, …
• Some countries are in the process of closing the loop between
tills at points of sale – tax authorities – and clients. This happens
either with the help of fiscal printers or electronic receipts / e-
tickets (similarities with E-Billing)
• Several advanced initiatives of federal administrations in the
Pacific Region, including e-Procurement

page 818.02.2015
European Market
© Bruno Koch, Billentis - Reproduction is authorised provided the source is acknowledged.
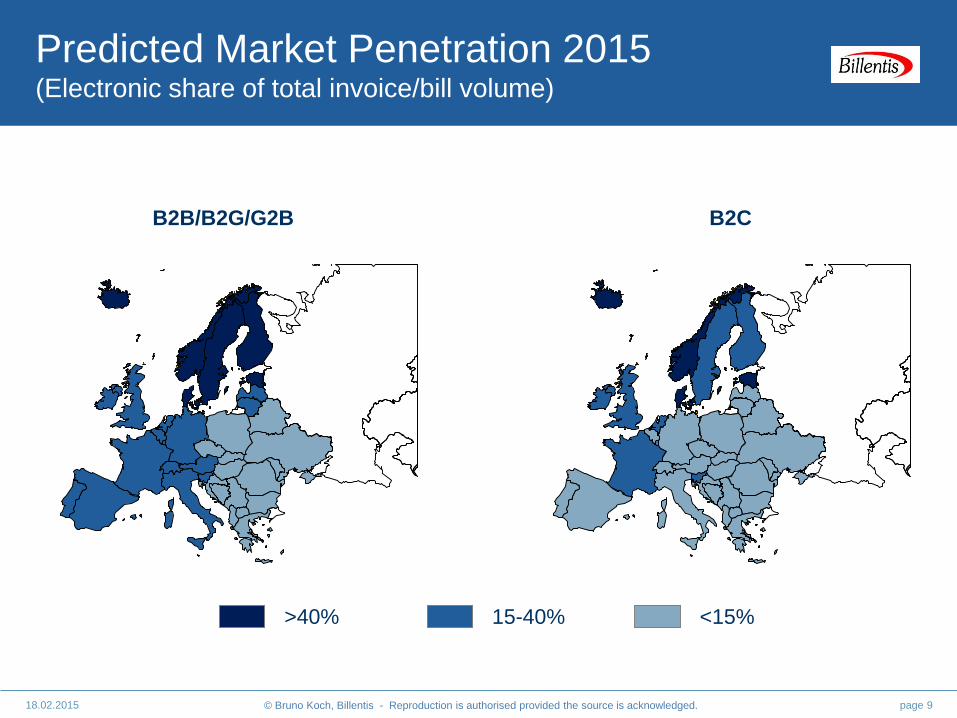
Predicted Market Penetration 2015(Electronic share of total invoice/bill volume)
page 918.02.2015
>40% 15-40% <15%
B2CB2B/B2G/G2B
© Bruno Koch, Billentis - Reproduction is authorised provided the source is acknowledged.
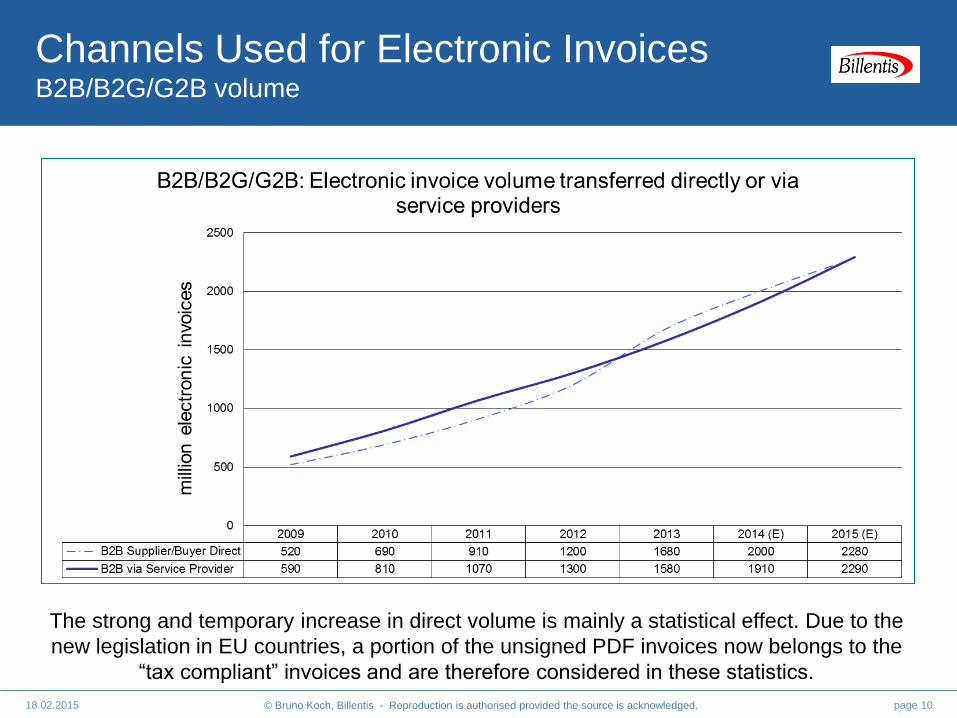
Channels Used for Electronic InvoicesB2B/B2G/G2B volume
page 1018.02.2015
The strong and temporary increase in direct volume is mainly a statistical effect. Due to the
new legislation in EU countries, a portion of the unsigned PDF invoices now belongs to the
“tax compliant” invoices and are therefore considered in these statistics.
© Bruno Koch, Billentis - Reproduction is authorised provided the source is acknowledged.
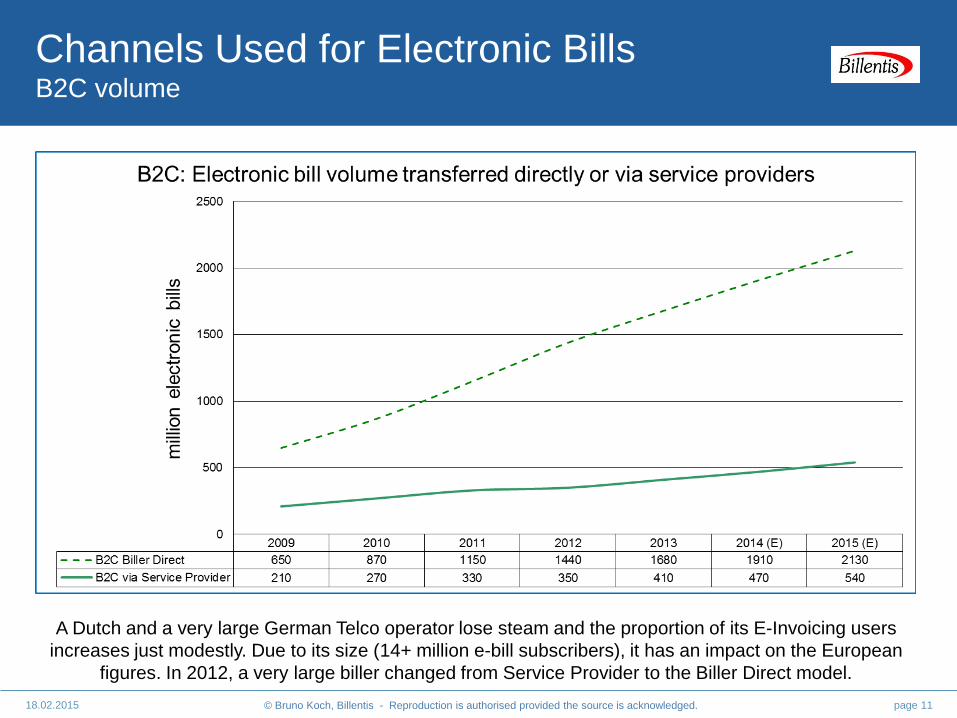
Channels Used for Electronic BillsB2C volume
page 1118.02.2015
A Dutch and a very large German Telco operator lose steam and the proportion of its E-Invoicing users
increases just modestly. Due to its size (14+ million e-bill subscribers), it has an impact on the European
figures. In 2012, a very large biller changed from Service Provider to the Biller Direct model.
© Bruno Koch, Billentis - Reproduction is authorised provided the source is acknowledged. page 1218.02.2015
European Trends (1)New EU directives
• Public Procurement Directive 2014/24/EU
Fully electronic communication, tenders, …
Implement in national law of member states until April 2016 and practise from October 2018
Affects hundreds of thousands of Public Administrations (PA) and millions of Suppliers
• Directive 2014/55/EU
Electronic invoicing in public procurement; PAs have to accept electronic invoices
Apply on all federal levels at the latest by November 2018
Affects hundreds of thousands of Public Administrations and millions of Suppliers
© Bruno Koch, Billentis - Reproduction is authorised provided the source is acknowledged. page 1318/02/2015
European Trends (2)
• New B2G E-Invoicing obligations
Italy in final implementation phase for all public
administrations and its suppliers
Slovenia and Spain from 2015
Switzerland (January) and Estonia from end of 2016
France announced an obligation from 2017
Sweden is currently investigating a potential B2G obligation
• PDF XML/structured electronic invoice data
Several surveys (e.g. Ernst and Young for Estonia, Las
Sociedad en red edicion 2014 for Spain) show that a
significant proportion of all E-Invoices is exchanged today as
PDF and just a minority in structured format
Industry and government initiatives strongly push the
evolution from invoice images towards structured invoices or
hybrid files (XML embedded in PDFs, e.g. ZUGFeRD)
page 1418/02/2015
E-Invoicing network
operators in Europe
© Bruno Koch, Billentis - Reproduction is authorised provided the source is acknowledged.
Expected Trends 2015/2016
page 1518/02/2015
• Provider offerings
Price erosion again substantial, especially on the supplier side
and for the classic transaction business with little added value
Increasing importance of further added values
o Trade finance
o Dynamic Discounting
o Spend analysis
o Broad market coverage (directly or via partners)
Interoperability and open platforms
o Support for processes and messages exchanged before
an invoice appears
• New operators in countries with powerful public sector projects
• Challenging application replacements by 1st generation service
providers. Some probably sell their business, others might re-
design/re-build their solutions and a few are expected to buy the
basis services as white label solutions from competitors.
© Bruno Koch, Billentis - Reproduction is authorised provided the source is acknowledged. page 1618.02.2015
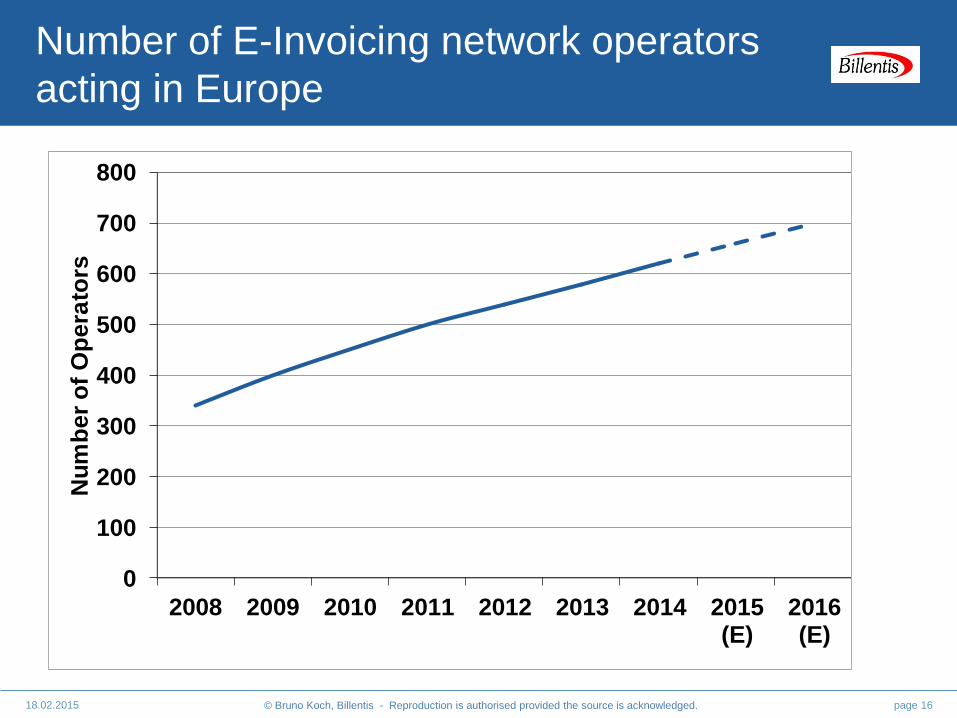
Number of E-Invoicing network operators
acting in Europe
0
100
200
300
400
500
600
700
800
2008 2009 2010 2011 2012 2013 2014 2015(E)
2016(E)
Nu
mb
er
of
Op
era
tors
© Bruno Koch, Billentis - Reproduction is authorised provided the source is acknowledged. page 1718.02.2015
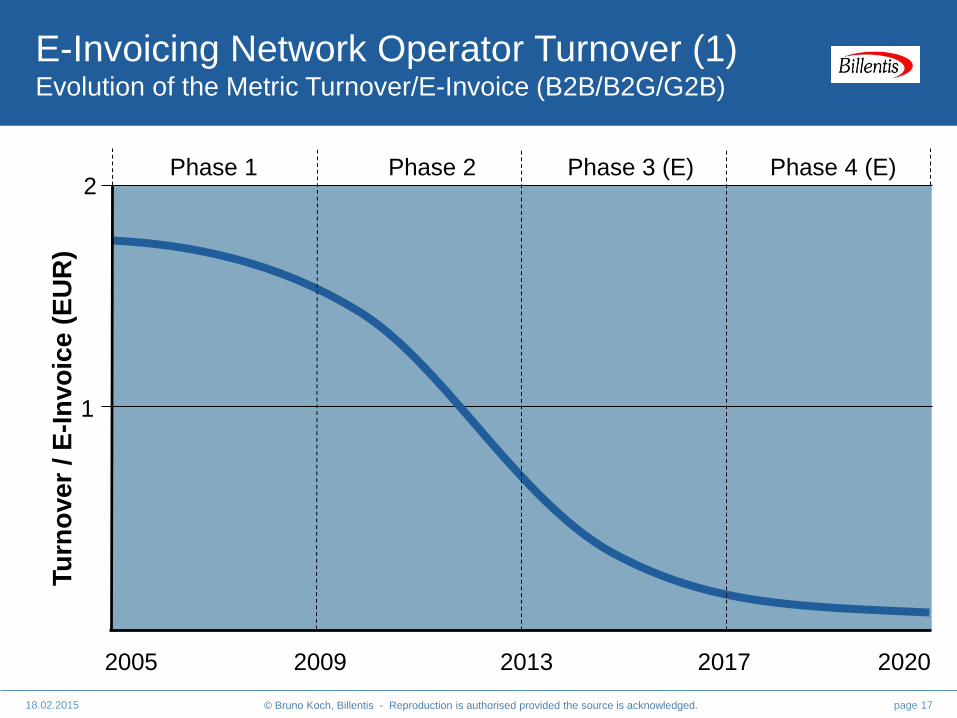
E-Invoicing Network Operator Turnover (1)Evolution of the Metric Turnover/E-Invoice (B2B/B2G/G2B)
1
2
2005 2009 2013 2017 2020
Tu
rno
ve
r / E
-In
vo
ice
(E
UR
)
Phase 1 Phase 2 Phase 3 (E) Phase 4 (E)
© Bruno Koch, Billentis - Reproduction is authorised provided the source is acknowledged. page 1818.02.2015
E-Invoicing Network Operator Turnover (2)Assumptions, considered providers and calculation base
• Service Providers acting in Europe and including all categories of
operators (EDI Clearing Centres, focussed E-Invoicing operators, others
like electronic marketplaces) are considered; depending on the degree of
added value and international coverage, the services are not necessarily
directly comparable, but all operators considered have in common that
they process and exchange tax compliant E-Invoices.
• The author developed concrete benchmarks in 2004 and 2009 based on
the typical size/volume of senders and recipients at that time and
investigated the situation again in January 2013, 2014 and 2015.
• The ratio of the turnover and the volume processed by many operators
enhanced with inside information on consulting projects are the sources
considered.
© Bruno Koch, Billentis - Reproduction is authorised provided the source is acknowledged. page 1918.02.2015
• The public administration becomes a user, thereby
affecting the vast majority of enterprises in each European
country.
significantly increasing the number of users as well as the
processed volume.
• Most countries declaring some level of obligation to E-Invoicing
might see additional service providers trying to play a role
between the suppliers and the public administration. This is
despite the fact that federal administrations often do not intend to
pay a fee as an E-Invoice recipient, but just as an issuer.
• Increasingly, service providers rely on just the fees of senders of
electronic invoices and other business documents.
• Bi-directional exchange of business documents becomes more
popular; the income erosion per E-Invoice might be at least
partially compensated through additional business messages and
other added-values.
E-Invoicing Network Operator Turnover (3)
Phase 3 (2013-2016)
© Bruno Koch, Billentis - Reproduction is authorised provided the source is acknowledged. page 2018.02.2015
• The price erosion might be driven by further parameters
Discount providers gain traction.
The new legislation in EU countries gives a temporary boost
towards direct exchange of PDF invoices, bypassing the
service providers.
• Service provider contracts with the first generation of large
E-Invoicing users might expire, resulting in tough price
negotiations for renewal.
• Standardization of E-Invoicing makes changes from one service
provider to the next easier.
E-Invoicing Network Operator Turnover (4)
Phase 3 (2013-2016)
The Turnover/E-Invoice is estimated to erode by 13-17% p.a.
However, new related business opportunities might appear and we
are not to be concerned about the survival capability of agile
providers. The turnover of operators is estimated to grow annually
by 6-10% during the next 3 years.
© Bruno Koch, Billentis - Reproduction is authorised provided the source is acknowledged. page 2118.02.2015
• Mass market
• E-Invoicing as a commodity business
• Service providers might offer the services on average for the price
“internal costs + small margin” (e.g. in 2020 at EUR 0.10 ± 0.05)
and use it as a base for other added-values.
• Why did I not explicitly mention the operators offering the services
“for free”? Because the previous slides consider the “whole
operator community”, and the figures build averages.
E-Invoicing Network Operator Turnover (5)
Phase 4 (2017-2020)
A limited number of operators are expected to be competitive due to
economies of scale. Others might differentiate themselves by
offering added value along the electronic supply chain or by
focussing on interesting market niches.
© Bruno Koch, Billentis - Reproduction is authorised provided the source is acknowledged. page 2218.02.2015
Financial figures of up to 210+ E-Invoicing
network operators acting in Europe
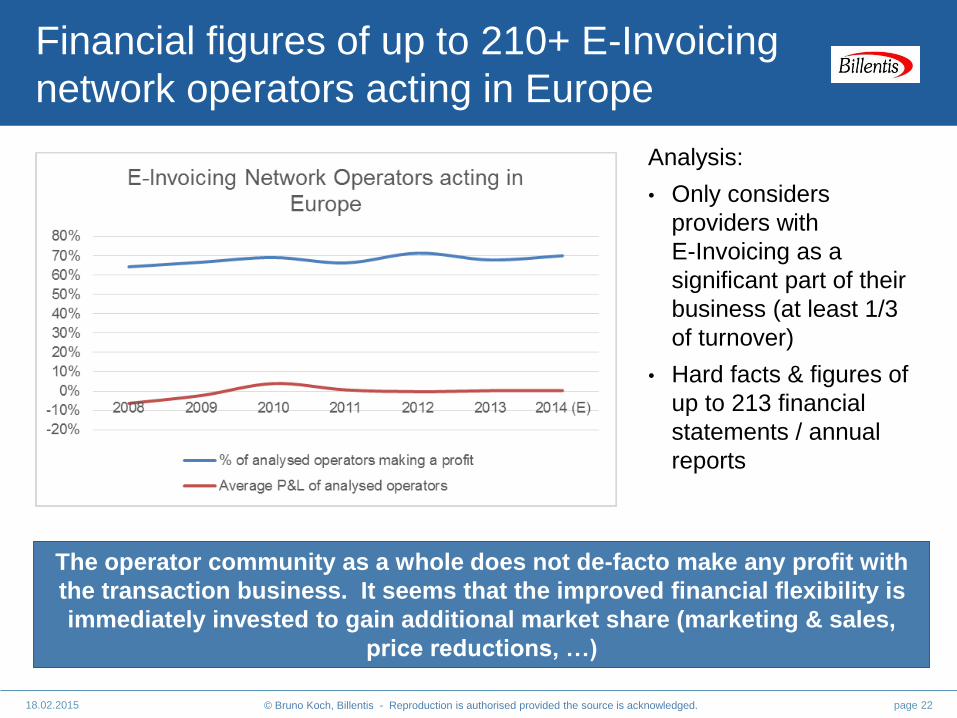
Analysis:
• Only considers
providers with
E-Invoicing as a
significant part of their
business (at least 1/3
of turnover)
• Hard facts & figures of
up to 213 financial
statements / annual
reports
The operator community as a whole does not de-facto make any profit with
the transaction business. It seems that the improved financial flexibility is
immediately invested to gain additional market share (marketing & sales,
price reductions, …)
© Bruno Koch, Billentis - Reproduction is authorised provided the source is acknowledged. page 2318.02.2015
Please find further details in the Market Report
“E-Invoicing / E-Billing 2015”
Report issued in June 2015.
For further information, please visit
www.billentis.com | Twitter| XING | LinkedIn
In-depth market information

page 2418.02.2015
Definitions &
Methodology
© Bruno Koch, Billentis - Reproduction is authorised provided the source is acknowledged. page 2518.02.2015
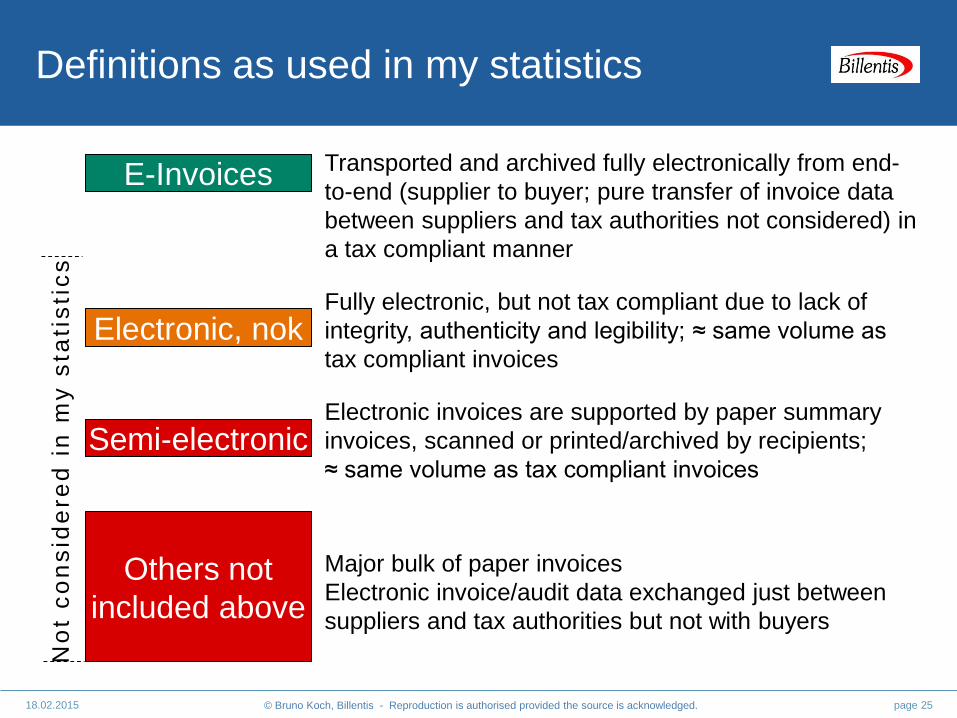
Definitions as used in my statistics
Transported and archived fully electronically from end-
to-end (supplier to buyer; pure transfer of invoice data
between suppliers and tax authorities not considered) in
a tax compliant manner
Fully electronic, but not tax compliant due to lack of
integrity, authenticity and legibility; ≈ same volume as
tax compliant invoices
Electronic invoices are supported by paper summary
invoices, scanned or printed/archived by recipients;
≈ same volume as tax compliant invoices
Major bulk of paper invoices
Electronic invoice/audit data exchanged just between
suppliers and tax authorities but not with buyers
Others not
included above
Semi-electronic
Electronic, nok
E-Invoices
No
t c
on
sid
ere
d i
n m
y s
tati
sti
cs
© Bruno Koch, Billentis - Reproduction is authorised provided the source is acknowledged. page 2618.02.2015
Methodology
• Screening and interpreting 700+ key sources, including: User surveys in countries (AT, ES, FR, PT etc.) and industries
(e.g. banking associations, GS1, santésuisse, …)
Figures from large invoice issuers & recipients (e.g. Deutsche
Telecom with around 600 million invoices issued p.a., public
sector in several countries representing 10%+ of invoice
volume in each country)
Figures of leading service providers
Consolidated figures of domestic E-Invoicing associations
• In total, results of surveys with 20,000+ enterprises and
15,000 consumers are considered in these statistics and
forecasts