DYNAMICS AND FORECASTING OF POPULATION GROWTH AND …
8
DYNAMICS AND FORECASTING OF POPULATION GROWTH AND URBAN EXPANSION IN SRINAGAR CITY – A GEOSPATIAL APPROACH Majid Farooq a, *, Mohammad Muslim b a Department of Ecology, Environment and Remote Sensing, SDA Colony Bemina, Srinagar, J&K, India – 190018. [email protected] b Division of Environmental Sciences, SKUAST-K Shalimar, J&K, India – 191121. [email protected] ISPRS TC VIII KEY WORDS: Urban, Sprawl, Population, Regression, Temporal ABSTRACT: The urban areas of developing countries are densely populated and need the use of sophisticated monitoring systems, such as remote sensing and geographical information systems (GIS). The urban sprawl of a city is best understood by studying the dynamics of LULC change which can be easily generated by using sequential satellite images, required for the prediction of urban growth. Multivariate statistical techniques and regression models have been used to establish the relationship between the urban growth and its causative factors and for forecast of the population growth and urban expansion. In Srinagar city, one of the fastest growing metropolitan cities situated in Jammu and Kashmir State of India, sprawl is taking its toll on the natural resources at an alarming pace. The present study was carried over a period of 40 years (1971–2011), to understand the dynamics of spatial and temporal variability of urban sprawl. The results reveal that built-up area has increased by 585.08% while as the population has increased by 214.75%. The forecast showed an increase of 246.84 km 2 in built-up area which exceeds the overall carrying capacity of the city. The most common conversions were also evaluated. * Corresponding author. This is useful to know for communication with the appropriate person in cases with more than one author. 1. INTRODUCTION Urban sprawl is the outgrowth of built-up along the periphery of cities and along highways. Although an accurate definition of urban sprawl is a subject of debate, however, a consensus is that urban sprawl is characterized by an unplanned pattern of growth, driven by a multitude of processes and leading to inefficient utilization of resources. Rapid urbanization poses considerable social and environmental challenges to city authorities and planners (Sudhira et al. 2004). Uncontrolled population growth, economic disparities and poverty all increase the potential of sprawl. Poor urban planning and housing development lead to construction of informal settlements that lack access to basic infrastructure and provide poor living conditions. Consequently, increase in unregulated traffic, noise, and underdeveloped sewage and waste management cause further environmental degradation (Zeug and Eckert 2010). Close monitoring of rapid urbanization is crucial for the creation of sustainable urban environments. Monitoring urban development is mainly to find the type, amount and the location of land conversion for future planning (Shekhar 2004). The built-up and impervious surfaces are generally considered as the parameter of quantifying urban sprawl (Torrens and Alberti 2000, Barnes et al. 2001, Epstein et al. 2002, Jothimani 1997). The study on urban sprawl is attempted in the developed countries (Batty et al. 1999, Torrens and Alberti 2000, Barnes et al. 2001, Hurd et al. 2001, Epstein et al. 2002) and recently in developing countries such as China (Yeh and Li 2001, Cheng and Masser 2003) and India (Jothimani 1997, Lata et al. 2001, Sudhira et al. 2004). Morphological measurement of urban development is important for land use planning and the study development (Webster 1995, Shen 2002). Geographical Information System (GIS) and remote sensing are very useful in the formulation and implementation of the spatial and temporal changes, which are essential components of regional planning to ensure the sustainable development. Various analysts have made considerable progress in quantifying the urban sprawl pattern (Theobald 2001, Lata et al. 2001, Torrens and Alberti 2000, Batty et al, 1999). The spatial patterns of urban sprawl over different time periods can be systematically detected, mapped, and analyzed using remote sensing and GIS data along with conventional ground data (Barnes et al. 2001, Lata et al. 2001). Remote sensing has been used to monitor this urban development, similar research has been carried out elsewhere by Howard (1986), Fung and LeDrew (1987), Li and Yeh (1998) and various techniques have been developed for urban growth detection efficiency, including image differencing (Toll 1980), Image rationing (Nelson 1983), Masking Method (Pilon et al. 1988) and principal component analysis (Fung and LeDrew 1987, Li and Yeh 1998). Urban expansion is driven by population growth, social and economic development (Liu et al. 2002, Wilson et al. 2003). Typically, empirical approaches use regression methods to quantify models from data that describe the spatial and historic distribution of land use and population changes. There are many examples of empirical models based on regression methods (Veldkamp and Fresco 1996, deKoning et al. 1998, Pontius and Schneider 2001, Serneels and Lambin 2001). The statistical models implemented possess a sufficiently general form that they can be implemented wherever LULC is of interest to policy makers. Because land use change is usually represented as a discrete change (for example, from agricultural land to scrubland or to other land use class), logistic (both binary and multinomial) regression is an appropriate statistical The International Archives of the Photogrammetry, Remote Sensing and Spatial Information Sciences, Volume XL-8, 2014 ISPRS Technical Commission VIII Symposium, 09 – 12 December 2014, Hyderabad, India This contribution has been peer-reviewed. doi:10.5194/isprsarchives-XL-8-709-2014 709
Transcript of DYNAMICS AND FORECASTING OF POPULATION GROWTH AND …

DYNAMICS AND FORECASTING OF POPULATION GROWTH AND URBAN
EXPANSION IN SRINAGAR CITY – A GEOSPATIAL APPROACH
Majid Farooq a, *, Mohammad Muslim b a Department of Ecology, Environment and Remote Sensing, SDA Colony Bemina, Srinagar, J&K, India – 190018.
[email protected] b Division of Environmental Sciences, SKUAST-K Shalimar, J&K, India – 191121.
ISPRS TC VIII
KEY WORDS: Urban, Sprawl, Population, Regression, Temporal
ABSTRACT:
The urban areas of developing countries are densely populated and need the use of sophisticated monitoring systems, such as remote
sensing and geographical information systems (GIS). The urban sprawl of a city is best understood by studying the dynamics of
LULC change which can be easily generated by using sequential satellite images, required for the prediction of urban growth.
Multivariate statistical techniques and regression models have been used to establish the relationship between the urban growth and
its causative factors and for forecast of the population growth and urban expansion. In Srinagar city, one of the fastest growing
metropolitan cities situated in Jammu and Kashmir State of India, sprawl is taking its toll on the natural resources at an alarming
pace. The present study was carried over a period of 40 years (1971–2011), to understand the dynamics of spatial and temporal
variability of urban sprawl. The results reveal that built-up area has increased by 585.08% while as the population has increased by
214.75%. The forecast showed an increase of 246.84 km2 in built-up area which exceeds the overall carrying capacity of the city.
The most common conversions were also evaluated.
* Corresponding author. This is useful to know for communication
with the appropriate person in cases with more than one author.
1. INTRODUCTION
Urban sprawl is the outgrowth of built-up along the periphery
of cities and along highways. Although an accurate definition of
urban sprawl is a subject of debate, however, a consensus is that
urban sprawl is characterized by an unplanned pattern of
growth, driven by a multitude of processes and leading to
inefficient utilization of resources. Rapid urbanization poses
considerable social and environmental challenges to city
authorities and planners (Sudhira et al. 2004). Uncontrolled
population growth, economic disparities and poverty all
increase the potential of sprawl. Poor urban planning and
housing development lead to construction of informal
settlements that lack access to basic infrastructure and provide
poor living conditions. Consequently, increase in unregulated
traffic, noise, and underdeveloped sewage and waste
management cause further environmental degradation (Zeug
and Eckert 2010). Close monitoring of rapid urbanization is
crucial for the creation of sustainable urban environments.
Monitoring urban development is mainly to find the type,
amount and the location of land conversion for future planning
(Shekhar 2004). The built-up and impervious surfaces are
generally considered as the parameter of quantifying urban
sprawl (Torrens and Alberti 2000, Barnes et al. 2001, Epstein et
al. 2002, Jothimani 1997). The study on urban sprawl is
attempted in the developed countries (Batty et al. 1999, Torrens
and Alberti 2000, Barnes et al. 2001, Hurd et al. 2001, Epstein
et al. 2002) and recently in developing countries such as China
(Yeh and Li 2001, Cheng and Masser 2003) and India
(Jothimani 1997, Lata et al. 2001, Sudhira et al. 2004).
Morphological measurement of urban development is important
for land use planning and the study development (Webster
1995, Shen 2002). Geographical Information System (GIS) and
remote sensing are very useful in the formulation and
implementation of the spatial and temporal changes, which are
essential components of regional planning to ensure the
sustainable development. Various analysts have made
considerable progress in quantifying the urban sprawl pattern
(Theobald 2001, Lata et al. 2001, Torrens and Alberti 2000,
Batty et al, 1999). The spatial patterns of urban sprawl over
different time periods can be systematically detected, mapped,
and analyzed using remote sensing and GIS data along with
conventional ground data (Barnes et al. 2001, Lata et al. 2001).
Remote sensing has been used to monitor this urban
development, similar research has been carried out elsewhere by
Howard (1986), Fung and LeDrew (1987), Li and Yeh (1998)
and various techniques have been developed for urban growth
detection efficiency, including image differencing (Toll 1980),
Image rationing (Nelson 1983), Masking Method (Pilon et al.
1988) and principal component analysis (Fung and LeDrew
1987, Li and Yeh 1998). Urban expansion is driven by
population growth, social and economic development (Liu et al.
2002, Wilson et al. 2003). Typically, empirical approaches use
regression methods to quantify models from data that describe
the spatial and historic distribution of land use and population
changes. There are many examples of empirical models based
on regression methods (Veldkamp and Fresco 1996, deKoning
et al. 1998, Pontius and Schneider 2001, Serneels and Lambin
2001). The statistical models implemented possess a sufficiently
general form that they can be implemented wherever LULC is
of interest to policy makers. Because land use change is usually
represented as a discrete change (for example, from agricultural
land to scrubland or to other land use class), logistic (both
binary and multinomial) regression is an appropriate statistical
The International Archives of the Photogrammetry, Remote Sensing and Spatial Information Sciences, Volume XL-8, 2014ISPRS Technical Commission VIII Symposium, 09 – 12 December 2014, Hyderabad, India
This contribution has been peer-reviewed. doi:10.5194/isprsarchives-XL-8-709-2014
709
model to use (Trexler and Travis 1993). However, there is a
general lack of research on the development of methods and
indicators to quantify and study urban expansion (Dendoncker
et al. 2008) and less attention has been paid to long time series
urban expansion and morphological pattern of urban expansion
in the Srinagar City.
In the current study urban growth patterns of Srinagar city were
mapped using time series of satellite and population census data
from the period between 1971 and 2011. After careful review of
different studies, the present study was undertaken with a
primary objective to map the spatial extent of the city over the
period of time and forecast the urban sprawl and population
growth using appropriate regression models.
2. STUDY AREA
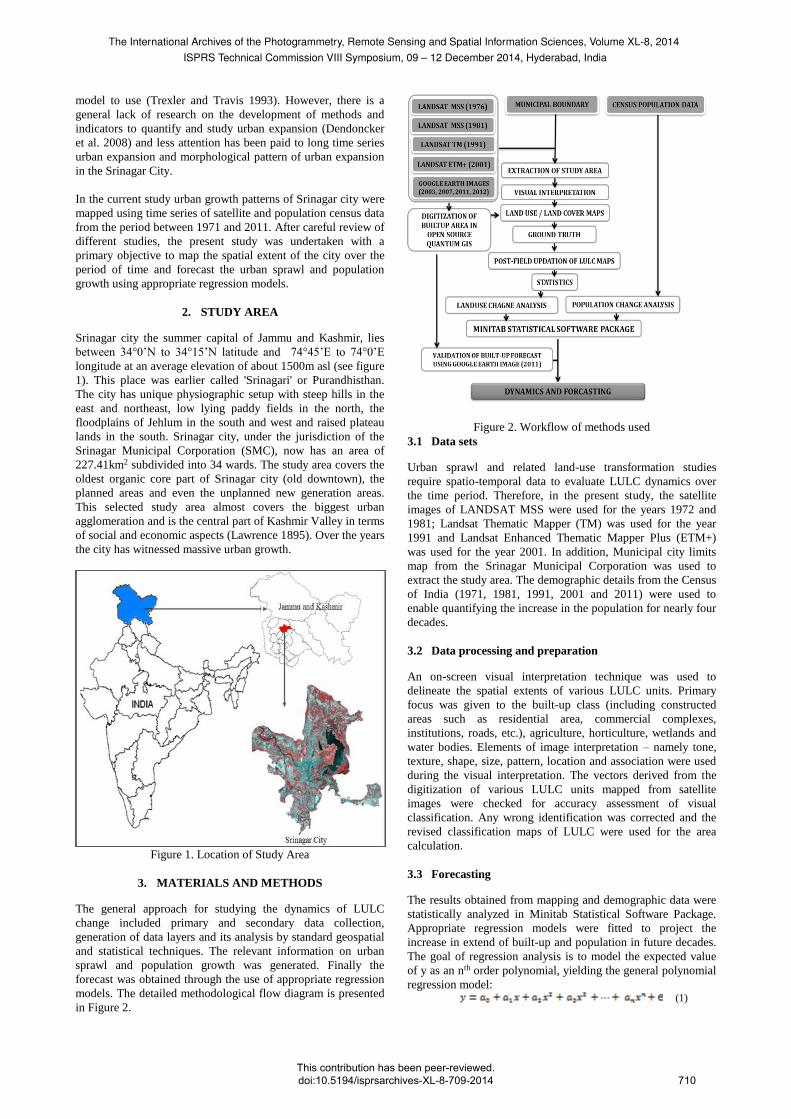
Srinagar city the summer capital of Jammu and Kashmir, lies
between 34°0’N to 34°15’N latitude and 74°45’E to 74°0’E
longitude at an average elevation of about 1500m asl (see figure
1). This place was earlier called 'Srinagari' or Purandhisthan.
The city has unique physiographic setup with steep hills in the
east and northeast, low lying paddy fields in the north, the
floodplains of Jehlum in the south and west and raised plateau
lands in the south. Srinagar city, under the jurisdiction of the
Srinagar Municipal Corporation (SMC), now has an area of
227.41km2 subdivided into 34 wards. The study area covers the
oldest organic core part of Srinagar city (old downtown), the
planned areas and even the unplanned new generation areas.
This selected study area almost covers the biggest urban
agglomeration and is the central part of Kashmir Valley in terms
of social and economic aspects (Lawrence 1895). Over the years
the city has witnessed massive urban growth.
Figure 1. Location of Study Area
3. MATERIALS AND METHODS
The general approach for studying the dynamics of LULC
change included primary and secondary data collection,
generation of data layers and its analysis by standard geospatial
and statistical techniques. The relevant information on urban
sprawl and population growth was generated. Finally the
forecast was obtained through the use of appropriate regression
models. The detailed methodological flow diagram is presented
in Figure 2.
Figure 2. Workflow of methods used
3.1 Data sets
Urban sprawl and related land-use transformation studies
require spatio-temporal data to evaluate LULC dynamics over
the time period. Therefore, in the present study, the satellite
images of LANDSAT MSS were used for the years 1972 and
1981; Landsat Thematic Mapper (TM) was used for the year
1991 and Landsat Enhanced Thematic Mapper Plus (ETM+)
was used for the year 2001. In addition, Municipal city limits
map from the Srinagar Municipal Corporation was used to
extract the study area. The demographic details from the Census
of India (1971, 1981, 1991, 2001 and 2011) were used to
enable quantifying the increase in the population for nearly four
decades.
3.2 Data processing and preparation
An on-screen visual interpretation technique was used to
delineate the spatial extents of various LULC units. Primary
focus was given to the built-up class (including constructed
areas such as residential area, commercial complexes,
institutions, roads, etc.), agriculture, horticulture, wetlands and
water bodies. Elements of image interpretation – namely tone,
texture, shape, size, pattern, location and association were used
during the visual interpretation. The vectors derived from the
digitization of various LULC units mapped from satellite
images were checked for accuracy assessment of visual
classification. Any wrong identification was corrected and the
revised classification maps of LULC were used for the area
calculation.
3.3 Forecasting
The results obtained from mapping and demographic data were
statistically analyzed in Minitab Statistical Software Package.
Appropriate regression models were fitted to project the
increase in extend of built-up and population in future decades.
The goal of regression analysis is to model the expected value
of y as an nth order polynomial, yielding the general polynomial
regression model: (1)
The International Archives of the Photogrammetry, Remote Sensing and Spatial Information Sciences, Volume XL-8, 2014ISPRS Technical Commission VIII Symposium, 09 – 12 December 2014, Hyderabad, India
This contribution has been peer-reviewed. doi:10.5194/isprsarchives-XL-8-709-2014
710
Conveniently, these models are all linear from the point of view
of estimation, since the regression function is linear in terms of
the unknown parameters a0, a1. Therefore, for least squares
analysis, the computational and inferential problems of
polynomial regression can be completely addressed using the
techniques of multiple regression. This is done by treating x,
x2... as being distinct independent variables in a multiple
regression model. Here denotes the error that is difference
between predicted and actual values. The variables that were
considered for the study included the change in built-up,
agricultural land, water bodies and change in demographic data.
3.4 Validation
Google Image of 2011 was downloaded using Google Layers
Plugin in Open Source Quantum GIS and only built-up areas
were specifically digitized. The built-up area thus digitized was
used to complement both validation and forecast of the results.
4. RESULTS AND DISCUSSION
4.1 Population change
The population census data of Srinagar city were collected
between 1971 and 2011 to estimate change in population over
the years. The analysis of the data revealed that the population
in the region has increased by about 214.75%. During the last
century the city has grown 23.4 times in terms of spatial
coverage and eight fold in population size (Bhat 2008).
Population data and socioeconomic data have a direct
relationship with urban growth (Sudhira et al. 2004). The state
of Jammu and Kashmir has a population of 12.54 million out of
which the population of Srinagar city has soared to about 1.26
million which alone constitutes 10% of the total population (see
table 1). The population growth along the 5161 urban centers in
the country is a thousand times more than in 1981
(Sivaramakrishna et al. 2005).
Table 1. Population growth over the years
4.2 Spatial Expansion of Srinagar City
In Srinagar city 14 LULC classes were obtained by carrying out
on-screen visual interpretation of satellite images of 1972,
1981, 1992 and 2001 (see table 2). Based on selective field
checks, the overall classification accuracy of the LULC maps
derived from the satellite images was determined, which ranged
from 90% to 95%. The Kappa coefficient ranged from 0.87 to
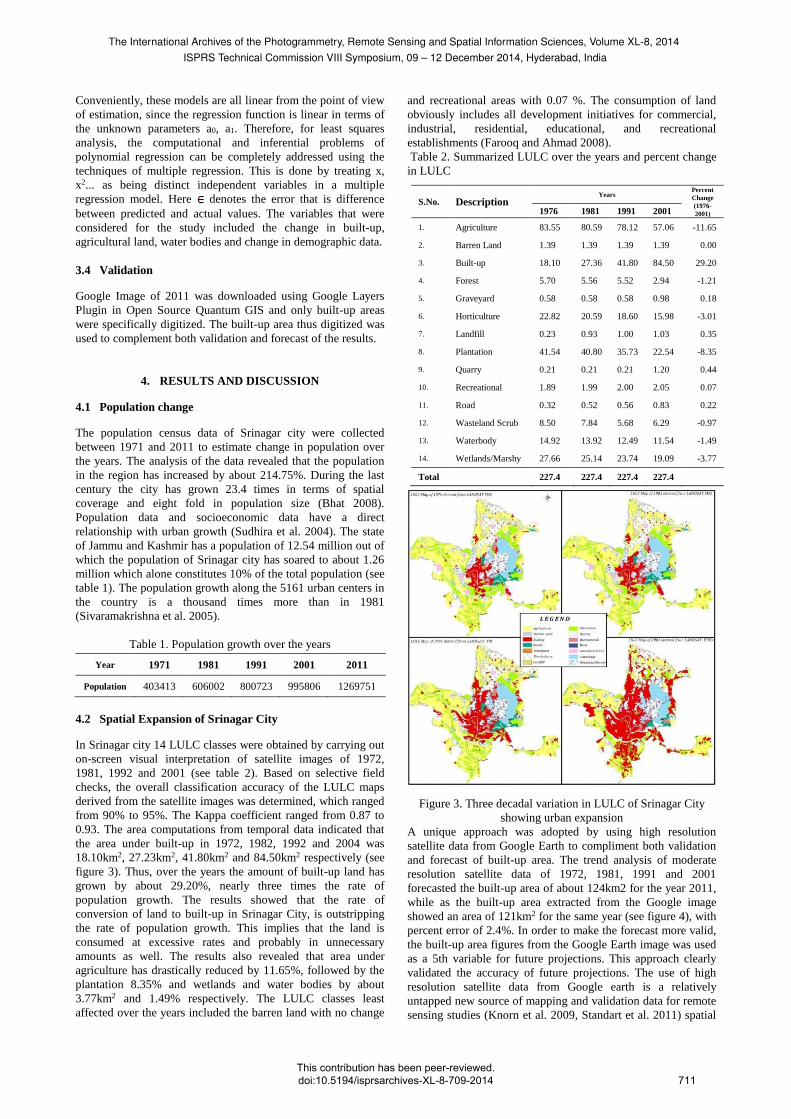
0.93. The area computations from temporal data indicated that
the area under built-up in 1972, 1982, 1992 and 2004 was
18.10km2, 27.23km2, 41.80km2 and 84.50km2 respectively (see
figure 3). Thus, over the years the amount of built-up land has
grown by about 29.20%, nearly three times the rate of
population growth. The results showed that the rate of
conversion of land to built-up in Srinagar City, is outstripping
the rate of population growth. This implies that the land is
consumed at excessive rates and probably in unnecessary
amounts as well. The results also revealed that area under
agriculture has drastically reduced by 11.65%, followed by the
plantation 8.35% and wetlands and water bodies by about
3.77km2 and 1.49% respectively. The LULC classes least
affected over the years included the barren land with no change
and recreational areas with 0.07 %. The consumption of land
obviously includes all development initiatives for commercial,
industrial, residential, educational, and recreational
establishments (Farooq and Ahmad 2008).
Table 2. Summarized LULC over the years and percent change
in LULC
Figure 3. Three decadal variation in LULC of Srinagar City
showing urban expansion
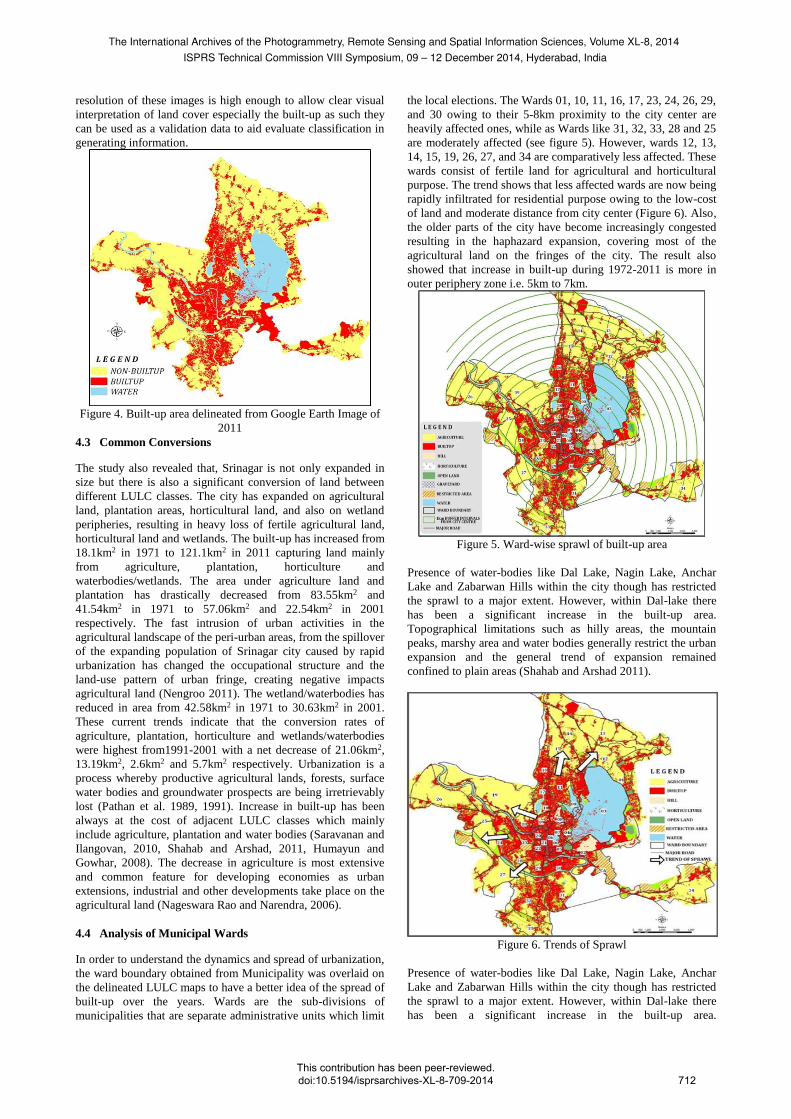
A unique approach was adopted by using high resolution
satellite data from Google Earth to compliment both validation
and forecast of built-up area. The trend analysis of moderate
resolution satellite data of 1972, 1981, 1991 and 2001
forecasted the built-up area of about 124km2 for the year 2011,
while as the built-up area extracted from the Google image
showed an area of 121km2 for the same year (see figure 4), with
percent error of 2.4%. In order to make the forecast more valid,
the built-up area figures from the Google Earth image was used
as a 5th variable for future projections. This approach clearly
validated the accuracy of future projections. The use of high
resolution satellite data from Google earth is a relatively
untapped new source of mapping and validation data for remote
sensing studies (Knorn et al. 2009, Standart et al. 2011) spatial
Year 1971 1981 1991 2001 2011
Population 403413 606002 800723 995806 1269751
S.No. Description
Years Percent
Change
(1976-
2001) 1976 1981 1991 2001
1. Agriculture 83.55 80.59 78.12 57.06 -11.65
2. Barren Land 1.39 1.39 1.39 1.39 0.00
3. Built-up 18.10 27.36 41.80 84.50 29.20
4. Forest 5.70 5.56 5.52 2.94 -1.21
5. Graveyard 0.58 0.58 0.58 0.98 0.18
6. Horticulture 22.82 20.59 18.60 15.98 -3.01
7. Landfill 0.23 0.93 1.00 1.03 0.35
8. Plantation 41.54 40.80 35.73 22.54 -8.35
9. Quarry 0.21 0.21 0.21 1.20 0.44
10. Recreational 1.89 1.99 2.00 2.05 0.07
11. Road 0.32 0.52 0.56 0.83 0.22
12. Wasteland Scrub 8.50 7.84 5.68 6.29 -0.97
13. Waterbody 14.92 13.92 12.49 11.54 -1.49
14. Wetlands/Marshy 27.66 25.14 23.74 19.09 -3.77
Total 227.4 227.4 227.4 227.4
The International Archives of the Photogrammetry, Remote Sensing and Spatial Information Sciences, Volume XL-8, 2014ISPRS Technical Commission VIII Symposium, 09 – 12 December 2014, Hyderabad, India
This contribution has been peer-reviewed. doi:10.5194/isprsarchives-XL-8-709-2014
711
resolution of these images is high enough to allow clear visual
interpretation of land cover especially the built-up as such they
can be used as a validation data to aid evaluate classification in
generating information.
Figure 4. Built-up area delineated from Google Earth Image of
2011
4.3 Common Conversions
The study also revealed that, Srinagar is not only expanded in
size but there is also a significant conversion of land between
different LULC classes. The city has expanded on agricultural
land, plantation areas, horticultural land, and also on wetland
peripheries, resulting in heavy loss of fertile agricultural land,
horticultural land and wetlands. The built-up has increased from
18.1km2 in 1971 to 121.1km2 in 2011 capturing land mainly
from agriculture, plantation, horticulture and
waterbodies/wetlands. The area under agriculture land and
plantation has drastically decreased from 83.55km2 and
41.54km2 in 1971 to 57.06km2 and 22.54km2 in 2001
respectively. The fast intrusion of urban activities in the
agricultural landscape of the peri-urban areas, from the spillover
of the expanding population of Srinagar city caused by rapid
urbanization has changed the occupational structure and the
land-use pattern of urban fringe, creating negative impacts
agricultural land (Nengroo 2011). The wetland/waterbodies has
reduced in area from 42.58km2 in 1971 to 30.63km2 in 2001.
These current trends indicate that the conversion rates of
agriculture, plantation, horticulture and wetlands/waterbodies
were highest from1991-2001 with a net decrease of 21.06km2,
13.19km2, 2.6km2 and 5.7km2 respectively. Urbanization is a
process whereby productive agricultural lands, forests, surface
water bodies and groundwater prospects are being irretrievably
lost (Pathan et al. 1989, 1991). Increase in built-up has been
always at the cost of adjacent LULC classes which mainly
include agriculture, plantation and water bodies (Saravanan and
Ilangovan, 2010, Shahab and Arshad, 2011, Humayun and
Gowhar, 2008). The decrease in agriculture is most extensive
and common feature for developing economies as urban
extensions, industrial and other developments take place on the
agricultural land (Nageswara Rao and Narendra, 2006).
4.4 Analysis of Municipal Wards
In order to understand the dynamics and spread of urbanization,
the ward boundary obtained from Municipality was overlaid on
the delineated LULC maps to have a better idea of the spread of
built-up over the years. Wards are the sub-divisions of
municipalities that are separate administrative units which limit
the local elections. The Wards 01, 10, 11, 16, 17, 23, 24, 26, 29,
and 30 owing to their 5-8km proximity to the city center are
heavily affected ones, while as Wards like 31, 32, 33, 28 and 25
are moderately affected (see figure 5). However, wards 12, 13,
14, 15, 19, 26, 27, and 34 are comparatively less affected. These
wards consist of fertile land for agricultural and horticultural
purpose. The trend shows that less affected wards are now being
rapidly infiltrated for residential purpose owing to the low-cost
of land and moderate distance from city center (Figure 6). Also,
the older parts of the city have become increasingly congested
resulting in the haphazard expansion, covering most of the
agricultural land on the fringes of the city. The result also
showed that increase in built-up during 1972-2011 is more in
outer periphery zone i.e. 5km to 7km.
Figure 5. Ward-wise sprawl of built-up area
Presence of water-bodies like Dal Lake, Nagin Lake, Anchar
Lake and Zabarwan Hills within the city though has restricted
the sprawl to a major extent. However, within Dal-lake there
has been a significant increase in the built-up area.
Topographical limitations such as hilly areas, the mountain
peaks, marshy area and water bodies generally restrict the urban
expansion and the general trend of expansion remained
confined to plain areas (Shahab and Arshad 2011).
Figure 6. Trends of Sprawl
Presence of water-bodies like Dal Lake, Nagin Lake, Anchar
Lake and Zabarwan Hills within the city though has restricted
the sprawl to a major extent. However, within Dal-lake there
has been a significant increase in the built-up area.
The International Archives of the Photogrammetry, Remote Sensing and Spatial Information Sciences, Volume XL-8, 2014ISPRS Technical Commission VIII Symposium, 09 – 12 December 2014, Hyderabad, India
This contribution has been peer-reviewed. doi:10.5194/isprsarchives-XL-8-709-2014
712

Topographical limitations such as hilly areas, the mountain
peaks, marshy area and water bodies generally restrict the urban
expansion and the general trend of expansion remained
confined to plain areas (Shahab and Arshad, 2011).
4.5 Population and land cover forecasting
The results obtained from the LULC mapping for built-up
change over the years were correlated with the increase in
population, with coefficient of correlation of 0.971. The
increase in both classes seemed to be positively correlated. The
scatter plot of the observed built-up and population change is
given in Figure 7 and 8.
Figure 7. Scatter plot of observed built-up and population
change
Various trend models were used to study the behavior of built-
up and population. It was observed that the best result was
given by a polynomial of the third order with
for the population growth and
fitted the better for the built-up change (see figure 7 and 8).
Hence from the results it can be inferred that over the years the
population has significantly increased which has been reflected
by the increase in the built-up.
Figure 8. Trends of built-up and population change
In addition to the trend analysis, forecasting was done on a
decadal basis by using regression models for built-up and
population up to the year 2031. The results revealed that
population is estimated to increase 1.52 million by 2021 and
1.83 million by 2031 (see figure 9a). While as, built-up is
estimated to increase 179.02 km2 in 2021 and 246.84km2 in
2031 respectively (see figure 9b). The results of projected
population and built-up are shown in Table (3).
Figure 9(a & b). Forecast for population and built-up using
Polynomial Third-Order Trend Model
The projected figures clearly indicate that the area under built-
up will move beyond the carrying capacity of Srinagar City, as
the city itself has an area of 227.41 km2 of which nearly 31km2
are under water bodies and wetlands. The percent increase in
built-up revealed that built-up had increased the maximum in
the year 2001 by 102.1% and is projected to increase by 39.4%
and 37.8% from year 2021 and 2031 respectively (see table 4).
The forecast was limited only up to 2031 as the threshold limit
for carrying capacity of the city reached its maximum. The
forecast for 2021 and 2031 (see table 5) show similar results
with a net decrease in agricultural (35.34 km2 & 44.39 km2),
plantation (24.87 km2 & 31.11 km2), horticulture (2.84 km2 &
3.03 km2) and wetlands/waterbodies (6.98 km2 & 8.02 km2).
The trend models have been successfully used to predict
population and urban growth in many studies (Monalisha et al.
2006). During 1971–1981, the rate of growth for built-up area
was 51.1%, while as the population increased by 50.2%. During
1981–1991, the urban area expanded by 52.7% while the
population increased by 32.1%. The forecasting using present
trends has shown that the rate of urban growth usually
outnumbers the population growth (Jat et al. 2011, Mohan et al.
2008). The most remarkable tendency towards sprawl
development was witnessed in the 1990s decade period when
the city area grew by 102.1% while the population increased by
24.3%. The predicted rate of growth during 2011–2021 and
2021 -2031 in the built-up area is estimated to be 65.6% while
the population is estimated to increase by 19.9% and 18.6%
respectively. As can be appreciated from the forecast the rate of
development of land in Srinagar is currently in excess of the
population growth.
The International Archives of the Photogrammetry, Remote Sensing and Spatial Information Sciences, Volume XL-8, 2014ISPRS Technical Commission VIII Symposium, 09 – 12 December 2014, Hyderabad, India
This contribution has been peer-reviewed. doi:10.5194/isprsarchives-XL-8-709-2014
713

5. CONCLUSIONS
One of the potential threats to sustainable development is urban
growth, were urban planning with effective resource utilization,
allocation of natural resources and infrastructure initiatives are
key concerns. In this study an attempt has been made to
understand the urban growth of Srinagar city, using multi-
temporal satellite and population data and modeling the same
for future prediction. The spatial data along with the attribute
data of the region aided in analyzing statistically the urban
growth form and its pattern. It was found that the change in
built-up area over the period of nearly 40 years is 585.08%, and
by 2031 the built-up area in the region would rise to 246.84km2,
which is beyond the carrying capacity of the Srinagar City. The
population is set to increase by 1.83 million in 2031. The rate of
urban growth would be about three times the population
growth, if projected using the past trend. The area under
agriculture land has drastically decreased from 83.55km2 in
1971 to 57.06km2 in 2001 respectively. The forecast for 2031
show a net decrease of 44.39 km2 in agricultural land. The
estimates of the regression model seem to predict the results
with the reliable accuracy as validated from the Google earth
data. Thus, it can be used as an efficient tool to obtain reliable
forecasts. The urban expansion of the city has destroyed fertile
agricultural land and productive horticultural land which cannot
be recovered, and the study area is losing agrarian
characteristics. Many wetland ecosystems have been disturbed.
The current trend of sprawl towards peripheral wards demands a
state of the art planning approach as people in this part of the
world prefer individual households instead of the joint flat
system. Although urban expansion cannot be stopped, with
proper management and planning it can be restricted and
directed in a desirable and sustainable way, protecting fertile
agricultural lands. There needs to be a stricter implementation
of agricultural land conversion laws and greater encouragement
for farmers to remain in farming activities.
REFERENCES
Barnes, K.B., Morgan, J.M. III, Roberge, M.C. and Lowe, S.,
2001. Sprawl development: its patterns, consequences, and
measurement. Towson University. Available online at:
http://chesapeake.towson.edu/landscape/urbansprawl/download/
Sprawl_white_paper.pdf (accessed 29 November 2011).
Batty, M., Xie, Y. and Sun, Z., 1999. The dynamics of urban
sprawl. Working Paper Series, Paper 15, Center for Advanced
Spatial Analysis, University College London. Available online
at: http://www.casa.ucl.ac.uk (accessed 29 November 2011).
Bhat, M. S., 2008. Urban System in Himalayas, Arina
Publishers and Distributors, New Delhi.
Census of India, 1991&2001. (http://www.censusindia.net).
Table 3: Sprawl metrics and population of Srinagar City
Built-up
Year Population Total (km2) Increase from previous decade
Percent
Increase
1971 4,03,413 18.1 - -
1981 6,06,002 27.3 9.2 51.1
1991 8,00,723 41.8 14.4 52.7
2001 9,95,806 84.5 42.7 102.1
2011 12,69,751 121.1 43.6 51.9
2021 15,23,420 179.02 84.2 65.6
2031 18,07,205 246.84 139.6 65.6
Table 4: Sprawl metrics and increase rates in urban area and population of Srinagar city
Population Built-up
Period Net Increase Percent Increase Net Increase Percent Increase
1971-1981 2,02,589 50.2 9.2 51.1
1981-1991 1,94,721 32.1 14.4 52.7
1991-2001 1,95,083 24.3 42.7 102.1
2001-2011 2,73,945 27.5 43.9 51.9
2011-2021 2,53,669 19.9 84.2 65.6
2021-2031 2,83,785 18.6 139.6 65.6
Table 5: Change Metrics in Agriculture, Horticulture and Wetlands of Srinagar city
Agriculture Plantation Horticulture Wetlands/Waterbodies
Total
(km2)
Net
Decrease
Total
(km2)
Net
Decrease
Total
(km2)
Net
Decrease
Total
(km2)
Net
Decrease
1971 83.55 41.54 22.82 42.58
1981 80.59 -2.96 40.8 -0.74 20.59 -2.23 39.06 -3.52
1991 78.12 -2.47 35.73 -0.19 18.6 -1.99 36.23 -2.83
2001 57.06 -21.06 22.54 -13.19 15.98 -2.62 30.63 -5.6
2011 31.72 -25.34 4.07 -18.47 13.38 -2.6 24.855 -5.775
2021 -3.62 -35.34 -20.8 -24.87 10.54 -2.84 17.867 -6.98
2031 -48.01 -44.39 -51.91 -31.11 7.51 -3.03 9.839 -8.02
The International Archives of the Photogrammetry, Remote Sensing and Spatial Information Sciences, Volume XL-8, 2014ISPRS Technical Commission VIII Symposium, 09 – 12 December 2014, Hyderabad, India
This contribution has been peer-reviewed. doi:10.5194/isprsarchives-XL-8-709-2014
714

Cheng, J. and Masser, I., 2003. Urban growth pattern modeling:
a case study of Wuhan City, PR China. Landscape Urban
Planning, 62, pp. 199-217.
Dekoning, G.H.J., VeldkamP, A. and Fresco, L.O., 1998. Land
use in Ecuador: a statistical analysis at different aggregation
levels. Agriculture Ecosystems and Environment, 70, pp. 231-
247.
Dendoncker, N., Schmit, C. and Rounsevell, M., 2008.
Exploring spatial data uncertainties in land-use change
scenarios. International Journal of Geographical Information
Science, 22(9), pp. 1013-1030.
Epstein, J., Payne, K., and Kramer, E., 2002. Techniques for
mapping suburban sprawl. Photogrammetric Engineering and
Remote Sensing, 63(9), pp. 913-918.
Farooq, S. and Ahmad, S., 2008. Urban Sprawl Development
around Aligarh City: A Study Aided by Satellite Remote
Sensing and GIS. Journal of Indian Society of Remote Sensing,
36, pp. 77-88.
Fung, T. and Ledrew, E., 1987. Application of principal
components analysis in change detection. Photogrammetric
Engineering & Remote Sensing, 53(12), pp. 1649-1658.
Hurd, J. D., Wilson, E. H., Lammey, S. G., and Civco, D. L.,
2001. Characterization of forest fragmentation and urban sprawl
using time sequential Landsat Imagery. In: ASPRS Annual
Convention, St. Louis, MO. April 23-27.
Howard, S. M., 1986, Use of AVHRR Data in an Information
System for Fire Management in the Western United States. In:
International Symposium on Remote Sensing of Environment,
20th, Nairobi, Kenya, December, 1, pp. 67-79.
Jat, M.K., Garg P.K. and Khare D., 2008, Modeling of urban
growth using spatial analysis techniques: a case study of Ajmer
city (India), International Journal of Remote Sensing, 29, pp.
543-567.
Jothimani, P., 1997. Operational urban sprawl monitoring using
satellite remote sensing: excerpts from the studies of
Ahmedabad, Vadodara and Surat, IndiaIn: 18th Asian
Conference on Remote Sensing, October 20-24, Malaysia.
Knorn, J., Rabe, A., Radeloff, V.C., Kuemmerle, T., Kozak, J.
and HosterT, P., 2009, Land cover mapping of large areas using
chain classification of neighboring Landsat satellite images.
Remote Sensing of Environment, 113, pp. 957-964.
Lata K. M., Sankarrao C. H., Krishna Prasad V., Badrinath K.
V. S. and Raghavaswamy, 2001, Measuring urban sprawl: a
case study of Hyderabad. GIS development, 5(12).
Lawrence, W. R., 1895. Valley of Kashmir. Henry Frowde,
Oxford University Press.
Li, X., and Yeh, A.G.O., 1998. Principal Component Analysis
of Stacked Multi-Temporal Images for Monitoring of Rapid
Urban Expansion in the Pearl River Delta. International
Journal of Remote Sensing, 19(8), pp. 1501-1518.
Liu, S., Sylvia, P. and Li, X., 2002. Spatial patterns of urban
land use growth in Beijing. Journal of Geographical Sciences,
12(3), pp. 266-274.
Nelson, R. F., 1983. Detecting forest canopy change due to
insect activity using Landsat MSS. Photogrammetric
Engineering and Remote Sensing, 49, pp. 1303-1314.
Mohan M., Pathan, S.K., Narendrareddy K., Kandya A. and
Pandey S., 2011. Dynamics of Urbanization and Its Impact on
Land-Use/Land-Cover: A Case Study of Megacity Delhi.
Journal of Environmental Protection, 2, pp. 1274-1283.
Monalisha M., KamaL K.M. and Subudhi A.P., 2011. Urban
Sprawl Mapping and Land Use Change Analysis Using
Remote. Sensing and GIS: Case Study of Bhubaneswar city,
Orissa. Available online at: http:
www.geospatialworldform.org/2011/proceedings/pdf/Monalisha
.pdf (accessed 29 November 2011).
Nageswararao, K. and Narendra, K., 2006. Mapping and
evaluation of urban sprawling in the Mehadrigedda watershed
in Visakhapatnam metropolitan region using remote sensing
and GIS. Current Science, 1552(91), pp. 1552-1557.
Nengroo, Z. A., 2011. Dynamics of land use change in rural-
urban fringe - a case study of Srinagar City. M. Phill.
Dissertation, University of Kashmir, Hazratbal, India.
Pathan, S.K., Jothimani, P., Pendharkar, S.P. and Kumar, D.S.,
1989, Urban land use mapping and zoning of Mombay
Metropolitan region using remote sensing data. Journal of
Indian Society of Remote Sensing, 17, pp. 11–22.
Pathan, S.K., Shukla, V.K., Patel, R.G. and Mehta, K.S., 1991.
Urban land use mapping—a case study of Ahmedabad city and
its environs. Journal of Indian Society of Remote Sensing, 19,
pp. 95–112.
Peng, J., Wu, J., Yin, H., Li, Z., Chang, Q. and Mu, T., 2008,
Rural land use change during 1986–2002 in Lijiang, China,
based on remote sensing and GIS data. Sensors, 8, pp. 8201-
8223.
Pilon, P.G., Howard, P.J. and Bullock, R.A., 1988, An
enhanced classification approach to change detection in semi
arid environment. Photogrammetric Engineering and Remote
Sensing, 54, pp. 1709-1716.
Pontius JR., R. G. and Schneider, L. C., 2001, Land-cover
change model validation by an ROC method for the Ipswich
watershed, Massachusetts, USA. Agriculture, Ecosystems and
Environment, 85, pp. 239-248.
Rashid, H., and Naseem, G., 2007. Quantification of Loss in
Spatial Extent and Wetlands in the Suburbs of Srinagar City
during Last Century Using Geospatial Approach. In: M.
Sengupta and R. Dalwani, Eds., Proceedings of Taal 2007: The
12th World Lake Conference, pp. 653-658.
Saravanan, P. and Ilangovan, P., 2010. Identification of Urban
Sprawl Pattern for Madurai Region Using GIS. International
Journal of Geomatics and Geosciences. 1(2), pp. 144-149.
Serneels, S. and Lambin, E. F., 2001. Proximate causes of land-
use change in Narok District, Kenya: a spatial statistical
model. Agriculture Ecosystems and Environment, 85, pp. 65-
81.
The International Archives of the Photogrammetry, Remote Sensing and Spatial Information Sciences, Volume XL-8, 2014ISPRS Technical Commission VIII Symposium, 09 – 12 December 2014, Hyderabad, India
This contribution has been peer-reviewed. doi:10.5194/isprsarchives-XL-8-709-2014
715

Shahab, F., and Arshad, A. 2011. Impact of Urban Land
Transformation on Water Bodies in Srinagar City, India.
Journal of Environmental Protection, 2, pp. 142-153.
Shekhar.S., 2004. Urban Sprawl Assessment: Entropy
Approach”, GIS Development, 8(5), pp. 43-48
Shen, G., 2002. Fractal dimension and fractal growth of
urbanized areas. International Journal of Geographic
Information Systems, 16(5), pp. 419–437.
Sivaramakrishna K. C., Kundu A. and Singh B.N., 2005.
Handbook of Urbanization in India. Oxford University Press,
New Delhi, pp. 177.
Standart, G.D., Stulken, K.R., Zhang, X. and Zong, Z.L., 2011.
Geospatial visualization of global satellite images with Vis-
EROS. Environmental Modelling Software, 26, pp. 980-982.
Sudhira, H.S., Ramachandra, T.V. and Jagdish, K.S., 2004.
Urban sprawl: metrics, dynamics and modelling using GIS.
International Journal of Applied Earth Observation and
Geoinformation, 5, pp. 29-39.
Theobald, D. M., 2001. Quantifying urban and rural sprawl
using the sprawl index". Paper presented at the Annual
Conference of the Association of American Geographers in
New York.
Torrens P. M. and Alberti M., 2000. Measuring sprawl.
Working paper no. 27, Centre for Advanced Spatial Analysis,
University College London.
Toll, D.L., 1980. Urban Area Update Procedures Using Landsat
Data. In: Proceedings of the American Society of
Photogrammetry. 5410 Grosvenor Lane, Bethesda, MD 20814-
2160.
Trexler, J.C., and Travis, J., 1993. Nontraditional regression
Analysis. Ecology. 74(6), 1629-1637.
Veldkamp, A., and Fresco, L.O., 1996. CLUE: A conceptual
model to study the conversion of land use and its
effects. Ecological Modelling, 85, pp. 253-270.
Webster, C.J., 1995. Urban morphological fingerprints.
Environment and planning , 22, pp.279–297.
Wilson, E.H., Hurd, J.D., Civco, D.L., Prisloe, M.P. and
Arnold, C., 2003. Development of a geospatial model to
quantify, describe and map urban growth. Remote Sensing of
Environment, 86, pp. 275–285.
Yeh, A. G. O. and Xia LI., 2001. Measurement and monitoring
of urban sprawl in a rapidly growing region using entropy.
Photogrammetric Engineering and Remote Sensing, 67(1), pp.
83.
Zeug, G. and Eckert, S., 2010. Population Growth and Its
Expression in Spatial Built-up Patterns: The Sana’a, Yemen
Case Study. Remote Sensing, 2, pp. 1014-1034
The International Archives of the Photogrammetry, Remote Sensing and Spatial Information Sciences, Volume XL-8, 2014ISPRS Technical Commission VIII Symposium, 09 – 12 December 2014, Hyderabad, India
This contribution has been peer-reviewed. doi:10.5194/isprsarchives-XL-8-709-2014
716