Forecasting the dynamics of a coastal fishery species using a coupled … · 2010-04-05 ·...
13
Ecological Applications, 20(2), 2010, pp. 452–464 Ó 2010 by the Ecological Society of America Forecasting the dynamics of a coastal fishery species using a coupled climate–population model JONATHAN A. HARE, 1,5 MICHAEL A. ALEXANDER, 2 MICHAEL J. FOGARTY, 3 ERIK H. WILLIAMS, 4 AND JAMES D. SCOTT 2 1 National Oceanic and Atmospheric Administration, National Marine Fisheries Service, Northeast Fisheries Science Center, Narragansett Laboratory, 28 Tarzwell Drive, Narragansett, Rhode Island 02882 USA 2 National Oceanic and Atmospheric Administration, Earth System Research Laboratory, Physical Sciences Division, 325 Broadway, Boulder, Colorado 80305 USA 3 National Oceanic and Atmospheric Administration, National Marine Fisheries Service, Northeast Fisheries Science Center, Woods Hole Laboratory, 166 Water Street, Woods Hole, Massachusetts 02543 USA 4 National Oceanic and Atmospheric Administration, National Marine Fisheries Service, Southeast Fisheries Science Center, 101 Pivers Island Road, Beaufort, North Carolina 28516 USA Abstract. Marine fisheries management strives to maintain sustainable populations while allowing exploitation. However, well-intentioned management plans may not meet this balance as most do not include the effect of climate change. Ocean temperatures are expected to increase through the 21st century, which will have far-reaching and complex impacts on marine fisheries. To begin to quantify these impacts for one coastal fishery along the east coast of the United States, we develop a coupled climate–population model for Atlantic croaker (Micropogonias undulatus). The model is based on a mechanistic hypothesis: recruitment is determined by temperature-driven, overwinter mortality of juveniles in their estuarine habitats. Temperature forecasts were obtained from 14 general circulation models simulating three CO 2 emission scenarios. An ensemble-based approach was used in which a multimodel average was calculated for a given CO 2 emission scenario to forecast the response of the population. The coupled model indicates that both exploitation and climate change significantly affect abundance and distribution of Atlantic croaker. At current levels of fishing, the average (2010–2100) spawning biomass of the population is forecast to increase by 60–100%. Similarly, the center of the population is forecast to shift 50–100 km northward. A yield analysis, which is used to calculate benchmarks for fishery management, indicates that the maximum sustainable yield will increase by 30–100%. Our results demonstrate that climate effects on fisheries must be identified, understood, and incorporated into the scientific advice provided to managers if sustainable exploitation is to be achieved in a changing climate. Key words: abundance; Atlantic croaker; climate change; distribution; East Coast, USA; environmental effects; fishery management; Micropogonias undulatus; population dynamics. INTRODUCTION Overexploitation results in dramatic declines in marine population abundance and affects overall marine ecosystem structure. Fishing is often the dominant source of post-juvenile mortality for exploited species, causing direct reductions in population abundance (Myers et al. 1997, Christensen et al. 2003). Most fishing practices truncate the age and size distribution through increased mortality and size selectivity, which potential- ly reduces reproductive potential of the population because larger females may produce more and higher quality offspring (O’Farrell and Botsford 2006, Scott et al. 2006). Fishing also impacts marine ecosystems that support fisheries both directly, through the effects of fishing gear on habitats (Barnes and Thomas 2005, Reed et al. 2007), and indirectly, with the alteration of trophic pathways through the selective removal of species as targeted catch or bycatch (Jackson et al. 2001, Frank et al. 2005). Fisheries management strives to balance the exploitation of a select group of species against the sustainability of marine species and marine ecosystems, as well as the human communities and economic activity that fisheries and marine ecosystems support (NRC 1999, Hilborn et al. 2003). Environmental variability and climate change also impact marine fisheries (Koster et al. 2003, Drinkwater et al. 2009). Recruitment, the process by which young fish join the adult or exploited population, is highly variable in most marine fish populations, largely as a result of environmental variability (Rothschild 1986). Growth and maturity rates are also affected by environmental variability including abiotic (e.g., tem- perature) and biotic (e.g., availability of food) factors (Brander 1995, Godø 2003). Yet most fisheries stock assessments, which form the scientific basis for fisheries management, do not include the effect of the environ- ment on populations; environmental effects are assumed Manuscript received 7 October 2008; revised 21 May 2009; accepted 11 June 2009. Corresponding Editor: K. B. Gido. 5 E-mail: [email protected] 452
Transcript of Forecasting the dynamics of a coastal fishery species using a coupled … · 2010-04-05 ·...

Ecological Applications, 20(2), 2010, pp. 452–464� 2010 by the Ecological Society of America
Forecasting the dynamics of a coastal fishery speciesusing a coupled climate–population model
JONATHAN A. HARE,1,5 MICHAEL A. ALEXANDER,2 MICHAEL J. FOGARTY,3 ERIK H. WILLIAMS,4 AND JAMES D. SCOTT2
1National Oceanic and Atmospheric Administration, National Marine Fisheries Service, Northeast Fisheries Science Center,Narragansett Laboratory, 28 Tarzwell Drive, Narragansett, Rhode Island 02882 USA
2National Oceanic and Atmospheric Administration, Earth System Research Laboratory, Physical Sciences Division, 325 Broadway,Boulder, Colorado 80305 USA
3National Oceanic and Atmospheric Administration, National Marine Fisheries Service, Northeast Fisheries Science Center,Woods Hole Laboratory, 166 Water Street, Woods Hole, Massachusetts 02543 USA
4National Oceanic and Atmospheric Administration, National Marine Fisheries Service, Southeast Fisheries Science Center,101 Pivers Island Road, Beaufort, North Carolina 28516 USA
Abstract. Marine fisheries management strives to maintain sustainable populations whileallowing exploitation. However, well-intentioned management plans may not meet thisbalance as most do not include the effect of climate change. Ocean temperatures are expectedto increase through the 21st century, which will have far-reaching and complex impacts onmarine fisheries. To begin to quantify these impacts for one coastal fishery along the east coastof the United States, we develop a coupled climate–population model for Atlantic croaker(Micropogonias undulatus). The model is based on a mechanistic hypothesis: recruitment isdetermined by temperature-driven, overwinter mortality of juveniles in their estuarinehabitats. Temperature forecasts were obtained from 14 general circulation models simulatingthree CO2 emission scenarios. An ensemble-based approach was used in which a multimodelaverage was calculated for a given CO2 emission scenario to forecast the response of thepopulation. The coupled model indicates that both exploitation and climate changesignificantly affect abundance and distribution of Atlantic croaker. At current levels offishing, the average (2010–2100) spawning biomass of the population is forecast to increase by60–100%. Similarly, the center of the population is forecast to shift 50–100 km northward. Ayield analysis, which is used to calculate benchmarks for fishery management, indicates thatthe maximum sustainable yield will increase by 30–100%. Our results demonstrate that climateeffects on fisheries must be identified, understood, and incorporated into the scientific adviceprovided to managers if sustainable exploitation is to be achieved in a changing climate.
Key words: abundance; Atlantic croaker; climate change; distribution; East Coast, USA; environmentaleffects; fishery management; Micropogonias undulatus; population dynamics.
INTRODUCTION
Overexploitation results in dramatic declines in
marine population abundance and affects overall marine
ecosystem structure. Fishing is often the dominant
source of post-juvenile mortality for exploited species,
causing direct reductions in population abundance
(Myers et al. 1997, Christensen et al. 2003). Most fishing
practices truncate the age and size distribution through
increased mortality and size selectivity, which potential-
ly reduces reproductive potential of the population
because larger females may produce more and higher
quality offspring (O’Farrell and Botsford 2006, Scott et
al. 2006). Fishing also impacts marine ecosystems that
support fisheries both directly, through the effects of
fishing gear on habitats (Barnes and Thomas 2005, Reed
et al. 2007), and indirectly, with the alteration of trophic
pathways through the selective removal of species as
targeted catch or bycatch (Jackson et al. 2001, Frank et
al. 2005). Fisheries management strives to balance the
exploitation of a select group of species against the
sustainability of marine species and marine ecosystems,
as well as the human communities and economic activity
that fisheries and marine ecosystems support (NRC
1999, Hilborn et al. 2003).
Environmental variability and climate change also
impact marine fisheries (Koster et al. 2003, Drinkwater
et al. 2009). Recruitment, the process by which young
fish join the adult or exploited population, is highly
variable in most marine fish populations, largely as a
result of environmental variability (Rothschild 1986).
Growth and maturity rates are also affected by
environmental variability including abiotic (e.g., tem-
perature) and biotic (e.g., availability of food) factors
(Brander 1995, Godø 2003). Yet most fisheries stock
assessments, which form the scientific basis for fisheries
management, do not include the effect of the environ-
ment on populations; environmental effects are assumed
Manuscript received 7 October 2008; revised 21 May 2009;accepted 11 June 2009. Corresponding Editor: K. B. Gido.
5 E-mail: [email protected]
452

to be the same in the future as in the past and thus are
already reflected in the biological characteristics of the
population (Richards and Maguire 1998, Hilborn and
Walters 2004).
Climate change is resulting in long-term increases in
temperature, changes in wind patterns, changes in
freshwater runoff, and acidification of the ocean (IPCC
2007b, Doney et al. 2009). These changes are impacting
the abundance, distribution, and productivity of fishery
species directly (e.g., temperature effects on growth) and
indirectly (e.g., changes in ocean productivity) (Stenseth
et al. 2002, Perry et al. 2005). Long-term environmental
change creates problems for fisheries stock assessment
because the future environment will be different than the
past. Previous estimates of population rates (growth,
reproduction, recruitment) may not be appropriate for
the future, and thus even well-intentioned fisheries
management plans may fail because they do not account
for climate-driven changes in the characteristics of
exploited populations (NRC 1999, Kell et al. 2005,
Kaje and Huppert 2007, Mackenzie et al. 2007, Rock-
mann et al. 2007).
Incorporating environmental effects in models for
exploited fishery populations is not new (Hilborn and
Walters 2004). Although correlative relationships are
often used, numerous studies have indicated that to use
environmentally explicit population models in forecast-
ing (predicting the status of the population in the future
based on environmental predictions) requires a mecha-
nistic understanding of environmental forcing and
population dynamics (Myers 1998, Krebs and Berteaux
2006, Hollowed et al. 2009). In the context of climate
change, environment–population models have been
developed for fisheries; for example, Atlantic cod
abundance in the North Sea and the Gulf of Maine in
the future is likely to be lower than currently assessed,
raising the possibility of overexploitation even under
management strategies designed to prevent overfishing
unless target levels of exploitation are adjusted accord-
ingly (Clark et al. 2003, Cook and Heath 2005, Fogarty
et al. 2008). These studies demonstrate that climate
effects on fisheries have important consequences for the
long-term sustainability of exploited populations.
We examine the effect of climate change on Atlantic
croaker (Micropogonias undulatus, Teleostei: Perci-
formes: Sciaenidae) based on a mechanistic recruitment
hypothesis. Atlantic croaker is a coastal marine fish
inhabiting the east coast of the United States (Murdy et
al. 1997) that supports a fishery of ;8000 Mg with a
value of approximately US$9 million (NMFS 2008).
Atlantic croaker spawn pelagic eggs (;1 mm in
diameter) in the coastal ocean during late summer, fall,
and winter. Late larvae enter estuaries (e.g., Delaware
Bay, Chesapeake Bay, Pamlico Sound) after 30–60 days
in the plankton (Warlen 1982), and juveniles spend their
first winter in estuarine nursery habitats (Able and
Fahay 1998). Juvenile survival through the winter is
determined by estuarine water temperatures; cold water
leads to low survival, which in turn decreases recruit-
ment to the population. This mechanistic recruitment
hypothesis is supported by laboratory results (Lankford
and Targett 2001a, b) and field observations (Norcross
and Austin 1981, Hare and Able 2007).
We incorporate this hypothesis into a population
model with recruitment as a function of spawning-stock
biomass and minimum winter temperature. We then
couple this population model with forecasts of minimum
winter temperature from 14 general circulation models
(GCMs) based on three CO2 emission scenarios. We
model the abundance, distribution, and yield of the
population under different climate change scenarios and
different fishing rates. We find that both climate and
fishing affect the dynamics of the population and
conclude that climate change will have major conse-
quences for the Atlantic croaker population of the east
coast of the United States in the coming decades.
MATERIALS AND METHODS
Climate models
The Fourth Assessment Report of the Intergovern-
mental Panel on Climate Change (IPCC) (IPCC 2007b)
included simulations from 23 different GCMs run with
standardized CO2 emission scenarios. Here we use 14 of
these models (Table 1) and three emission scenarios: the
commitment scenario, in which atmospheric CO2 is fixed
at 350 ppm through the 21st century; the B1 scenario, in
which CO2 increases to 550 ppm by the end of the 21st
century; and the A1B scenario, in which CO2 increases
to 720 ppm by the end of the 21st century (IPCC 2007b).
The 14 GCMs were chosen because the results are
publically available for the three climate scenarios
(commit, B1, and A1B) and for a retrospective analysis
of the 20th century (IPCC Data Distribution Centre;
available online).6 Also, the models and scenarios
included had simulations through 2100. Some of the
models have more than one run for one or more of the
climate scenarios; only one run was included for each
model and scenario to ensure that the models were
treated similarly. A comparison of retrospective 20th
century analysis from each GCM and observed mini-
mum winter air temperatures (1895–2007) was used to
bias-correct the model results; mean of model outputs
were compared to observations and the difference was
added to minimum winter air temperatures forecast by
the model (comparisons are provided in the Appendix:
section 1).
Air temperature, which is forecast in most GCMs, is a
good proxy for estuarine water temperatures owing to
the efficient ocean–atmosphere heat exchange in estua-
rine systems (Roelofs and Bumpus 1953, Hare and Able
2007). Winter air temperature is also strongly coherent
along the U.S. East Coast (Joyce 2002) and one location
6 hhttp://www.mad.zmaw.de/IPCC_DDC/html/SRES_AR4/index.htmli
March 2010 453CLIMATE FORECASTS FOR A COASTAL FISHERY
can be used as a proxy for a larger area (Appendix:
section 1). Thus, minimum winter air temperature in the
Chesapeake Bay region is used as the climate input into
the coupled climate–population model. The Chesapeake
Bay region was chosen because this estuary is a major
Atlantic croaker overwintering nursery (Murdy et al.
1997, Able and Fahay 1998).
Population model
A finite time step model (Fogarty 1998, ASMFC
2005) was developed for the population of Atlantic
croaker along the mid-Atlantic coast of the United
States. Spawning-stock biomass (S ) in a given year was
calculated as the sum of the number of individuals (N )
at each age (A) in that year (y) multiplied by a constant
mass-at-age (WA), a constant percentage mature-at-age
(mA), and a constant sex ratio (SR ¼ 0.5):
Sy ¼X
A
NAy 3 WA 3 mA 3 SR: ð1Þ
The values for WA, mA, and SR were taken from the
most recent Atlantic croaker stock assessment (Table 2).
The mechanistic hypothesis that recruitment is deter-
mined by winter water temperatures affecting mortality
during the juvenile stages was incorporated into the
model using an environmentally explicit stock–recruit-
ment relationship. In the model, numbers at age 1 in
year y (N1y) equaled recruitment in year y (Ry).
Recruitment in year y was calculated based on
spawning-stock biomass in year y � 1 (Sy-1) with the
addition of the term for minimum winter temperature
during year y � 1 (December) and year y (January,
February, and March; denoted Ty):
N1y ¼ Ry ¼ Sy�1exp½a� bSy�1 þ cTy þ e�: ð2Þ
This form of the stock–recruitment relationship was
used because it provided the best fit to observed data
(Appendix: section 2). The climate effects on the
population entered the model through the temperature
term (T ). Error in the stock–recruitment relationship (e)was included formally in the model as a normally
distributed random variable parameterized from the fit
of the model to data.
Number-at-age in a given year (NAy) was calculated
from number at the prior age in the prior year (N(A-1)(y-1))
discounted by mortality, which was split into two
components: fishing mortality (F ) and natural mortality
(M ). Fishing mortality is an instantaneous rate used to
calculate how many fish are removed from a population
through fishing over a period of time. Natural mortality
is similar but is used to calculate how many fish are
removed from a population through natural causes (e.g.,
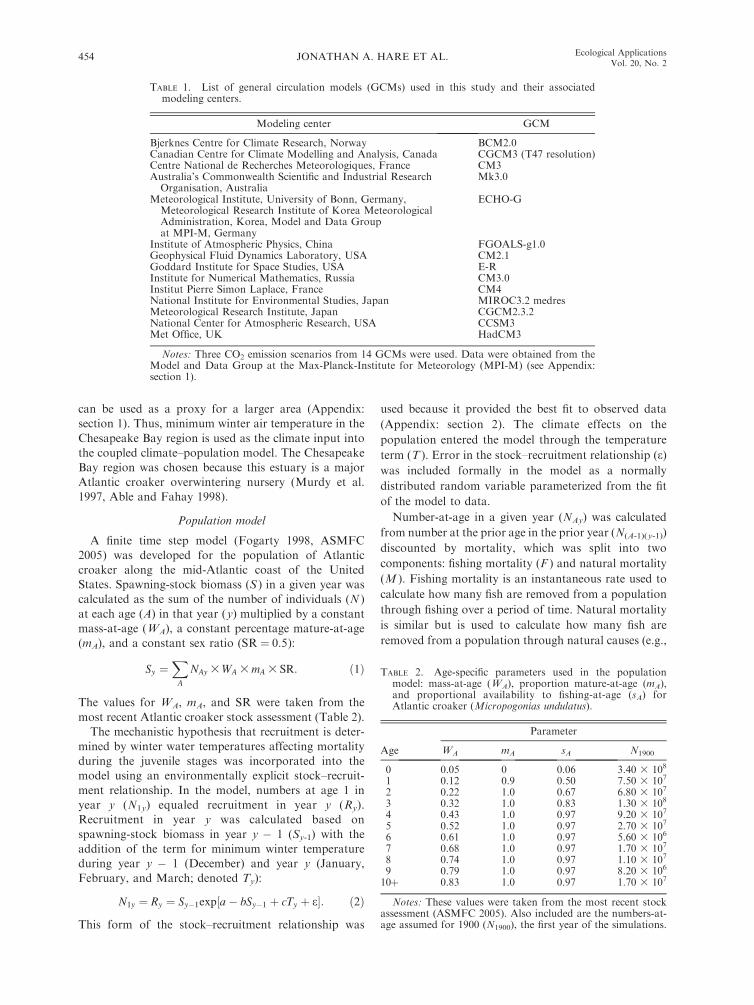
TABLE 1. List of general circulation models (GCMs) used in this study and their associatedmodeling centers.
Modeling center GCM
Bjerknes Centre for Climate Research, Norway BCM2.0Canadian Centre for Climate Modelling and Analysis, Canada CGCM3 (T47 resolution)Centre National de Recherches Meteorologiques, France CM3Australia’s Commonwealth Scientific and Industrial Research
Organisation, AustraliaMk3.0
Meteorological Institute, University of Bonn, Germany,Meteorological Research Institute of Korea MeteorologicalAdministration, Korea, Model and Data Groupat MPI-M, Germany
ECHO-G
Institute of Atmospheric Physics, China FGOALS-g1.0Geophysical Fluid Dynamics Laboratory, USA CM2.1Goddard Institute for Space Studies, USA E-RInstitute for Numerical Mathematics, Russia CM3.0Institut Pierre Simon Laplace, France CM4National Institute for Environmental Studies, Japan MIROC3.2 medresMeteorological Research Institute, Japan CGCM2.3.2National Center for Atmospheric Research, USA CCSM3Met Office, UK HadCM3
Notes: Three CO2 emission scenarios from 14 GCMs were used. Data were obtained from theModel and Data Group at the Max-Planck-Institute for Meteorology (MPI-M) (see Appendix:section 1).
TABLE 2. Age-specific parameters used in the populationmodel: mass-at-age (WA), proportion mature-at-age (mA),and proportional availability to fishing-at-age (sA) forAtlantic croaker (Micropogonias undulatus).
Age
Parameter
WA mA sA N1900
0 0.05 0 0.06 3.40 3 108
1 0.12 0.9 0.50 7.50 3 107
2 0.22 1.0 0.67 6.80 3 107
3 0.32 1.0 0.83 1.30 3 108
4 0.43 1.0 0.97 9.20 3 107
5 0.52 1.0 0.97 2.70 3 107
6 0.61 1.0 0.97 5.60 3 106
7 0.68 1.0 0.97 1.70 3 107
8 0.74 1.0 0.97 1.10 3 107
9 0.79 1.0 0.97 8.20 3 106
10þ 0.83 1.0 0.97 1.70 3 107
Notes: These values were taken from the most recent stockassessment (ASMFC 2005). Also included are the numbers-at-age assumed for 1900 (N1900), the first year of the simulations.
JONATHAN A. HARE ET AL.454 Ecological ApplicationsVol. 20, No. 2

predation, disease) over a period of time. Fishing
mortality was multiplied by an age-dependent selectivity
coefficient (sA; Table 2), because younger ages are less
susceptible to capture in the fishery compared to older
individuals:
NAy ¼ NðA�1Þðy�1Þe�ðFsA�1þMÞ: ð3Þ
The model was implemented for 1900 to 2100 using
observed (1900–2007) and simulated (2008–2100) min-
imum winter air temperatures. Natural mortality (M )
was assumed to be constant with a normally distributed
random component (l ¼ 0.3, r ¼ 0.05); this value was
taken from the recent stock assessment (ASMFC 2005).
For model hindcasts, historical fishing mortality rates
(F ) were set to levels consistent with the history of the
fishery (Table 3). For model forecasts, rates of fishing
(F ) ranged from 0 to 1 with a random component (l¼0,
r ¼ 0.02). For each climate scenario and GCM, 100
population simulations were calculated to include the
variability associated with stochasticity in natural
mortality (M ), fishing mortality (F ), and the unex-
plained variability in recruitment (e).The outputs from the coupled model were averaged
over time (2010–2100), because GCMs do not produce
annual predictions; i.e., due to random climate variabil-
ity, a given year in the model is not expected to match
that in nature. The 14 GCMs were treated as a
multimodel ensemble (Reichler and Kim 2008): the
results of the different GCMs were combined to make
inferences about the effect of climate change on the
Atlantic croaker population. Two approaches were used
to evaluate the output of the coupled model: (1) the
distribution of model results were compared to past
estimates of spawning-stock biomass (1972–2004) and
(2) a multimodel mean spawning-stock biomass was
calculated for each climate scenario across all 14 GCMs.
Our results represent the mean response of the Atlantic
croaker population to several climate change scenarios
over the 21st century for an ensemble of GCMs.
Distribution model
The mid-Atlantic croaker stock makes annual south-
to-north migrations from wintering grounds off the
Carolinas to summering grounds from North Carolina
to New Jersey (Murdy et al. 1997). Atlantic croaker also
exhibit onshore–offshore migrations from nearshore and
estuarine areas in summer to coastal and shelf areas in
fall (Murdy et al. 1997). We used a multiple-regression
approach to model the mean distance and northern
extent of the population as a function of spawning-stock
biomass and the previous year’s minimum winter
temperature. Mean distance and northern extent esti-
mates were calculated from data collected by the
autumn trawl survey of the National Marine Fisheries
Service (Azarovitz 1981; see Plate 1). This survey is
based on a random stratified design, with multiple
randomly located trawl stations in each stratum, which
are defined by along-shelf regions and bathymetric zones
(Azarovitz 1981).
Since the northeast U.S. shelf does not run simply
north–south, a curvilinear grid of distance from Cape
Hatteras, North Carolina, was developed; the grid
approximately followed the 10-m isobath. This grid
was then used to convert each stratum’s mean location
(latitude and longitude) to a strata average along-shelf
distance from Cape Hatteras. Using mean catch in each
strata and mean distance to each strata, we calculated a
weighted-mean distance for Atlantic croaker in each
year. We also calculated weighted standard deviation of
distance. Based on the idea that range expands at higher
population sizes (MacCall 1990) and the suggestion that
summer distribution may be influenced by temperatures
during the previous winter (Murdy et al. 1997), we
developed an empirical model for mean location (distl)
and its standard deviation (distr), based on spawning-
stock biomass (S ) and temperature (T ):
distlY¼ al þ blSY þ clTY þ dlS2
Y þ elT2Y ð4Þ
distrY¼ ar þ brSY þ crTY þ drS2
Y þ erT2Y : ð5Þ
All potential variations of the above models were fit (y¼aþ bS; y¼ aþ cT; y¼ aþ bSþ cT; etc.) and compared
using the Akaike Information Criteria. Evaluation of
Akaike weights indicated that several models were
equally supported, and thus we chose to use a multi-
model inference procedure (Burnham and Anderson
1998) to determine the parameters of the statistical
model (a, b, c, d, and e). The final empirical model
explained 31% and 37% of the variability in the mean
and standard deviation of the annual center of the
population. A logistic regression approach also was
developed (Appendix: section 3); the results were similar
so we only present the results of the multiple regression
model.
For distribution forecasts, spawning-stock biomass
estimates from the coupled climate–population model
were combined with minimum winter temperature
estimates from the GCM scenarios. The outputs from
the distribution model were averaged over the period of
TABLE 3. Time-specific fishing mortality rates (F ) for Atlanticcroaker used in the coupled climate–population model.
Years F
1900–1934 0.21935–1944 0.31945–1954 1.31955–1964 0.81965–1984 0.61985–2005 0.22006–2015 linear between 0.2 and 2016 level2016–2100 fixed at a level from 0 to 1 (0.1 step) with
random annual component (l ¼ 0, r ¼ 0.02)
Note: Values from 1900–2005 were used in the hindcastingportion of the model, and values from 2006–2100 were used inthe forecasting portion of the model.
March 2010 455CLIMATE FORECASTS FOR A COASTAL FISHERY

2010–2100, similar to the results of the population
model. We used the mean and standard deviation
models to forecast the mean and northern extent of
the population; the latter was defined as the mean plus
two standard deviations. In addition to mean center of
the distribution and mean northern extent, the frequen-
cy of years with the northern extent past the Hudson
Canyon was quantified. Historically, Hudson Canyon is
near the absolute northern limit of the population and is
an important geographic feature on the northeast U.S.
continental shelf separating the mid-Atlantic region
from the Southern New England region (Sherman 1980).
Using data from the autumn trawl survey is poten-
tially biased by the timing of the fall migration; as waters
cool, adult Atlantic croaker move south (Murdy et al.
1997, Able and Fahay 1998). Thus, the timing of the
survey relative to the timing of the fall migration
confounds the ability to compare distribution among
years. Assuming the fall migration is triggered by
temperature, we screened shelf temperatures observed
during each annual survey. There were several years (5
of 33) in which temperatures off New Jersey were cooler
than most other years (e.g., ,178C), indicating that fall
cooling started earlier in these years. These cooler years
were removed from the analysis in an attempt to
compare the distribution of Atlantic croaker at the
same point in the seasonal cycle.
Yield analysis
We estimated the fishing rate threshold and yield
target under current conditions and under the three CO2
emission scenarios based on the temperature-dependentrecruitment model. The purpose was to calculate
management benchmarks for the population under the
different climate change scenarios. The environmentallyexplicit stock–recruitment relationship (Eq. 2) can be
linearized:
loge
Ry
Sy�1
� �¼ logea� bSy�1 þ cTy: ð6Þ
Solving for spawning-stock biomass (S ) results in:
Sy�1 ¼1
bloge a
Sy�1
Ry
� �� �þ cTy
� �: ð7Þ
Note that the expression inside the brackets includesspawning biomass-per-recruit (S/R). Given estimates of
the parameters of the recruitment models and standard
yield and spawning biomass-per-recruit analyses (Law-
son and Hilborn 1985, Quinn and Desiro 1999),estimates of S/R are substituted for different levels of
fishing mortality (here designated as (S/R)F) to deter-
mine the total spawning biomass for each fishingmortality rate. Once the total spawning biomass
corresponding to a particular level of fishing mortality
(SF) was determined, the corresponding recruitment was
obtained by the following simple identity:
PLATE 1. A basket of Atlantic croaker (Micropogonias undulates) collected during the 2009 Northeast Fisheries Science CenterAutumn Bottom Trawl Survey aboard the NOAA Ship Henry B. Bigelow. These surveys document the abundance and distributionof fishes and macro-invertebrates on the northeast U.S. continental shelf. In addition to identifying the catch, a number ofindividual-level parameters are measured for many species, including length, weight, maturity, age, and diet. These data are used ina wide variety of assessments and research studies. Oceanographic and plankton data are also collected and used to examine linksbetween fish and invertebrate populations and environmental and oceanographic forcing. Photo credit: Keiichi Uchida.
JONATHAN A. HARE ET AL.456 Ecological ApplicationsVol. 20, No. 2

RF ¼SF
ðS=RÞF: ð8Þ
The equilibrium yield for each level of fishing
mortality was obtained by combining the yield per
recruit at each level of fishing mortality with this
predicted recruitment level to obtain an estimate of the
total yield at each level of fishing mortality:
YF ¼ ðY=RÞFRF: ð9Þ
The fishing rate at maximum sustainable yield (FMSY) is
defined as the F resulting in the maximum sustainable
yield (MSY ¼ max(YF)). These equations were applied
to the average S and R forecasts for each climate
scenario resulting is MSY and FMSY for each climate
scenario.
RESULTS
Environmentally explicit stock–recruitment relationship
Observed recruitment of Atlantic croaker in the mid-
Atlantic region is significantly correlated to minimum
winter air temperature (Fig. 1A), strongly supporting
the mechanistic recruitment hypothesis. Including a
temperature term in the stock–recruitment model
provides a significantly better fit compared to including
spawning-stock biomass alone (Appendix: Table A4)
and explains 61% of the variance in recruitment (Fig.
1B). Including temperature in the stock–recruitment
relationship permitted the detection of a significant
compensatory population effect (e.g., a dome-shaped
stock–recruitment function) that was masked by tem-
perature-driven variability. Simulated recruitment and
spawning-stock biomass largely overlapped with recruit-
FIG. 1. Relationship between Atlantic croaker (Micropogonias undulatus) recruitment and minimum winter air temperaturealong the mid-Atlantic coast of the United States and comparison of observed recruitment and spawning-stock biomass withhindcasts developed from a coupled climate–population model. (A) Relationship between minimum winter air temperature inVirginia, USA, and recruitment of Atlantic croaker (r ¼ 0.68, P , 0.001). (B) Environmental stock–recruitment relationship forAtlantic croaker (r2 ¼ 0.61, P , 0.001). The environmental stock–recruitment function yields a three-dimensional surface, withspawning-stock biomass, minimum winter temperature, and recruitment as the three dimensions. To visualize this surface in twodimensions, estimates of recruitment are shown for three fixed temperatures (�48C, 08C, andþ48C). (C, D) Comparison of observedand modeled recruitment and spawning-stock biomass from 1973 to 2003 based on the coupled climate–population model.Observed values (black lines) are from the stock assessment (ASMFC 2005). Modeled values are shown as the mean 6 SD of 100runs of the coupled climate–population model (red shading).
March 2010 457CLIMATE FORECASTS FOR A COASTAL FISHERY

ment and spawning-stock biomass from the stock
assessment (ASMFC 2005), providing confidence that
the model captures the large-scale dynamics of the
population (Fig. 1C, D).
Minimum winter temperatures
As the level of atmospheric CO2 increases, GCMs
predict that minimum winter temperatures in the
Chesapeake Bay region of the United States will increase
(Fig. 2). Under the commit scenario (CO2 constant at
350 ppm), the models predict little trend in minimum
winter temperatures; fluctuations are dominated by
natural variability within the climate system. In contrast,
under the B1 and A1B scenarios, the models predict
increasing minimum winter air temperatures with values
higher than observed during the 20th century.
Population abundance
With increasing minimum winter temperatures, the
coupled climate–population model predicts that Atlantic
croaker abundance will increase (Fig. 3). Increased
temperatures result in higher recruitment, which leads to
higher spawning-stock biomass. At current levels of
fishing mortality (F¼ 0.11), all GCMs and all scenarios
predicted higher population abundances than observed
since the early 1970s (when estimates of spawning-stock
biomass started). Ensemble mean increases in spawning-
stock biomass of 63%, 82%, and 92% are projected
under the commit, B1, and A1B scenarios, respectively.
Fishing also influences abundance; as fishing mortality
increases, spawning-stock biomass decreases. Forecast-
ed spawning-stock biomass decreases as fishing mortal-
ity increases, counteracting the effect of warming, but
even at higher fishing mortality rates (F ¼ 0.4), all
GCMs for the B1 and A1B scenarios predict higher
population abundances than observed in the past. These
results are intuitive based on the structure of the model
and the relationship between temperature and recruit-
ment, but unless fishing mortality increases by more
than fourfold, the coupled population–climate model
indicates that Atlantic croaker biomass will increase in
the future.
The model also allows the effect of climate change on
population dynamics to be quantified relative to the
effect of fishing through the comparison of the partial
derivatives of spawning-stock biomass (S ) relative to
climate scenario (C ) (]S/]C ) and fishing (F ) (]S/]F )FIG. 2. Observations and general circulation model (GCM)
projections of minimum winter air temperature in theChesapeake Bay region from 1900 to 2100. Results from threeCO2 emission scenarios (A1B, B1, and commit) averaged for 14GCMs are shown. Long-term trends in temperature arerepresented by a 30-point lowess smoother fit to the annualseries; these smoothed trends included a combination ofobserved and modeled temperatures so the divergence betweenobservations and models occurs prior to the end of theobservations. Lines represent the multimodel mean of theGCMs, and shading represents 95% confidence intervals. SeeMaterials and methods: Climate models for an explanation ofthe CO2 emission scenarios.
FIG. 3. Forecasts of the effects of climate change onAtlantic croaker spawning-stock biomass for each of 14 generalcirculation models (GCMs) and three CO2 emission scenarios(A1B, B1, and commit) at three fishing mortalities (F ¼ 0, F ¼0.1, and F ¼ 0.4). Historical means (HM) of spawning-stockbiomass are shown (1972�2004).
JONATHAN A. HARE ET AL.458 Ecological ApplicationsVol. 20, No. 2

(Fig. 4). As fishing mortality rate increases, ]S/]F
decreases. In contrast, ]S/]C remains relatively constant
over the range of fishing mortality rates. As a result, at
lower fishing mortality rates, the effect of climate is 10–
20% of the effect of fishing, while at higher fishing
mortality rates, the effect of climate is 20–30% of the
effect of fishing. In other words, an increase in
atmospheric CO2 from 350 to 550 ppm is approximately
equivalent to a 0.2 decrease in fishing mortality rate.
This is a substantial effect given that the estimated range
of fishing mortality on Atlantic croaker was 0.03–0.49
from 1973 to 2002 (ASMFC 2005).
Population distribution
The empirical distribution model predicts that with
increasing minimum winter air temperatures, the range
of Atlantic croaker will expand northward. Fishing also
has a strong effect on distribution, because fishing
mortality affects spawning-stock biomass (Fig. 5). At
zero fishing mortality, all climate models and scenarios
forecast a northward shift in the population of 50–200
km; the shift is greater at higher levels of atmospheric
CO2. Likewise, the northern extent of the distribution is
forecast to shift 100–400 km northward, and the
frequency north of Hudson Canyon increases 10–40%,
depending on the GCM and CO2 emission scenario. As
fishing mortality increases to 0.1 (the current level) and
0.4, the range expansions are predicted to be less. At
current levels of fishing (0.1), however, all B1 and A1B
scenarios and most commit scenarios forecast a north-
ward expansion of range. At relatively high fishing
mortality rates (0.4), most models predict no change in
mean distribution and frequency north of Hudson
Canyon and only a modest increase in the northern
extent of ;50 km.
The ensemble means exhibit the same patterns as
described above: with increased atmospheric CO2 and
resulting warming, the Atlantic croaker population will
expand northward if fishing remains at recent levels
(Fig. 6). The population is predicted to move 50–100 km
northward during the 21st century if fishing remains
near 0.1; the northern limit of the population is
predicted to shift 75–175 km northward. Further,
interannual variability is predicted to extend the
northern limit of the population past Hudson Canyon
in 10–30% of the years from 2010 to 2100. Over the past
decade, Atlantic croaker has become a regular fishery
species in Delaware Bay and coastal New Jersey, and
our results indicate that this trend will continue and that
Atlantic croaker will be observed more frequently in
waters of southern New England in the coming decades.
Population yield
A yield analysis based on the coupled climate–
population model estimates that management bench-
marks for Atlantic croaker in the mid-Atlantic region
will change dramatically with increasing minimum
winter air temperatures. Fishery benchmarks are bio-
logical reference points based on exploitation charac-
teristics of the population that are used for guidance in
developing fishery management strategies (Restrepo et
al. 1998). For Atlantic croaker, thresholds and targets
for fishing rate and spawning-stock biomass have been
defined relative to an estimated MSY and to the fishing
mortality rate (FMSY), which, if applied constantly,
would result in MSY (ASMFC 2005). Based on
ensemble averages across all GCMs, FMSY and MSY
increase under all three climate scenarios compared to
estimates based on mean minimum winter air temper-
atures over the past 30 years (Fig. 7). The yield curve
flattens at higher fishing mortality rates, so comparing
FIG. 4. (A) Ensemble multimodel mean spawning-stock biomass (2010–2100) for three climate scenarios (A1B, B1, andcommit) and a range of fishing mortality rates for Atlantic croaker. (B) Contours of (]S/]C )/(]S/]F), which is a measure of therelative effect of climate compared to fishing on spawning-stock biomass (see Results: Population abundance). Arrows along the x-axis indicate the current fishing mortality rate.
March 2010 459CLIMATE FORECASTS FOR A COASTAL FISHERY

FMSY is somewhat arbitrary (a range of Fs result in
similar yields), but forecasted MSYs are 35%, 73%, and
96% higher under the commit, B1, and A1B climate
scenarios, respectively, compared to the estimated MSY
based on observed minimum winter temperatures over
the past 30 years (Table 4).
DISCUSSION
We conclude that both fishing and climate change
impact the abundance and distribution of Atlantic
croaker along the mid-Atlantic coast of the United
States. Climate change also affects benchmarks used in
fisheries management; MSY and FMSY increase with
increasing temperatures. Thus, benchmarks for the mid-
Atlantic stock of Atlantic croaker set without consider-
ation of climate change would be precautionary
(Restrepo et al. 1998). The mid-Atlantic region repre-
sents the northern limit of Atlantic croaker, and we
forecast that projected temperature increases will have
positive effects on the species in this region (increased
abundance and range), not considering other effects of
climate change and ocean acidification (Doney et al.
2009, Drinkwater et al. 2009). For species with
populations at the southern end of the distribution,
similar modeling has forecast opposite results. For
example, Atlantic cod is predicted to shift northward,
becoming expatriated from the southern New England
shelf. Further, the productivity of the cod fishery in the
Gulf of Maine is predicted to decrease (Fogarty et al.
2008). In the instance of Atlantic cod, benchmarks used
in management may be set too high, and this may lead
unknowingly to unsustainable management practices
even under stringent rebuilding plans (Fogarty et al.
2008). This contrast illustrates that in any region, some
species will be positively affected by climate change,
while others will be negatively affected. Further, climate
change will affect the benchmarks used in fisheries
management. Understanding and quantifying the effect
of climate change on populations in combination with
the effect of exploitation is a major challenge to
FIG. 5. Forecasts of the effect of climate change on Atlantic croaker distribution in the mid-Atlantic region of the northeastU.S. continental shelf. Mean location, northern extent, and frequency north of Hudson Canyon are shown based on three CO2
emission scenarios (A1B, B1, and commit) and from 14 general circulation models (GCMs) at three fishing mortalities (F¼ 0, F¼0.1, and F¼ 0.4). Historical mean (HM) of distribution measures are shown (1972–2004).
JONATHAN A. HARE ET AL.460 Ecological ApplicationsVol. 20, No. 2

rebuilding and maintaining sustainable fisheries in the
coming decades.
The coupled climate–population model developed
here does not include all the potential climatic effects
on Atlantic croaker. The population model has a
number of parameters, all of which are potentially
affected by warming temperatures: recruitment (includ-
ed here), mass-at-age, maturity-at-age, natural mortal-
ity, fishing mortality, and catchability. The mass-at-age
and maturity-at-age schedules could be linked to
temperature (Brander 1995, Godø 2003). Natural
mortality is included as a constant, but climate change
may result in temporally variable predation pressure
(Overholtz and Link 2007). Fishing mortality also may
vary as fishing communities adapt to climate change
(e.g., Hamilton and Haedrich 1999, Berkes and Jolly
2001, McGoodwin 2007), and catchability may change
as the population shifts northward, where trawl fisheries
become more prevalent (Stevenson et al. 2004).
In addition to added climate effects in the population
model, there are also different forms of models that
could be used. Keyl and Wolff (2008) reviewed
environmental–population models in fisheries and found
six dominant types: stock–recruit analysis, surplus
production models, age- or size-structured models,
trophic and multispecies models, individual-based mod-
els, and generalized additive models. The population
model used here for Atlantic croaker was an age-
structured model with minimum winter temperature in
year y and spawning-stock biomass in year y influencing
recruitment in year y þ 1. Time lags are built into this
model since spawning-stock biomass is summed over age
classes, the sizes of which are dependent on initial
recruitment and subsequent mortality. Time lags also
FIG. 6. (A) Ensemble multimodel mean Atlantic croaker population location, (B) northern extent of the range (meanþ 2 SD),and (C) proportion of years when northern extent of the population is north of the Hudson Canyon (distance 600 km). (D) Maps ofvarious distance marks along the continental shelf. The historical values (1972–2004) of mean location (;240 km), northern extent(;420 km), and proportion of years with the measure of northern extent exceeding 600 km (0.09) are shown as dark gray contours.Arrows along the x-axis indicate the level of current fishing mortality rate.
March 2010 461CLIMATE FORECASTS FOR A COASTAL FISHERY

could be incorporated through temperature-dependent
growth (mass-at-age) or maturity functions. The distri-
bution model used spawning-stock biomass in year y
and minimum winter temperature in year y � 1 to
predict distribution in year y. Similar to the population
model, time lags are incorporated into the distribution
model through the inclusion of spawning-stock biomass.
Since Atlantic croaker is a migratory fish, it is also
possible that migrations in previous years affect the
distribution in the current year, resulting in additional
time lags that are not considered in the current effort.
Although our model does not include all the potential
complexities, it is based on a mechanistic recruitment
hypothesis that is supported by both laboratory work
(Lankford and Targett 2001a, b) and fieldwork (Nor-
cross and Austin 1981, Hare and Able 2007). Further,
the model is consistent with current fishery population
models (Hilborn and Walters 2004) and represents one
of the first attempts to link an ensemble of GCMs to a
fish population model for use in fisheries management.
The current model explains 61% of the variability in
recruitment (Fig. 1B), 31% of the variability in
distribution, and predicts the general patterns of
spawning-stock biomass over the last 30 years (Fig.
1D). Additionally, the outputs from 14 GCM models
are all consistent, and thus we have confidence in our
long-term forecasts.
It is important to note that our effort examines
Atlantic croaker at the northern part of its range
(ASMFC 2005). The recent assessment considers two
stocks of Atlantic croaker along the east coast of the
United States: a northern stock (considered here) and a
southern stock (not considered). There is evidence that
abundance of the southern stock is decreasing: catch has
decreased in southern states and a fishery-independent
abundance index of the southern stock has decreased
(ASMFC 2005). These findings are consistent with the
hypothesis that the southern stock is declining and
withdrawing northward in response to climate change,
but this question has not been examined in detailed and
there has been little research of environmental influences
on the dynamics of Atlantic croaker in the southern part
of the range.
Our forecasts are on a 50- to 100-year scale. Fisheries
management does not operate on these scales and
shorter-term forecasts are required. The climate model-
ing community is focusing great effort on developing
decadal-scale forecasts that include both externally
forced changes (e.g., CO2 emissions) and internal
variability (e.g., Atlantic meridional overturning circu-
lation, El Nino–Southern Oscillation) (Smith et al. 2007,
Keenlyside et al. 2008). In the future, a range of climate
forecasts of the status of fish populations (5–20 years,
20–50 years, 50–100 years) could be provided to
scientists, managers, and fishers (Brander 2009). How-
ever, these forecasts need to include the effects of both
fishing and climate on population dynamics (Planque et
al. 2009).
Quantitative coupled climate–population models for
fishery species are tractable, now, under certain circum-
stances. In the specific example, the climate–population
link (survival of overwintering juveniles in shallow
estuarine systems) is direct and well-reproduced by
current climate models. Winter temperature is an
important regulatory factor in many fish populations
(Hurst 2007), and the effort here could be easily
extended to some of these species. Climate–population
links for many other species will be complicated and
involve processes that cannot be simply indexed by air
temperature. To develop climate–population models in
these instances, climate models need to represent
mechanistic hypotheses linking the regional oceanic
TABLE 4. Fishing rate at maximum sustainable yield (FMSY),ensemble mean maximum sustainable yield (MSY), and95% confidence interval on MSY for Atlantic croaker basedon three CO2 emission scenarios simulated with 14 generalcirculation models (GCMs).
Scenario FMSY MSY (kg)Confidenceintervals (kg)
A1B 0.89 3.67 3 107 3.30–4.07 3 107
B1 0.78 3.23 3 107 2.90–3.58 3 107
Commit 0.62 2.52 3 107 2.24–2.82 3 107
Observed (1970-2002) 0.48 1.87 3 107
Notes: Also provided are the values based on the most recentstock assessment of Atlantic croaker (ASMFC 2005); the valuespresented here are slightly different from those presented in theassessment because the model form used here (an environmen-tally explicit Ricker stock–recruitment function) is differentfrom that used in the stock assessment (a standard Beverton-Holt function).
FIG. 7. Atlantic croaker fishery yield as a function of fishingmortality rate based on the temperature-dependent stock–recruitment model and ensemble multimodel mean of threeclimate scenarios (A1B, B1, and commit). Yield curves arepresented as lines; maximum sustainable yields (MSY) andfishing rates at maximum sustainable yields (FMSY) areindicated by triangles. Shading indicates 95% confidenceintervals around multimodel mean.
JONATHAN A. HARE ET AL.462 Ecological ApplicationsVol. 20, No. 2

environment to population dynamics and ultimately
include the interactions between populations and species
(Winder and Schindler 2004, Helmuth et al. 2006, Cury
et al. 2008). The development of such coupled models
will contribute to the goal of providing the best scientific
advice for managing fisheries in a future of changing
climate (Perry et al. 2009), as well as to future
assessments of the effect of climate change on regional
resources, ecosystems, and economies(IPCC 2007a).
ACKNOWLEDGMENTS
We thank Frank Schwing, Paul Conn, Joseph Smith, DavidRichardson, Patti Marraro, and Thomas Noji for reviewingearlier drafts of this manuscript. We also thank Larry Jacobson,Bill Overholtz, and Dvorah Hart for their comments on ourwork. The GCM outputs were obtained from the IPCC DataDistribution Center hosted at the World Data Center forClimate, Max-Planck-Institute for Meteorology/M&DO. Out-put for Hadley CM3 were provided to the World Data Centerfor Climate by the Met Office Hadley Centre Crown copyright2005. Our ability to conduct this work was a direct result of thecentral availability of the outputs from the GCMs. Ouracknowledgment of individuals or institutions does not implythat they agree with the content of this manuscript.
LITERATURE CITED
Able, K. W., and M. P. Fahay. 1998. The first year in the life ofestuarine fishes in the Middle Atlantic Bight. RutgersUniversity Press, New Brunswick, New Jersey, USA.
ASMFC [Atlantic States Marine Fisheries Commission]. 2005.Atlantic croaker stock assessment and peer-review reports.Atlantic States Marine Fisheries Commission, Washington,D.C., USA.
Azarovitz, T. R. 1981. A brief historical review of the WoodsHole Laboratory trawl survey time series. Canadian SpecialPublication of Fisheries and Aquatic Sciences 58:62–67.
Barnes, P. W., and J. P. Thomas, editors. 2005. Benthic habitatsand the effects of fishing. American Fisheries Society,Bethesda, Maryland, USA.
Berkes, F., and D. Jolly. 2001. Adapting to climate change:social-ecological resilience in a Canadian western Arcticcommunity. Conservation Ecology 5(2):18.
Brander, K. M. 1995. The effect of temperature on growth ofAtlantic cod (Gadus morhua L.). ICES Journal of MarineScience 52:1–10.
Brander, K. 2009. Impacts of climate change on fisheries.Journal of Marine Systems, in press.
Burnham, K. P., and D. R. Anderson. 1998. Model selectionand multimodel inference: a practical information-theoreticapproach. Springer, New York, New York, USA.
Christensen, V., S. Guenette, J. J. Heymans, C. J. Walters, R.Watson, D. Zeller, and D. Pauly. 2003. Hundred-year declineof North Atlantic predatory fishes. Fish and Fisheries 4:1–24.
Clark, R. A., C. J. Fox, D. Viner, and M. Livermore. 2003.North Sea cod and climate change: modelling the effects oftemperature on population dynamics. Global Change Biol-ogy 9:1669–1680.
Cook, R. M., and M. R. Heath. 2005. The implications ofwarming climate for the management of North Sea demersalfisheries. ICES Journal of Marine Science 62:1322–1326.
Cury, P. M., Y.-J. Shin, B. Planque, J. M. Durant, J.-M.Fromentin, S. Kramer-Schadt, N. C. Stenseth, M. Travers,and V. Grimm. 2008. Ecosystem oceanography for globalchange in fisheries. Trends in Ecology and Evolution 23:338–346.
Doney, S. C., V. J. Fabry, R. A. Feely, and J. A. Kleypas. 2009.Ocean acidification: the other CO2 problem. Annual Reviewof Marine Science 1:169–192.
Drinkwater, K. F., G. Beaugrand, M. Kaeriyama, S. Kim, G.Ottersen, R. I. Perry, H.-O. Portner, J. J. Polovina, and A.Takasuka. 2009. On the processes linking climate toecosystem changes. Journal of Marine Systems, in press.
Fogarty, M. J. 1998. Implications of migration and larvalinterchange in American lobster (Homarus americanus)stocks: spatial structure and resilience. Canadian SpecialPublication of Fisheries and Aquatic Science 125:273–283.
Fogarty, M. J., L. Incze, K. Hayhoe, D. G. Mountain, and J.Manning. 2008. Potential climate change impacts on Atlanticcod (Gadus morhua) off the northeastern USA. Mitigationand Adaptation Strategies for Global Change 13:453–466.
Frank, K. T., B. Petrie, J. S. Choi, and W. C. Leggett. 2005.Trophic cascades in a formerly cod-dominated ecosystem.Science 308:1621–1623.
Godø, O. R. 2003. Fluctuation in stock properties of north-eastArctic cod related to long-term environmental changes. Fishand Fisheries 4:121–137.
Hamilton, L. C., and R. L. Haedrich. 1999. Ecological andpopulation changes in fishing communities of the NorthAtlantic Arctic. Polar Research 18:383–388.
Hare, J. A., and K. W. Able. 2007. Mechanistic links betweenclimate and fisheries along the east coast of the United States:explaining population outbursts of Atlantic croaker (Micro-pogonias undulatus). Fisheries Oceanography 16:31–45.
Helmuth, B., N. Mieszkowska, P. Moore, and S. J. Hawkins.2006. Living on the edge of two changing worlds: forecastingthe responses of rocky intertidal ecosystems to climatechange. Annual Review of Ecology, Evolution, and System-atics 37:373–404.
Hilborn, R., T. A. Branch, B. Ernst, A. Magnusson, C. V.Minte-Vera, M. D. Scheuerell, and J. L. Valero. 2003. Stateof the world’s fisheries. Annual Review of Environment andResources 28:359–399.
Hilborn, R., and C. Walters. 2004. Quantitative fisheries stockassessment: choice, dynamics and uncertainty. KluwerAcademic, Norwell, Massachusetts, USA.
Hollowed, A. B., N. A. Bond, T. K. Wilderbuer, W. T.Stockhausen, Z. T. A’Mar, R. J. Beamish, J. E. Overland,and M. J. Schirripa. 2009. A framework for modelling fishand shellfish responses to future climate change. ICESJournal of Marine Science. [doi: 10.1093/icesjms/fsp057]
Hurst, T. P. 2007. Causes and consequences of winter mortalityin fishes. Journal of Fish Biology 71:315–345.
IPCC [Intergovernmental Panel on Climate Change]. 2007a.Climate change 2007: impacts, adaptation and vulnerability:contribution of Working Group II to the fourth assessmentreport of the Intergovernmental Panel on Climate Change.Cambridge University Press, Cambridge, UK.
IPCC [Intergovernmental Panel on Climate Change]. 2007b.Climate change 2007: the physical science basis. Contributionof Working Group I to the fourth assessment report of theIntergovernmental Panel on Climate Change. CambridgeUniversity Press, Cambridge, UK.
Jackson, J. B. C., et al. 2001. Historical overfishing and therecent collapse of coastal ecosystems. Science 293:629–637.
Joyce, T. M. 2002. One hundred plus years of wintertimeclimate variability in the eastern United States. Journal ofClimate 15:1076–1086.
Kaje, J. H., and D. D. Huppert. 2007. The value of short-runclimate forecasts in managing the coastal coho salmon(Oncorhynchus kisutch) fishery in Washington State. NaturalResource Modeling 20:321–349.
Keenlyside, N. S., M. Latif, J. Jungclaus, L. Kornblueh, and E.Roeckner. 2008. Advancing decadal-scale climate predictionin the North Atlantic sector. Nature 453:84–88.
Kell, L. T., G. M. Pilling, and C. M. O’Brien. 2005.Implications of climate change for the management of NorthSea cod (Gadus morhua). ICES Journal of Marine Science 62:1483–1491.
March 2010 463CLIMATE FORECASTS FOR A COASTAL FISHERY
Keyl, F., and M. Wolff. 2008. Environmental variability andfisheries: What can models do? Reviews in Fish Biology andFisheries 18:273–299.
Koster, F. W., D. Schnack, and C. Mollmann. 2003. Scientificknowledge of biological processes potentially useful in fishstock predictions. Scientia Marina 67(Supplement 1):101–127.
Krebs, C. J., and D. Berteaux. 2006. Problems and pitfalls inrelating climate variability to population dynamics. ClimateResearch 32:143–149.
Lankford, T. E., and T. E. Targett. 2001a. Low-temperaturetolerance of age-0 Atlantic croakers: recruitment implicationsfor U.S. Mid-Atlantic estuaries. Transactions of the Amer-ican Fisheries Society 130:236–249.
Lankford, T. E., and T. E. Targett. 2001b. Physiologicalperformance of young-of-the-year Atlantic croakers fromdifferent Atlantic coast estuaries: implications for stockstructure. Transactions of the American Fisheries Society130:367–375.
Lawson, T. A., and R. Hilborn. 1985. Equilibrium yields andyield isopleths from a general age-structured model ofharvested populations. Canadian Journal of Fisheries andAquatic Sciences 42:1766–1771.
MacCall, A. D. 1990. Dynamic geography of marine fishpopulations. University of Washington Press, Seattle, Wash-ington, USA.
Mackenzie, B. R., H. Gislason, C. Mollmann, and F. W.Koster. 2007. Impact of 21st century climate change on theBaltic Sea fish community and fisheries. Global ChangeBiology 13:1348–1367.
McGoodwin, J. R. 2007. Effects of climatic variability on threefishing economies in high-latitude regions: implications forfisheries policies. Marine Policy 31:40–55.
Murdy, E. O., R. S. Birdsong, and J. A. Musick. 1997. Fishes ofCheaspeake Bay. Smithsonian Institution Press, Washington,D.C., USA.
Myers, R. A. 1998. When do environment–recruitmentcorrelations work? Reviews in Fish Biology and Fisheries 8:285–305.
Myers, R. A., J. A. Hutchings, and N. J. Barrowman. 1997.Why do fish stocks collapse? The example of cod in easternCanada. Ecological Applications 7:91–106.
NMFS [National Marine Fisheries Service]. 2008. Fisheries ofthe United States, 2007. Department of Commerce, SilverSpring, Maryland, USA.
Norcross, B. L., and H. M. Austin. 1981. Climate scaleenvironmental factors affecting year class fluctuations ofChesapeake Bay croaker Micropogonias undulatus. VirginiaInstitue of Marine Science, Gloucester Point, Virginia, USA.
NRC [National Research Council]. 1999. Sustaining marinefisheries. National Academy Press, Washington, D.C., USA.
O’Farrell, M., and L. W. Botsford. 2006. The fisheriesmanagement implications of maternal-age-dependent larvalsurvival. Canadian Journal of Fisheries and Aquatic Sciences63:2249–2258.
Overholtz, W. J., and J. S. Link. 2007. Consumption impacts bymarine mammals, fish, and seabirds on the Gulf of Maine-Georges Bank Atlantic herring (Clupea harengus) complexduring the years 1977–2002. ICES Journal of Marine Science64:83–96.
Perry, A. L., P. J. Low, J. R. Ellis, and J. D. Reynolds. 2005.Climate change and distribution shifts in marine fishes.Science 308:1912–1915.
Perry, R. I., P. Cury, K. Brander, S. Jennings, C. Mollmann,and B. Planque. 2009. Sensitivity of marine systems toclimate and fishing: concepts, issues and managementresponses. Journal of Marine Systems, in press.
Planque, B., J.-M. Fromentin, P. Cury, K. F. Drinkwater, S.Jennings, R. I. Perry, and S. Kifani. 2009. How does fishing
alter marine populations and ecosystems sensitivity toclimate? Journal of Marine Systems, in press.
Quinn, T. J., and R. B. Desiro. 1999. Quantitative fishdynamics. Oxford University Press, New York, New York,USA.
Reed, J. K., C. C. Koenig, and A. N. Shepard. 2007. Impacts ofbottom trawling on a deep-water Oculina coral ecosystem offFlorida. Bulletin of Marine Science 81:481–496.
Reichler, T., and J. Kim. 2008. How well do coupled modelssimulate today’s climate? Bulletin of the American Meteoro-logical Society 89:303–311.
Restrepo, V. R., G. G. Thompson, P. M. Mace, W. L. Gabriel,L. L. Low, A. D. MacCall, R. D. Methot, J. E. Powers, B. L.Taylor, P. R. Wade, and J. F. Witzig. 1998. Technicalguidance on the use of precautionary approaches toimplementing National Standard 1 of the Magnuson-StevensFishery Conservation and Management Act. NationalOceanic and Atmospheric Administration Technical Memo-randum NMFS-F/SPO-31.
Richards, L. J., and J.-J. Maguire. 1998. Recent internationalagreements and the precautionary approach: new directionsfor fisheries management science. Canadian Journal ofFisheries and Aquatic Sciences 55:1545–1552.
Rockmann, C., U. A. Schneider, M. A. St. John, and R. S. J.Tol. 2007. Rebuilding the eastern Baltic cod stock underenvironmental change: a preliminary approach using stock,environmental, and management constraints. Natural Re-source Modeling 20:223–262.
Roelofs, E. W., and D. F. Bumpus. 1953. The hydrography ofPamlico Sound. Bulletin of Marine Science of the Gulf andCaribbean 3:181–205.
Rothschild, B. J. 1986. Dynamics of marine fish populations.Harvard University Press, Cambridge, Massachusetts, USA.
Scott, B. E., G. Marteinsdottir, G. A. Begg, P. J. Wright, andO. S. Kjesbu. 2006. Effects of population size/age structure,condition and temporal dynamics of spawning on reproduc-tive output in Atlantic cod (Gadus morhua). EcologicalModelling 191:383–415.
Sherman, K. 1980. MARMAP, a fisheries ecosystem study inthe NW Atlantic: fluctuations in ichthyoplankton-zooplank-ton components and their potential for impact on the system.Pages 9–37 in F. Diemer, F. Vernberg, and D. Mirkes,editors. Advance concepts in ocean measurements for marinebiology. University of South Carolina Press, Belle W. BaruchInstitute for Marine Biology and Coastal Research, Colum-bia, South Carolina, USA.
Smith, D. M., S. Cusack, A. W. Colman, C. K. Folland, G. R.Harris, and J. M. Murphy. 2007. Improved surface temper-ature prediction for the coming decade from a global climatemodel. Science 317:796–799.
Stenseth, N. C., A. Mysterud, G. Ottersen, J. W. Hurrell, K.-S.Chan, and M. Lima. 2002. Ecological effects of climatefluctuations. Science 297:1292–1296.
Stevenson, D., L. Chiarella, D. Stephan, R. Reid, K. Wilhelm, J.McCarthy, and M. Pentony. 2004. Characterization of thefishing practices and marine benthic ecosystems of thenortheast U.S. shelf, and an evaluation of the potential effectsof fishing on essential habitat. National Oceanic andAtmospheric Administration Technical MemorandumNMFSNE 181. Northeast Fisheries Science Center, Woods Hole,Massachusetts, USA.
Warlen, S. M. 1982. Age and growth of larvae and spawningtime of Atlantic croaker in North Carolina. Proceedings ofthe Annual Conference of the Southeastern Association ofFish and Wildlife Agencies 34:204–214.
Winder, M., and D. E. Schindler. 2004. Climate changeuncouples trophic interactions in an aquatic ecosystem.Ecology 85:2100–2106.
APPENDIX
Background on general circulation models, choice of a stock–recruitment function, and distribution model based on logisticregression (Ecological Archives A020-012-A1).
JONATHAN A. HARE ET AL.464 Ecological ApplicationsVol. 20, No. 2


![An Approach for Flow Forecasting in Ungauged Catchments ... Approach for...ervoir inflow forecasting [An et al. 2012, Anh et al. 2015]. Coupled neural networks have recently become](https://static.fdocuments.net/doc/165x107/60c77e3ae6495b0d6407439f/an-approach-for-flow-forecasting-in-ungauged-catchments-approach-for-ervoir.jpg)