DYNAMIC THIRD-GENERATION WHOLE-STAND MODEL … · dynamic third-generation whole-stand model for...
16
FORESTRY IDEAS, 2014, vol. 20, No 1 (47): 31–46 DYNAMIC THIRD-GENERATION WHOLE-STAND MODEL FOR SCOTS PINE PLANTATIONS IN BULGARIA Tatiana Stankova 1* and Ulises Diéguez-Aranda 2 1 Department of Forest Genetics, physiology and plantations, Forest Research Institute of the Bulgarian Academy of Sciences, 1756 Sofia, Bulgaria. E-mail: [email protected] 2 Department of Agroforestry Engineering, University of Santiago de Compostela, 27002 Lugo, Spain. E-mail: [email protected] Received: 26 March 2014 Accepted: 28 April 2014 Abstract The main objective of this investigation was to derive a dynamic third-generation whole-stand model, which consists of a flexible system of mathematical equations presented graphically - Stand Density Management Diagram (SDMD) – and allows good description of the development of the stands over time. A new SDMD for Scots pine plantations in Bulgaria was elaborated that included two improvements as compared to the preceding SDMD. The Natural thinning curves (NTC) sub-model was presented in a dynamic equation form and was estimated over repeated measurements data from permanent sample plots. The Equivalent height curves (EHC) sub- model was reformulated to include a site index-specific parameter, which produced SDMDs differ- entiated by site index classes. The principal sub-models of the SDMD were fitted with high level of determination and produced unbiased and statistically significant parameter estimates. The NTC in generalized algebraic difference equation form provided the maximum possible model flexibility by means of stand-specific shape and asymptote of these trajectories. The slope parameter of the self-thinning asymptotes α had value of 1.74. The new model improvements added to its precision and assured improved predictive abilities. Key words: dynamic growth model, Pinus sylvestris, stand density management diagram, Scots pine plantations, stand-specific model parameters, whole-stand model. Introduction A model is an abstraction, or a simplified representation, of some aspect of reality and the forest growth model is an ab- straction of the natural dynamics of a for- est tree or stand, which may encompass growth, mortality, and other changes in stand composition and structure (Vanclay 1994). According to the level of detail they provide, forest growth models are classi- fied into three categories: whole-stand, size-class and individual-tree models. In Bulgaria only whole-stand growth models have been developed and characteristic of this model category is the idea of mod- eling stand growth by the age develop- ment of mean and cumulative stand vari- ables such as height, standing volume or volume growth for use in the assessment, planning and implementation for forestry operations (Pretzsch 2009). The whole- stand growth models are the oldest model type, and are largely represented
-
Upload
truonghanh -
Category
Documents
-
view
223 -
download
0
Transcript of DYNAMIC THIRD-GENERATION WHOLE-STAND MODEL … · dynamic third-generation whole-stand model for...

FORESTRY IDEAS, 2014, vol. 20, No 1 (47): 31–46
DYNAMIC THIRD-GENERATION WHOLE-STAND MODEL FOR SCOTS PINE PLANTATIONS IN BULGARIA
Tatiana Stankova1* and Ulises Diéguez-Aranda2
1Department of Forest Genetics, physiology and plantations, Forest Research Institute of the Bulgarian Academy of Sciences, 1756 Sofia, Bulgaria. E-mail: [email protected]
2Department of Agroforestry Engineering, University of Santiago de Compostela, 27002 Lugo, Spain. E-mail: [email protected]
Received: 26 March 2014 Accepted: 28 April 2014
AbstractThe main objective of this investigation was to derive a dynamic third-generation whole-stand
model, which consists of a flexible system of mathematical equations presented graphically - Stand Density Management Diagram (SDMD) – and allows good description of the development of the stands over time. A new SDMD for Scots pine plantations in Bulgaria was elaborated that included two improvements as compared to the preceding SDMD. The Natural thinning curves (NTC) sub-model was presented in a dynamic equation form and was estimated over repeated measurements data from permanent sample plots. The Equivalent height curves (EHC) sub-model was reformulated to include a site index-specific parameter, which produced SDMDs differ-entiated by site index classes. The principal sub-models of the SDMD were fitted with high level of determination and produced unbiased and statistically significant parameter estimates. The NTC in generalized algebraic difference equation form provided the maximum possible model flexibility by means of stand-specific shape and asymptote of these trajectories. The slope parameter of the self-thinning asymptotes α had value of 1.74. The new model improvements added to its precision and assured improved predictive abilities.
Key words: dynamic growth model, Pinus sylvestris, stand density management diagram, Scots pine plantations, stand-specific model parameters, whole-stand model.
Introduction
A model is an abstraction, or a simplified representation, of some aspect of reality and the forest growth model is an ab-straction of the natural dynamics of a for-est tree or stand, which may encompass growth, mortality, and other changes in stand composition and structure (Vanclay 1994). According to the level of detail they provide, forest growth models are classi-fied into three categories: whole-stand,
size-class and individual-tree models. In Bulgaria only whole-stand growth models have been developed and characteristic of this model category is the idea of mod-eling stand growth by the age develop-ment of mean and cumulative stand vari-ables such as height, standing volume or volume growth for use in the assessment, planning and implementation for forestry operations (Pretzsch 2009). The whole-stand growth models are the oldest model type, and are largely represented
T. Stankova and U. Diéguez-Aranda32
by the growth and yield tables. Pretzsch (2009) distinguished four generations of whole-stand growth models and the growth and yield tables for normal stands currently implemented in the forest man-agement in Bulgaria can be classified as second generation stand-level models. They present in tabular form the most im-portant stand characteristics according to established silvicultural prescriptions in homogeneous even-aged managed “nor-mal” stands, usually every 5 years.
Besides the traditional for the Ameri-can and the European forestry practice table form, other whole-stand growth models have been developed and pre-sented for practical application in graphi-cal form. Such models are the Stand Density Management Diagrams (SDMD), which were initially developed in Japan and are primarily used to derive density-control schedules by management ob-jective. The methodology of the SDMD was modified and adapted for application in Bulgaria and was implemented in de-velopment of such models for Scots pine plantations in Rila Mountain (Stankova 2004) and for Scots pine and Austrian black pine plantations on national scale (Stankova 2006). These Stand Density Management (or Control) Diagrams are composed of 5 elements, which are de-fined by principal stand growth param-eters (Stankova 2006): Equivalent height curves (EHC), which describe the rela-tionship between stand yield and density at a given growth stage; Full density line, which connects the points of density–maximum yield combinations; Natural thinning curves (NTC), which describe the yield growth of stands of given initial densities with time-lapse, considering the process of self-thinning; Equivalent mean diameter curves (EDC), which
connect yield-density combinations of stands having the same mean diameter; and Yield index lines, which are parallel to the Full density line and indicate differ-ent stocking levels.
The SDMDs can be subdivided into (1) static, which lack a temporal density decrease sub-model, and (2) dynamic, which include a sub-model for density decrease in time (Newton 2009b). The density decrease sub-model included in the dynamic SDMD usually requires sup-plementary information about stand age and/or site index (Castedo-Dorado et al. 2009, Newton 2009a, 2012a, 2012b), which is not directly obtainable from the diagram. Another approach in modeling the dynamic component of the SDMD is to express directly volume or biomass growth in time as a function of the de-crease in density (Tadaki 1964, Shibuya et al. 1997, Stankova and Shibuya 2007) in a set of natural thinning trajectories, thus bypassing the sub-model of density decrease with time. In spite of the intrin-sically dynamic nature of the SDMD de-veloped in Bulgaria, their dynamic sub-model – the Natural thinning curves – was not estimated over repeated meas-urements data from permanent sample plots, but was indirectly determined from the parameters of the full-density line (Stankova 2006, Stankova and Shibuya 2007); this sub-model showed potential for precision improvement (Stankova 2007). An investigation on the accuracy of the Equivalent height curves through validation with experimental data sets suggested possibility to improve their predictive abilities through SDMD differ-entiation by site index classes (Stankova and Petrin 2008).
The main objectives of the present investigation are: 1) to reformulate the

Dynamic Third-Generation Whole-Stand... 33
NTC sub-model of the SDMD in dynamic equation form; 2) to derive site index-specific EHC sub-model, and 3) to apply the improvements in the elaboration of a new dynamic SDMD model for Scots pine (Pinus sylvestris L.) plantations in Bulgaria.
Materials and Methods
Data set
The data set was generated from both personally collected and published data records. The first source of data com-prised 115 variable-sized (of circular or rectangular form) temporary sam-ple plots established and measured in 2002–2005. In each plot, breast height diameters of all trees, samples of aver-age and dominant tree heights and the number of trees were recorded. Mean and dominant stand heights, stand ba-sal area and stand density, expressed as number of trees per hectare, were calculated from the plot measurements. The mean and the total stand volumes were calculated from the individual stem volumes of the trees within each plot, which were determined through the vol-ume tables for Scots pine plantations by Krastanov et al. (1983). Beside the personally recorded data, additional data from 340 plots in P. sylvetsris plan-tations either published or granted by other researchers were included in the data set. The sources of these data are permanent and temporary sample plots data published in PhD theses, MSc thesis, books, articles, and research reports (Stankova 2006, Appendix 2). Data records from 21 permanent sample
plots installed in 1–3 replications and re-measured 1 to 3 times were obtained from Forest Inventory Plans. In addition, 46 measurement sets used for devel-oping growth and yield tables for Scots pine plantations in Bulgaria (Krastanov et al. 1980) were also included as part of the parameterization data set. Dominant heights for the published data were additionally determined using the es-tablished allometric relationship to the mean height for Scots pine plantations (Stankova et al. 2006). Data sub-sets that contained the dependent and all in-dependent variables, required by the re-spective sub-model, were drawn from the total data set to parameterize each par-ticular principal sub-model of the SDMD. Both longitudinal and cross-sectional data were used to fit the EDC sub-mod-el and the EHC sub-model. Dominant heights were grouped into 1 m classes for the EHC sub-model. Site index was estimated by plots for reference age 50 years, according to the dynamic site in-dex model by Stankova and Diéguez-Aranda (2012) and data were classified into four-meter site index classes. Three of them – 16, 20 and 24 m – presented sufficient amount of data for parameteri-zation of the EHC sub-model, which was assessed through a preliminary screen-ing. Data within each site index class were examined by height classes and only those height classes, which had at least 3 measurements and revealed adequate estimation of the reciprocal relationship between density and mean volume (Stankova 2006), with 2 positive model parameters, were included in the parameterization data set. The domi-nant height classes, which were finally selected, spanned uniformly the density mean volume data for each of site index
T. Stankova and U. Diéguez-Aranda34
classes 16, 20 and 24 m (Table 1). The estimation of dynamic NTC requires lon-gitudinal data and measurements from 48 permanent plots were available for it. To overcome the scarce amount of data for this sub-model, 81 more plots (initial density sub-set) were added. Two
measurements in time were available for each plot of the latter sub-set, the first-one representing the initial planting density coupled with initial mean vol-ume value, which was set equal to zero. Summary of the parameterization data sets by sub-models is shown in Table 1.
SDMD Sub-model Stand variable** Mean Standard Deviation Minimum Maximum
Equivalent Mean Diameter Curves(n=609)
Quadratic mean diameter, cm 14.8 6.9 2.2 38.0
Dominant stand height, m 14.7 6.1 1.5 32.5
Stand density, ha–1 2986 2451 360 20000Total stand volume, m3∙ha–1 295.1 174.9 2.2 909.7
Equivalent Dominant Height Curves
Site index 16m (n=57)
Dominant height class, m 11 4 5 15
Stand density, ha–1 4152 2888 1505 20000Mean stem volume, m3 0.0710 0.0499 0.0029 0.1936
Site index 20m (n=204)
Dominant height class, m 13 6 4 27
Stand density, ha–1 3597 2544 466 16800Mean stem volume, m3 0.1308 0.1613 0.0018 1.1578
Site index 24m (n=90)
Dominant height class, m 16 5 6 22
Stand density, ha–1 2925 2300 553 12550
Mean stem volume, m3 0.1632 0.1295 0.0056 0.4884
Natural Thinning Curves*
Permanent Sample Plots (n=133)
Stand density, ha–1 2375 2384 393 20000
Mean stem volume, m3 0.2893 0.2488 0.0029 1.2568
Initial density sub-set (n=162)
Stand density, ha–1 4827 3187 1723 20000
Mean stem volume, m3 0.0353 0.0513 0 0.2441
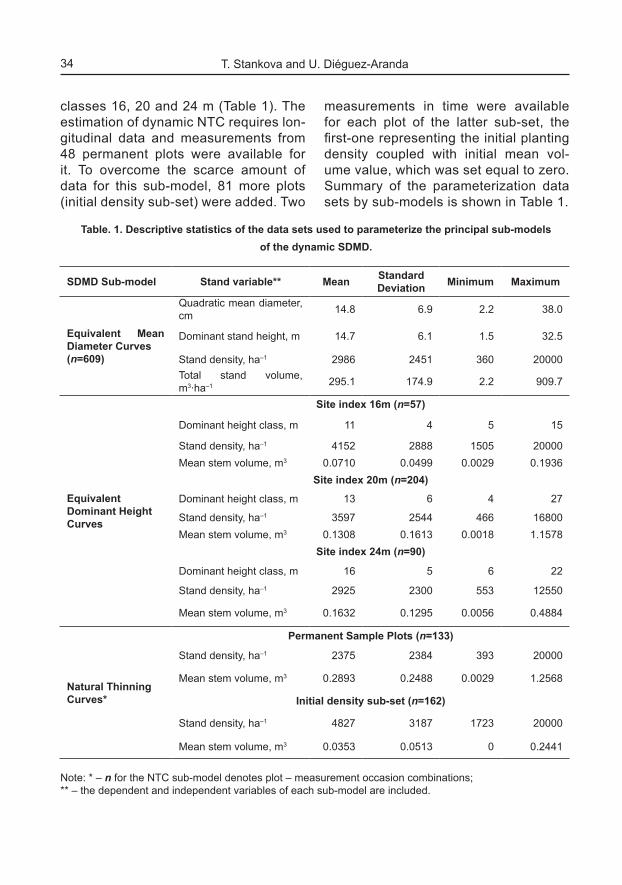
Table. 1. Descriptive statistics of the data sets used to parameterize the principal sub-models of the dynamic SDMD.
Note: * – n for the NTC sub-model denotes plot – measurement occasion combinations;** – the dependent and independent variables of each sub-model are included.

Dynamic Third-Generation Whole-Stand... 35
Dynamic SDMD model derivation
The new dynamic SDMD for Scots pine plantations provides improvements to the preceding model (Stankova 2006, Stankova and Shibuya 2007) in two ways. First, the NTC sub-model was reformulat-ed from integral to generalized algebraic difference equation form, thus deriving a dynamic equation to be estimated over a data set from repeated measurements of permanent sample plots. Next, the EHC sub-model was reformulated to include a site index-specific parameter, providing in this manner different SDMD model for each site index class.
The integral equation form of the NTC sub-model is suggested by Shibuya (1995) and presents the mean stem vol-ume as a function of the number of trees per hectare:
fNKv -⋅= -a (1),
where: v is the mean stem volume (m3), N is stand density (ha–1), and α, K and f are parameters. Parameter f by definition is stand-specific and depends on the initial stand density, while parameters K and α correspond to the intercept and the slope of the full-density line (Shibuya 1995). The latter two parameters are often considered species-specific, i.e. global model param-eters, but some studies suggest that the intercept K is not a global, but a specific parameter, which depends not only on the tree species, but also on site quality, spe-cies mixture and stand origin (Shibuya 1995, Weiskittel et al. 2009). In this study,
we assumed that α is global, while K is site-specific. At the initial stand conditions, mean stem volume approaches zero, while N obtains the initial stand density value N0:
fKNfNK =⇒=-⋅ - aa
00 0 ~ f(X) (2)
Equation 2 suggests that, if there is a complex unobservable independent variable X, which combines the effect of variables otherwise not accounted for in the model (e.g. initial stocking rate, soil conditions, ecological and climatic fac-tors) and which is incorporated in the natural thinning model, the two specific model parameters K and f should be re-lated to it in an inverse manner. Thus, the following reciprocal formulations are suggested:
XfXpK 1, =⋅= (3),
where p is a global model parameter. By substitution of equations 3 into equation 1 and after solving for the initial conditions N=N1 and v=v1 the following expression for X is obtained:
a
a
-
-
⋅⋅⋅⋅++
=1
1211
24Np
NpvvX (4)
After substitution of equation 4 into equation 1 for the current conditions N=N2 and v=v2, the Generalized Algebraic Dif-ference Approach (GADA) equation is de-rived:
(5)( )a
aaa
a
-
--
--
⋅⋅++
⋅⋅-⋅⋅++
⋅=-⋅⋅=
1211
11
211
2122
424
21
NpvvNpNpvvNN
XNXpv
a

T. Stankova and U. Diéguez-Aranda36
Equation 5 provides prediction for the mean stem volume, based on the stand density value (N2) and the past records for the mean stem volume and stand density (N1, v1).
The EHC sub-model is based on the reciprocal equation by Hagihara (2000):
or (6),
where: V is the total volume per hectare (m3∙ha–1), while At and B are model pa-rameters that are functions of time, but independent of density:
(7)
0veBτ-
= (8),
where: v0 is a constant irrespective of the initial density and is equal to the initial mean stem volume, τ is called biological time (an integrated value of the coefficient of growth λ(τ) with respect to physical time t), μ is a specific constant corresponding to the relative mortality rate as τ tends to be finitely large, *
iN is the initial density of a population that obeys the 3/2 power law of self-thinning from the start of the experi-ment (Hagihara 2000). Equation 8 can be reformulated as:
0vBe ⋅=-τ (9)
Substitution of equation 9 into equa-tion 7 allows the following formulation of At as a function of B:
(10),where:
*0
)1(0
1iNv
vc⋅
=-aµ
(11)
*0
10
2iNv
vc⋅
=-µ
(12)
)1(1 -= aµd (13)
µ-= 12d (14)
Next, the representation of param-eter B as a power function of the domi-nant height class (H , m) was considered (Stankova and Shibuya 2007):
2ˆ2
bHaB -⋅= (15),
where: a2, b2 are model parameters. The output of a preliminary fit of the recipro-cal equation 6 over the experimental data, i.e. the estimates for parameter B through equation 6, was used to examine the power relationship of equation 15. It was fitted once setting b2 global and a2 site index specific parameter and then setting a2 global and b2 site index specific parameter. The results showed that pa-rameter a2 was not significant when fitted as specific parameter, while parameter b2
BNAtv
1BNAt
NV
)1()1(*
0
1
eeNv
Ati
1*
0
10)1(
*0
)1(0
10
)1(0*
0
1
BNv
vB
Nvv
vBvBNv
At
ii
i
2121
dd BcBcAt

Dynamic Third-Generation Whole-Stand... 37
varied significantly by site index classes. Consequently, parameter a2 was derived as global, while parameter b2 – as specific model parameter.
After substitution of equation 10 into equation 6, the EHC sub-model was ex-pressed as a function of two independ-ent variables (dominant height class and number of trees per hectare), five global (c1, c2, d1, d2 and a2) and one (b2) site in-dex specific parameters:
BBcBcNv dd +⋅-⋅
=)(
121
21
,
where 2ˆ2bHaB -⋅= (16)
The other sub-models of the dynamic SDMD followed the formulations sug-gested in the previous studies (Stankova 2006, Stankova and Shibuya 2007):
Equivalent mean diameter curves sub-model:
40000
)(2 cHaQMDNV +⋅⋅⋅=π
(17)
Full density line:a-⋅= NKvFDL (18)
Yield index lines:
FDLYIL vYIv (19),where: H is dominant stand height (m), QMD is stand quadratic mean diameter, a and c are global model parameters in an expression that derives average stand form height as a linear function of domi-nant stand height (equation 17), YI de-notes yield index that corresponds to the stand stocking rate and obtains values between 0 and 1, FDLv denotes the mean stem volume of stands on the full density
line, while νYIL denotes the mean stem vol-ume of stands of yield index YI.
Estimation procedure and goodness of fit statistics
The estimation procedure required appli-cation of a sequence of several steps for model parameterization. First, the dynam-ic NTC sub-model was fitted in algebraic difference equation form (equation 5), using a similar method to the Base-Age Invariant (BAI) dummy variable approach (Cieszewski et al. 2000), that exhibits invariance property of the parameter es-timates. The BAI methods are proposed and developed where dominant height is the dependent variable and stand age is the independent variable, but was adapt-ed here for a model formulation in which stand density is the independent variable and mean stem volume is the dependent variable; therefore, it is a “Base-Density Invariant (BDI)” method. The mean stem volume corresponding to the base density was estimated as plot specific parameter employing dummy variables pi of value 1 for plot i and 0 otherwise. Next, the value of the global slope parameter α estimated through equation 5 was used to constrain the value of parameter d1 against d2 in the EHC sub-model (equation 16). If param-eter μ in equation 14 is expressed by pa-rameter d2 and is further substituted into equation 13, the following relationship is derived:
21 )1(1 dd ---= aa (20)
Consequently, the estimated value for α allows reduction in the number of pa-rameters of equation 16 through imple-

T. Stankova and U. Diéguez-Aranda38
mentation of equation 20 as a constraint. Equations 11–14, on the other hand, pro-pose the following formulation for the con-stant v0 (corresponding to the initial mean stem volume at the time of stand estab-lishment):
21
1
2
10
dd
ccv -
= (21)
The values of the model parameters c1, c2, d1, d2 can be constrained in such a way that v0 attains practically meaningful value by employing an appropriate empiri-cal constant, e.g.
3
1
2
10 ,0005.0
21
mccv
dd<
=
-
(22)
The constant 0.0005 m3 was obtained from the volume tables for Scots pine plan-tations (Krastanov et al. 1980) and corre-sponds to the mean stem volume of a tree of 1cm diameter at breast height from the lowest height classes (12–15 m). Param-eter b2 was expanded to include dummy variables (qi) and parameters associated with the particular site indices (b2i), i.e.
ii
i bqb 224,20,16
2
(23),
where qi are the dummy variables of val-ue 1 for site index i and 0 otherwise. After fitting the EHC sub-model (equation 16) with simultaneous application of the de-rived constraints (equations 20 and 22), the initial mean stem volume at the time of stand establishment v0 was estimated from equation 21 and subsequently sub-
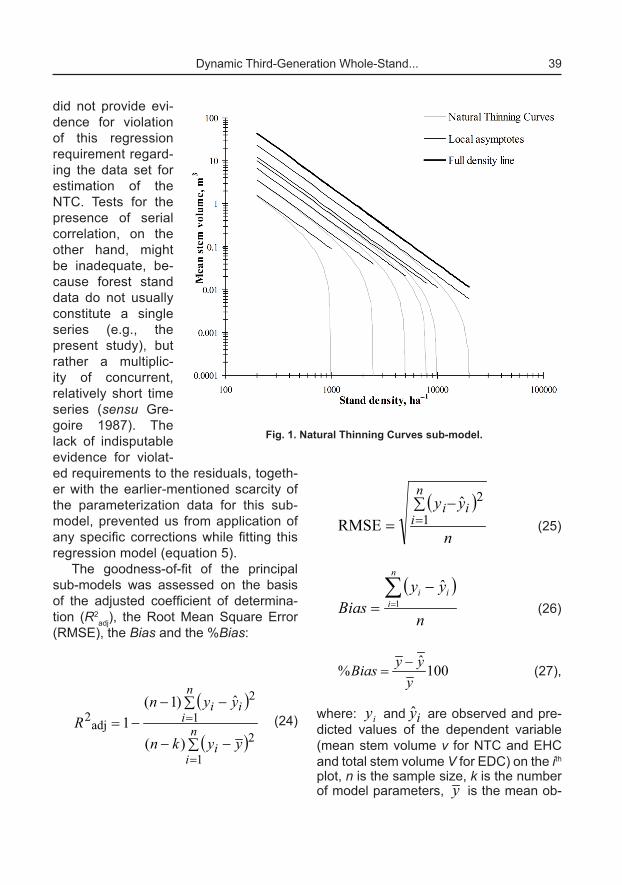
stituted in the initial density data sub-set for the NTC sub-model (Table 1). Then, the NTC sub-model was refitted over the updated data set, which did not change the slope parameter value α to the second decimal place, but provided more precise estimation for parameter p (equation 5). The GADA form of the NTC sub-model suggests stand-specific shape (f) and intercept (K) of the esti-mated trajectories, thus deriving set of polymorphic curves with multiple asymp-totes (Figure 1). The uppermost of the resultant asymptotes was defined as the
Full density line, i.e. a-⋅= NKv FDLFDL ,
)(max XpK FDL ⋅= . The elaboration of the dynamic SDMD was completed with the estimation of the EDC sub-model through equation 17.
The three principal sub-models of the SDMD (EHC, EDC and NTC) were fitted through nonlinear least squares method, applying the Marquardt estimation algo-rithm. The combined time-series cross-sectional nature of the remeasurement data used to fit the EHC and the EDC contributed to manifestation of hetero-geneous variances (heteroscedasticity), which was detected through graphical and analytical tests, and application of Heteroscedasticity-Consistent Covari-ance Matrix Estimation (HCCME) (Long and Ervin 2000) was applied to assure the efficiency of the regression estimates for these two sub-models. Furthermore, the assumption of independent errors is very likely to be violated in estimating dynamic regression equations with data from repeated measurements of perma-nent sample plots (e.g. the NTC). How-ever, the graphical and analytical tests for presence of heteroscedastic errors
Dynamic Third-Generation Whole-Stand... 39
did not provide evi-dence for violation of this regression requirement regard-ing the data set for estimation of the NTC. Tests for the presence of serial correlation, on the other hand, might be inadequate, be-cause forest stand data do not usually constitute a single series (e.g., the present study), but rather a multiplic-ity of concurrent, relatively short time series (sensu Gre-goire 1987). The lack of indisputable evidence for violat-ed requirements to the residuals, togeth-er with the earlier-mentioned scarcity of the parameterization data for this sub-model, prevented us from application of any specific corrections while fitting this regression model (equation 5).
The goodness-of-fit of the principal sub-models was assessed on the basis of the adjusted coefficient of determina-tion (R2
adj), the Root Mean Square Error (RMSE), the Bias and the %Bias:
( )
( )∑ --
∑ ---=
=
=n
ii
n
iii
yykn
yynR
1
21
2
adj2
)(
ˆ)1(1
(24)
( )
n
yyn
iii∑ -
= =1
2ˆRMSE (25)
( )
n
yyBias
n
iii∑
=
-= 1
ˆ (26)
100ˆ
%y
yyBias -= (27),
where: iy and iy are observed and pre-dicted values of the dependent variable (mean stem volume v for NTC and EHC and total stem volume V for EDC) on the ith plot, n is the sample size, k is the number of model parameters, y is the mean ob-
Fig. 1. Natural Thinning Curves sub-model.

T. Stankova and U. Diéguez-Aranda40
served and is the mean predicted value of the dependent variable.
We further assessed the predictive abilities of the models by considering the 95% confidence (CI), prediction (PI) and tolerance (TI) error intervals:
ntSBiasCI 975.0%95
(28)
(29)
for 95.011 (30),
where: S is the standard deviation of the errors, t0.975 is the 0.975 quantile of the t distribution with n–1 degrees of freedom, the function g (1–g, n, 1–a) is the tolerance factor tabulated for specified values of n, a and g and provides that the estimated interval will contain at least (1–g) 100 per-cent of the future error distribution with probability (1–a). The model bias was ad-ditionally assessed by linear regressions of observed against predicted values of the dependent variable and simultaneous F-test for line slope equals 1 and zero in-tercept (Gadow and Hui 1999).
Results
The principal sub-models of the SDMD were fitted with high level of determination (R2
adj above 0.9 for all three sub-models) and produced unbiased and statistically significant parameter estimates (Table
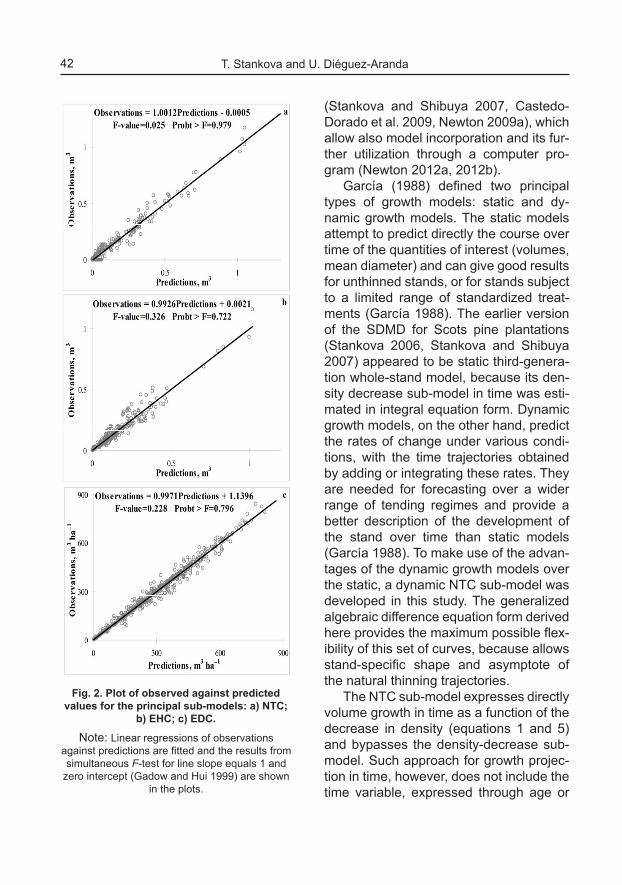
2). The %Bias, which indicates by how much the mean of the predictions devi-ates from the observed mean, obtained values of less than 1 % for all sub-models. The plots of the predictions against the observations, supported by the analyti-cal simultaneous F-test, which examines the null hypothesis that the regression line between them has slope equal to 1 and intercept equal to zero, confirmed the goodness-of-fit of the three principal sub-models (Figure 2).
Three sets of EHC were estimated, each of them corresponding to a different site index class (Figure 3) and designated by differing value of the exponent for pa-rameter B (equation 23), which obtained decreasing and statistically significant es-timates (Table 2). The slope parameter of the self-thinning asymptotes α had value of 1.74, while the intercept of the Full den-sity line was K = 333867.193.
Discussion
Considering the classification by Pretzsch (2009), the Stand Density Management Diagrams of this study can be categorized as a third generation whole-stand model. Pretzsch (2009) defines that the core el-ement of the third generation stand-level models consists of a biometric model in the form of a flexible system of mathemati-cal equations that are normally transferred to computer programs and predict stand development in relation to a specified management regime, site index and yield level. Although presented and utilized in the form of complex charts, which carry information on the spatial-temporal dy-namics of the principal stand-level growth and yield attributes, the SDMD are based on a system of mathematical relationships
1,1%95 ngSBiasTI
ntSBiasPI 11%95 975.0
y

Dynamic Third-Generation Whole-Stand... 41Ta
ble
2. G
oodn
ess-
of-fi
t est
imat
es fo
r the
prin
cipa
l sub
-mod
els
of th
e dy
nam
ic S
DM
D.
Not
e: *
– S
igni
fican
t at P
< 0
.05;
***
– S
igni
fican
t at P
< 0
.001
; a – R
MS
E a
nd B
ias
for N
TC a
nd E
HC
are
mea
sure
d in
m3 ;
whi
le fo
r the
ED
C in
m
3 ∙ha–1
; b – th
e ab
solu
te b
iase
s ar
e no
t sig
nific
antly
diff
eren
t fro
m z
ero.
Mode
l fit
Param
eter e
stima
tion
Error
inter
vals
Sub-
mode
l R2 ad
ja RM
SE
b Bias
Pe
rcent
bias,
% Gl
obal
param
eter
estim
ate
Stan
dard
err
or t-v
alue
Confi
denc
einte
rval
Pred
iction
inter
val
Toler
ance
inter
val
α 1.7
394
0.101
8 17
.092**
*
NTC
0.950
0.0
475
0.000
3 0.2
322
p 33
47.6
1518
.7 2.2
043*
–0.00
34
0.004
8 –0
.0693
0.0
708
–0.07
42
0.075
6
c 1 0.0
346
0.002
4 14
.585**
*
c 2 0.0
335
0.002
5 13
.159**
*
d 1 0.4
245
3.20×
10−7
1.3
3×10
6 ***
d 2 0.4
263
3.09×
10−7
1.3
8×10
6 ***
a 2 24
166
1.28×
10−5
1.8
8×10
9 ***
SI
16
3.312
2 0.1
028
32.22
8***
SI
20
3.295
0 0.1
064
30.96
4***
EHC
0.938
0.0
358
–0.00
11
0.871
3
b 2
SI
24
3.202
5 0.0
620
51.63
0***
–0.00
23
0.005
1 –0
.0686
0.0
714
–0.07
30
0.075
8
a 0.4
082
0.005
0 80
.8692
***
EDC
0.985
21
.116
–0.29
30
–0.05
68
c 1.6
764
0.086
6 19
.3472
***
–2.52
0.8
4 –4
2.33
40.64
–4
4.30
42.61
T. Stankova and U. Diéguez-Aranda42
(Stankova and Shibuya 2007, Castedo-Dorado et al. 2009, Newton 2009a), which allow also model incorporation and its fur-ther utilization through a computer pro-gram (Newton 2012a, 2012b).
García (1988) defined two principal types of growth models: static and dy-namic growth models. The static models attempt to predict directly the course over time of the quantities of interest (volumes, mean diameter) and can give good results for unthinned stands, or for stands subject to a limited range of standardized treat-ments (García 1988). The earlier version of the SDMD for Scots pine plantations (Stankova 2006, Stankova and Shibuya 2007) appeared to be static third-genera-tion whole-stand model, because its den-sity decrease sub-model in time was esti-mated in integral equation form. Dynamic growth models, on the other hand, predict the rates of change under various condi-tions, with the time trajectories obtained by adding or integrating these rates. They are needed for forecasting over a wider range of tending regimes and provide a better description of the development of the stand over time than static models (García 1988). To make use of the advan-tages of the dynamic growth models over the static, a dynamic NTC sub-model was developed in this study. The generalized algebraic difference equation form derived here provides the maximum possible flex-ibility of this set of curves, because allows stand-specific shape and asymptote of the natural thinning trajectories.
The NTC sub-model expresses directly volume growth in time as a function of the decrease in density (equations 1 and 5) and bypasses the density-decrease sub-model. Such approach for growth projec-tion in time, however, does not include the time variable, expressed through age or
Fig. 2. Plot of observed against predicted values for the principal sub-models: a) NTC;
b) EHC; c) EDC.
Note: Linear regressions of observations against predictions are fitted and the results from simultaneous F-test for line slope equals 1 and
zero intercept (Gadow and Hui 1999) are shown in the plots.
Dynamic Third-Generation Whole-Stand... 43
some measure of tree size that is itself a function of time. Thus, if no density de-crease occurs in the stand, which can be characteristic for the first (before the onset of the competition-induced mortality) and the last (the phase of growth-resources equilibrium) phases of stand growth, no alteration in the tree size with the progress of time can be predicted. This is not an is-sue for the Scots pine plantations, which are characterized by relatively high initial densities (over 1000 seedlings per hec-tare), where competition-induced mor-tality commences soon after plantation
establishment. However, in case of in-tensively grown plantations of low initial densities, which are managed at short rotation periods and practically do not un-dergo density-dependent mortality during their life span, this growth model would be inapplicable.
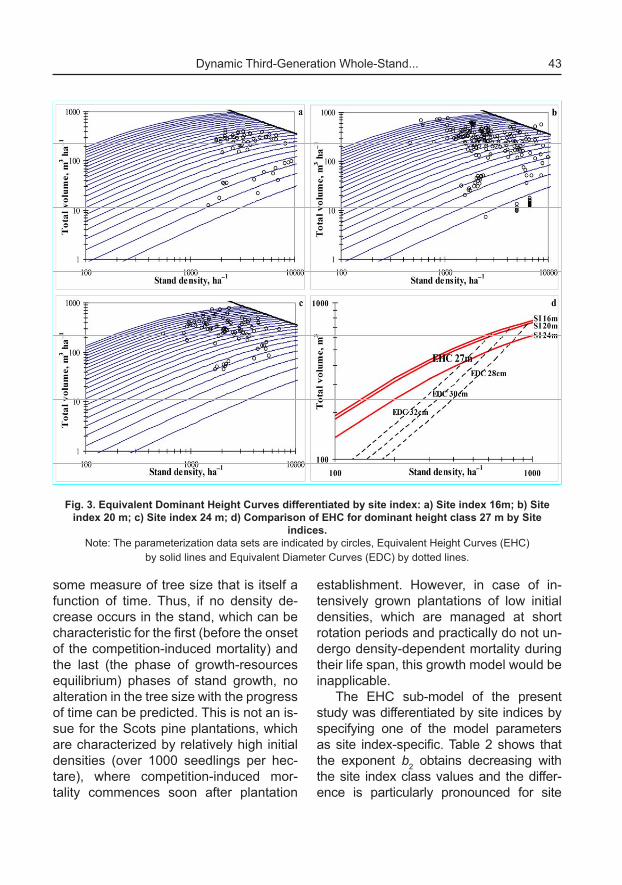
The EHC sub-model of the present study was differentiated by site indices by specifying one of the model parameters as site index-specific. Table 2 shows that the exponent b2 obtains decreasing with the site index class values and the differ-ence is particularly pronounced for site
Fig. 3. Equivalent Dominant Height Curves differentiated by site index: a) Site index 16m; b) Site index 20 m; c) Site index 24 m; d) Comparison of EHC for dominant height class 27 m by Site
indices.Note: The parameterization data sets are indicated by circles, Equivalent Height Curves (EHC)
by solid lines and Equivalent Diameter Curves (EDC) by dotted lines.

T. Stankova and U. Diéguez-Aranda44
index 24 m. Considering equation 16, this parameter trend suggests that mean and total stem volume will obtain lower values for higher site index for the same values of dominant height class and stand density, which is seen also in Figure 3. The same dominant height is attained at earlier age by more productive (high site index) stands than by stands of low growth potential from low quality forest sites. Consequently, the more advanced age for attainment of the same dominant height by stands of lower site index can be viewed as related to big-ger overall stem size, moreover the tem-poral trends of height and diameter differ. This explanation is supported by the as-sertion of Weck (sensu Assmann 1970) that a given stand height is accompanied by a given total increment which is higher the longer it takes the stand to reach this given height. In agreement with this state-ment, the total crop volume for a particular height (e.g. dominant stand height 27 m, Figure 3d) is expected to be larger if this height is reached at a later age, i.e. for the lower site quality classes (Figure 3d). Also, dominant height increment is insignificant-ly influenced by the process of thinning (natural or man-made) and consequently reflects merely the height growth trend of the dominant trees. The stand mean diam-eter growth, on the other hand, is a result of both the tree diameter growth and the mor-tality of thinner and weaker trees, which ar-tificially inflates the value of the mean stand diameter. Thus, the mean stand diameter can be expected to have steeper growth gradient than the stand dominant height. The differing mean stand diameter values as a possible explanation of the observed distinctions between the volumes of the EHC of different site indices is also easily derivable from the EDC sub-model (equa-tion 17) and is well illustrated on Figure 3d.
Indeed, the quadratic mean diameter es-timated for stands of the same dominant height class and stand density, but having lower site index value (16 or 20 m) exceeds by about 2 cm the mean diameter of the stands of higher site index value (Figure 3d). This finding agrees with the conclusion by Assmann (1970) that even in geographi-cally small regions, a uniform relationship of total volume on stand height cannot be assumed and the large observed differ-ences in the yield level are determined by differences in the basal area increment and the local basal area potential of the stands for a given mean height.
Conclusions
A new SDMD for Scots pine plantations was elaborated, which presents a dy-namic third-generation whole-stand growth model. The NTC sub-model was reformu-lated into dynamic equation form and was estimated over repeated measurements data from permanent sample plots, which allowed better description of the develop-ment of the stands over time as compared to the former static SDMD. The EHC sub-model was reformulated to include a site index-specific parameter, which produced SDMDs differentiated by site index classes that added to the model precision and as-sured its improved predictability. The newly elaborated dynamic SDMD is applicable for estimation of the stand-level growth pa-rameters at any stand growth stage and for simulation of alternative thinning regimes in accordance with a preferred manage-ment objective, with projection of the future stand growth and evaluation of the interme-diate and total harvest. Incorporation of the model into software is planned to facilitate its implementation as a management tool.

Dynamic Third-Generation Whole-Stand... 45
Acknowledgements
We are grateful to the Forest Research Institute of the Bulgarian Academy of Sciences, who made available, through the research reports and theses of its pos-session, some of the data from Scots pine plantations used in this study. This work was financially supported by the Marie Curie Intra-European Fellowship Project within the 7th European Community Framework Programme: “Elaboration of advanced-level models for density man-agement of coniferous and broadleaved even-aged natural stands and plantations in Europe” (PIEF-GA-2009-235039), con-ducted at the University of Santiago de Compostela, Spain.
References
AssmAnn E. 1970. The principles of forest yield study. Pergamon Press, Oxford. 506 p.
CAstEdo-dorAdo F., CrECEntE-CAmpo F., ÁlvArEz-ÁlvArEz p., BArrio-AntA m. 2009. Development of a stand density management diagram for radiata pine stands including assessment of stand stability. Forestry 82: 1–16. doi:10.1093/forestry/cpm032
CiEszEwski C.J., HArrison m., mArtin s.w. 2000. Practical methods for estimating non-biased parameters in self-referencing growth and yield models. University of Georgia PMRC-TR 2000-7. 12 p.
GAdow k.v., Hui G. 1999. Modelling Forest Development. Kluwer Academic Publishers, Dordreht, The Netherlands, 213 p.
GArCíA o. 1988. Growth modelling – A (re)view. New Zealand Forestry 33(3): 14–17.
GrEGoirE t.G. 1987. Generalized error structure for forestry yield models. Forest Science 33: 423–444.
HAGiHArA A. 2000. Time-trajectory of mean plant mass and density. Bulletin of the Faculty of Science, University of the Ryukyus 70: 99–112.
krAstAnov k., BElyAkov p., sHikov k. 1980. Dependencies in the structure, growth and productivity of the Scots pine plantations and thinning activities in them. Research report. Forest Research Institute of BAS, Sofia. 232 p. (in Bulgarian).
krAstAnov k., BElyAkov p., sHikov k. 1983. Volume and assortment tables for Scots pine plantations. In: Nedyalkov S., Rashkov R., Tashkov R. (eds) Reference book in dedrobiometry. Zemizdat, Sofia: 57–69 (in Bulgarian).
lonG J.s., Ervin l.H. 2000. Using Heteroscedasticity Consistent Standard Errors in the Linear Regression Models. The American Statistician 54: 217–224.
nEwton p. 2009a. Development of an integrated decision-support model for density management within jack pine stand-types. Ecol. Model. 220: 3301–3324.
nEwton p. 2009b. Stand Density Management Diagrams. http://www.scitopics.com/Stand_Density_Management_Diagrams.html#biblio. Archived topic page last updated on 3 November 2009.
nEwton p.F. 2012a. A silvicultural decision-support algorithm for density regulation within peatland black spruce stands. Computers and Electronics in Agriculture 80: 115–125. doi:10.1016/j.compag.2011.10.012
nEwton p.F. 2012b. A decision-support system for forest density management within upland black spruce stand-types. Environmental Modelling & Software 35: 171–187. doi:10.1016/j.envsoft.2012.02.019
prEtzsCH H. 2009. Forest Dynamics, Growth and Yield. From Measurement to Model. Springer-Verlag Berlin Heidelberg. 664 p. e-ISBN 978-3-540-88307-4.
sHiBuyA m. 1995. A simple and practical model for mean size-density trajectories of tree stands. Journal of the Japanese Forest Society 77: 247–253.
sHiBuyA m., yAJimA t., mAtsudA k. 1997. A modified stand density control diagram for Japanese white birch based on a trend of mean volume-density relationships with stand growth. Research Bulletin of the Hokkaido University Forests 54: 202–211.

T. Stankova and U. Diéguez-Aranda46
stAnkovA t. 2004. A model of Stand Density Control Diagram for Scotch pine plantations in Rila mountain. Nauka za gorata 2: 29–55 (In Bulgarian with English summary).
stAnkovA t. 2006. Possibilities for density optimization of Scots pine and Austrian black pine plantations by mathematical models. PhD-thesis, Forest Research Institute of BAS, Sofia, Bulgaria, 168 p. (In Bulgarian with extended summaries in English (35 p.)).
stAnkovA t. 2007. Verification of the density control models for Scots pine plantations. I. Natural thinning curves. Nauka za gorata 4: 31–45 (In Bulgarian with English summary).
stAnkovA t., diéGuEz-ArAndA u. 2012. A tentative dynamic site index model for Scots pine (Pinus sylvestris L.) plantations in Bulgaria. Silva Balcanica 13(1): 5–19.
stAnkovA t., pEtrin r. 2008. Verification of the density control models for Scots pine plantations. II. Equivalent height curves. Nauka za gorata 1: 17–31 (In Bulgarian with English summary).
stAnkovA t., sHiBuyA m. 2007. Stand Density Control Diagrams for Scots pine and Austrian black pine plantations in Bulgaria. New Forests 34(2): 123–141.
stAnkovA t., stAnkov H., sHiBuyA m. 2006. Mean-dominant height relationships for Scotch pine and Austrian black pine plantations Bulgaria. Ecological Engineering and Environment Protection 2: 59–66.
tAdAki y. 1964. Effect of thinning on stem volume yield studied with competition-density effect. On the case of Pinus densifolra. Bulletin of the Government Forest Experiment Station, Tokyo 166: 1–22 (in Japanese with English summary).
vAnClAy J.k. 1994. Modelling forest growth and yield. Applications to mixed tropical stands. CAB International, Wallingford, UK, 312 p.
wEiskittEl A., Gould p., tEmEsGEn H. 2009. Sources of Variation in the Self-Thinning Boundary line for Three Species with Varying Levels of Shade Tolerance. Forest Science 55(1): 84–93.