Ductile strain rate measurements document long-term strain ...
:-,- ..111111111111111111111111111111111111111111111111111111111111III1
3 9080 02993 0705
V393.R467
NAVY DEPARTMENTDAVID TAYLDR MODEL BASIN
WASHINGTON, D. o.
DYNAMIC STRAIN MEASUREMENTS IN THECRANKSHAFT OF A DIESEL ENGINE
by
W.F. Curtis
October 1943 Report R-154
DAVID TAYLDR MODEL BASIN
Rear Admiral H.S. Howard, USNDIRECTOR
Commander R.B. Lair, USNNAVAL ARCHITECTURE
K.E. Schoenherr, Dr.Eng.HEAD NAVAL ARCHITECT
M.C. RoemerASSOCIATE EDITOR
PERSONNEL
Captain H.E. Saunders, USITECHlfiCAL DIRECtOR
Captain W.P. Roop, USNSTRUC'l'URAL MECHANICS
D.F. Wlndenburg, Ph.D.HEAD PHYSICIST
The tests were conducted by I.F. Curtis, F.B. Bryant, and L.E. Wedding, ofthe David Taylor Model Basin staff, with the assistance of the Internal CombustionEngine Laboratory of the Engineering Experiment Station. The report was written byI.F. Curtis.
RESTRICTED
DYNM4IC STRAIN MEASUREMENTS IN THE CRANKSHAFT
OF A DIESEL ENGINE
ABSTRACTAlternating strains in the crankshaft of a 2000-HP Fairbanks-Morse diesel
engine were measured by six electrical-resistance strain gages attached to the web ofthe crankshaft which was nearest the load and hence was subjected to the higheststress. Measurements were made at a series of speeds and loads up to rated load, bothwith and without torsional dampers on the crankshaft. The rated load without damperswas 1200 BP at 720 RPM; with dampers it was 2000 BP at 900 RPM.
The maximum measured strain was 318 x 10-6 inches per inch peak single amplitude; it occurred at 720 RPM with full load, while operating without dampers. Themaximum strain measured while operating with dampers was 115 x 10-6
, expressed in thesame units. This occurred at 400 RPM, the ninth-order torsional critical speed, whichwas not compensated by the dampers used. The maximum available power at this speedcorresponded to only about 10 per cent of full-load torque. The alternating strainmeasured at full load with dampers was 48.7 x 10- 6 inches per inch peak single amplitude.
INTRODUCTION
Because of failures in the cast-iron crankshafts of 2000-HP Fairbanks-Morse9-cylinder diesel engines in service, the Bureau of Ships directed the EngineeringExperiment Station at Annapolis to make a study of the circumstances surrounding thesefailures and an analysis of the engineering features involved.
A metallurgical examination of the fractured shaft of one engine, as shownin Figure 1, indicated (1)* that the initial fracture occurred at a point on the sideof one web of Crank 9, about halfway between the crankpin center and the shaft center,on the face of the web toward the crank.
Following this examination, the Engineering Experiment Station undertook avibration analysis of an intact engine of the same size and type. It was found thatthe rotating system had a principal natural frequency of 3600 cycles per minute** andthat the torsional oscillations of largest amplitude were the ninth-order oscillation,400 RPM, the fifth-order oscillation, 720 RPM, and the fourth-order oscillation, 900RPM. The ninth-order oscillation, though quite strong, was of no practical importancebecause it is below the useful speed range. The eighth, seventh, and sixth orderswere of insignificant amplitude. The Engineering Experiment Station therefore designed and installed pendulum dampers to neutralize the fourth- and fifth-order torsionaloscillations.
* Numbers in parentheses indicate references on page 12 of this report.
** The figures given here are for the engine system after installation of the spider for supportingthe damper pendulums. This spider remained in place throughout the test.

2
r--------:-:---~__:::_-;-------------------~-.
CrankshaftEnd
Figure 1 - Photograph of Break in Engine End Web of Crank 9· on 2000-HPDiesel Engine Generator Set, Looking Away from ~nerator
The initial fracture occurred at the point marked 1;this was assumed to be the region of maximum stress.
In accoroance with a directive from the Bureau of Ships (2) the David TaylorModel Basin measured dynamic strains in the crankshaft during operation of the intactengine at the Engineering Experiment Statiorr. The purpose of the test was to make afurther study of the possible causes of crankshaft failures in similar engines.
As indicated in-Figure 2, the engine had 9 cylinders, and was connected di. rectly to an electric generator adjacent to Cylinder 9.
The main bearing between 'Crank 9 and the gen~rator takes all the end thruston· the. crankshaft.
GENERAL CONSIDERATIONSA brief study of the forces involved will indicate that Crank 9, next to
the load, is the most heavily loaded of all the cranks. A further study will mdicate

3
Web 9 G, to which gageswere attached on test engine
Web 9 E , which brokeon previous engines
Generator
Wires for connecting gages to sliprings led through this hollow'shaft
7654
Engine
32
Figure 2 - Schematic Diagram of Engine, showing Location of Crank WebsThe web on the engine end of Crank 9 is designated as Web 9E, and that on the generator end as9G. The photograph in Figure 1 is of the inboard or crank side of Web 9E on a similar engine.
that Web 9G, next to the generator, is the most heavily loaded of the two webs ofCrank 9.
The fact that the fractures in service had all occurred in Web 9E could beaccounted for by systematic defects in the crankshaft castings or by the fact thatthe cross-sectional area of Web 9E was slightly less than that of Web 9G.
Because of practical difficulties strain gages could not be mounted on theWeb 9E of the engine under test, in the regions where the service fractures occurred,so all further consideration of forces and stresses had to be devoted to Web 9G, nextto the generator.
As shown in the schematic dia- A·P
gram of Figure 3, Web 9G is loaded asfollows:
1. A bending moment Tg • 8/2 in theweb, bending the web about an axis parallel to the centerline of the crankshaft.This moment is caused by the cumulativeeffect of the torques of all 9 cylinders,i.e., the circumferential components ofthe forces exerted by the 9 connectingrods.
2. A variable compression A· P in
the web, 'due to the radial compone~t ofthe force exerted by Connecting Rod 9.
3. A bending moment t. 8/2 in theweb, bending the web about an axis perpendicular to the shaft centerline. This
Figure 3 - Schematic Diagram of Web 9G
Here T9 may be taken as the force on Web 9G causingrotation of the load, 8/2 as half of the stroke 8,A as the area of Cylinder 9, P as tIe unit pressurein Cylinder 9, Ts as the torque transmitted fromCylinders 1 to 8 inclusive, t as the end thrust onthe crankshaft, and C as the length of the crankpin.

",'11"1 .1'111111111.1111111111'1'11'11,11,111111111'1'111111I'1111"1111'1'1111111'11,"1'1111"11",
4
moment is the resultant of two moments, one arising from any misalignment of thecrankshaft and the other from the endwise or thrust components of the forces of all9 connecting rods.
4. A twisting moment Ts ' C in the web, deforming it about an axis perpendicu-lar to the shaft centerline and intersecting both the shaft centerline and the crankpin centerline, due to the cumulative circumferential force from Cylinders 1 to 8inclusive, applied to the engine end of Crankpin 9.
The web resists the torsional or T9
• S/2-type stress as a cantilever beamwith the line joining the centers of the journal and the crankpin as a neutral axis.Stress of this type is greater at increasing distances from the line of centers.
The direct compression or A.P-type stress is distributed r~ther more evenly, but there is probably a maximum stress in the area directly between the journaland the crankpin. The stress concentration is particularly high close to the journaland to the crankpin.
The web also resists the bending-type stress, t. S /2, as a cantilever beam,but the direction of flexure is at right angles to that in the torsional case. Thebending stresses are compressional on the ~vailable or inboard face of Web 9G.
The twisting moment Ts' C produces quite complicated shearing stresses inthe web. These in turn produce tensile and compressive stresses in the face which arenot parallel to the line of centers. These stresses increase with increasing distancefrom the line of centers.
Of course concentration of all types of stress occurs in the fillets, butthe surface there was too rough to permit installation of strain gages.
TEST APPARATUSThe conditions of the test required a remote-reading strain gage of small
dimensions and good frequency response, capable of rotating with the shaft and adaptable to reading at a distant point. The only known gage which satisfied these requirements was the electrical wire-resistance gage.
Previous to this test it was not certain that the cements ordinarily usedfor securing the wire-resistance gage to the surface under test would withstand theoperating temperature and the exposure to oil, so preliminary experiments were conducted* to settle this point.
* Four types of cement had previously been used for attaching these gages: Bakelite cement, DucoHousehold Cement, air~g Glyptol, and oven~ Glyptol. Duco Household Cement is a commonlyused plastic-base adhesive manufactured by DuPont. Glyptol is a trade name for a class of oilresistant, insulating, adhesive varnisres manufactured by the General Electric Company. Bakelitecement was discarded at the outset as it was known to be attacked by mineral oil. Protective coatings of both Duco and Glyptol were also considered. The range of temperatures investigated was from75 degrees to 200 degrees Fahrenheit. The temperature anticipated at the gage location in the engine was 150 degrees Fahrenheit. No evidence of actual failure of any cement was found; evidence ofplasti:c flow in the cement was inconclusive although the strain cycle employed was long, lasting 2to 3 minutes. Strain measurements at high temperatures can be in error due to changes in the gageconstant with temperature or to some other cause.

---------- III.jl~l~ihilii IIIIIIIIIIIII~M___
5
The most convenient combination employed Duco cement to secure the gage,and a coating of Glyptol to protect it. With this combination the range of uncertainty in the measured strain, under the rather difficult conditions encountered, wasplus 10 per cent and minus 20 per cent, and the most probable error was minus 10 percent of the alternating strains measured. Results with other combinations were thesame within the limits of experimental error.
This degree of uncertainty in the alternating stresses was felt to betolerable in view of the purpose of the measurement and the fact that no superiormethod was available. All other sources of error were negligible by comparison withthis one.
LOCATION OF GAGES
It was at first proposed to mount several strain gages at selected points
on the inside surface of Web 9E; the location of the crack, Figure 1, gave some indication of the location of the maximum stresses. However, this scheme involved runningconnecting wires from Web 9E to Web 9G of Crank 9, and the connecting wires would havehad to run unsupported for a distance equal to the width of the connecting-rod bearing.Windage and vibration would have been very likely to break the wires or damage thegages to which they were connected.
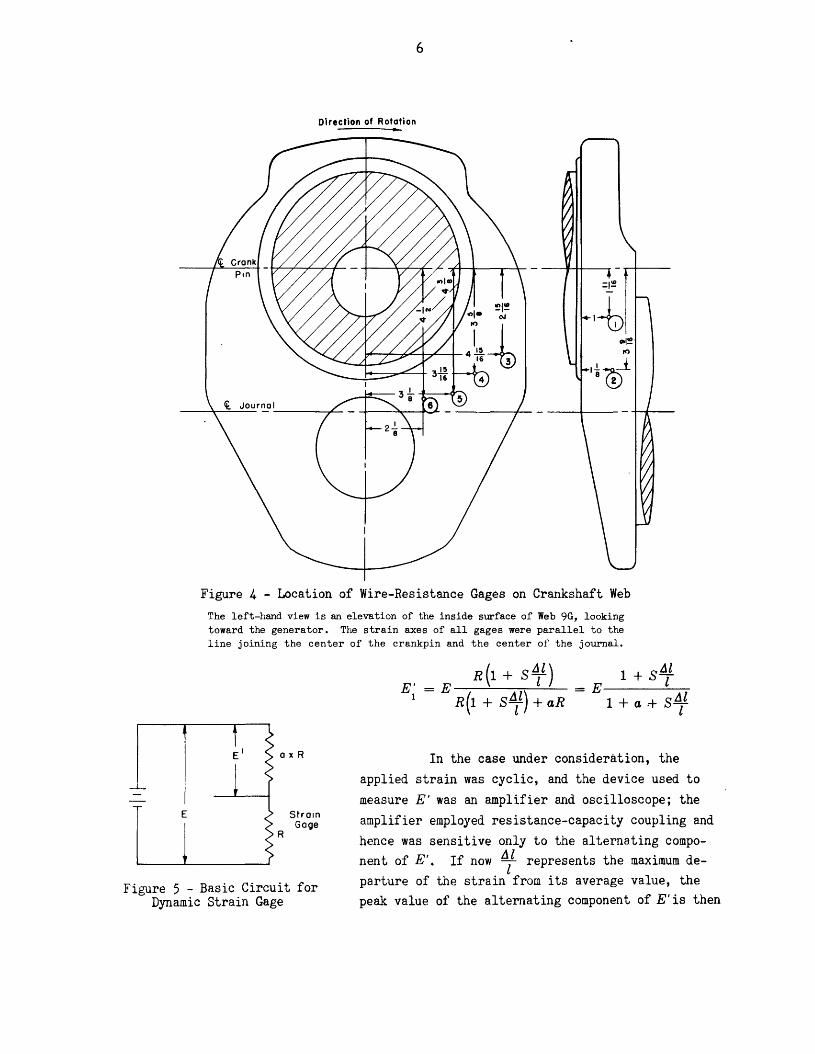
Clearances did not permit installing gages on the web face nearest the generator, consequently the gages were installed on the inside face of the web nearestthe crank pin. Two gages were also installed on the edge of the web; see Figure 4.
It was intended to locate the gages at points corresponding to points alongthe fracture; however, an error in transferring the points from Web 9E to Web 9G displaced some of them from their best positions.
As the direction of maximum stress at each point was unknown, the gageswere mounted with their axes parallel to the line joining the crankpin and journalcenters.
ELECTRICAL DISTANT-BEADING GEAR FOR THE DYNAMIC STRAIN GAGEA schematic diagram of the basic strain gage circuit used is shown in
Figure 5. Here the upper resistor a x R represents an inactive load resistor and thelower resistor R represents the strain gage. When the gage is not subjected to anyapplied strain,
E' = E RR + aR
El+a
When a strain ~l is applied to the gage, the resistance of the gage becomes R(1 + S~l)where S is the "gage constant." This results in a new value of E', namely,
6
Direction of Rotation
Figure 4 - Location of Wire-Resistance Gages on Crmlkshaft Web
The left-hand view is an elevation of the inside surface of Web 9G, lookingtoward the generator. The strain axes of all gages were parallel to theline joining the center of the crankpin and the center of the journal.
E'1
E R(l + S¥)R(l + StJ/) + aR
1 + StJlE l
1 + a :+ S1l
Figure 5 - Basic Circuit forDynamic Strain Gage
E
axR
StrainGage
R
In the case under consideration, theapplied strain was cyclic, and the device used tomeasure E' was an amplifier and oscilloscope; the
amplifier employed resistance-capacity coupling andhence was sensitive only to the alternating component of E'. If now tJ/ represents the maximum departure of the strain from its average value, thepeak value of the alternating component of E'is then

7
1 + a + SJ1l + aS J1l - 1 - aE l l
(1 + a + S~l)(1 + a)
SJ1ll
The approximation involved in the last expression is the result of neglecting S~l in
comparison with 1+ a and is amply justified in practical cases.
Calibrati~n was effected by a standard signal generator,* which, in accord
ance with usual practice, was calibrated in RMS volts. If eo RMS volts are required
to produce a deflection of 1 inch on the oscillograph, and if the gage circuit pro
duces 11 inches single deflection, then, remembering that eo RIIS volts = 1.414 eo peak
volts,
J1l =l
1.414 eo(l + a)2
aSE 1/1
The constants used were E= 6 volts, a = 1, S = 2.0, whence ~l = 0.472 eo 111
•
A schematic diagram of the circuit arrangements used is given in Figure 6;this diagram is largely self-explanatory.
The mercury slip rings shown in this diagram and indicated in Figure 2 con
sisted of stainless steel rings mounted on an insulating sleeve at the end of the
Plug Terminal Boardin Hollow Crankshaft
1Extra Gages substituted for those
e-J~~------ shown connectedto measuring circuit as occasion....,""ry----- requi red.
Gages cemented oncrankshaft web
Battery, Load Resistorsand Terminal Board, inHollow Generator Shaft
1:..-.-These wires spliced to-~gether at end of generator shaft to completebattery circuit duringopera ti ons.
StandardSignal
Generator
AmplifierCathode-Roy
Oscillograph
Figure 6 - Circuit for Observations on Three Strain Gagesas used on Diesel Engine Crankshaft
* The standard signal generator used in this test consisted of a low-power, audio-frequency oscillatormanufactured qy the Taylor Model Basin and a nmicrovolter,n i.e., a rectifier-type voltmeter and calibrated attenuator manufactured b,y the General Radio Company.

8
generator shaft. These rings dipped into pools of mercury contained in deep groovesin a block of insulating material which was held fixed with reference to the generatorframe. Stainless steel electrodes in the mercury pools were connected to the amplifier as shown in Figure 6. The slip-ring assembly used was originally built for useon a different project (3) and contained four rings. This made it possible to observeonly three of the six gages during anyone test; to change to other gages it was necessary to stop the engine and change connections on the crankshaft.
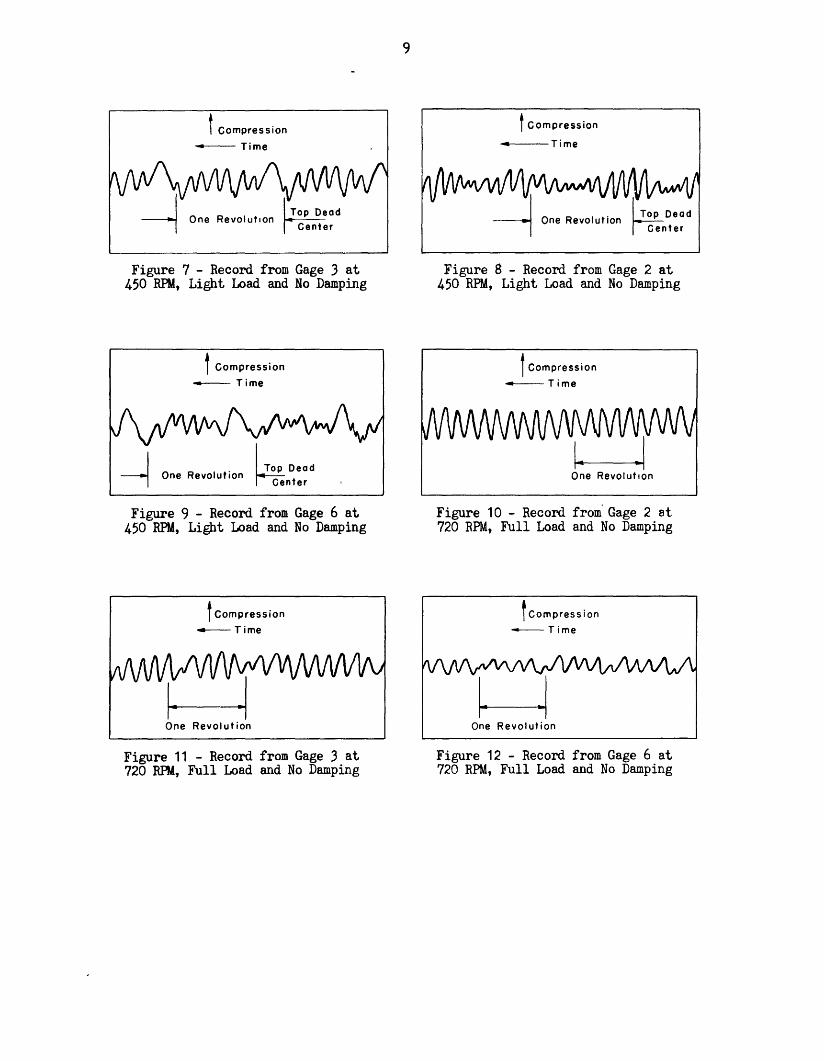
In addition to the apparatus shown in Figure 6, a contactor mounted on thegenerator shaft was arranged to .short-circuit the amplifier input momentarily at theinstant Piston 9 was at its top dead center; see Figure 2. This produced a sharp excursion of the oscilloscope beam which indicated the phase of the alternating strainsrelative to the position of the crankshaft. This excursion was very prominent on theoscilloscope screen when it was observed visually, but the rate of travel of the beamwas so great that the excursion did not register on the film when the oscilloscopepattern was photographed. The contactor did produce a slight break in the recordedtrace, however, which was located with the help of notes made during the test. As anaid to reading the oscillograms, the positions thus located have been marked on theprints manually; see Figures 7 to 12. The recorded trace on the remaining oscillograms was so faint that the location of the dead-center point was uncertain.
The oscillograms were made by photographing the oscilloscope screen with amoving-film camera made by removing the intermittent-motion mechanism and shutter froma commercial moving-picture camera. Since the photographs lacked sufficient contrast,they were traced in ink for reproduction in this report.
TEST RESULTSAll measured values of strain and the conditions under which they were ob
tained are given in Table 1. The principal results are shown graphically in Figures13 to 15.
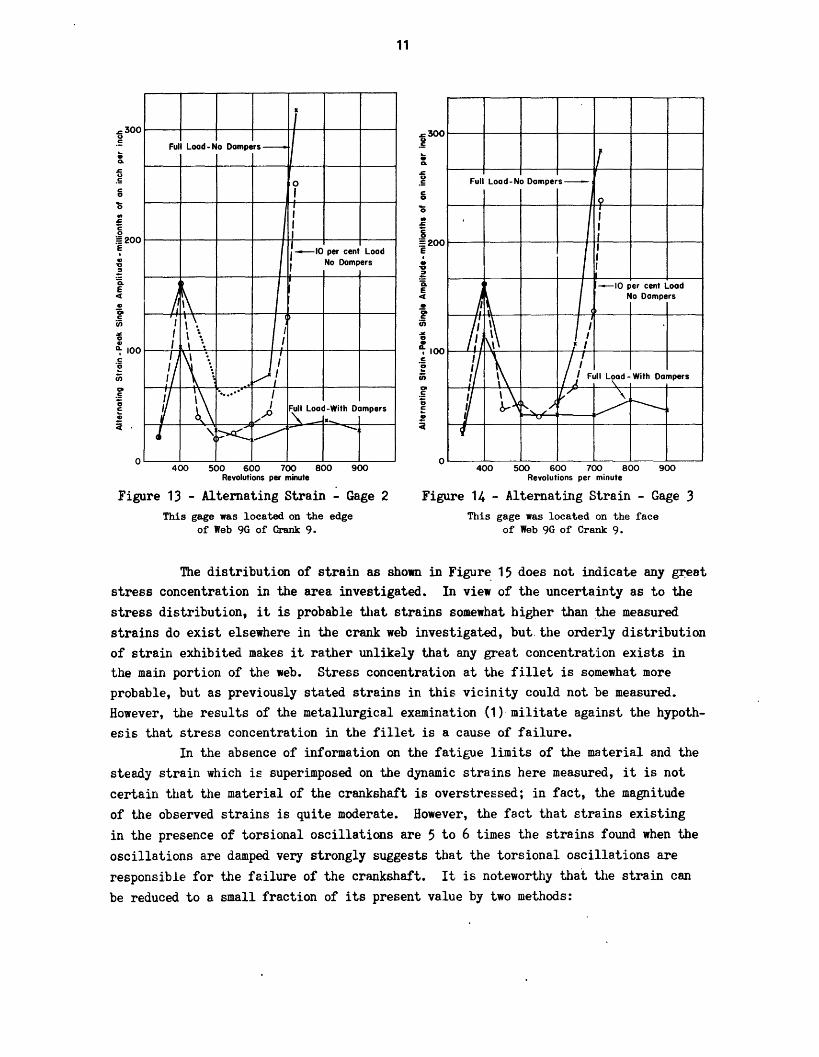
DISCUSSION OF RESULTSBearing in mind that the engine system has torsional critical speeds at
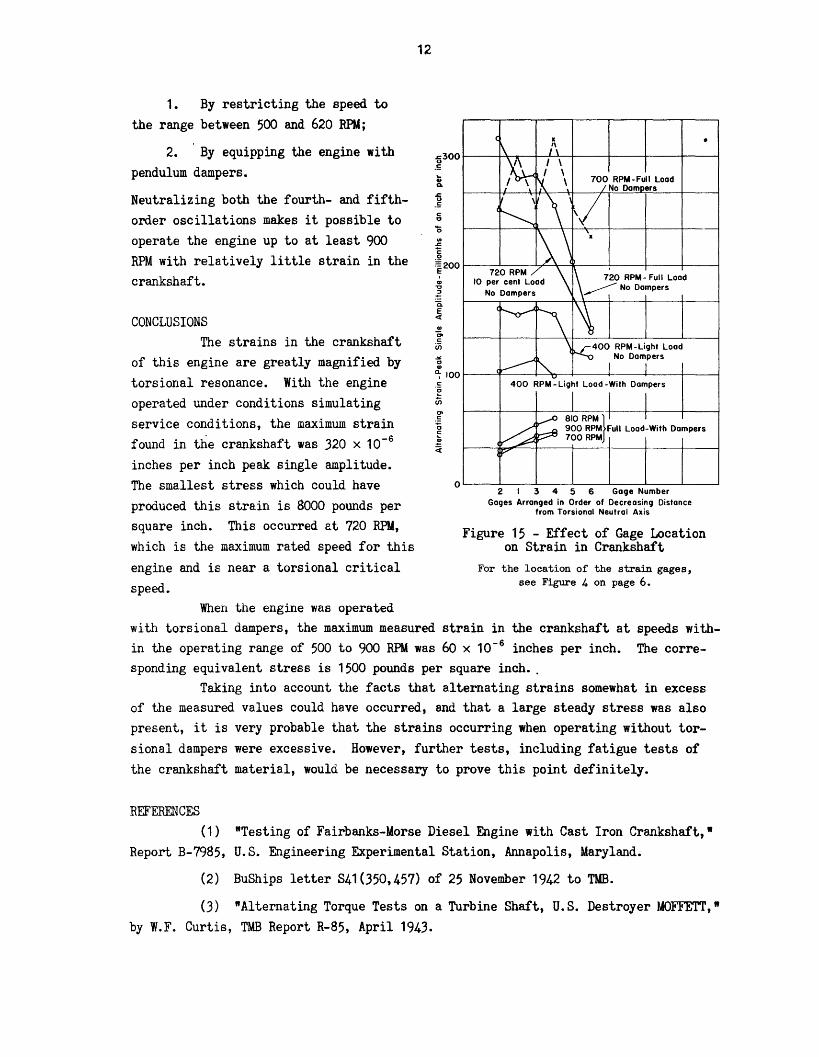
400, 720, and 900 RPM, and that the 720 and 900 RPM vibrations are neutraM.zed by thedampers, the experimental results can be readily explained. It is obvious from Figures 13 and 14 that strains of large amplitude are primarily the result of torsionaloscillations. This is most strikingly shown by the fact that at 720 RPM, the strainunder 10 per cent load with no dampers is about five times the strain under full loadwith the dampers in place. At 400 RPM high strains were found in all tests; this isin accordance with expectations as the dampers did not neutralize the ninth-orderoscillation. Figure 15 shows that the strain decreases with decreasing distance fromthe torsional neutral axis, which at once suggests that the principal strain arises
t Compression
--- Time
---------------_1__.'.1111111111111111'"""
9
tCompression
• Time
Figure 7 - Record from Gage 3 at450 RPM, Light Load and No Damping
tCompression
--Time
~ . ~OP DeadOne Revolution fCen er
Figure 9 - Record from Gage 6 at450 RPM, Light Load and No Damping
tCompression
-Time
~One Revol ut ion
Figure 11 - Record from Gage 3 at720 RPM, Full Load and No Damping
Figure 8 - Record from Gage 2 at450 RPM, Light Load and No Damping
tCompression
----- Time
Figure 10 - Record from' Gage 2 at.720 RPM, Full Load and No Damping
tCompress ion
-Time
One Revolution
Figure 12 - Record from Gage 6 at720 RPM, Full Load and No Damping

10
TABLE 1
Alternating Strain Data from Test of Fairbanks-Morse 2000-HP Engine
External Strain in parts per million, Peak Single AmplitudeRPM Load
HP Gage 1 Gage 2 Gage 3 Gage 4 Gage 5 Gage 6
Damper weights removed - light load
340 0 22 23 29 28 14 29400 77 162 162 117450 95 40 47 36500 104 20 54 54
'550 111 26 40 40600 120 34 53 53650 131 44 68 68700 155 131 137 108
I
720 160 252 238 140approx
Damper weights removed - load simulating service conditions
400 333 146 162 162 146 122 *600
.1195 45 71 52 58 41 *
650 1320 63 78 104 105 73 *700 1552 302 255 255 318 255 228720 1595 282 318 285 257 205 142
Damper weights replaced - full load
340 0 23 26 27400 266 104 116 99500 870 28 41 37600 1200 19 42 38700 1580 31 40 47810 1600 40 55 61900 2020 28 45 49
* The gage could not be read because of poor contact.
from torsion. While the correlation between strain and distance from the axis is notperfect, the observed tendency supports the view that the strain due to torsion exceeds the strain due to the web-twisting moment Tg x C except at full load with dampers. Both torsion and the web-twisting moment are affected by torsional oscillation.
400 500 600 700 800 900Revolutions per minute
.&:300u.~
~Q.
a.5ca
o..&:g~200EI
U'l:I
£Ci.E<u00cin.z.au~ 100c-~
u;01.5'0Eu
a
o
11
i,Full Load - No Dampers-
0,,IIII,-10 per cent LoadI No Dampers
A~I I \
C~
I \ 0\
I /I \ \.
II\\,
.~/
Y ~\....... I
I F~ Load-With Dampers
",P
Il_
l \><:.~:- '""',
400 500 600 700 800 900Revolutions per minute
.&:300j...•Q.
.&:U.5ca
o•.&:
1200E
o
IIFull Load-No Dampers--
I 0
I iI
, II
IlIt
I-10 per cent Load
J~No Dampers
IiiI\~ IIff \ /1J Full L~ad - With Dampers
1 ~\ ......... ,,/1f,,/~-----v
'I
Figure 13 - Alternating Strain - Gage 2This gage was located on the edge
of Web 9G of Crank 9.
Figure 14 - Alternating Strain - Gage 3This gage was located on the face
of Web 9G of Crank 9.
The distribution of strain as shown in Figure, 15 does not indicate any ~eat
stress concentration in the area investigated. In view of the uncertainty as to thestress distribution, it is probable that strains somewhat higher than :the measuredstrains do exist elsewhere in the crank web investigated, but. the orderly distributionof strain exhibited makes it rather unlikaly that any great concentration exists inthe main portion of the web. Stress concentration at the fillet is somewhat moreprobable, but as previously stated strains in this vicinity could not be measured.However, the results of the metallurgical examination (1)'militate against the hypothesis that stress concentration in the fillet is a cause of failure.
In the absence of information on the fatigue limits of the material and thesteady strain which is superimposed on the dynamic strains here measured, it is notcertain that the material of the crankshaft is overstressed; in fact, the magnitudeof the observed strains is quite moderate. However, the fact that strains existingin the presence of torsional oscillations are 5 to 6 times the strains found when theoscillations are damped very strongly suggests that the torsional oscillations areresponsible for the failure of the crankshaft. It is noteworthy that the strain canbe reduced to a small fraction of its present value by two methods:
1. By restricting the speed tothe range between 500 and 620 RPM;
2. By equipping the engine withpendulum dampers.
Neutralizing both the fourth- and fifthorder oscillations makes it possible tooperate the engine up to at least 900RPM with relatively little strain in thecrankshaft.
CONCLUSIONSThe strains in the crankshaft
of this engine are greatly magnified bytorsional resonance. Willl the engineoperated under conditions simulatingservice conditions, the maximum strainfound in the crankshaft was 320 x 10-6
inches per inch peak single amplitude.The smallest stress which could haveproduced this strain is 8000 pounds persquare inch. This occurred at 720 RPM,which is the maximum rated speed for thisengine and is near a torsional criticalspeed.
12
~300u
-=UQ.
~u.~
c.,~
<II
=c.2~200
Q)
~Q.E«
~
oQ)
~ 100c.~
iii
o
C II •\ i\
~, \, \
I \ ~ \ 700 RPM - Full LoadI \ /No Dampers
\ \"\/(~
\\ 'II
720 RPM \ \ 7'00 RPM - Foil Lood10 per cent Load~No Dampers
No Dampers
(~ ......
\ \\~400 RPM-Light Load
~"No Dampers
I I400 RPM'.:: Light Load -With Dampers
I I I
~....-..0 810 RPMr Ip 900 RPM Full Load-With Dampers
700 RPM
P
2 I 3 4 5 6 Gage NumberGages Arranged in Order of Decreasing Distance
from Torsional Neutral Axis
Figure 15 - Effect of Gage Locationon Strain in Crankshaft
For the location of the strain gages,see Figure 4 on page 6.
When the engine was operatedwith torsional dampers, the maximum measured strain in the crankshaft at speeds within the operating range of 500 to 900 RPM was 60 x 10-6 inches per inch. The corresponding equivalent stress is 1500 pounds per square inch•.
Taking into account the facts that alternating strains somewhat in excessof the measured values could have occurred, and that a large steady stress was alsopresent, it is very probable that the strains occurring when operating without torsional dampers were excessive. However, further tests, including fatigue tests ofthe crankshaft material, would be necessary to prove this point definitely.
REFERENCES(1) "Testing of Fairbanks-Morse Diesel Engine with Cast Iron Crankshaft,"
Report B-7985, U.S. Engineering Experimental Station, Annapolis, Maryland.
(2) BuShips letter S41(350,457) of 25 November 1942 to TMB.
(3) "Alternating Torque Tests on a Turbine Shaft, U.S. Destroyer MOFFE'M',"by W.F. Curtis, TMB Report R-85, April 1943.

I .
:-.-
1\11\ 1\\\\ \\\\1 \\ \\\\\\ \111 \11 1\\1 \1\\ 11\ \\\1\\ \\ \\1\11 \\11 1111\3 9080 02993 0705