DYNAMIC CONDITIONAL CORRELATION : ECONOMETRIC RESULTS AND FINANCIAL APPLICATIONS Robert Engle New...
85
DYNAMIC CONDITIONAL DYNAMIC CONDITIONAL CORRELATION : CORRELATION : ECONOMETRIC RESULTS ECONOMETRIC RESULTS AND FINANCIAL AND FINANCIAL APPLICATIONS APPLICATIONS Robert Engle Robert Engle New York University New York University Prepared for Prepared for CARLOS III, MAY 24, 2004 CARLOS III, MAY 24, 2004
-
date post
19-Dec-2015 -
Category
Documents
-
view
229 -
download
0
Transcript of DYNAMIC CONDITIONAL CORRELATION : ECONOMETRIC RESULTS AND FINANCIAL APPLICATIONS Robert Engle New...
DYNAMIC CONDITIONAL DYNAMIC CONDITIONAL CORRELATION : CORRELATION :
ECONOMETRIC RESULTS ECONOMETRIC RESULTS AND FINANCIAL AND FINANCIAL APPLICATIONSAPPLICATIONS
Robert EngleRobert EngleNew York UniversityNew York University
Prepared forPrepared for CARLOS III, MAY 24, 2004CARLOS III, MAY 24, 2004

ABSTRACTABSTRACT
A new model for measuring and predicting correlations as well as volatilities is examined. This Dynamic Conditional Correlation model or DCC, models the volatilities and correlations in two steps. The specification of the correlation dynamics is extended to allow asymmetries important for financial practice. The presentation develops the econometric methods for estimating the DCC model.
The DCC provides a joint density function with tail dependence greater than the normal. This is explored both by simulation and empirically. The time aggregated DCC is presented as a useful copula for financial decision making.
As an example, a covariance matrix is estimated between 34 country equity and bond returns. The role of asymmetry is examined in both volatilities and correlations. The dispersion of equity and bond volatilities and their pairwise correlations are examined over time and after the formation of the EURO.

OUTLINEOUTLINE
WHAT IS DCC?WHAT IS DCC? ESTIMATION THEORYESTIMATION THEORY
TWO STEPTWO STEP QMLE QMLE STANDARD ERRORSSTANDARD ERRORS
BEYOND LINEAR DEPENDENCEBEYOND LINEAR DEPENDENCE DEPENDENCE MEASURESDEPENDENCE MEASURES MULTI-STEP DISTRIBUTIONMULTI-STEP DISTRIBUTION
ASYMMETRIC GLOBAL CORRELATIONSASYMMETRIC GLOBAL CORRELATIONS

Conditional CorrelationsConditional Correlations
Definition of Definition of conditionalconditional correlationcorrelation
And letting And letting
, ,
1
2 21 1
t t tx y t
t t t t
E x y
E x E y
, , , ,,t y t y t t x t x ty h x h
1 , ,1 , ,
2 21 ,
,
,
,
1
x yt x t y t
t x t y t
t x t t y
t
t
EE
E E

Multivariate DefinitionsMultivariate DefinitionsMultivariate DefinitionsMultivariate Definitions
Let Let rr be a vector of returns and be a vector of returns and DD a diagonal a diagonal matrix with standard deviations on the matrix with standard deviations on the diagonaldiagonal
RR is a time varying correlation matrix is a time varying correlation matrix
1 ~ (0, ),t t t t t t tr F H H D R D F
ttttttt RErD ', 1
1

DYNAMIC CONDITIONAL DYNAMIC CONDITIONAL CORRELATIONCORRELATION
A NEW SOLUTION in Engle(2002)A NEW SOLUTION in Engle(2002)
THE STRATEGY:THE STRATEGY: ESTIMATE UNIVARIATE VOLATILITY ESTIMATE UNIVARIATE VOLATILITY
MODELS FOR ALL ASSETSMODELS FOR ALL ASSETS CONSTRUCT STANDARDIZED CONSTRUCT STANDARDIZED
RESIDUALS (returns divided by conditional RESIDUALS (returns divided by conditional standard deviations)standard deviations)
ESTIMATE CORRELATIONS BETWEEN ESTIMATE CORRELATIONS BETWEEN STANDARDIZED RESIDUALS WITH A STANDARDIZED RESIDUALS WITH A SMALL NUMBER OF PARAMETERSSMALL NUMBER OF PARAMETERS

MODELS FOR CONDITIONAL MODELS FOR CONDITIONAL CORRELATIONSCORRELATIONS
ConstantConstant
Integrated ProcessesIntegrated Processes
Mean Reverting ProcessesMean Reverting Processes
More complex multivariate processesMore complex multivariate processes

The Constant Correlation The Constant Correlation Estimator: Bollerslev(1990)Estimator: Bollerslev(1990)
Let Let
Be the standardized residualsBe the standardized residuals
Then Then
1t t tD r
1
1'
T
t tt
RT

Specifications for RhoSpecifications for Rho
Exponential SmootherExponential Smoother
i.e.i.e.
T
sst
sT
sst
s
T
sstst
s
t
1
2,2
1
2,1
1,2,1
.1
where,
1,,1,1,,,
,2,2,1,1
,2,1
tjitjtitji
tt
tt
q

Mean Reverting RhoMean Reverting Rho
Just as in GARCHJust as in GARCH
.1
where,
1,,1,1,,,,
,2,2,1,1
,2,1
tjitjtijitji
tt
tt
q

Simple Correlation ModelsSimple Correlation Models
andand
1 1 1'1t tt tQ Q
* 1/2 * 1/2( ) ( )t t t tR Q Q Q
1 1 1'1 t tt tQ R Q
*t tQ diag Q

Tse and Tsui(2002) Tse and Tsui(2002)
A closely related model for modeling A closely related model for modeling correlations directly as a weighted average of correlations directly as a weighted average of three correlation matrices.three correlation matrices.
1 2 1 1 2 1
1/ 2 1/ 2
ˆ1 ,
1 1 1ˆ ' ' '
kt t t
t t tk
t s s s s s ss t k s t k s t k
R R r R
r diag diagk k k

Higher Order ModelsHigher Order Models
Engle and Sheppard(2002), Engle and Sheppard(2002), Theoretical and Theoretical and Empirical Properties of Dynamic Conditional Empirical Properties of Dynamic Conditional Correlation Multivariate GARCHCorrelation Multivariate GARCH
Higher order DCC are estimatedHigher order DCC are estimated Applied to 100 S&P industry sectorsApplied to 100 S&P industry sectors Applied to 30 Dow StocksApplied to 30 Dow Stocks

Higher Order DCCHigher Order DCC
Define DCC(p,q) asDefine DCC(p,q) as
For most of the data sets, DCC(1,1) was adequate. For most of the data sets, DCC(1,1) was adequate.
1 1
'p q
t i t i t i i t ii i
Q R R Q R

Generalized DCCGeneralized DCC
Add parameters for each assetAdd parameters for each asset
Where A and B are square, symmetric, and is Where A and B are square, symmetric, and is Hadamard productHadamard product
If If A,BA,B and and (ii’-A-B)(ii’-A-B) are p.s.d and are p.s.d and RR is p.d., then is p.d., then QQ is is p.d. p.d. See Ding and Engle(2001)See Ding and Engle(2001)
1 1 1' t t t tQ R A R B Q R

Diagonal Generalized DCCDiagonal Generalized DCC
Choose a parameterization for A, B.Choose a parameterization for A, B.
So that for any So that for any WW
Hence for any i and j Hence for any i and j
', 'A B
A W diag W diag
, , 1 , , , , , , ,i j t i j i t j t i j i j t ii i j jjQ Q

Asymmetric DCCAsymmetric DCC
Response to two negative returns is different from Response to two negative returns is different from overall response.overall response.
DefineDefine
Asymmetry can be introduced with terms that are zero Asymmetry can be introduced with terms that are zero except when both returns are negative such as:except when both returns are negative such as:
Or more generally (and averaging to zero):Or more generally (and averaging to zero):
1
1min ,0 , '
T
t t t tt
NT
't tG N
, ,i t j t

Asymmetric Generalized DCCAsymmetric Generalized DCC
The Asymmetric Generalized DCC can The Asymmetric Generalized DCC can be expressedbe expressed
And assuming a diagonal structure for And assuming a diagonal structure for A,B and G, the typical equation A,B and G, the typical equation becomes becomes
1 1 1' ' t t t t t tGQ R A R B Q R N
, , 1 , , , , , , , ,, ,i j t i j i j i t j t i j i j i j i j i t j t it i j jQ NQ

Log LikelihoodLog Likelihood
1
1 1
1
1
2 2 1
1log(2 ) log '
2
1log(2 )
log '
log '2
1log(2 ) 2log
2
1log '(2 ) 2log '
2log '
t t t tt
t t t t t t t tt
tt
t t t t
t t t t
t t t t tt
t t
L H r H r
D R D r D R D r
R R
r D r RD r R
D
D r

Two Step Maximum LikelihoodTwo Step Maximum Likelihood
First, estimate each return as GARCH possibly First, estimate each return as GARCH possibly with other variables or returns as inputs, and with other variables or returns as inputs, and construct the standardized residualsconstruct the standardized residuals
Second, maximize the conditional likelihood Second, maximize the conditional likelihood with respect to any unknown parameters in rhowith respect to any unknown parameters in rho

ECONOMETRIC QUESTIONSECONOMETRIC QUESTIONS
With non-normal data, are these QMLE With non-normal data, are these QMLE estimators?estimators?
How can we construct asymptotically How can we construct asymptotically consistent standard errors?consistent standard errors? Let parameters in GARCH be Let parameters in GARCH be and call the and call the
likelihood function QLlikelihood function QL11
Let parameters in DCC be Let parameters in DCC be and call the second and call the second part of the likelihood function QLpart of the likelihood function QL22
21( , ) ,QL QL QL

Quasi LikelihoodQuasi Likelihood
1
2
2
1 2log
log(2 ) 2log
'
'
't t t t t t t
t t tt
t
t
QL
R R
QL QL
D r
D r
D r
r

GENERAL RESULTGENERAL RESULT
Bollerslev and Wooldridge(1992) show that Bollerslev and Wooldridge(1992) show that any multivariate GARCH model that is any multivariate GARCH model that is correctly specified in the first two moments, correctly specified in the first two moments, and satisfies a bunch of regularity conditions, and satisfies a bunch of regularity conditions, will be a QMLE estimator.will be a QMLE estimator.
However this does not imply that two step However this does not imply that two step estimation is consistent.estimation is consistent.

Two Step EstimatorsTwo Step EstimatorsSee Newey and McFadden(1994) pp.2176-2184See Newey and McFadden(1994) pp.2176-2184
Suppose there are two sets of parameters (Suppose there are two sets of parameters (, , ) that ) that are have no relation, i.e. are “variation free”. are have no relation, i.e. are “variation free”.
Let there be kLet there be k11 moment conditions g moment conditions g11(() and k) and k22 moment conditions gmoment conditions g22((, , ), where these conform ), where these conform with the number of parameters in (with the number of parameters in (, , ) .) .
Consider the GMM estimation Consider the GMM estimation minmin g’Wgg’Wg with with g=(gg=(g11,g,g22)’.)’. It is just identified so W=I is no restriction. It is just identified so W=I is no restriction. It will be a two step estimator since It will be a two step estimator since will solve only the will solve only the
first set of moments and first set of moments and will solve the second using the will solve the second using the first estimate of first estimate of . .

GENERAL GMM RESULTSGENERAL GMM RESULTS
0
uniformly in p0
0 0
0
0
1 10 0 0
1ˆ arg min ' ,
If g
g =0 is uniquely solved by ,
G non-singular,
0, ,
and some regularity conditions,
ˆthen 0, ,
T T T t
T
pTT
DT
D
g g g gT
g
gG
T g N
T N G G

KEY ASSUMPTIONKEY ASSUMPTION
The first stage is consistent even if not MLE!The first stage is consistent even if not MLE! That is GARCH models estimated individually That is GARCH models estimated individually
are consistent but inefficient when all are consistent but inefficient when all parameters are variation free.parameters are variation free.
21,
21,
2,
,,
1log(2 ) 2 log '
2
1log(2 ) 2 log '
2
1log
2
T t t t tt
T t t t tt
k tk t
k t k t
QL D r D r
g D r D rT
rh
T h

For Two StepFor Two Step
Given consistency for all parametersGiven consistency for all parameters
1
2 2
21, 1, 2,
21, 2, 2,
0 1 1
0
0
1
ˆ0,
ˆ
t t t p
t t t
D
gG
g g
g g g
g g gT
T N G G

APPLICATION TO VARIANCE APPLICATION TO VARIANCE TARGETINGTARGETING
Variance Targeting was proposed by Engle and Variance Targeting was proposed by Engle and Mezrich(1995) to constrain an ARCH model to have Mezrich(1995) to constrain an ARCH model to have a prespecified long run variance. Typically this was a prespecified long run variance. Typically this was the sample variance.the sample variance.
It is easily seen that the long run variance forecast It is easily seen that the long run variance forecast from this model is from this model is 22
There are only two parameters to estimate rather than There are only two parameters to estimate rather than three.three.
2 21 11t t th y h

ECONOMETRIC ISSUESECONOMETRIC ISSUES
Using the sample variance in this model givesUsing the sample variance in this model gives
This is not a Maximum Likelihood estimator of This is not a Maximum Likelihood estimator of GARCH(1,1) and therefore is asymptotically GARCH(1,1) and therefore is asymptotically inefficientinefficient
It will be consistent because the sample variance is It will be consistent because the sample variance is consistent in a wide range of models.consistent in a wide range of models.
If GARCH is misspecified, the long run variance will If GARCH is misspecified, the long run variance will still be consistent.still be consistent.
2 2 2 21 1
1ˆ ˆ1 ,t t t th y h y
T

Univariate Variance TargetingUnivariate Variance Targeting
The first set of moments come from the The first set of moments come from the likelihood and the second from the sample likelihood and the second from the sample variance.variance.
21 2 1 1 2 1
2
2
1
log1
t t t
tt
t
t
t
h y h
yh
hgT
y

Two Step DCCTwo Step DCC
One set of 3n moments for the variance One set of 3n moments for the variance models, models, , and one set for the correlations, , and one set for the correlations, ..
2, ,0 ,1 , 1 ,2 , 1
2,
,,
1
log ,1
log '
i t i i i t i i t
i ti t
i t
t
t t t t
h y h
yh i
hgT
R R

Three Step DCCThree Step DCCor DCC with Correlation Targetingor DCC with Correlation Targeting
One set of 3n moments for variances,One set of 3n moments for variances, n(n- n(n-1)/2 for unconditional correlations, and two for 1)/2 for unconditional correlations, and two for the correlation process.the correlation process.
2,
,,
, , ,
1
log ,1
,
log '
i ti t
i t
t i t j t i j
t t t t
yh i
hg
i jT
R R

BEYOND LINEAR BEYOND LINEAR DEPENDENCE DEPENDENCE

JOINT DISTRIBUTIONSJOINT DISTRIBUTIONS
Dependence properties are all summarized by Dependence properties are all summarized by a joint distributiona joint distribution
For a vector of kx1 random variables Y with For a vector of kx1 random variables Y with cumulative distribution function Fcumulative distribution function F
Assuming for simplicity that it is continuously Assuming for simplicity that it is continuously differentiable, then the density function is:differentiable, then the density function is:
1 1 1,..., ,...,k k kF y y P Y y Y y
1
1
,...,...
k
kk
F yf y y
y y

UNIVARIATE PROPERTIESUNIVARIATE PROPERTIES
For any joint distribution function F, there are For any joint distribution function F, there are univariate distributions Funivariate distributions Fi i and densities fand densities fii defined by:defined by:
is a uniform random variable on the is a uniform random variable on the interval (0,1)interval (0,1)
What is the joint distribution of What is the joint distribution of
,.., , , ,...,i i i i i
ii i
i
F y P Y y F y
Ff y
y
i i iU F Y
1,..., kU U U

COPULACOPULA
The joint distribution of these uniform random The joint distribution of these uniform random variables is called a copula;variables is called a copula; it only depends on ranks and it only depends on ranks and is invariant to monotonic transformations. is invariant to monotonic transformations.
EquivalentlyEquivalently 1 1,..., ~ ,..,k kU U U C u u
1 1
1 11 1
,...,
,...,
k k
k k
F y C F y F y
C u F F u F u

COPULA DENSITYCOPULA DENSITY
Again assuming continuous differentiability, Again assuming continuous differentiability, the copula density isthe copula density is
From the chain rule or change of variable rule, From the chain rule or change of variable rule, the joint density is the product of the copula the joint density is the product of the copula density and the marginal densitiesdensity and the marginal densities
1,...
k
k
C uc u
u u
1 1 2 2 ... k kf y c u f y f y f y

BIVARIATE DEPENDENCE BIVARIATE DEPENDENCE MEASURESMEASURES
Pearson or simple correlationPearson or simple correlation
Will be sensitive to monotonic transformations Will be sensitive to monotonic transformations of the data, I.e. to the marginal densities as of the data, I.e. to the marginal densities as well as the copulawell as the copula
1 2 1 2
2 22 21 1 2 2
E Y Y E Y E Y
E Y E Y E Y E Y

Invariant MeasuresInvariant Measures
Kendall’s Tau: For a bivariate vector Y, Kendall’s Tau: For a bivariate vector Y,
ττ depends only on the ranks, ie on the copuladepends only on the ranks, ie on the copula Spearman or rank correlationSpearman or rank correlation
1 1 2 2 1 1 2 2' ' 0 ' ' 0P Y Y Y Y P Y Y Y Y
1 2 1 2
2 22 21 1 2 2
1 212 3
S
E U U E U E U
E U E E U
E U U
U E U
1 2 1 2let , and ', ' be independent observationsY Y Y Y

A NEW ESTIMATORA NEW ESTIMATORRANK-DCCRANK-DCC
A dynamic correlation estimator can be A dynamic correlation estimator can be constructed based only on the order statistics constructed based only on the order statistics of the dataof the data
First create standardized residuals (?) then First create standardized residuals (?) then rank themrank them
Build a DCC model based on rank dataBuild a DCC model based on rank data Estimator is less sensitive to outliers but pretty Estimator is less sensitive to outliers but pretty
similar to cardinal DCC.similar to cardinal DCC.

TAIL DEPENDENCETAIL DEPENDENCE
When one variable is extreme, will another be When one variable is extreme, will another be also extreme?also extreme?
Upper tail dependence isUpper tail dependence is
Lower tail dependence is Lower tail dependence is
0lim , /Lu
C u u u
1 2 2 11 1
1
lim lim
lim , / 1
Uu u
u
P U u U u P U u U u
C u u u

Values of Tail DependenceValues of Tail Dependence
Tail dependence is a probability and must be Tail dependence is a probability and must be between zero and onebetween zero and one
For joint normal distributions:For joint normal distributions:
For other copulas one or both may be non-For other copulas one or both may be non-zero. zero.
It is interesting if lower tail is more dependent It is interesting if lower tail is more dependent than upperthan upper
0U L

What is the Distribution of DCC?What is the Distribution of DCC?
To focus on the comovements, let volatilities be To focus on the comovements, let volatilities be constant and normalized to 1.constant and normalized to 1.
Consider bivariate distribution of (y,x) Consider bivariate distribution of (y,x) Conditional correlations are changing but there is only one Conditional correlations are changing but there is only one
unconditional correlation.unconditional correlation. This is therefore not a multivariate normalThis is therefore not a multivariate normal
This is a mixture of normalsThis is a mixture of normals with standard normal marginalswith standard normal marginals With same covariance, on average.With same covariance, on average.

SimulationSimulation
100,000 observations100,000 observations N N
DCC DCC
ADCCADCC
1 .6~ 0,
.6 1
yN
x
, , 1 1 , , 1 , , , , , , , ,.6 .1 .6 .85 .6 , /x y t t t x y t x y t x y t x x t y y tq y x q r q q q
, , 1 1 , , 1 , , , , , , , ,1.6 .2 .6 .85 .6 ,
1 0 0
/x y t t t x y t x y t x y t x x t y yt tq y x qd r q
d if y and x
q q

Tail IndexTail Index(.90 to .999 quantiles, 100000 reps.)(.90 to .999 quantiles, 100000 reps.)
.05
.10
.15
.20
.25
.30
.35
.40
25 50 75 100
LTINDEXDCC1LTINDEXN1
UTINDEXDCC1UTINDEXN1
DiscussionDiscussion
Small increase in tail correlationsSmall increase in tail correlations Very little evidence of non-zero tail indexVery little evidence of non-zero tail index Still need to develop standard errors.Still need to develop standard errors. Similar results for ADCCSimilar results for ADCC
Time AggregationTime Aggregation
Multiperiod correlations include new interesting Multiperiod correlations include new interesting effectseffects They are not individually normalThey are not individually normal A large comovement leads to large correlations and a A large comovement leads to large correlations and a
subsequently large comovement.subsequently large comovement. Expect two period aggregates to show thisExpect two period aggregates to show this ADCC should show this especially in lower tailADCC should show this especially in lower tail
Average upper and lower tail for DCC as it is Average upper and lower tail for DCC as it is symmetricsymmetric

P1,T
P2,T
Symmetric Tail DependenceSymmetric Tail Dependence

P1,T
P2,T
Lower Tail DependenceLower Tail Dependence

P1,T
P2,T
K1
K2
Put Option on asset 1 Pays
Option on asset 2 Pays
Both options Payoff

P1,T
P2,T
K1
K2
Put Option on asset 1 Pays
Option on asset 2 Pays
Both options Payoff

TWO PERIOD RETURNSTWO PERIOD RETURNS
Two period return is the Two period return is the sum of two one period sum of two one period continuously continuously compounded returnscompounded returns
Look at binomial tree Look at binomial tree versionversion
Asymmetry gives Asymmetry gives negative skewnessnegative skewness
High variance
Low variance

Two period Joint ReturnsTwo period Joint Returns
If returns are both If returns are both negative in the first negative in the first period, then correlations period, then correlations are higher.are higher.
This leads to lower tail This leads to lower tail dependence dependence
Up Market
Down Market
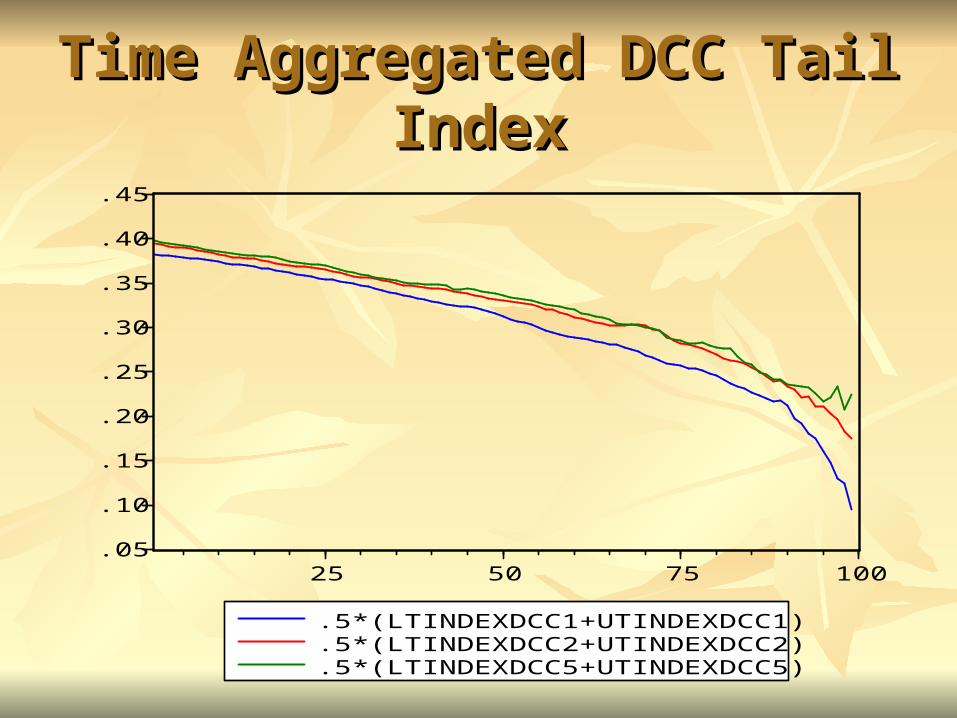
Time Aggregated DCC Tail Time Aggregated DCC Tail IndexIndex
.05
.10
.15
.20
.25
.30
.35
.40
.45
25 50 75 100
.5*(LTINDEXDCC1+UTINDEXDCC1)
.5*(LTINDEXDCC2+UTINDEXDCC2)
.5*(LTINDEXDCC5+UTINDEXDCC5)

Time Aggregated Tail Index for Time Aggregated Tail Index for ADCCADCC
.1
.2
.3
.4
.5
.6
25 50 75 100
LTINDEXADCC1LTINDEXADCC2LTINDEXADCC5
UTINDEXADCC1UTINDEXADCC2UTINDEXADCC5

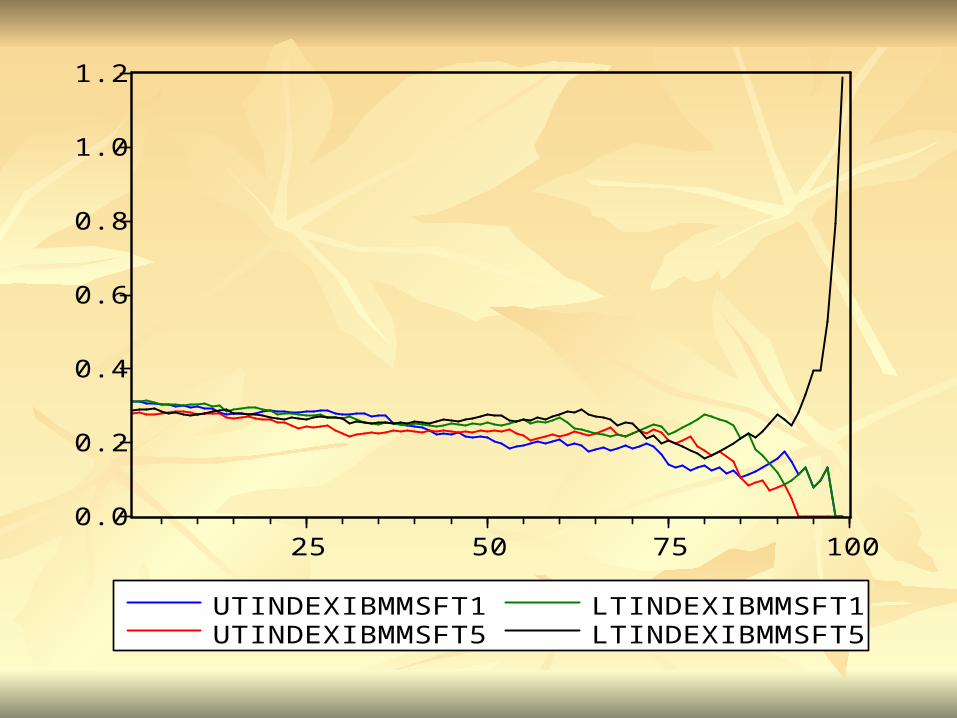
SOME RESULTS FOR EQUITY SOME RESULTS FOR EQUITY RETURNS – DOW STOCKSRETURNS – DOW STOCKS
For 1992-2002 take 10 years of equity returns For 1992-2002 take 10 years of equity returns from the 30 current Dow Jones Stocks.from the 30 current Dow Jones Stocks.
Calculate Tail correlations and Tail indexes for Calculate Tail correlations and Tail indexes for several pairs and their time aggregates.several pairs and their time aggregates.


0.0
0.2
0.4
0.6
0.8
1.0
1.2
25 50 75 100
LTINDEXAAUTX1LTINDEXAAUTX5
UTINDEXAAUTX1UTINDEXAAUTX5

0.0
0.2
0.4
0.6
0.8
1.0
1.2
25 50 75 100
LTINDEXCITIJPM1LTINDEXCITIJPM5
UTINDEXCITIJPM1UTINDEXCITIJPM5
0.0
0.2
0.4
0.6
0.8
1.0
1.2
25 50 75 100
UTINDEXIBMMSFT1UTINDEXIBMMSFT5
LTINDEXIBMMSFT1LTINDEXIBMMSFT5

0.0
0.2
0.4
0.6
0.8
1.0
1.2
25 50 75 100
LTINDEXDISKO1LTINDEXDISKO5
UTINDEXDISKO1UTINDEXDISKO5

FINDINGSFINDINGS
DCC PROVIDES A FLEXIBLE APPROACH DCC PROVIDES A FLEXIBLE APPROACH TO CORRELATION ESTIMATIONTO CORRELATION ESTIMATION
ASYMPTOTIC STANDARD ERRORS CAN ASYMPTOTIC STANDARD ERRORS CAN BE CONSTRUCTED FOR THE TWO AND BE CONSTRUCTED FOR THE TWO AND THREE STEP ESTIMATORSTHREE STEP ESTIMATORS
TIME AGGREGATED SIMULATED ADCC TIME AGGREGATED SIMULATED ADCC AND REAL DATA SHOW HIGHER TAIL AND REAL DATA SHOW HIGHER TAIL DEPENDENCE, PARTICULARLY IN DEPENDENCE, PARTICULARLY IN LOWER TAIL LOWER TAIL

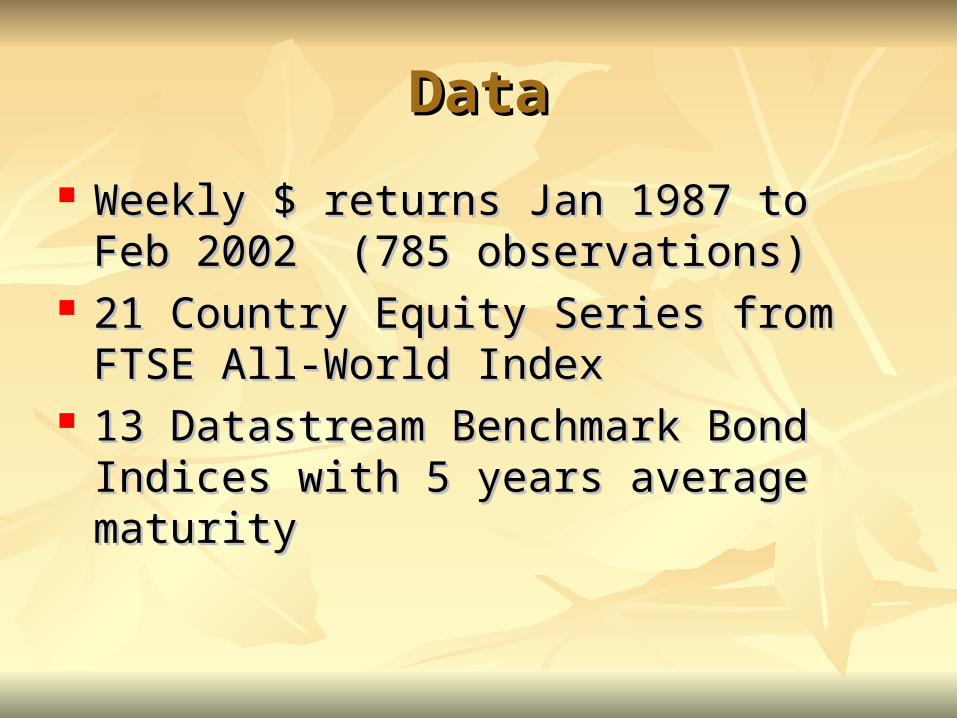
DataData
Weekly $ returns Jan 1987 to Feb 2002 (785 Weekly $ returns Jan 1987 to Feb 2002 (785 observations)observations)
21 Country Equity Series from FTSE All-21 Country Equity Series from FTSE All-World IndexWorld Index
13 Datastream Benchmark Bond Indices with 13 Datastream Benchmark Bond Indices with 5 years average maturity 5 years average maturity

EuropeEuropeAUSTRIAAUSTRIA**BELGIUMBELGIUM**DENMARKDENMARK**FRANCEFRANCE**GERMANYGERMANY** IRELANDIRELAND**ITALYITALYTHE NETHERLANDSTHE NETHERLANDS** SPAINSPAINSWEDENSWEDEN**SWITZERLANDSWITZERLAND**NORWAYNORWAYUNITED KINGDOMUNITED KINGDOM**
AustralasiaAustralasiaAUSTRALIAAUSTRALIAHONG KONG HONG KONG JAPANJAPAN**NEW ZEALANDNEW ZEALANDSINGAPORESINGAPORE
AmericasAmericasCANADACANADA**MEXICOMEXICOUNITED STATESUNITED STATES**

GARCH ModelsGARCH Models(asymmetric in orange)(asymmetric in orange)
GARCH ModelsGARCH Models(asymmetric in orange)(asymmetric in orange)
GARCHGARCH AVGARCHAVGARCH NGARCHNGARCH EGARCHEGARCH ZGARCHZGARCH GJR-GARCHGJR-GARCH APARCHAPARCH AGARCHAGARCH NAGARCHNAGARCH
3EQ,8BOND3EQ,8BOND 00 1BOND1BOND 6EQ,1BOND6EQ,1BOND 8EQ,1BOND8EQ,1BOND 3EQ,1BOND3EQ,1BOND 00 1EQ,1BOND1EQ,1BOND 00
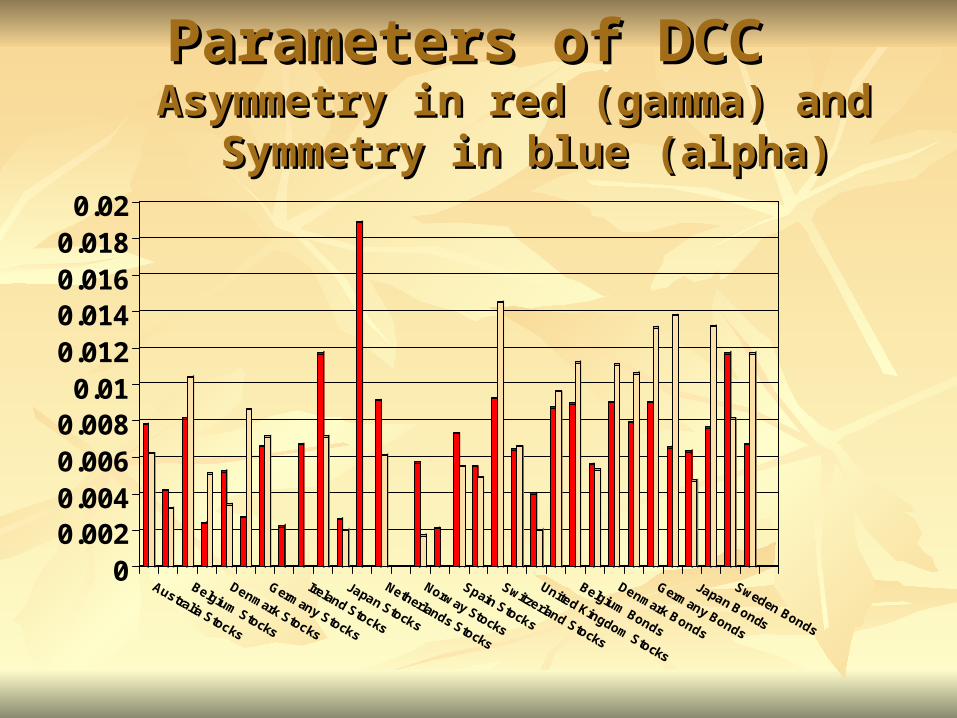
Parameters of DCCParameters of DCC Asymmetry in red (gamma) and Asymmetry in red (gamma) and
Symmetry in blue (alpha)Symmetry in blue (alpha)
00.0020.0040.0060.008
0.010.0120.0140.0160.018
0.02
Australia Stocks
Belgium Stocks
Denmark Stocks
Germany Stocks
Ireland Stocks
Japan Stocks
Netherlands Stocks
Norway Stocks
Spain Stocks
Switzerland Stocks
United Kingdom Stocks
Belgium Bonds
Denmark Bonds
Germany Bonds
Japan Bonds
Sweden Bonds


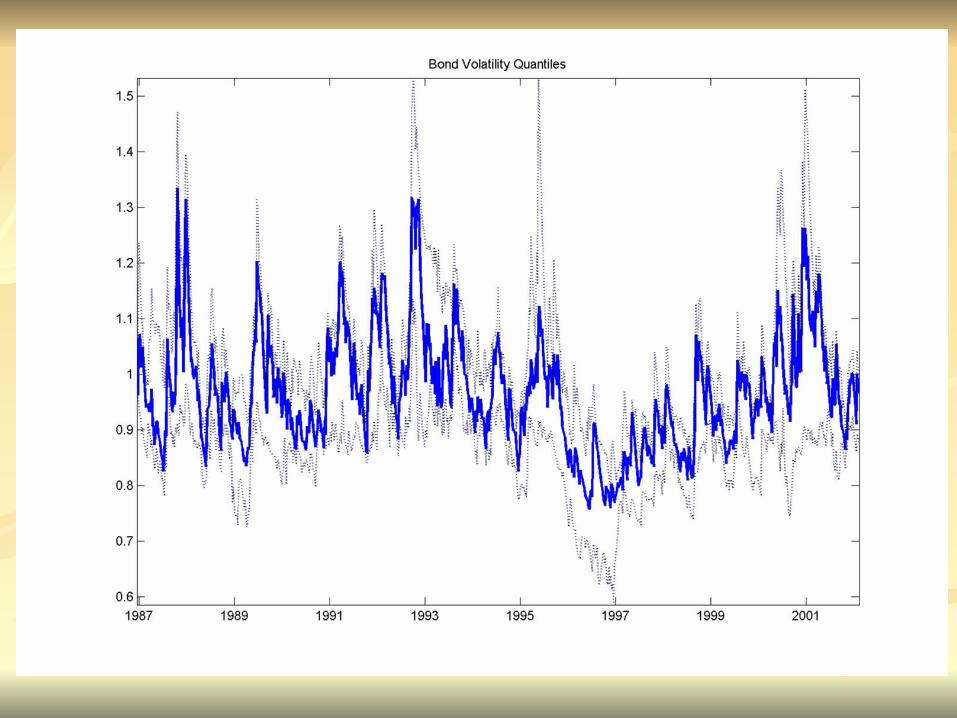
CORRELATIONS OF CORRELATIONS OF VOLATILITIESVOLATILITIES
EQUITIES = .32EQUITIES = .32 EUROPEAN = .55EUROPEAN = .55
BONDS = .35BONDS = .35 WITHIN EMU = .79WITHIN EMU = .79


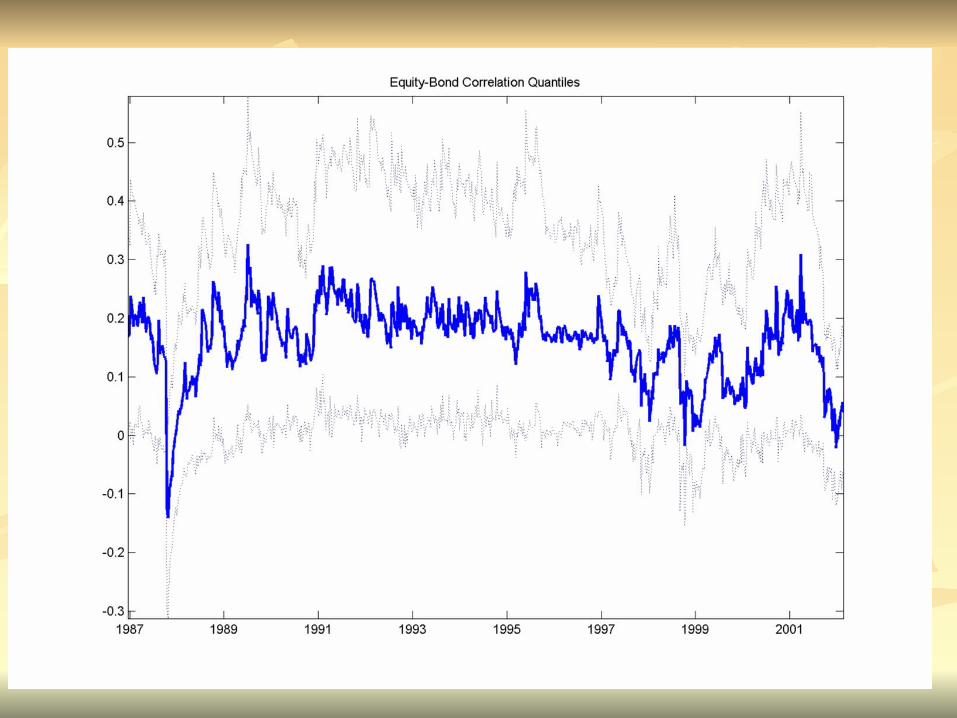

BEHAVIOR DURING US BEAR BEHAVIOR DURING US BEAR MARKETSMARKETS


RESULTSRESULTS Asymmetric Correlations – correlations rise in Asymmetric Correlations – correlations rise in
down marketsdown markets Shift in level of correlations with formation of Shift in level of correlations with formation of
EuroEuro Equity Correlations are rising not just within Equity Correlations are rising not just within
EMU-Globalization?EMU-Globalization? EMU Bond correlations are especially high-EMU Bond correlations are especially high-
others are also risingothers are also rising