Durability of a cementitious materials in waste disposal
35
Australian Nuclear Science & Technology Organisation Australian Nuclear Science & Technology Organisation Appraisal of a Appraisal of a Cementitious Cementitious Material Material for Waste Disposal: Neutron Imaging for Waste Disposal: Neutron Imaging Studies of Pore Structure and Studies of Pore Structure and Sorptivity Sorptivity Peter McGlinn Peter McGlinn , , Frikkie de Beer Frikkie de Beer , , Laurence Aldridge Laurence Aldridge , , Mabuti Mabuti Radebe Radebe , , Robert Nshimirimana Robert Nshimirimana , , Daniel Brew Daniel Brew , , Timothy Timothy Payne Payne , , Kylie Kylie Olufson Olufson ANSTO NECSA
Transcript of Durability of a cementitious materials in waste disposal

Australian Nuclear Science & Technology OrganisationAustralian Nuclear Science & Technology Organisation
Appraisal of a Appraisal of a CementitiousCementitious Material Material for Waste Disposal: Neutron Imaging for Waste Disposal: Neutron Imaging
Studies of Pore Structure and Studies of Pore Structure and SorptivitySorptivity
Peter McGlinnPeter McGlinn, , Frikkie de BeerFrikkie de Beer, , Laurence AldridgeLaurence Aldridge, , Mabuti Mabuti RadebeRadebe, , Robert NshimirimanaRobert Nshimirimana, , Daniel BrewDaniel Brew, , Timothy Timothy
PaynePayne, , Kylie Kylie OlufsonOlufsonANSTO
NECSA

AimAim
To characterise and to evaluate the durability, To characterise and to evaluate the durability, structural properties and structural properties and sorptivitysorptivity of a candidate of a candidate wasteformwasteform for ILW and gain an understanding of for ILW and gain an understanding of the factors that control water movement through the factors that control water movement through the matrix and the matrix and the resultantthe resultant degradation process.degradation process.

BackgroundBackground
•• Australia has a small amount of low and intermediate Australia has a small amount of low and intermediate level radioactive waste from medicine, research and level radioactive waste from medicine, research and industry.industry.
•• In addition, ILW from reprocessing of spent fuel will In addition, ILW from reprocessing of spent fuel will be returned from be returned from DounreayDounreay as cement.as cement.
•• In 2004, the Australian Government announced In 2004, the Australian Government announced a a planplan to establish a nuclear waste facility by 2011.to establish a nuclear waste facility by 2011.
•• ANSTO has established a project to undertake ANSTO has established a project to undertake research relevant to the safety case for the facility.research relevant to the safety case for the facility.

MaterialMaterial
•• The samples tested simulated the Materials Testing The samples tested simulated the Materials Testing Reactor (MTR) Reactor (MTR) wasteformwasteform (AEA Technology in UK). (AEA Technology in UK).
•• Formulation of 9:1 ground granulated blast furnace slag Formulation of 9:1 ground granulated blast furnace slag to Ordinary Portland Cement (OPC). to Ordinary Portland Cement (OPC).
•• Waste liquor contained detectable amounts of some Waste liquor contained detectable amounts of some simulant fission products, although in much lower simulant fission products, although in much lower concentrations than normally encountered in typical concentrations than normally encountered in typical MTR cement. MTR cement.

MethodologyMethodology
•• CharacterisationCharacterisation of unof un--leached and leached cement leached and leached cement ––bulk solids composition; mineralogy; bulk solids composition; mineralogy; microstructuremicrostructure
•• DurabilityDurability testing of cement:testing of cement:-- previous studiesprevious studies →→ longlong--term nonterm non--replacement replacement
teststests-- current studiescurrent studies →→ replacement tests (ANS 16.1)replacement tests (ANS 16.1)
•• Neutron imagingNeutron imaging (radiography and tomography):(radiography and tomography):-- residual waterresidual water-- sorptivitysorptivity (comparison with ASTM gravimetry(comparison with ASTM gravimetry--based based
protocol) protocol) -- pore size, volume and distribution pore size, volume and distribution

MethodologyMethodology
Characterisation (before and after leaching)Characterisation (before and after leaching)
•• Mineralogy Mineralogy –– XRDXRD•• Bulk solids elemental analysis Bulk solids elemental analysis –– XRFXRF•• LOI LOI -- TGATGA•• Microstructural and compositional changes of cement Microstructural and compositional changes of cement
matrix (primary phase for waste encapsulation) matrix (primary phase for waste encapsulation) -- SEM/ SEM/ EDSEDS

MethodologyMethodologyDurability testingDurability testing
•• Previous studiesPrevious studies -- nonnon--replacement replacement in deionised water in deionised water for 1, 3, 6 for 1, 3, 6 mthsmths (40(40°°C) and 92 months (first 12 months C) and 92 months (first 12 months at 40at 40°°C, thereafter RT); SA/V = 0.03 mmC, thereafter RT); SA/V = 0.03 mm--11; whole ; whole specimensspecimens
•• Current studiesCurrent studies –– ANS 16.1 ANS 16.1 -- leachateleachate replacementreplacement(deionised water at RT) (deionised water at RT) –– 2 h to 90 d2 h to 90 d; ; SA/V = 0.01mmSA/V = 0.01mm--1 1 ; ; sections of interior matrix and surface layersections of interior matrix and surface layer
•• LeachateLeachate analysis analysis –– ICPICP--MS and ICPMS and ICP--AES for Na, Mg, AES for Na, Mg, Al, Al, SiSi, S, K, Ca, Ti, , S, K, Ca, Ti, MnMn, Fe, , Fe, SrSr, , ZrZr and and BaBa

Current durability studies Current durability studies (ANS 16.1)Previous durability studiesPrevious durability studies (ANS 16.1)
1.5 cm1.5 cm
2 cm
InteriorInterior
SurfaceSurface
NB: Same SA:V ratio (0.01 mm-1) for interior and surface samples
Epoxy resinEpoxy resin8 cm
4 cm

MethodologyMethodologySorptivitySorptivity testingtesting
•• Samples enclosed in Al tape with only the base Samples enclosed in Al tape with only the base exposed, facilitating water transport in one direction exposed, facilitating water transport in one direction only (upwards).only (upwards).
•• Base continuously immersed in water Base continuously immersed in water -- adsorption adsorption measured over periods of 1, 2, 4, 6, 9, 12, 16, 20 and measured over periods of 1, 2, 4, 6, 9, 12, 16, 20 and 25 minutes (up to a month where possible).25 minutes (up to a month where possible).
•• At the end of each time interval the samples were At the end of each time interval the samples were removed from the water, removed from the water, weighedweighed and then and then transferred to the transferred to the NradNrad facility to collect facility to collect 22--D D radiographic dataradiographic data and chart water ingress.and chart water ingress.
•• Water contents were computed from the image. Water contents were computed from the image. •• At the end of the final acquisition period a 3At the end of the final acquisition period a 3--D D
tomography was carried out on the specimens to tomography was carried out on the specimens to construct macroconstruct macro--pore distributions.pore distributions.
2 cm2 cm

MethodologyMethodologySorptivitySorptivity testingtesting
•• Samples enclosed in Al tape with only the base Samples enclosed in Al tape with only the base exposed, facilitating water transport in one direction exposed, facilitating water transport in one direction only (upwards).only (upwards).
•• Base continuously immersed in water Base continuously immersed in water -- adsorption adsorption measured over periods of 1, 2, 4, 6, 9, 12, 16, 20 and measured over periods of 1, 2, 4, 6, 9, 12, 16, 20 and 25 minutes (up to a month where possible).25 minutes (up to a month where possible).
•• At the end of each time interval the samples were At the end of each time interval the samples were removed from the water, removed from the water, weighedweighed and then and then transferred to the transferred to the NradNrad facility to collect facility to collect 22--D D radiographic dataradiographic data and chart water ingress.and chart water ingress.
•• Water contents were computed from the Water contents were computed from the images.images.•• At the end of the final acquisition period a 3At the end of the final acquisition period a 3--D D
tomography was carried out on the specimens to tomography was carried out on the specimens to construct macroconstruct macro--pore distributions.pore distributions.
2 cm2 cm
Water

MethodologyMethodologyNeutron ImagingNeutron Imaging
•• Penetrating; complementary to XPenetrating; complementary to X--ray and gamma ray and gamma radiography.radiography.
•• Require strong, stationary, n sources for good beam Require strong, stationary, n sources for good beam collimation and for a high spatial resolution collimation and for a high spatial resolution ⇒⇒ reactor reactor or accelerator based.or accelerator based.
•• For For NtomNtom, require fixed beam line, stationary detector, , require fixed beam line, stationary detector, and rotating turntable for sample.and rotating turntable for sample.
•• Advantage over XAdvantage over X--rays is their high interaction rays is their high interaction probability with H and lower attenuation in several probability with H and lower attenuation in several heavy elements.heavy elements.

SANDSTONE FROM LIVERINGA GROUPSANDSTONE FROM LIVERINGA GROUP

Principle of Conventional RadiographyPrinciple of Conventional Radiography
SourceSourceCollimatorCollimator
DetectorDetector
II00
∫Σ− dxxeI
)(0~~
II0 0 –– primary beamprimary beam
ΣΣ(x) (x) –– attenuation coefficientattenuation coefficient
xx
x x –– propagation directionpropagation direction
ObjectObject


Beam line 2 : Beam line 2 : Neutron RadiographyNeutron Radiography
SAFARISAFARI--1 1 reactor wall reactor wall
Shielding Shielding
Beam stop/ Beam stop/ door door

MethodologyMethodologyApplication of Application of NradNrad/ / NtomNtom
•• Neutrons Neutrons -- transmit thick layers of material samples transmit thick layers of material samples such as cements/ concretes. such as cements/ concretes.
•• Can neutron radiography be used to interpret Can neutron radiography be used to interpret sorptivitysorptivity in cement?in cement?
•• How do the data compare with the traditional ASTM How do the data compare with the traditional ASTM procedure?procedure?
•• Where can neutron radiography and tomography be Where can neutron radiography and tomography be applied that offer advantages over other cement applied that offer advantages over other cement characterisation techniques?characterisation techniques?
»» Water loss determinationWater loss determination»» Pore distributionPore distribution»» SorptivitySorptivity determinationdetermination

ResultsResults
XRF XRF -- average bulk solids elemental concentrations (wt%) average bulk solids elemental concentrations (wt%) of whole, interior and surface (on pressed powders)of whole, interior and surface (on pressed powders)
ElementElement NaNa MgMg AlAl SiSi SS KK CaCa TiTi FeFe SrSr
WholeWhole 4.04.0 2.42.4 5.15.1 9.99.9 0.60.6 0.30.3 22.122.1 0.30.3 0.40.4 0.040.04
InteriorInterior 3.63.6 2.52.5 5.15.1 10.010.0 0.60.6 0.30.3 22.222.2 0.30.3 0.40.4 0.040.04
SurfaceSurface 5.65.6 2.32.3 5.15.1 9.69.6 0.30.3 0.40.4 20.320.3 0.30.3 0.40.4 0.040.04

UnleachedUnleached
2 cm2 cm
After 92 monthsAfter 92 months
NB: These samples used in the neutron imaging and NB: These samples used in the neutron imaging and sorptivitysorptivity studiesstudies

SEM/ EDSSEM/ EDS
UnleachedUnleached Leached for 92 monthsLeached for 92 months
50 50 uumm 50 50 uumm

0 500 1000 1500 2000 2500 30000.0
0.1
0.2
0.3
0.4
0.5
0.6
0.7
Interior K Na S
Surface K Na S
Frac
tion
leac
hed
time1/2 (sec)
0 500 1000 1500 2000 2500 30000.00
0.01
0.02
0.03
0.04
0.05
Interior Ca Sr
Surface Ca Sr
Frac
tion
leac
hed
time1/2 (sec)
0 500 1000 1500 2000 2500 30000.000
0.004
0.008
0.012
0.016
0.020
Interior Al Fe Si
Surface Al Fe Si
Frac
tion
leac
hed
time1/2 (sec)
0 500 1000 1500 2000 2500 30000.00000
0.00003
0.00006
0.00009
0.00012
0.00015
Interior Mg Ti
Surface Mg Ti
Frac
tion
leac
hed
time1/2 (sec)
Leach results Leach results –– current studies (replacement current studies (replacement leachate)leachate)

Summary of durability testsSummary of durability tests
•• Fractional releases of K, Na, S and Fe similar for interior Fractional releases of K, Na, S and Fe similar for interior and surface samples over total 90 day leach period. and surface samples over total 90 day leach period.
•• Al, Mg and Ti within a factor of 3 higher, and Si within a Al, Mg and Ti within a factor of 3 higher, and Si within a factor of 3 lower, from the interior samples.factor of 3 lower, from the interior samples.
•• Ca and Ca and SrSr -- factor of 12 lower from the surface samples factor of 12 lower from the surface samples than from the interior.than from the interior.
•• Materials in the surface samples that bind Ca and Materials in the surface samples that bind Ca and SrSr not not present in the interior sample?present in the interior sample?
•• Investigated further by Investigated further by NradNrad in attempt to determine any in attempt to determine any structural or water transmission differences between structural or water transmission differences between surface layer and underlying matrix.surface layer and underlying matrix.

Results Results -- Neutron imagingNeutron imaging
•• Residual water determination Residual water determination •• SorptivitySorptivity::
»» Gravimetry (ASTM C1585Gravimetry (ASTM C1585--04)04)»» NradNrad»» Comparison with OPCComparison with OPC
•• 2D imaging (2D imaging (NradNrad):):»» Water front progressionWater front progression
•• 3D imaging (3D imaging (NtomNtom):):»» MacroMacro--pore distributionpore distribution»» Constructed tomogramsConstructed tomograms

0
2
4
6
8
10
0 10 20 30 40 50
Drying time (days)
Cum
ulat
ive
mas
s los
s (%
)
GravimetryNrad
•• UnUn--leached cement as determined by gravimetry and leached cement as determined by gravimetry and NradNrad•• Specimens dried at 50Specimens dried at 50°°C to constant weightC to constant weight•• Difference between gravimetry and Difference between gravimetry and NradNrad due to multiple neutron scattering due to multiple neutron scattering
effect by water (effect by water (HassaneinHassanein et al et al –– correction factor 2 to 2.5)correction factor 2 to 2.5)
Residual water determinationsResidual water determinations

SorptivitySorptivity –– Gravimetry (ASTM) and Gravimetry (ASTM) and NradNrad
0
2
4
6
8
10
12
14
16
18
20
0 20 40 60 80 100 120 140 160
Time1/2 (sec)
I (m
m)
LeachedUn-leached
0
10
20
30
40
50
0 20 40 60 80 100 120 140 160Time1/2 (sec)
L (m
m)
Un-leached; crackedUn-leachedLeached
GravimetryGravimetry NradNrad
• I and L labels to distinguish between derived values obtained directly (ASTM procedure) and those calculated from a pixel intensity using Nrad.
• Nrad a factor >3 for the un-leached cement than gravimetric calculated value, and a factor >2 for the leached cement than gravimetric measurement.
• Gravimetric determinations of water movement appear to underestimate the true value.
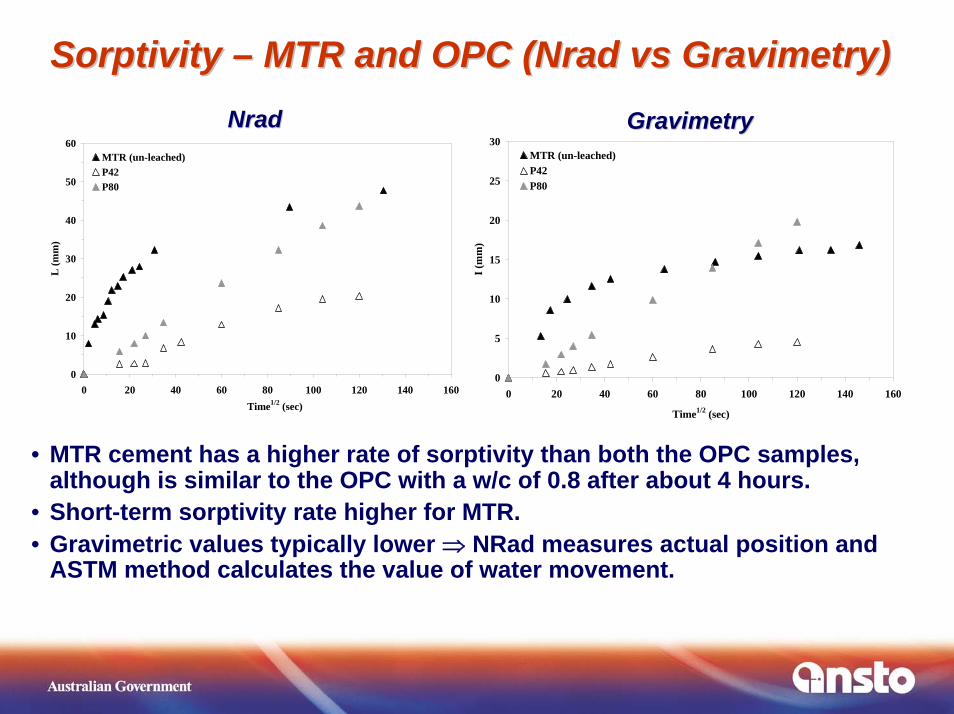
SorptivitySorptivity –– MTR and OPC (MTR and OPC (NradNrad vsvs Gravimetry)Gravimetry)
0
10
20
30
40
50
60
0 20 40 60 80 100 120 140 160Time1/2 (sec)
L (m
m)
MTR (un-leached)P42P80
0
5
10
15
20
25
30
0 20 40 60 80 100 120 140 160
Time1/2 (sec)
I (m
m)
MTR (un-leached)P42P80
GravimetryGravimetryNradNrad
• MTR cement has a higher rate of sorptivity than both the OPC samples, although is similar to the OPC with a w/c of 0.8 after about 4 hours.
• Short-term sorptivity rate higher for MTR.• Gravimetric values typically lower ⇒ NRad measures actual position and
ASTM method calculates the value of water movement.

Water front movement (Water front movement (NradNrad))
13 sec 20 sec 3 min
2 hrs 5 hrs 7 hrs
2 sec 1 min 12 min
90 min 5 hrs 6 hrs
Leached (92 months)Un-leached

Water front movement Water front movement (Nrad(Nrad) ) -- SummarySummary
•• Analyses of the unAnalyses of the un--leached and leached cement verify leached and leached cement verify the the sorptivitysorptivity calculations calculations ⇒⇒ unun--leached cement visually leached cement visually has a greater has a greater sorptivitysorptivity rate than leached sample. rate than leached sample.
•• NradNrad results could not highlight any significant results could not highlight any significant differences in the rate of water movement between the differences in the rate of water movement between the surface layer and the interior of the sample. surface layer and the interior of the sample.
•• Resolving any differential in Resolving any differential in sorptivitysorptivity between the thin between the thin surface layer and the underlying matrix difficult due to surface layer and the underlying matrix difficult due to the fine scale (<1 mm) and the relatively rapid water the fine scale (<1 mm) and the relatively rapid water movement through the cement.movement through the cement.

3D Imaging 3D Imaging –– Neutron TomographyNeutron Tomography

MacroMacro--pore volume distribution as a function of depth within pore volume distribution as a function of depth within the the unun--leachedleached cement sample cement sample

MacroMacro--pore volume distribution as a function of depth within pore volume distribution as a function of depth within the the leachedleached cement sample cement sample

3D Macro3D Macro--pore pore analysisanalysis -- SummarySummary
•• MacroMacro--pore size distribution in both the unpore size distribution in both the un--leached and leached and leached cement samples between 0.01 and 1 mmleached cement samples between 0.01 and 1 mm33. .
•• UnUn--leached sample leached sample -- 88% of pores have a volume < 0.1 88% of pores have a volume < 0.1 mmmm33, whilst for the leached sample 95% of the pores , whilst for the leached sample 95% of the pores have a volume < 0.1 mmhave a volume < 0.1 mm33. .
•• The leached cement has a higher density of smaller The leached cement has a higher density of smaller pores throughout its entire length.pores throughout its entire length.
•• MacroMacro--pore distribution is reasonably even in both pore distribution is reasonably even in both samples showing that matrix segregation not significant.samples showing that matrix segregation not significant.
•• NtomNtom -- useful information on the position and density of useful information on the position and density of the pores showing that they may contribute to water the pores showing that they may contribute to water transmission.transmission.

Neutron Tomograms Neutron Tomograms –– UnUn--leached and Leached Cementleached and Leached Cement
Un-leachedcement which (as tested for sorptivity with water using Nrad)
Leached cement which (as tested for sorptivity with water using Nrad)

Neutron Tomography Neutron Tomography –– pore structurepore structure

3D Neutron Tomography 3D Neutron Tomography -- SummarySummary
•• ProvidesProvides detailed reconstruction of the pore and crack detailed reconstruction of the pore and crack microstructure in the sample. microstructure in the sample.
•• Visualisations correlate well with the respective Visualisations correlate well with the respective sorptivitysorptivity rates for the unrates for the un--leached and leached cements.leached and leached cements.
•• Apparent greater void volume and connectivity of the Apparent greater void volume and connectivity of the pores and cracks in the unpores and cracks in the un--leached sample reflected in leached sample reflected in its higher its higher sorptivitysorptivity rate. rate.

ConclusionsConclusions•• Different rates of leaching Ca and Different rates of leaching Ca and SrSr from the surface from the surface
layer and the bulk interior of the layer and the bulk interior of the wasteformwasteform controlled by controlled by undetermined binding mechanism.undetermined binding mechanism.
•• Correlate Correlate sorptivitysorptivity rates determined by rates determined by NradNrad with pore with pore size and connectivity, and crack density, exhibited by size and connectivity, and crack density, exhibited by NtomNtom analysis.analysis.
•• Water penetration Water penetration rate comparedrate compared to those on other to those on other cement types e.g. OPC.cement types e.g. OPC.
•• Advantage of visualising and measuring, Advantage of visualising and measuring, nonnon--destructivelydestructively, material distribution within macroscopic , material distribution within macroscopic samples and to describe their inherent processes.samples and to describe their inherent processes.
•• Useful in tracking movement of water through the Useful in tracking movement of water through the cements due to the strongly attenuating properties of cements due to the strongly attenuating properties of hydrogen.hydrogen.