Dublin Mobility Plan · The Dublin Mobility Plan is the second phase of planning for transportation...
54
Dublin Mobility Plan | Draft Implementation Plan City of Dublin, Ohio Dublin Mobility Plan Phase II Final Report City of Dublin, Ohio June 2018
Transcript of Dublin Mobility Plan · The Dublin Mobility Plan is the second phase of planning for transportation...

Dublin Mobility Plan | Draft Implementation Plan City of Dublin, Ohio
Nelson\Nygaard Consulting Associates Inc. | i
Dublin Mobility Plan Phase II Final Report
City of Dublin, Ohio
June 2018
DUBLIN MOBILITY STUDY | PHASE II REPORT CITY OF DUBLIN, OH
Nelson\Nygaard Consulting Associates, Inc. | i
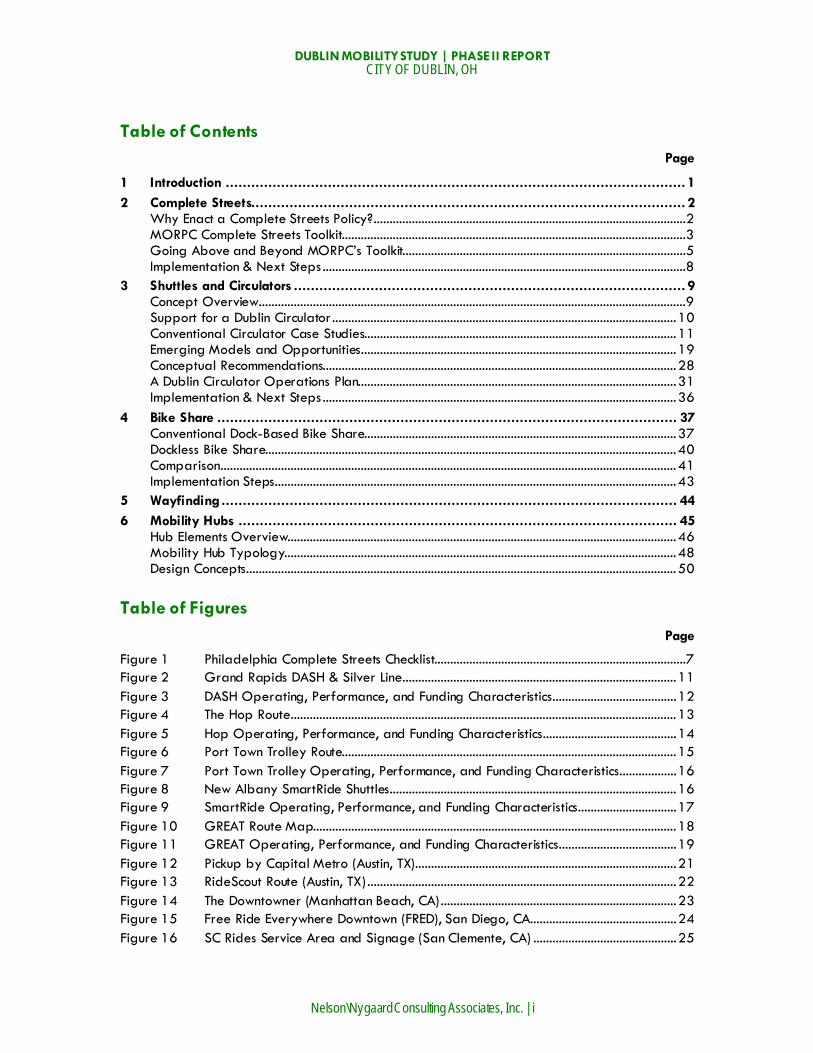
Table of Contents Page
1 Introduction ............................................................................................................ 1 2 Complete Streets...................................................................................................... 2
Why Enact a Complete Streets Policy? ..................................................................................................2 MORPC Complete Streets Toolkit............................................................................................................3 Going Above and Beyond MORPC’s Toolkit.........................................................................................5 Implementation & Next Steps ..................................................................................................................8
3 Shuttles and Circulators ............................................................................................ 9 Concept Overview......................................................................................................................................9 Support for a Dublin Circulator ............................................................................................................ 10 Conventional Circulator Case Studies.................................................................................................. 11 Emerging Models and Opportunities ................................................................................................... 19 Conceptual Recommendations............................................................................................................... 28 A Dublin Circulator Operations Plan.................................................................................................... 31 Implementation & Next Steps ............................................................................................................... 36
4 Bike Share ............................................................................................................ 37 Conventional Dock-Based Bike Share.................................................................................................. 37 Dockless Bike Share................................................................................................................................. 40 Comparison ............................................................................................................................................... 41 Implementation Steps .............................................................................................................................. 43
5 Wayfinding ........................................................................................................... 44 6 Mobility Hubs ....................................................................................................... 45
Hub Elements Overview.......................................................................................................................... 46 Mobility Hub Typology........................................................................................................................... 48 Design Concepts ....................................................................................................................................... 50
Table of Figures Page
Figure 1 Philadelphia Complete Streets Checklist...............................................................................7 Figure 2 Grand Rapids DASH & Silver Line ...................................................................................... 11 Figure 3 DASH Operating, Performance, and Funding Characteristics ....................................... 12 Figure 4 The Hop Route ......................................................................................................................... 13 Figure 5 Hop Operating, Performance, and Funding Characteristics .......................................... 14 Figure 6 Port Town Trolley Route......................................................................................................... 15 Figure 7 Port Town Trolley Operating, Performance, and Funding Characteristics .................. 16 Figure 8 New Albany SmartRide Shuttles .......................................................................................... 16 Figure 9 SmartRide Operating, Performance, and Funding Characteristics ............................... 17 Figure 10 GREAT Route Map.................................................................................................................. 18 Figure 11 GREAT Operating, Performance, and Funding Characteristics ..................................... 19 Figure 12 Pickup by Capital Metro (Austin, TX) .................................................................................. 21 Figure 13 RideScout Route (Austin, TX) ................................................................................................. 22 Figure 14 The Downtowner (Manhattan Beach, CA) .......................................................................... 23 Figure 15 Free Ride Everywhere Downtown (FRED), San Diego, CA.............................................. 24 Figure 16 SC Rides Service Area and Signage (San Clemente, CA) ............................................. 25

DUBLIN MOBILITY STUDY | PHASE II REPORT CITY OF DUBLIN, OH
Nelson\Nygaard Consulting Associates, Inc. | ii
Figure 17 SC Rides Fare Breakdown .................................................................................................... 26 Figure 18 GoDublin (Dublin, CA)............................................................................................................ 26 Figure 19 Parkmerced Car-Free Living Website................................................................................ 27 Figure 20 Workforce Shuttle Route Concept ....................................................................................... 28 Figure 21 COTA Bus Service in or Near Dublin .................................................................................. 29 Figure 22 Federal, State, Regional, & Private Funding Resources.................................................. 30 Figure 23 Pilot Goals and Success Metrics........................................................................................... 32 Figure 24 Evaluation Methodology ....................................................................................................... 32 Figure 25 Proposed Service Area.......................................................................................................... 34 Figure 26 Headways/Response Times .................................................................................................. 35 Figure 27 Supply Versus Ridership ........................................................................................................ 37 Figure 28 Advantages and Challenges of the Dock-Based Systems .............................................. 38 Figure 29 CoGo Bike Share in Columbus ............................................................................................. 39 Figure 30 Zagster Bike Share at OSU .................................................................................................. 39 Figure 31 Advantages and Challenges of Dockless Bike Share Systems ...................................... 40 Figure 32 Docked and Dockless Bike Share System Comparison.................................................... 41 Figure 33 Customers Using Information Kiosk in Bremen, Germany ............................................... 45 Figure 34 Mobility Hubs Can Be as Simple or as Complex as they Need to Be ......................... 46 Figure 35 Mobility Hub Elements Overview......................................................................................... 47 Figure 36 Bridge Park Mobility Hub Concept ..................................................................................... 50 Figure 37 Campus - Community Center Mobility Hub ....................................................................... 51 Figure 38 Neighborhood Center Mobility Hub ................................................................................... 51

DUBLIN MOBILITY STUDY | PHASE II REPORT CITY OF DUBLIN, OH
Nelson\Nygaard Consulting Associates, Inc. | 1
INTRODUCTION The Dublin Mobility Plan is the second phase of planning for transportation network improvements in the City of Dublin, Ohio. The Plan stems from a successful phase one effort to develop a shared transportation vision that is guiding policy, design, and implementation strategies for multimodal mobility improvements throughout Dublin. During that process, the community convened around what the City identified as a need for enhanced multimodal transportation options in order to support their v ision of being a “Vibrant, Innovative, and Engaged Community.” The transportation vision addresses changing patterns of land use development and mobility, while also responding to specific stakeholder goals, policy updates, and actionable strategies for development standards and infrastructure facilities. The key objectives are outlined below:
Support economic development Keep Dublin competitive as live, work, play preferences evolve and expand commute options by facilitating access to jobs for those within and outside of Dublin.
Promote equitable access to mobility Ensure access and mobility options for all residents, commuters, and v isitors by ensuring ADA accessibility, enabling aging in place, and promoting Safe Routes to Schools.
Expand multimodal options Provide safe and effective walking, cycling and other multi-modal options for Dublin.
Improve public health Make Dublin a healthy place to live and work by reducing emissions, increasing walking and cy cling, improving ecology, and reducing social isolation.
Preserve our environs by focusing future growth Focus new growth in walkable, mixed-use centers to preserve Dublin’s character and existing neighborhoods and protect natural environment & open spaces.
The following Vision Statement encapsulates these objectives:
“To be a city of strong, growing, prosperous and inclusive communities supported by excellent mobility options that bolster a thriving economy, accommodate new and established populations, facilitate healthier lifestyles, encourage social connection, and allow all Dubliners to fulfill their potential.”
Phase 2 of the Dublin Mobility Plan focuses on priority setting and action plan development. Nelson\Nygaard and the City of Dublin worked together to narrow the focus to five (5) key mobility strategies that respond to the key objectives outlined above:
1. Complete Streets 2. Shuttles & Circulators 3. Bike Share 4. Way finding 5. Mobility Hubs
Each strategy is designed for implementation v ia a short-term action plan that delivers immediate impact. Measurable results will be generated that allow planners and policy makers to evaluate effectiveness prior to investment in long-term solutions. The strategies are explored further in the following sections.

DUBLIN MOBILITY STUDY | PHASE II REPORT CITY OF DUBLIN, OH
Nelson\Nygaard Consulting Associates, Inc. | 2
COMPLETE STREETS This section summarizes the rationale, objectives, and key components of a Complete Streets Resolution for the City of Dublin. The City’s resolution builds upon the regional Complete Streets Toolkit established by the Mid-Ohio Regional Planning Commission (MORPC) and includes several design and programmatic enhancements that reflect Dublin’s unique transportation environment and community needs.
WHY ENACT A COMPLETE STREETS POLICY? Complete Streets are defined as roadways that provide an integrated, balanced, and safe transportation network for all road users, regardless of how they get around. Broadly, a Complete Streets policy provides a framework of policies, implementation guidelines, and regulatory mechanisms ensuring that all new investments in public roadways enhance the safety and mobility of all road users. Complete Streets policies have proliferated in North America over the past decade at the municipal, regional, and state levels, as planning jurisdictions have attempted to balance the safety, comfort, accessibility, and mobility needs of all road users and all modes of travel. Beyond this core objective, many Complete Streets policies also aim to achieve complementary social, economic, and environmental goals such as improving public health, reducing traffic collisions, promoting economic development, and expanding the range of multimodal transportation options available to residents.
Complete Streets are a core component of the City’s mobility strategy and contribute directly to the health, safety, economic development, and quality of life in the City of Dublin. Implementation of a Complete Streets initiative will help Dublin’s transportation network to become safer, more accessible, more comfortable, and more convenient for all road users. In particular, a Complete Streets policy will enable the City of Dublin to achieve the objectives outlined in Phase 1 of the Dublin Mobility Study.
The City’s Mobility Study objectives require a set of clearly delineated supporting policies, guidelines, and enforcement mechanisms to be incorporated into roadway projects. A common theme that emerged from stakeholder discussions at the Vision Workshop was that, absent changes to the City’s existing administrative rulesets of transportation planning and engineering, people who walk, bike, or take transit will continue to be marginalized by roadway designs and streetscapes that fail, by default, to meet their safety and/or mobility needs. A Complete Streets resolution is the first legislative step toward rebalancing the City’s transportation planning decision-making process so that the needs of all road users are given equal consideration, regardless of their mode of travel. A Complete Streets resolution will help to ensure that investments in roadway improvements will build upon recent progress and continue Dublin’s efforts in becoming a safer and more accessible community, in concert with the City’s five core mobility objectives.
A Complete Streets resolution will further support the City’s economic development strategy by ensuring that employees can get to work, companies can recruit top talent, and residents can patronize local establishments regardless of their preferred mode of travel. By balancing the mobility and access needs of all road users, the Complete Streets Resolution moves Dublin to a future in which car ownership is optional and not a required cost of doing business. In the same vein, it will help to ensure equitable access to mobility by encouraging transportation networks designed to balance the needs of all road users, so that one mode does not have priority access over any other.
The Complete Streets approach expands the appeal of non-driving transportation options in Dublin’s car-dominated environment by implementing safe, efficient, and connected bike and pedestrian facilities in a roadway network that already provides these conditions for motorists. By encouraging more people to choose walking or biking over driving when practicable, a network of Complete Streets

DUBLIN MOBILITY STUDY | PHASE II REPORT CITY OF DUBLIN, OH
Nelson\Nygaard Consulting Associates, Inc. | 3
enables significant progress on the City’s goal of improving public health. In addition to reducing local air pollution from motor vehicles, encouraging residents to walk or bike increases their regularity of cardiovascular exercise, a lifestyle habit known to improve life expectancy as well as quality of life. Dublin’s Complete Streets Resolution will require coordination with the City’s land use and development policies to achieve its maximum impact. When paired with policies and regulations – such as the Bridge Street District Walkability Standards – that effectively manage parking, encourage transit-oriented development and promote higher densities of development, the Resolution can be an effective tool in achieving the community’s mobility v ision.
MORPC COMPLETE STREETS TOOLKIT Used as a reference, the MORPC Complete Streets Toolkit, released in 2012, outlines a suite of policies, guidelines, and programs for mid-Ohio communities to plan, design, and implement Complete Streets projects. As an advisory document, the Toolkit does not exercise legislation or enforcement over MORPC jurisdictions, and therefore its potential for implementation is limited. However, the Toolkit contains a wealth of Complete Streets policies and design guidelines suitable for a variety of contexts, and this content may be useful in articulating the City of Dublin’s specific Complete Streets Resolution provisions. The Toolkit contains templates for urban, suburban, and rural Complete Streets policies as well as information on their component parts, termed the “five E’s” of engineering, education, enforcement, encouragement, and evaluation. According to MORPC, good Complete Streets policies must focus on all road users and possess the following characteristics:
Are highly executable, with clear steps of implementation Make clear when exceptions to Complete Streets policies are allowed Establish performance standards and evaluation metrics
MORPC’s “Model Suburban Policy” is a template for suburban communities like Dublin to create Complete Streets policies. The Model Suburban Policy includes the following policy statements to ensure that all transportation improvement projects adhere to a Complete Streets Policy: All new road projects will accommodate all road users, of all ages and abilities, including
pedestrians, bicyclists, transit users, motorists, and persons with disabilities. Complete streets projects should be flexible and respond to local contexts. Policies shall apply to new construction, reconstruction, maintenance, repair, and/or planning
of roadways, for the entire right-of-way. City policies and development plans in the realms of zoning, design, engineering, facility
operations/maintenance, and planning should be reviewed to ensure compliance with the Complete Streets policy.
All roadway projects should provide information in their project description on how they will align with Complete Streets policy goals.

DUBLIN MOBILITY STUDY | PHASE II REPORT CITY OF DUBLIN, OH
Nelson\Nygaard Consulting Associates, Inc. | 4
Where applicable, roadway project boundaries should include “pinch point connections” such as bridges, overpasses, underpasses, roundabouts, and rail crossings, to ensure the multimodal transportation network connectivity is continuous across these barriers.
In cases where exceptions to Complete Streets policies are unavoidable, they should be recorded in project development documentation, presented to the public during the community engagement process, and must be approved by a senior-level City director, such as the Director of Planning.
While the policy statements referenced above provide a good conceptual framework for a Complete Streets-oriented approach to transportation improvement projects, more specific designs, policies, and programs tailored to each travel mode are needed to prepare City staff for Complete Streets implementation. MORPC’s Toolkit includes detailed information on the “five E’s,” the design, policy, and programmatic components that make up an effective Complete Streets policy:
Engineering. The Toolkit provides links to the most recent design standards and guidelines for the design and construction of a wide range of multimodal infrastructure projects, including facilities for pedestrians, bicyclists, transit riders, motorists, schoolchildren, and people with disabilities.
Education/Encouragement. MORPC recognizes that even the best Complete Streets infrastructure projects have little value if road users do not know how to interact with them safely and efficiently. The Toolkit outlines a series of encouragement programs intended to encourage residents to use non-driving travel modes and education campaigns that show people how to use their mode of choice safely.
Enforcement. The Toolkit outlines a list of ‘good behaviors’ and policies, in addition to specific enforcement strategies tailored to travelers of all modes.
Evaluation. In the world of transportation funding, the old adage of “what gets measured, gets done” is an important consideration. While data on motorists’ travel behavior, trip purpose, traffic volumes, and the like are generally extensive and easy to acquire, the same extensive datasets may not exist for people walking and biking. Cities should make collection and/or acquisition of this data a top priority. Datasets that highlight the safety of people walking and biking (crash records), their trip purpose, and the economic impacts of bike/pedestrian infrastructure (from adjacent retail activity) are particularly important.
MORPC’s Complete Streets Toolkit emphasizes the importance of providing clear performance standards to measure the effectiveness of a Complete Streets policy. These performance standards may include, but are not limited to:
Lane-miles of bike facilities created New linear feet of sidewalk created Modal shift from single-occupancy vehicles to other modes Proportion of children walking or biking to school Number of motorist/non motorist crashes Number of new street trees
There are four key steps in a city’s implementation of a Complete Streets policy: 1. Coordinate with the City’s key planning and engineering staff to ensure that all transportation
improvement projects accommodate all users. 2. Allocate time and resources to develop a series of Design Guidelines that detail how to build
facilities compliant with Complete Streets principles.

DUBLIN MOBILITY STUDY | PHASE II REPORT CITY OF DUBLIN, OH
Nelson\Nygaard Consulting Associates, Inc. | 5
3. Train City planners and engineers on Complete Streets methodologies through workshops, classes, and other educational sessions.
4. Collect data corresponding to the Complete Streets performance standards referenced above. The MORPC Toolkit emphasizes that a good Complete Streets policy requires coordination with the land use and development policies that govern areas beyond the public right-of-way to achieve the greatest impact. Even high-quality, well-maintained multimodal facilities that effectively balance the needs of all road users will have limited impacts if people have difficulty reaching their destinations by non-driving modes. Of particular concern are a city’s development policies and ordinances relating to the following:
Land use and zoning. The allowable density of development and mixture of land uses each have significant influence over the likelihood people will choose to walk or bike. The density of development corresponds closely to the density of potential destinations people are able to access by walking or biking, as well as the v iability of fixed-route transit service along a particular corridor. Increasing allowable density and allowing mixed-use development along specified corridors or nodes may increase the efficacy of nearby Complete Streets projects. The Toolkit highlights several popular land use and zoning approaches that may complement a Complete Streets policy, such as LEED-ND, transit-oriented development, incentive-based codes, and form-based codes.
Urban form. The orientation of the local street plan (e.g. grid vs. cul-de-sac) and street ty pology (e.g. right-of-way width, building setbacks) have significant bearing on the connectivity between destinations and accessibility for various road users. Large building setbacks from the street and long crossing distances on major arterial roadways can inhibit walkability and bikeability even on facilities that otherwise exhibit Complete Streets characteristics.
Parking management. While parking is required for motorists to access their destinations, too often cities require excessive levels of off-street parking in new development. In excess, large areas of parking inhibit economic development, diminish the affordability of housing and commercial space, and harm access for people walking, biking, and taking transit. The Toolkit recommends several parking management strategies that limit the negative externalities of parking, such as shared parking agreements between complementary land uses, flexible parking requirements, and pricing techniques to manage parking demand.
GOING ABOVE AND BEYOND MORPC’S TOOLKIT While MORPC’s Complete Streets Toolkit offers extensive information on Complete Streets policies, design guidelines, and supportive strategies, it is only an advisory document for cities in the Mid-Ohio region, and one with some important limitations. Dublin’s context warrants a customized Complete Streets approach to address the unique factors at play in the City and provide the strongest path towards implementation. Having successfully passed a Compete Streets Resolution in June 2018, Dublin’s next step is to develop a policy document. To highlight what a City of Dublin Complete Streets Policy could look like, Nelson\Nygaard reviewed several of the leading Complete Streets policies in the United States, including:
Boston, MA Missoula, MT Philadelphia, PA West Hartford, CT Piqua, OH

DUBLIN MOBILITY STUDY | PHASE II REPORT CITY OF DUBLIN, OH
Nelson\Nygaard Consulting Associates, Inc. | 6
These policies were reviewed with a particular eye towards the extent to which they offer superior policy components, more robust implementation strategies, or stronger enforcement mechanisms as compared to the MORPC Complete Streets Toolkit. The specific Complete Streets policy components highlighted below offer some key improvements to ensure Dublin’s Complete Streets Resolution and future policy considerations are as robust and clear as possible.
Boston, MA
The pedestrian advocacy organization WalkBoston recognized, in the proliferation of Complete Streets policies across the country, a growing problem of “mission creep:” policies that list a wide of possible roadway interventions but lack effective means to ensure their implementation. WalkBoston created the Complete Streets Certification Program to raise the bar of what effective Complete Streets policies look like. To achieve certification, a policy must first be tailored to local conditions. The city/community must then assemble a baseline inventory of all pedestrian and bike accommodations. Procedures to incorporate Complete Streets treatments into routine roadway work, such as repaving, must be included. The policy must also include a review process for private developments, as these may cause disruptions to the transportation network or increases in travel demand. Cities must also set a 5-y ear drive-alone mode share goal along with annual progress reports, providing a key quantitative measure of how well the Complete Streets Policy is performing.
Missoula, MT
The Missoula Complete Streets Policy is exceptionally brief, at just two pages in length, which allows for Complete Streets concepts and requirements to be communicated succinctly to a broad audience. In concise language, the Missoula policy makes clear that all road users must be accommodated in the scoping, planning, design, and construction of any new roadway or roadway maintenance project. The policy also sets clear performance standards and benchmarks. The City must submit an annual report showing progress in Complete Streets implementation. As part of its Complete Streets Policy, the City of Missoula committed to providing a complete sidewalk network, bike lanes on all collector and arterial streets, and ADA-compliant curb ramps at every intersection by 2020. By setting these ambitious goals in clear, brief language, the City ensures that expectations of its Complete Streets Policy – the specific transportation improvements it must implement, by 2020 - are legible to all stakeholders.
Philadelphia, PA
The Philadelphia Complete Streets Handbook provides clearer breakdowns of complete streets policies than the MORPC guidelines. While MORPC links to other design guidelines such as ODOT or AASHTO in its Engineering chapter, Philadelphia’s Handbook provides its own design guidelines tailored its unique urban context. For each Complete Streets treatment, the City of Philadelphia outlines out the application, considerations, design, and organizational responsibilities associated with said treatment. This approach is useful in providing a quick overview of where and why particular Complete Streets treatments are appropriate or inappropriate. The Philadelphia Handbook also provides an Implementation Checklist, a crucial tool for implementing Complete Streets policies. The Implementation Checklist documents how each mode is considered in the scoping, planning, design, and construction of roadway projects. It is required to be completed by development applications seeking to alter the curb line, encroach on the public right-of-way, or build larger development. These ty pes of projects must get approval from the City’s Streets Department with respect to their adherence to the Complete Streets Policy.

DUBLIN MOBILITY STUDY | PHASE II REPORT CITY OF DUBLIN, OH
Nelson\Nygaard Consulting Associates, Inc. | 7
Figure 1 Philadelphia Complete Streets Checklist
Source: City of Philadelphia Complete Streets Handbook
West Hartford, CT
The West Hartford policy does an excellent job of listing performance metrics and implementation strategies for Complete Streets policies. Recognizing that inter-agency or inter-jurisdictional conflicts can hinder Complete Streets implementation, the West Hartford policy outlines the roles and responsibilities of each agency and remedial steps to take in the event these conflicts arise. The policy also mandates an annual report from the town manager to the town council on the progress of complete streets policies. The annual report must include a range of performance measures, such as:
Miles of bike lanes built Bike parking inventory Traffic calming facilities installed Linear feet of pedestrian accommodations built or repaired Number of crosswalks built or improved Number of ADA accommodations built Number of transit access improvements built

DUBLIN MOBILITY STUDY | PHASE II REPORT CITY OF DUBLIN, OH
Nelson\Nygaard Consulting Associates, Inc. | 8
Piqua, OH
The City of Piqua, Ohio, a community of 21,000 people located 25 miles north of Dayton, adopted a Complete Streets Policy in 2013. The Bike-Run-Ped Advisory Council led policy development, with a v ision for a “safe and accessible, well-connected and visually attractive surface transportation network that balances the needs of all users.” The policy was approved by the City Commission following several months of public review and comment, including input from the Piqua Planning Commission, the Miami Valley Regional Planning Commission, and the National Complete Street Coalition. Policy goals and directives are coupled with a description of project applicability and a “conformance review process” to ensure clarity for all parties responsible for making improvements to the public right-of-way . Implementation steps identify several key actions to integrating the policy with other City codes and plans, including the Safe Routes to School Travel Plan and Capital Improvement Plan, and call out opportunities for training and education that will help achieve policy goals and directives. Since adoption of the policy, the City has been awarded Bicycle Friendly Community “Bronze” status and has initiated a code review that will include a Transportation Plan to align Piqua’s Comprehensive Plan, zoning regulations, and Complete Streets Policy.
IMPLEMENTATION & NEXT STEPS In order to continue the City’s progress in implementing Complete Streets, Planning and Engineering staff drafted a Complete Streets Resolution in January 2018. The resolution memorializes the strategic mobility vision and goals that were established during the first phase of the Dublin Mobility Plan and advances the City’s efforts to provide an integrated, balanced, and safe transportation network for all users. The resolution was reviewed by relevant City departments and was adopted by City Council in June 2018.1
With adoption of the Complete Streets Resolution, the City may consider establishing one or more policies to further delineate the implementation process, add definition to planning or design criteria, and set performance measures. Performance measures include those cited in the preceding West Hartford case study, and could align with other City plans, such as the EcoDublin Strategic Plan. Additional examples include:
New miles of shared use paths New linear feet of sidewalk created Modal shift from single-occupancy vehicles to other modes Estimated reduction in fleet vehicle emissions Proportion of children walking or biking to school Number of new street trees Total dollar amount spent on Complete Streets improvements Bike and pedestrian volumes Number of bike share trips taken Crash data for all modes Policy exceptions granted Participation by local businesses in the Economic Development green business initiatives
Annual review of the Complete Streets initiative would include reporting on the metrics identified as most important to the City and could be delivered to City Council and the community at-large as a way of conveying progress and identifying areas for additional focus.
1 http://dublinohiousa.gov/dev/dev/wp-content/uploads/2018/06/Res-28-18.pdf
DUBLIN MOBILITY STUDY | PHASE II REPORT CITY OF DUBLIN, OH
Nelson\Nygaard Consulting Associates, Inc. | 9
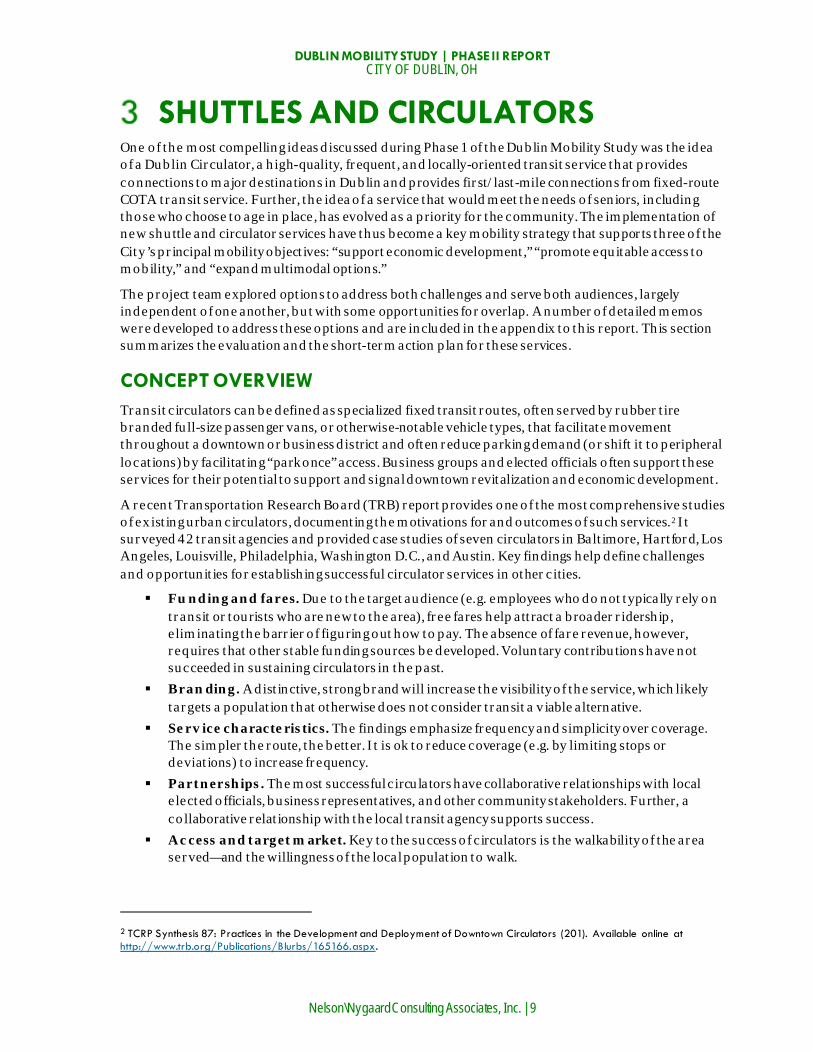
SHUTTLES AND CIRCULATORS One of the most compelling ideas discussed during Phase 1 of the Dublin Mobility Study was the idea of a Dublin Circulator, a high-quality, frequent, and locally-oriented transit service that provides connections to major destinations in Dublin and provides first/last-mile connections from fixed-route COTA transit service. Further, the idea of a service that would meet the needs of seniors, including those who choose to age in place, has evolved as a priority for the community. The implementation of new shuttle and circulator services have thus become a key mobility strategy that supports three of the City ’s principal mobility objectives: “support economic development,” “promote equitable access to mobility,” and “expand multimodal options.”
The project team explored options to address both challenges and serve both audiences, largely independent of one another, but with some opportunities for overlap. A number of detailed memos were developed to address these options and are included in the appendix to this report. This section summarizes the evaluation and the short-term action plan for these services.
CONCEPT OVERVIEW Transit circulators can be defined as specialized fixed transit routes, often served by rubber tire branded full-size passenger vans, or otherwise-notable vehicle types, that facilitate movement throughout a downtown or business district and often reduce parking demand (or shift it to peripheral locations) by facilitating “park once” access. Business groups and elected officials often support these services for their potential to support and signal downtown revitalization and economic development.
A recent Transportation Research Board (TRB) report provides one of the most comprehensive studies of existing urban circulators, documenting the motivations for and outcomes of such services.2 It surveyed 42 transit agencies and provided case studies of seven circulators in Baltimore, Hartford, Los Angeles, Louisville, Philadelphia, Washington D.C., and Austin. Key findings help define challenges and opportunities for establishing successful circulator services in other cities.
Funding and fares. Due to the target audience (e.g. employees who do not typically rely on transit or tourists who are new to the area), free fares help attract a broader ridership, eliminating the barrier of figuring out how to pay. The absence of fare revenue, however, requires that other stable funding sources be developed. Voluntary contributions have not succeeded in sustaining circulators in the past.
Branding. A distinctive, strong brand will increase the visibility of the service, which likely targets a population that otherwise does not consider transit a v iable alternative.
Service characteristics. The findings emphasize frequency and simplicity over coverage. The simpler the route, the better. It is ok to reduce coverage (e.g. by limiting stops or deviations) to increase frequency.
Partnerships. The most successful circulators have collaborative relationships with local elected officials, business representatives, and other community stakeholders. Further, a collaborative relationship with the local transit agency supports success.
Access and target market. Key to the success of circulators is the walkability of the area served—and the willingness of the local population to walk.
2 TCRP Synthesis 87: Practices in the Development and Deployment of Downtown Circulators (201). Available online at http://www.trb.org/Publications/Blurbs/165166.aspx.
DUBLIN MOBILITY STUDY | PHASE II REPORT CITY OF DUBLIN, OH
Nelson\Nygaard Consulting Associates, Inc. | 10
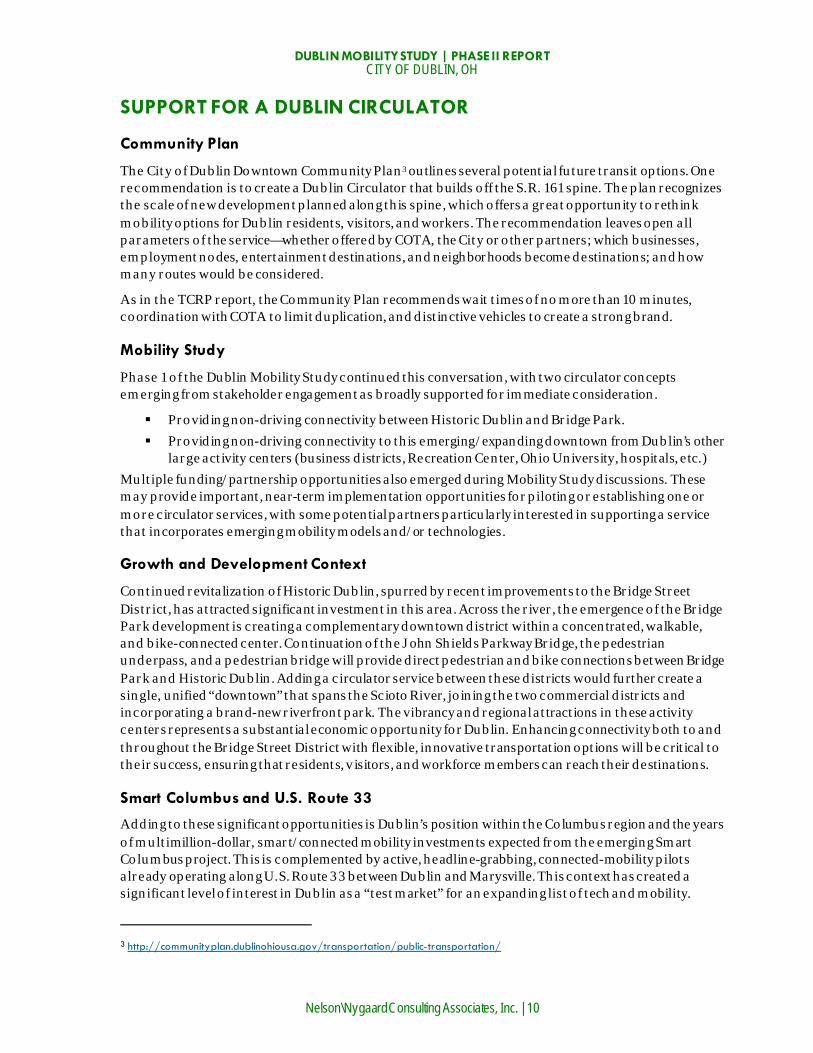
SUPPORT FOR A DUBLIN CIRCULATOR
Community Plan
The City of Dublin Downtown Community Plan3 outlines several potential future transit options. One recommendation is to create a Dublin Circulator that builds off the S.R. 161 spine. The plan recognizes the scale of new development planned along this spine, which offers a great opportunity to rethink mobility options for Dublin residents, visitors, and workers. The recommendation leaves open all parameters of the service—whether offered by COTA, the City or other partners; which businesses, employment nodes, entertainment destinations, and neighborhoods become destinations; and how many routes would be considered.
As in the TCRP report, the Community Plan recommends wait times of no more than 10 minutes, coordination with COTA to limit duplication, and distinctive vehicles to create a strong brand.
Mobility Study
Phase 1 of the Dublin Mobility Study continued this conversation, with two circulator concepts emerging from stakeholder engagement as broadly supported for immediate consideration.
Providing non-driving connectivity between Historic Dublin and Bridge Park. Providing non-driving connectivity to this emerging/expanding downtown from Dublin’s other
large activity centers (business districts, Recreation Center, Ohio University, hospitals, etc.) Multiple funding/partnership opportunities also emerged during Mobility Study discussions. These may provide important, near-term implementation opportunities for piloting or establishing one or more circulator services, with some potential partners particularly interested in supporting a service that incorporates emerging mobility models and/or technologies.
Growth and Development Context
Continued revitalization of Historic Dublin, spurred by recent improvements to the Bridge Street District, has attracted significant investment in this area. Across the river, the emergence of the Bridge Park development is creating a complementary downtown district within a concentrated, walkable, and bike-connected center. Continuation of the John Shields Parkway Bridge, the pedestrian underpass, and a pedestrian bridge will provide direct pedestrian and bike connections between Bridge Park and Historic Dublin. Adding a circulator service between these districts would further create a single, unified “downtown” that spans the Scioto River, joining the two commercial districts and incorporating a brand-new riverfront park. The vibrancy and regional attractions in these activity centers represents a substantial economic opportunity for Dublin. Enhancing connectivity both to and throughout the Bridge Street District with flexible, innovative transportation options will be critical to their success, ensuring that residents, v isitors, and workforce members can reach their destinations.
Smart Columbus and U.S. Route 33
Adding to these significant opportunities is Dublin’s position within the Columbus region and the years of multimillion-dollar, smart/connected mobility investments expected from the emerging Smart Columbus project. This is complemented by active, headline-grabbing, connected-mobility pilots already operating along U.S. Route 33 between Dublin and Marysville. This context has created a significant level of interest in Dublin as a “test market” for an expanding list of tech and mobility.
3 http://communityplan.dublinohiousa.gov/transportation/public-transportation/

DUBLIN MOBILITY STUDY | PHASE II REPORT CITY OF DUBLIN, OH
Nelson\Nygaard Consulting Associates, Inc. | 11
CONVENTIONAL CIRCULATOR CASE STUDIES
Grand Rapids, MI: DASH
Grand Rapids’ Downtown Area Shuttle, known as DASH, is a free shuttle service that connects residents and v isitors to the city’s downtown core. There are two, free, downtown routes, as shown below.
Figure 2 Grand Rapids DASH & Silver Line

DUBLIN MOBILITY STUDY | PHASE II REPORT CITY OF DUBLIN, OH
Nelson\Nygaard Consulting Associates, Inc. | 12
The DASH routes originally started as parking shuttles, connecting peripheral parking lots with the downtown core. The service is marketed to drivers who park in these lots, and information is housed on the City’s Mobile GR/Parking Services website. All DASH buses are branded with the DASH logo. Schedules and live buses are available online via the RapidConnect website or app. In 2016, Mobile GR/Parking Services began exploring options for providing a more traditional circulator route, serving v isitors as a Park Once service that can both make remote parking options more viable, and reduce v isitor tendencies to drive between downtown locations.
Figure 3 DASH Operating, Performance, and Funding Characteristics
Operating Characteristics
Service Design Shuttle
Running Time (Round Trip) DASH West: 28 minutes DASH North: 20 minutes
Number of Stops (Round Trip) DASH West: 20 DASH North: 16
Fare (One-way) Free
Service Span (weekdays) 6:30 AM – 10 PM
Service Span (weekends) None
Frequency (weekdays) 7-8 minutes
Peak 7-8 minutes
Frequency (weekends) N/A
Start-up Capital Costs N/A
Annual Operating Costs $1M +
Annual Ridership 660,000
Operating Cost/Passenger $1.52
Boulder, CO: The Hop
The Hop has been operating as a free, high-frequency circulator since 1994. It was implemented to encourage the use of transit between several activity centers within central Boulder. The route helps to ease parking demand in key areas, makes it easier to get around these areas without a car. It is currently one of a set of nine branded local transit routes (also Skip, Jump, Bound, Dash, Stampede, Buff, Climb and Bolt)
The service operates as a loop with headways every 7 to 10 minutes. It runs Monday through Friday from 7 AM to 10 PM, Saturday from 9 AM to 10 PM and Sundays/holidays from 10 AM to 6 PM, and serves major bus stops including Downtown Boulder, 29th Street Retail District, University Hill, University of Colorado, and Boulder Junction.
DUBLIN MOBILITY STUDY | PHASE II REPORT CITY OF DUBLIN, OH
Nelson\Nygaard Consulting Associates, Inc. | 13
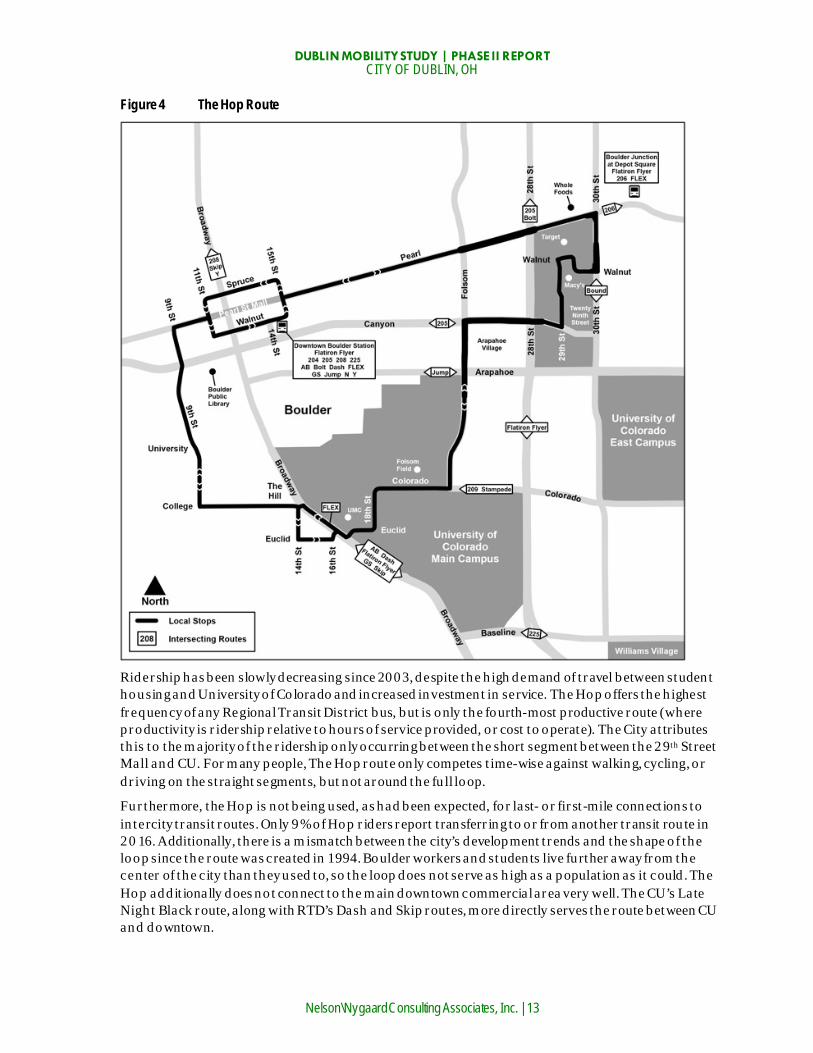
Figure 4 The Hop Route
Ridership has been slowly decreasing since 2003, despite the high demand of travel between student housing and University of Colorado and increased investment in service. The Hop offers the highest frequency of any Regional Transit District bus, but is only the fourth-most productive route (where productivity is ridership relative to hours of service provided, or cost to operate). The City attributes this to the majority of the ridership only occurring between the short segment between the 29th Street Mall and CU. For many people, The Hop route only competes time-wise against walking, cycling, or driving on the straight segments, but not around the full loop.
Furthermore, the Hop is not being used, as had been expected, for last- or first-mile connections to intercity transit routes. Only 9% of Hop riders report transferring to or from another transit route in 2016. Additionally, there is a mismatch between the city’s development trends and the shape of the loop since the route was created in 1994. Boulder workers and students live further away from the center of the city than they used to, so the loop does not serve as high as a population as it could. The Hop additionally does not connect to the main downtown commercial area very well. The CU’s Late Night Black route, along with RTD’s Dash and Skip routes, more directly serves the route between CU and downtown.
DUBLIN MOBILITY STUDY | PHASE II REPORT CITY OF DUBLIN, OH
Nelson\Nygaard Consulting Associates, Inc. | 14
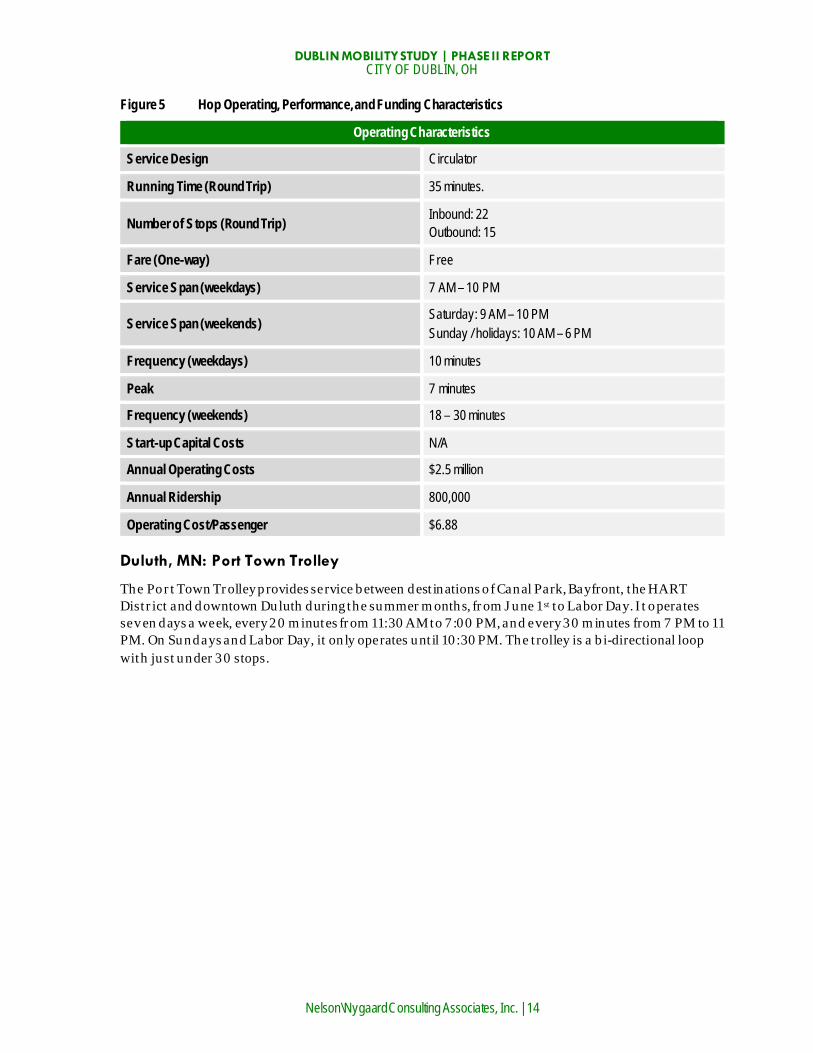
Figure 5 Hop Operating, Performance, and Funding Characteristics
Operating Characteristics
Service Design Circulator
Running Time (Round Trip) 35 minutes.
Number of Stops (Round Trip) Inbound: 22 Outbound: 15
Fare (One-way) Free
Service Span (weekdays) 7 AM – 10 PM
Service Span (weekends) Saturday: 9 AM – 10 PM Sunday / holidays: 10 AM – 6 PM
Frequency (weekdays) 10 minutes
Peak 7 minutes
Frequency (weekends) 18 – 30 minutes
Start-up Capital Costs N/A
Annual Operating Costs $2.5 million
Annual Ridership 800,000
Operating Cost/Passenger $6.88
Duluth, MN: Port Town Trolley
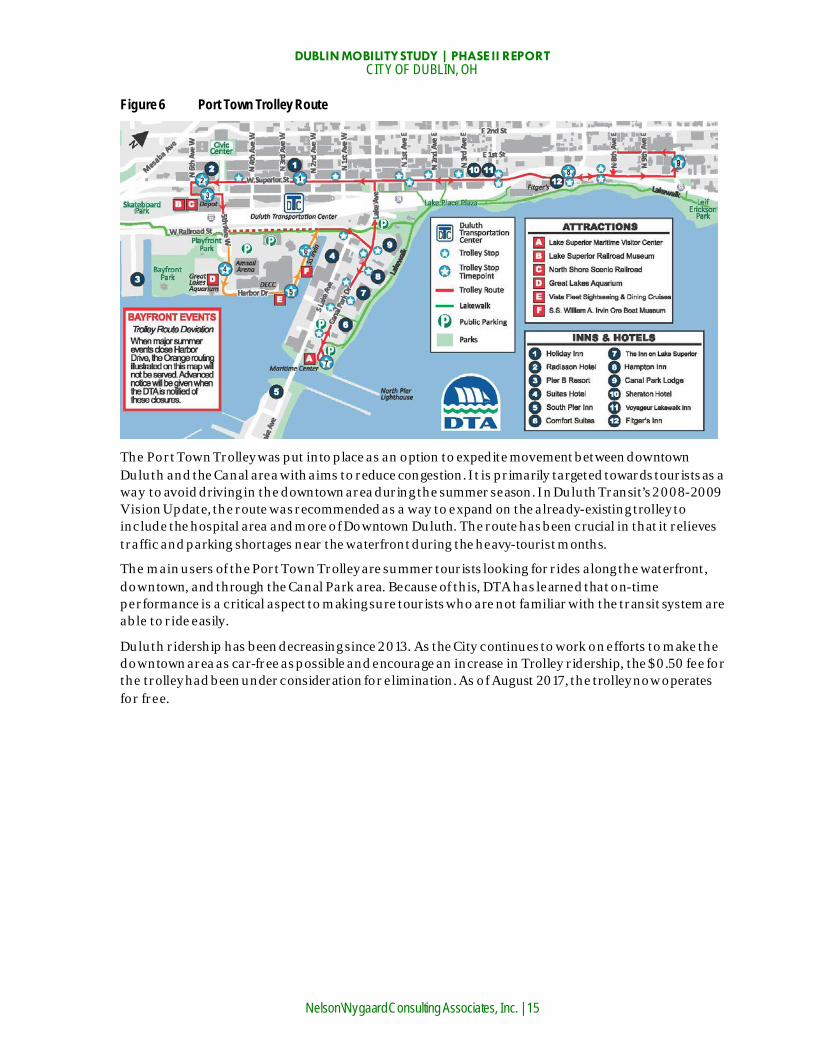
The Port Town Trolley provides service between destinations of Canal Park, Bayfront, the HART District and downtown Duluth during the summer months, from June 1 st to Labor Day. It operates seven days a week, every 20 minutes from 11:30 AM to 7 :00 PM, and every 30 minutes from 7 PM to 11 PM. On Sundays and Labor Day, it only operates until 10:30 PM. The trolley is a bi-directional loop with just under 30 stops.
DUBLIN MOBILITY STUDY | PHASE II REPORT CITY OF DUBLIN, OH
Nelson\Nygaard Consulting Associates, Inc. | 15
Figure 6 Port Town Trolley Route
The Port Town Trolley was put into place as an option to expedite movement between downtown Duluth and the Canal area with aims to reduce congestion. It is primarily targeted towards tourists as a way to avoid driving in the downtown area during the summer season. In Duluth Transit’s 2008-2009 Vision Update, the route was recommended as a way to expand on the already-existing trolley to include the hospital area and more of Downtown Duluth. The route has been crucial in that it relieves traffic and parking shortages near the waterfront during the heavy-tourist months.
The main users of the Port Town Trolley are summer tourists looking for rides along the waterfront, downtown, and through the Canal Park area. Because of this, DTA has learned that on-time performance is a critical aspect to making sure tourists who are not familiar with the transit system are able to ride easily.
Duluth ridership has been decreasing since 2013. As the City continues to work on efforts to make the downtown area as car-free as possible and encourage an increase in Trolley ridership, the $0.50 fee for the trolley had been under consideration for elimination. As of August 2017, the trolley now operates for free.

DUBLIN MOBILITY STUDY | PHASE II REPORT CITY OF DUBLIN, OH
Nelson\Nygaard Consulting Associates, Inc. | 16
Figure 7 Port Town Trolley Operating, Performance, and Funding Characteristics
Operating Characteristics
Service Design Shuttle/Circulator
Running Time (Round Trip) 40 minutes
Number of Stops (Round Trip) 25-28
Fare (One-way) Free
Service Span (weekdays) 11:30 AM – 11 PM
Service Span (weekends) Saturday: 11:30 AM – 11 PM Sunday: 11:30 AM – 10:30 PM
Frequency (weekdays) 20 minutes 11:30 AM – 7 PM 30 minutes 7 PM – 11 PM
Peak 20 minutes 11:30 AM – 7 PM 30 minutes 7 PM – 11 PM
Frequency (weekends) 20 minutes 11:30 AM – 7 PM 30 minutes 7 PM – 11 PM
Start-up Capital Costs $600,000
Annual Operating Costs $160,000
Annual Ridership 6,172
Operating Cost/Passenger $25.29
New Albany, OH: SmartRide
The city of New Albany, Ohio recently launched the SmartRide commuter shuttle service to better connect workers to the growing number of jobs in the New Albany International Business Park. The service, which is in its 5th year, is provided in partnership with the Central Ohio Transit Authority (COTA) and aligns with #45 rush hour bus line that operates to and from downtown Columbus. The shuttle service is free for riders transferring from the COTA bus line at the New Albany Park & Ride lot.
Figure 8 New Albany SmartRide Shuttles
Source: COTA

DUBLIN MOBILITY STUDY | PHASE II REPORT CITY OF DUBLIN, OH
Nelson\Nygaard Consulting Associates, Inc. | 17
The three SmartRide routes cost the City an estimated $110,000 - $120,000 to operate annually, with the City paying an additional fee to allow for use of the buses for other purposes when not in service. The service is promoted as an economic development tool that supports business growth and the roughly 15,000 employees that work in the City’s business parks. Between 20,000 – 30,000 riders use the service each year. New Albany is working with the three business parks that are served by the shuttles to generate revenues that will support ongoing operation. A $35 per-acre assessment has been proposed that could generated around $57,000 for the service, annually. The City’s goal is to contribute around 30 percent of the cost of the service, with the remainder funded by other sources, including the business park assessments and sponsorships.
Figure 9 SmartRide Operating, Performance, and Funding Characteristics
Operating Characteristics
Service Design Commuter Shuttle (3 routes)
Running Time (Round Trip) 26-30 minutes
Number of Stops (Round Trip) 23 (3 routes)
Fare (One-way) Free
Service Span (weekdays) 6:15 – 8:30 AM and 3:00 6:05 PM
Service Span (weekends) No Service
Frequency (weekdays) 30-35 minutes
Frequency (weekends) No Service
Start-up Capital Costs Unknown
Annual Operating Costs $120,000
Annual Ridership 25,000
Operating Cost/Passenger $4.80
Groveport, OH: GREAT Shuttle
The City of Groveport, Ohio also partners with COTA to provide first-mile/last-mile connections between local business parks and regional bus lines. The Groveport Rickenbacker Employee Access Transit (GREAT) service connects local employment centers to COTA lines 22 and 24, free of charge, 7 day s a week. Service hours are from 5:45 a.m. to 5:15 p.m. on weekdays, with buses arriving every 30-minutes. Weekend trips or return trips beginning later than 5:20 p.m. can be arranged on-demand. Additional supporters of the service include the Village of Obetz, the Mid-Ohio Regional Planning Commission, and Rickenbacker Employee Assistance Network.

DUBLIN MOBILITY STUDY | PHASE II REPORT CITY OF DUBLIN, OH
Nelson\Nygaard Consulting Associates, Inc. | 18
Figure 10 GREAT Route Map
Source: COTA
The service was first launched in 2015 in response to job growth in the Rickenbacker area. Access to jobs and workforce was a primary concern for area employers and the GREAT service was viewed as a needed complement to increased COTA bus service. Much like the New Albany example, the service is promoted as an economic development tool and a means for connecting regional workforce to more the 21,000 jobs and 60 businesses in the shuttle’s service area. The cost of the service is more than $490,000, annually, with roughly 70% paid by Groveport and 30% paid by Obetz. Ridership in 2017 totaled just over 25,000 passengers, with the vast majority being weekday trips.
Both the New Albany and Groveport services are being evaluated by COTA as models to be replicated throughout the Columbus region to fill first-mile/last-mile gaps.

DUBLIN MOBILITY STUDY | PHASE II REPORT CITY OF DUBLIN, OH
Nelson\Nygaard Consulting Associates, Inc. | 19
Figure 11 GREAT Operating, Performance, and Funding Characteristics
Operating Characteristics
Service Design Shuttle/Circulator (3 routes)
Running Time (Round Trip) 22-26 minutes
Number of Stops (Round Trip) 29 (3 routes)
Fare (One-way) Free
Service Span (weekdays) 5:45 AM – 5:15 PM, On-call from 5:15 – 10:15 PM)
Service Span (weekends) On-call from 6:30 AM – 8:30 PM
Frequency (weekdays) 30 minutes 5 AM – 5 PM, On-call after 5 PM
Frequency (weekends) On-Call
Start-up Capital Costs Unknown
Annual Operating Costs $490,000
Annual Ridership 25,000
Operating Cost/Passenger $19.60
EMERGING MODELS AND OPPORTUNITIES Emerging mobility options are transforming travel choice in urban and suburban communities. Car-share services are a proven means for households to reduce their dependency on owned vehicles. Bike-share programs provide a similar means of reducing auto-dependency for specific traps, typically short trips, including those that link to fixed-route transit services. Today, more car-share providers are offering “one-way” or “free-floating” use of their fleets, making this option viable for very short trips, similar to bike-share.
More recently, “ride-sharing” services like Lyft and Uber have transformed travel habits in many cities, by providing a taxi-like service that typically offers reduced costs and improved service and reliability compared to established taxi services. Similar services have emerged, using algorithm-based, digital dispatching efficiencies and scale, to provide high-occupancy services, including services like Chariot that function as “on-demand” transit that use flex-routing to connect residential and employment centers.
This combination of new service options and adoption rates in key markets suggests an emerging paradigm shift in mobility consumption, away from owning the means of travel toward procuring services that can be mixed-and-matched to trip characteristics. The most-often-used umbrella term for this emerging model of mobility consumption is Mobility as a Service (Maas), a term that encompasses not only direct providers of mobility services, but also information “aggregator” services that allow travelers to compare/contrast the services available to them for any trip they wish to make.
This fast-evolving, fast-diversifying set of mobility services is also specifically transforming the role of transit in many communities. Options like bike-share and Lyft are reducing first-mile/last-mile barriers to established, fixed-route bus and train services. Meantime, “real time” tracking services are making these transit options more acceptable to more travelers, by allowing them to minimize time spent waiting at stops and stations. Finally, new service models are beginning to occupy the gap between private ride-sharing services and conventional transit, including several, innovative circulator

DUBLIN MOBILITY STUDY | PHASE II REPORT CITY OF DUBLIN, OH
Nelson\Nygaard Consulting Associates, Inc. | 20
services that make use of technology-based operating efficiency, route flexibility, and on-demand/real-time customer amenities.
Foll0wing is a survey of some of these innovative options, with a focus on on-demand circulators/shuttles and ride-hailing partnerships.
On-Demand Circulator The mobile phone and its proliferation fueled the creation of many new on-demand transportation options. One of the emerging models is on-demand shuttles, which can be provided in a variety of formats.
In one such model, private companies provide on-demand transportation through a smartphone app using small electric vehicles with space for six seated passengers. They run as independent businesses that generate revenue through advertising and fares, or receive funding from outside sources such as business improvement districts or parking meters. Typically, these services provide transportation for short distance trips in areas where parking is scarce, or as an amenity in entertainment districts with large volumes of v isitors and tourists.
A second model uses higher capacity vehicles, such as Mercedes Benz Sprinter vans with seats for 14 passengers. When initially launched, many of these technology companies also operated services directly, such as Bridj, using venture capital investments to subsidize their growth. Bridj ceased operations in 2017, and its remaining competitors—e.g. Via, TransLoc, DemandTrans, and RouteMatch—now focus on developing and licensing demand-response software to other operators, such as transit agencies, cities, or transit contractors. In Dublin, this would mean the City or COTA identifies funding to license the demand-response software, and would provide the vehicles and drivers to operate the general public service.
The following case studies describe several on-demand shuttle services implemented by cities around the U.S.
Pickup | Austin, Texas
In June 2017, Via launched a new service—branded Pickup—in partnership with Capital Metro in Austin. The agency wished to rethink its existing general public dial-a-ride service in a mixed-use area of the city. By removing the current two-hour advance booking requirement, Capital Metro hoped Via’s platform could help increase ridership and rider satisfaction. Through Via’s customized rider app, customers can request a ride from and to anywhere within a predetermined five square-mile zone. Capital Metro provides the vehicles—Pickup-branded cutaways—and drivers, while Via provides the technology platform, including the rider and driver apps, an operations control center, and training for Capital Metro staff.

DUBLIN MOBILITY STUDY | PHASE II REPORT CITY OF DUBLIN, OH
Nelson\Nygaard Consulting Associates, Inc. | 21
Figure 12 Pickup by Capital Metro (Austin, TX)
Source: Capital Metro
Safe Ride | Emory University, Atlanta, Georgia4
Emory University in Atlanta is a suburban campus with about 15,000 students. Using only two vehicles, they operated a late-night “safe ride” service between 9 p.m. and 5 a.m. for students needing a ride home. Though the service provided a much needed safety net for students, the amount of time someone would need to wait outside for their ride created its own safety issue. To address this concern, Emory contracted with TransLoc to leverage its OnDemand product—a demand-response transit platform, including rider and driver apps, which allows riders to see the real-time location of the arriving vehicle and, as such, remain indoors until the ride arrives. Riders can also request a ride by phone call. After implementation, Emory saw ridership increase 53%, while calls to the dispatcher reduced 49%.
The RideScout Route | Austin, Texas5
In June 2015, RideScout, a mobile trip planning app company, launched the “RideScout Route”—a free Downtown Austin circulator six-week pilot funded by RideScout. Betweeen 1970 and 2009, Capital Metro operated a downtown circulator known as “The Dillo.” Until 2007, the circulator was free but Capital Metro began charging a $0.50 fare to mitigate overuse of free service by all-day homeless riders. Additionally, the original downtown route expanded to five Central Austin routes with service and headways closer to that of a local bus. The Capital Metro Board ended Dillo service in 2009 citing low ridership and negligible farebox recovery.
With the pilot route, RideScout (now a part of Moovel) wanted to test the viability of a several different downtown circulator routes to apply political pressure to jump-start the Dillo service once more. It
4 Case study obtained from TransLoc 5 http://kxan.com/2015/06/25/ridescout-route-brings-back-downtown-transit-options/, http://www.statesman.com/news/local/switching-partners-ridescout-teams-with-limo/gqaxQ1bs1tYxxyHclXydnI/, https://www.austinchronicle.com/news/2015-07-17/public-notice-dog-week-of-summer/

DUBLIN MOBILITY STUDY | PHASE II REPORT CITY OF DUBLIN, OH
Nelson\Nygaard Consulting Associates, Inc. | 22
tested a fixed-route service with designated stops and fixed-route service with customer hailing; it tested open-air Electric Cab vehicles for four weeks and 20-passenger Ford Sprinter vans with R&R Limousine & Bus for the last two weeks. RideScout experimented with peak and off-peak operating models. The first week only 30 riders used on the electric shuttles; by the third week, as word spread, 350 riders took advantage of the service.
RideScout ended the six-week pilot with good information and data to provide public sector leaders. They found that ridership was higher on the electric vehicles than the Ford Sprinters, and postulated that this was due to the fact that riders noticed the adapted golf cart vehicles more than the typical passenger vans, which blend in with the urban environment. Without fares, they also found that customers were confused about proper tipping behavior, and eventually added messaging to the vehicle specifying a tip was not expected.
The Austin Chamber of Commerce, together with Rocky Mountain Institute, used the findings to release an RFP to private vendors looking to serve downtown and the nearby Market District. Chariot now operates using a similar fixed-route to the original RideScout Route.6
Figure 13 RideScout Route (Austin, TX)
Source: KXAN
The Downtowner | Manhattan Beach, CA7
The City of Manhattan Beach launched a free electric vehicle shuttle service pilot program in January 2017. In order to ride, users must download the “Downtowner” app and select the Manhattan Beach service area. Passengers can be picked up or dropped off anywhere within the designated three-square-mile service area. The Downtowner operates six vehicles daily between 11 a.m. and 11 p.m. Each vehicle seats up to six passengers and is equipped with iPads playing informational videos about the city, announcements, and local advertisements. The Downtowner is free to customers and sponsored by local businesses and the Chamber of Commerce. Advertisements are displayed inside and outside of the shuttles. Drivers also receive tips.
6 Interview with RideScout’s former Executive Director of Mobility Solutions, Meg Merritt 7 http://www.dailybreeze.com/general-news/20170719/free-downtowner-shuttle-service-extended-in-manhattan-beach

DUBLIN MOBILITY STUDY | PHASE II REPORT CITY OF DUBLIN, OH
Nelson\Nygaard Consulting Associates, Inc. | 23
The service is intended for locals and visitors in downtown Manhattan Beach. Proximity to the beach and other tourist attractions generate more activity than current parking supplies can handle. The Downtowner is a response to growing parking and traffic congestion concerns in the downtown area. During the first five months of the pilot program, more than 28,000 riders used the service and the self-reported wait time was 12 minutes. In July 2017, the service was officially extended for an additional 12 months. City staff will begin researching grant funding that could help offset city costs. Figure 14 The Downtowner (Manhattan Beach, CA)
Six-seat Downtowner vehicle (Source: Daniella Segura, TBR News)
FRED | San Diego, CA 8
Free Ride Everywhere Downtown (FRED) is an electric-powered shuttle that serves a 2.5-mile service area around downtown San Diego. The effort is led by Civic San Diego and the Downtown San Diego Partnership.9 Users can request a ride by downloading The Free Ride smartphone application and inputting their current location and desired destination. Alternatively, users can flag down a shuttle along the route without the smartphone application. FRED shuttles operate seven days per week:
7 a.m. to 9 p.m., Monday through Thursday 7 a.m. to midnight, Friday 8 a.m. to midnight, Saturday 9 a.m. to 9 p.m., Sunday
8 https://www.sandiego.gov/mayor/news/releases/mayor-announces-launch-of-downtown-circulator-program, http://sandiegodowntownnews.com/gaslamp-quarter-premieres-new-parking-options/, http://www.sandiegouniontribune.com/business/sdut-downtown-shuttle-free-2016aug08-htmlstory.html, http://www.businessinsider.com/hamptons-free-ride-shuttle-service-2017-7 9 Civic San Diego is a nonprofit corporation created by the City of San Diego to replace the redevelopment agency. The Downtown San Diego Partnership is a nonprofit organization serving as the leading advocate for the revitalization and economic health of Downtown San Diego.

DUBLIN MOBILITY STUDY | PHASE II REPORT CITY OF DUBLIN, OH
Nelson\Nygaard Consulting Associates, Inc. | 24
During the initial launch, FRED operated 15 five-passenger vehicles, with the expectation that the fleet would grow to 20 vehicles within the first year. Drivers receive benefits and $14.66 an hour, not including tips. The average wait time for a ride is about seven minutes.
FRED serves downtown San Diego residents, locals, and tourists. It aims to fill the transportation gap for short, free rides that traditional public transit and ride-hailing companies cannot fill. In Downtown San Diego, the service allows people to travel to and within the parking-constrained commercial district without a car. Initial funding comes from $500,000 in downtown parking meter revenues. Revenue is also generated from private sponsorships in the form of advertisements, both inside and on the outside of the vehicle. Eventually, the city hopes to support the service solely through ad revenue. Up to $2 million over five y ears has been earmarked with more funds available, if needed. Within the first six weeks of the program, over 20,000 people signed up for the app. Each week y ielded an average of approximately 4,000 rides. Figure 15 Free Ride Everywhere Downtown (FRED), San Diego, CA
Sources: The Coast News; OOPM Creative
Considerations for Dublin
A fare-free model may help attract ridership Unless agency-provided, vehicles used for on-demand shuttles are not wheelchair-accessible If seeking to implement without municipal funding, these services typically rely on advertising
revenue, tips, or fares to support operations If municipal or partner funding is available, per-hour operating costs for one on-demand
electric vehicle service were quoted at $88 per vehicle Electric vehicles used in the case study pilots typically limit at 25 miles per hour, reducing the
potential service area or streets serviced Dublin could coordinate with COTA to support an on-demand model that leverages agency
drivers and vehicles

DUBLIN MOBILITY STUDY | PHASE II REPORT CITY OF DUBLIN, OH
Nelson\Nygaard Consulting Associates, Inc. | 25
Ride-Hailing Partnerships Ride-hailing services “let people use smartphone apps to book and pay for car service.”10 The potential for ride-hailing services to provide first/last mile transit access, reduce parking demand, and address localized mobility gaps stimulates partnership interest from employers, developers, cities, and transit agencies. Transit agency interest can be in serving the general public in places or at times of day difficult to serve with fixed-route transit (such as for lower density first-/last-mile connections or late night service). These partnerships can either expand existing transit service coverage area or replace existing underperforming routes.
SC Rides | Municipal Partnership | San Clemente, CA11
After a reorganization of the county’s public transit system in 2016, the City of San Clemente was left with two fewer bus routes. This impacted more than 100 daily riders. To address this, the City of San Clemente partnered with Lyft to provide replacement service along the corridor of two OCTA bus routes that were discontinued due to low performance. To use the service, riders must enter a discount code in the Lyft smartphone application and enter their desired destination. Along the designated route of approximately eight miles, riders can be picked up and dropped off at existing bus stops. Rides must occur between 6 a.m. and 8 p.m. along the corridor to qualify for the discounted fare. OCTA funds the pilot program with a $900,000 grant to the city. By using the code “SCRIDES” in the Ly ft app, riders receive discounted rides of up to nine dollars. The fare subsidy is funded by the City and OCTA. The following table shows a breakdown of the relationship between the total fare, fare subsidy, and cost to passenger. City representatives are pleased by initial results, which show approximately 50 people use the service per day. In April 2017, the City reported that the program provides an average of 1,000 rides per month.
Figure 16 SC Rides Service Area and Signage (San Clemente, CA)
Source: City of San Clemente
10 Associated Press definition 11 http://www.sanclementetimes.com/lyft-rideshare-service-off-smooth-start/, http://www.ocregister.com/2017/04/10/lots-of-positives-but-city-faces-challenges-like-toll-road/, https://blog.lyft.com/posts/reimagining-public-transit-in-san-clemente
DUBLIN MOBILITY STUDY | PHASE II REPORT CITY OF DUBLIN, OH
Nelson\Nygaard Consulting Associates, Inc. | 26
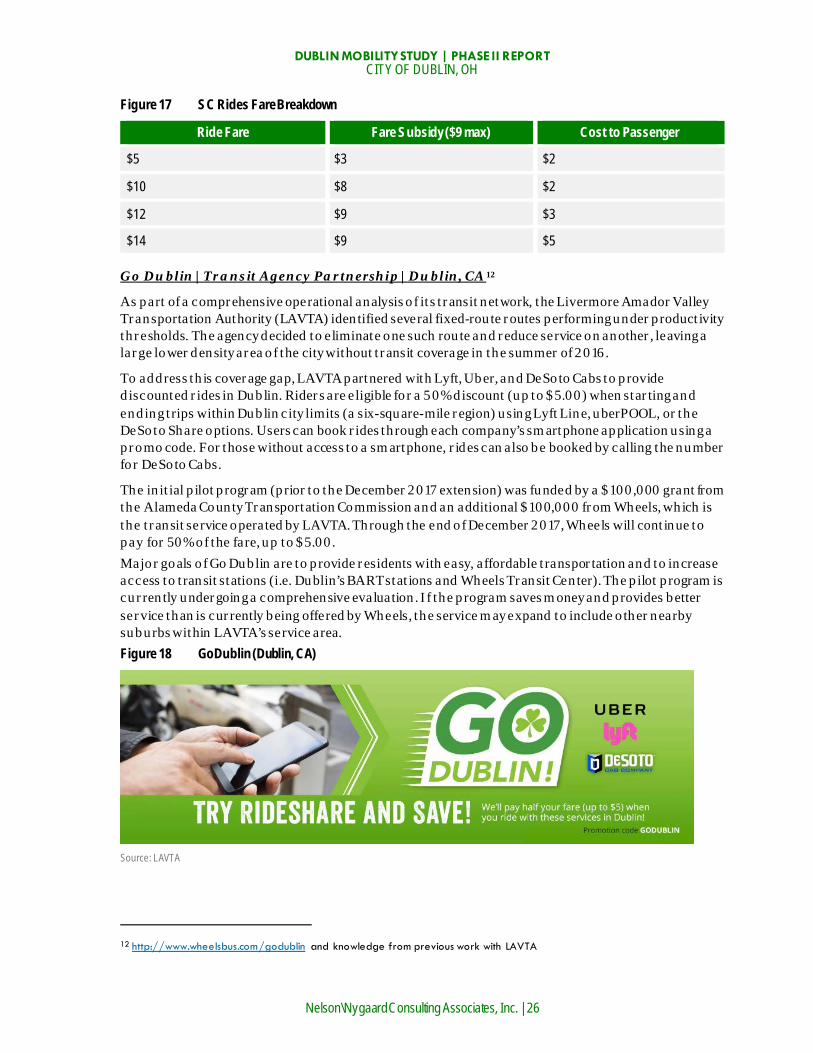
Figure 17 SC Rides Fare Breakdown
Ride Fare Fare Subsidy ($9 max) Cost to Passenger
$5 $3 $2
$10 $8 $2
$12 $9 $3
$14 $9 $5
Go Dublin | Transit Agency Partnership | Dublin, CA12
As part of a comprehensive operational analysis of its transit network, the Livermore Amador Valley Transportation Authority (LAVTA) identified several fixed-route routes performing under productivity thresholds. The agency decided to eliminate one such route and reduce service on another, leaving a large lower density area of the city without transit coverage in the summer of 2016.
To address this coverage gap, LAVTA partnered with Lyft, Uber, and DeSoto Cabs to provide discounted rides in Dublin. Riders are eligible for a 50% discount (up to $5.00) when starting and ending trips within Dublin city limits (a six-square-mile region) using Lyft Line, uberPOOL, or the DeSoto Share options. Users can book rides through each company’s smartphone application using a promo code. For those without access to a smartphone, rides can also be booked by calling the number for DeSoto Cabs.
The initial pilot program (prior to the December 2017 extension) was funded by a $100,000 grant from the Alameda County Transportation Commission and an additional $100,000 from Wheels, which is the transit service operated by LAVTA. Through the end of December 2017, Wheels will continue to pay for 50% of the fare, up to $5.00. Major goals of Go Dublin are to provide residents with easy, affordable transportation and to increase access to transit stations (i.e. Dublin’s BART stations and Wheels Transit Center). The pilot program is currently undergoing a comprehensive evaluation. If the program saves money and provides better service than is currently being offered by Wheels, the service may expand to include other nearby suburbs within LAVTA’s service area. Figure 18 GoDublin (Dublin, CA)
Source: LAVTA
12 http://www.wheelsbus.com/godublin and knowledge from previous work with LAVTA
DUBLIN MOBILITY STUDY | PHASE II REPORT CITY OF DUBLIN, OH
Nelson\Nygaard Consulting Associates, Inc. | 27
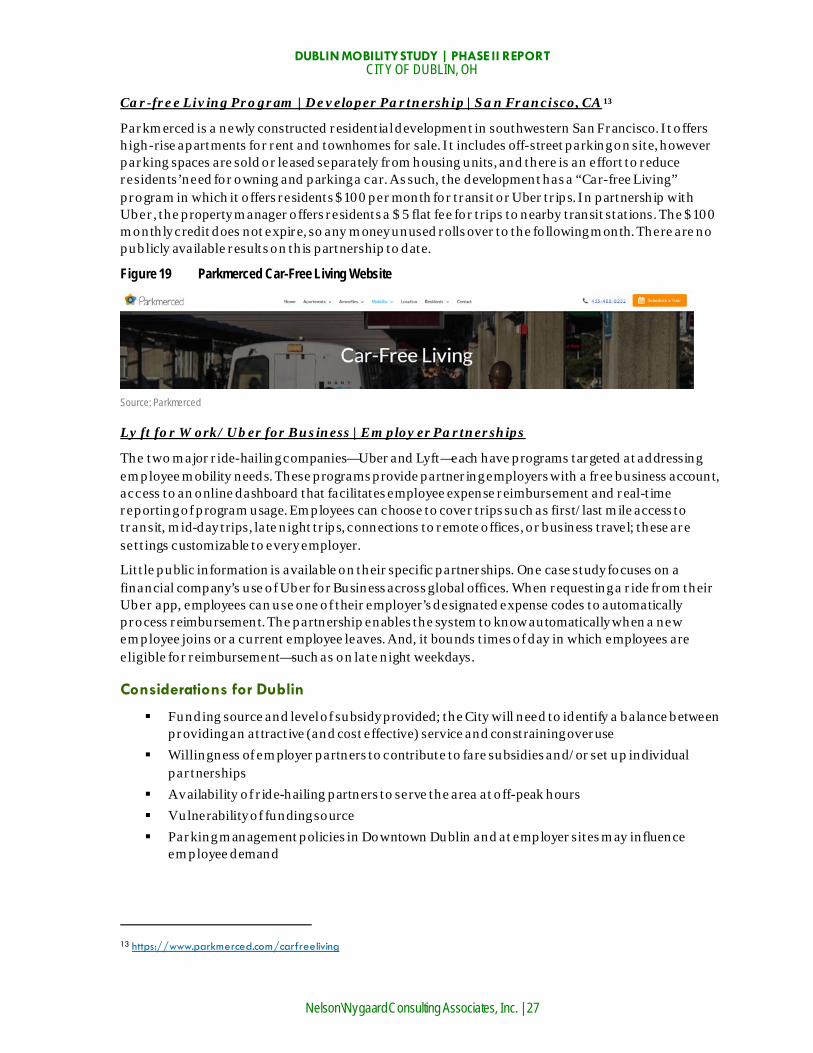
Car-free Living Program | Developer Partnership | San Francisco, CA13
Parkmerced is a newly constructed residential development in southwestern San Francisco. It offers high-rise apartments for rent and townhomes for sale. It includes off-street parking on site, however parking spaces are sold or leased separately from housing units, and there is an effort to reduce residents’ need for owning and parking a car. As such, the development has a “Car-free Living” program in which it offers residents $100 per month for transit or Uber trips. In partnership with Uber, the property manager offers residents a $5 flat fee for trips to nearby transit stations. The $100 monthly credit does not expire, so any money unused rolls over to the following month. There are no publicly available results on this partnership to date.
Figure 19 Parkmerced Car-Free Living Website
Source: Parkmerced
Lyft for Work/ Uber for Business | Employer Partnerships
The two major ride-hailing companies—Uber and Lyft—each have programs targeted at addressing employee mobility needs. These programs provide partnering employers with a free business account, access to an online dashboard that facilitates employee expense reimbursement and real-time reporting of program usage. Employees can choose to cover trips such as first/last mile access to transit, mid-day trips, late night trips, connections to remote offices, or business travel; these are settings customizable to every employer.
Little public information is available on their specific partnerships. One case study focuses on a financial company’s use of Uber for Business across global offices. When requesting a ride from their Uber app, employees can use one of their employer’s designated expense codes to automatically process reimbursement. The partnership enables the system to know automatically when a new employee joins or a current employee leaves. And, it bounds times of day in which employees are eligible for reimbursement—such as on late night weekdays.
Considerations for Dublin
Funding source and level of subsidy provided; the City will need to identify a balance between providing an attractive (and cost effective) service and constraining overuse
Willingness of employer partners to contribute to fare subsidies and/or set up individual partnerships
Availability of ride-hailing partners to serve the area at off-peak hours Vulnerability of funding source Parking management policies in Downtown Dublin and at employer sites may influence
employee demand
13 https://www.parkmerced.com/carfreeliving

DUBLIN MOBILITY STUDY | PHASE II REPORT CITY OF DUBLIN, OH
Nelson\Nygaard Consulting Associates, Inc. | 28
CONCEPTUAL RECOMMENDATIONS
A Job Access and Reverse Commute Shuttle Concept The following stop lists and service orientations are tentative, pending more information on local rider demand. The actual stop locations, including comfortable transfer locations, need to be identified, negotiated, and/or equipped with additional stop amenities to be viable. In addition, the shuttle would require ongoing coordination with COTA to facilitate transfers and ensure timely service delivery.
Nelson\Nygaard sees a potentially significant opportunity to characterize such a shuttle as a JARC (Job Access and Reverse Commute) service, indicating that this service meets the pattern of services that were formerly funded under the so-named FTA program.
Route Concept (bidirectional): The Shuttle concept is focused on the opportunity to facilitate seamless transfers with nearby COTA transit services. We propose a bidirectional shuttle with the following seven stop locations:
High Street & Dublin-Granville Road (COTA Route 2L transfer point in Worthington) Sawmill Road & Dublin-Granville Road (COTA Route 33 transfer point) Dublin Dale Drive Park-and-Ride (COTA Route 73 transfer point for peak-period trips) Bridge Park Avenue & Longshore Street Historic Dublin at High Street & Bridge Street Metro Center Ashland Chemical, at 5200 Blazer Parkway
Figure 20 Workforce Shuttle Route Concept
COTA Connections
Such routing would facilitate transfers with COTA service, primarily by strengthening connections between Dublin destinations and the intersection of Dublin-Granville Road and High Street in Worthington, an important transfer point for riders heading to the Columbus central business district. These connections would provide the opportunity for a single transfer between origin and destination, often described as a "two seat ride." The following are recommendations for shuttles connecting existing COTA routes to local Dublin destinations.

DUBLIN MOBILITY STUDY | PHASE II REPORT CITY OF DUBLIN, OH
Nelson\Nygaard Consulting Associates, Inc. | 29
Figure 21 COTA Bus Service in or Near Dublin
Source: Parkmerced
Route 2L Connector
Under this proposal:
Shuttle makes timed connection with Limited Stop Route 2L in Worthington at High Street & Dublin-Granville Rd., every 30 minutes.
COTA’s Route 2L, on High Street in Worthington, is the closest transit corridor to Dublin that provides relatively frequent service, at 30-minute headways, 19 hours per day, seven days a week. Route 2L is limited-stop for most of its running time between downtown Columbus and Dublin-Granville Road. In facilitating transfers at High Street & Dublin-Granville Road, the shuttle enhances first/last mile connections between central Columbus and Dublin’s hotels, employment centers, and other reverse-commute destinations.
Route 33 Connector
Under this proposal:
Shuttle makes timed connection with Route 33 on Sawmill Road at Dublin-Granville Rd. and Metro-Center every 30 minutes.
The shuttle provides some service redundancy with COTA Route 33, whose western service branch provides service between Metro Center, Historic Dublin, Bridge Park, and destinations in northwest Columbus at 60-minute headways. Route 33’s eastern service branch serves Sawmill Road between Dublin-Granville Road and Summer Drive, along Dublin’s eastern border. The route’s two service branches join at Sawmill Road & Dublin-Granville Road. Route 33 connects to Route 2 and 2L at High Street & Henderson Road, in Columbus, providing Dubliners with a two-seat ride to downtown. Under this proposal, the shuttle makes timed connections with COTA Route 33 at Sawmill Road & Dublin-Granville Road every 30 minutes. The shuttle also makes timed connections every 30 minutes at High Street & Dublin-Granville Road, in Worthington. Under these conditions, a 2-seat ride to downtown Columbus is available at both locations at twice the existing frequency, or every 15 minutes.

DUBLIN MOBILITY STUDY | PHASE II REPORT CITY OF DUBLIN, OH
Nelson\Nygaard Consulting Associates, Inc. | 30
Route 73 Connector
Under this proposal:
Shuttle makes timed connection with Route 73 at Dale Drive in peak hours. Shuttle provides connection between Route 73 and employment destinations, downtown
Dublin, Metro Center hotels, Ashland Chemical, Emerald Parkway, for people working nights (from downtown in evening, to downtown in morning).
The shuttle would provide important first/last-mile connections for riders of COTA Route 73, a peak-period service that operates on weekdays, as an express service operating on I-270 and U.S. Highway 33, between Dublin and Downtown Columbus. Route 73 provides eight daily trips in the peak-direction (to downtown Columbus in the AM, to Dublin in the PM) and three daily trips in the reverse-peak direction (to Dublin in the AM, to Columbus in the PM). There is no off-peak service on Route 73, between roughly 9 a.m. and 3 p.m. Under this proposal, the shuttle makes timed connections with Route 73 at the Dale Drive park-and-ride, every 30 minutes. During peak hours, this service provides first/last-mile connections between Route 73 and Dublin employment centers, including Metro Center, Historic Dublin, Ashland Chemical, and the Sawmill Road corridor. During off-peak hours, the shuttle ensures that the mixed-use Bridge Park community remains connected to both a two-seat (no more than one transfer) ride to downtown Columbus as well as other Dublin destinations, even when COTA Route 73 is not operating.
Funding Sources
The implementation of the circulator fits the mold of a public good—it often operates with a subsidy to support its mission, which in turn, can generate new economic activity and support local prosperity. Though operating at a loss, a public good like a circulator, streetscape, or public space, can enhance the overall economic climate, which in many cases, can outweigh the costs. However, quantifying the potential economic benefits of a public good is challenging given data limitations, the complexities of local economies, and determination of causality.
The table below provides a list of potential federal, state, and public-private partnership funding options that could be used to support a Dublin circulator service. Federal sources are administered locally through the Mid-Ohio Regional Planning Commission (MORPC).
Figure 22 Federal, State, Regional, & Private Funding Resources
Program Name
Description Eligible Agencies Eligible Activities
Federal Grants FTA 5339 Buses and Bus Facilities Grants Program
Replace, rehabilitate, and purchase transit vehicles and related equipment
Construct transit-related facilities Federal share is 80%; local match is 20%
Public transportation operators State and local government
entities
Capital
FTA 5339(c) Low or No Emission Vehicle Program
Purchase or lease of zero-emission and low-emission transit buses as well as acquisition, construction, and leasing of necessary supporting facilities
Public transportation operators State and local government
entities
Capital
FTA 5307 Urbanized Area Formula Funding program
Support for capital projects, operating assistance, job access and reverse commute projects, and for transportation-related planning
Federal share is 80%; local match is 20%
Public agencies Planning Capital Operating
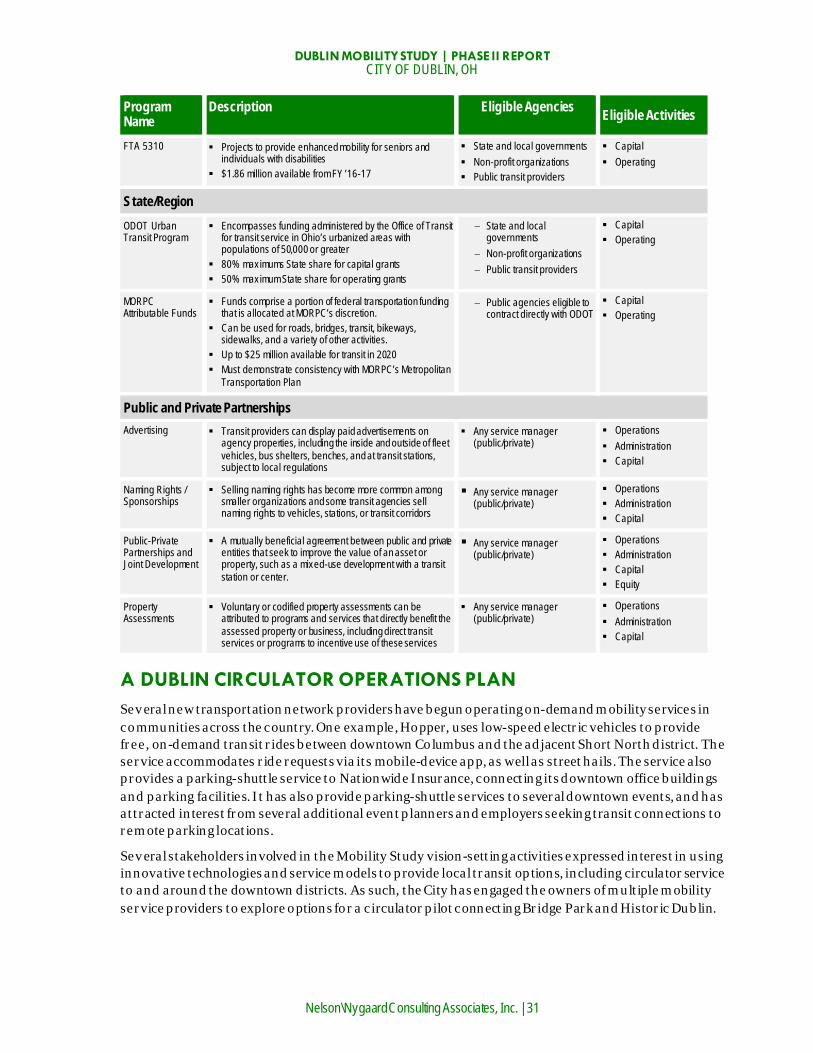
DUBLIN MOBILITY STUDY | PHASE II REPORT CITY OF DUBLIN, OH
Nelson\Nygaard Consulting Associates, Inc. | 31
Program Name
Description Eligible Agencies Eligible Activities
FTA 5310 Projects to provide enhanced mobility for seniors and individuals with disabilities
$1.86 million available from FY ’16-17
State and local governments Non-profit organizations Public transit providers
Capital Operating
State/Region ODOT Urban Transit Program
Encompasses funding administered by the Office of Transit for transit service in Ohio’s urbanized areas with populations of 50,000 or greater
80% maximums State share for capital grants 50% maximum State share for operating grants
− State and local governments
− Non-profit organizations − Public transit providers
Capital Operating
MORPC Attributable Funds
Funds comprise a portion of federal transportation funding that is allocated at MORPC’s discretion.
Can be used for roads, bridges, transit, bikeways, sidewalks, and a variety of other activities.
Up to $25 million available for transit in 2020 Must demonstrate consistency with MORPC’s Metropolitan
Transportation Plan
− Public agencies eligible to contract directly with ODOT
Capital Operating
Public and Private Partnerships Advertising Transit providers can display paid advertisements on
agency properties, including the inside and outside of fleet vehicles, bus shelters, benches, and at transit stations, subject to local regulations
Any service manager (public/private)
Operations Administration Capital
Naming Rights / Sponsorships
Selling naming rights has become more common among smaller organizations and some transit agencies sell naming rights to vehicles, stations, or transit corridors
Any service manager (public/private)
Operations Administration Capital
Public-Private Partnerships and Joint Development
A mutually beneficial agreement between public and private entities that seek to improve the value of an asset or property, such as a mixed-use development with a transit station or center.
Any service manager (public/private)
Operations Administration Capital Equity
Property Assessments
Voluntary or codified property assessments can be attributed to programs and services that directly benefit the assessed property or business, including direct transit services or programs to incentive use of these services
Any service manager (public/private)
Operations Administration Capital
A DUBLIN CIRCULATOR OPERATIONS PLAN Several new transportation network providers have begun operating on-demand mobility services in communities across the country. One example, Hopper, uses low-speed electric vehicles to provide free, on-demand transit rides between downtown Columbus and the adjacent Short North district. The service accommodates ride requests via its mobile-device app, as well as street hails. The service also provides a parking-shuttle service to Nationwide Insurance, connecting its downtown office buildings and parking facilities. It has also provide parking-shuttle services to several downtown events, and has attracted interest from several additional event planners and employers seeking transit connections to remote parking locations.
Several stakeholders involved in the Mobility Study vision-setting activities expressed interest in using innovative technologies and service models to provide local transit options, including circulator service to and around the downtown districts. As such, the City has engaged the owners of multiple mobility service providers to explore options for a circulator pilot connecting Bridge Park and Historic Dublin.

DUBLIN MOBILITY STUDY | PHASE II REPORT CITY OF DUBLIN, OH
Nelson\Nygaard Consulting Associates, Inc. | 32
Business Plan
Three key goals should guide service levels for the proposed circulator service. Given the nature of these services, Nelson\Nygaard proposes a “plan-do-check-act” approach. We are currently in the “plan” phase, in which we identify the key issues the pilot seeks to address and the service characteristics we propose to address them. Once launched—the “do” phase—the business plan provides a framework for monitoring, which enables the “check” phase. The following table lists the proposed measures of success, and a second section describes the approach to gathering relevant data and evaluating the service.
Pilot Goals and Success Metrics
Figure 23 Pilot Goals and Success Metrics
Goal Measures of Success
Goal 1: Amenities Provide mobility amenity to employees and visitors in Downtown Dublin and residents of Bridge Park development
Passengers per hour (target: 20) Customers satisfaction with service (target: 4.2 out of
5 stars)
Goal 2: Viability Test viability of ad-supported circulator business model in Dublin
Monthly ad revenue as a percent of total operational cost (note: operational costs do not include cost of drivers, who are paid through tips)
Month 3 target: 50% Month 6 target: 75% Average Downtown spend of customers using
Hopper (target: $15)
Goal 3: Choices Assess mode shift potential to avail existing Downtown parking for development opportunities
Mode shift (SOV reduction) for intra-service zone trips (Downtown and Bridge Park)
Month 3 target: 2% Month 6 target: 5% Average number of destinations visited per downtown
visit (target: 1.5)
Evaluation Methodology
To ensure the pilot service has continual opportunities for improvement, we envision three key checkpoints. Each will hinge on a variety of data sources to be collected from staff throughout the pilot:
Month 3 – performance metrics to be calculated within two weeks with service change proposals ready to be implemented by start of Month 4
Month 6 – performance metrics to be calculated at the start of the 6th month the City of Dublin and representatives from the service provider will review the performance metrics and collaborative to decide the feasibility of continuing the service.
Figure 24 Evaluation Methodology
Goal Measures of Success Target Evaluation Instrument
1 - Amenities Passengers per hour 20 pax/hr
Drivers track ridership in-app. Pickups geotagged and timestamped. Paper tracking is a back-up if this driver
app feature is infeasible.

DUBLIN MOBILITY STUDY | PHASE II REPORT CITY OF DUBLIN, OH
Nelson\Nygaard Consulting Associates, Inc. | 33
Goal Measures of Success Target Evaluation Instrument
Customer satisfaction with service
4.2 / 5 stars
Collect star rating in-app. Active notification post-trip requesting
customer to submit a rating. Recommend adding an app feature that
allows riders to rate trip after pickup.
2 – Viability
Monthly ad revenue as a percent of total operational cost
Month 3 target: 50% Month 6 target: 75%
Operator to report in service agreement.
Average Downtown spend of customers using Hopper
$15 per visit Customer survey at 3, 6, and 12 months. Ideally implemented in-app. Intercept survey as back-up.
3 – Choices
Mode shift (SOV reduction) for intra-service zone trips (Downtown and Bridge Park)
Month 3 target: 2% Month 6 target: 5%
Customer survey at 3, 6, and 12 months running one week each.
Ideally implemented in-app. Intercept survey as back-up. − Would you have made this trip had
the service not been available to you? − How would you have taken this trip if
the service did not exist? (walk, bike, carpool, drive alone, taxi or ride-hail, would not have taken this trip)
Average number of destinations visited per downtown visit
1.5 destinations per visit
Customer survey at 3, 6, and 12 months running one week each.
Ideally implemented in-app. Intercept survey as back-up. − How many destinations did you visit on
today’s trip Downtown Dublin/Bridge Park? (1, 2, 3, 4, 5 or more)
Pilot Service Parameters
To meet these three service goals, we recommend the following key service parameters.
Service Area
The purpose of the new service is to provide a mobility amenity to visitors, residents, and employees of Historic Dublin and Bridge Park (Downtown Dublin), with added connectivity to nearby employment centers. The proposed service area covers these zones. Due to the current operating regulations on Bridge Street and Riverside Drive, some operators may not be able to serve all areas. The following diagram describes conceptual service links. Actual routes and modes would be determined as part of a thorough transit design process.

DUBLIN MOBILITY STUDY | PHASE II REPORT CITY OF DUBLIN, OH
Nelson\Nygaard Consulting Associates, Inc. | 34
Figure 25 Proposed Service Area
Service Model
If operated on a demand-response basis, pickups and drop-offs would be allowed anywhere within this zone based on requests through the app. If significant demand generators could be determined (or would be revealed through an initial demand-response three-month pilot), the service could operate as a fixed-route/fixed-schedule service with high frequency.
In the case of a demand-responsive service, unoccupied vehicles should circulate, rather than layover, in order to increase visibility of the service.
Stops/Demand Generators
We recommend designating key demand generation hubs within Downtown Dublin (West Service Area) and East Bridge Street District (East Service Area). Two to three hubs on either side of the Scioto River could be feasible, located at points where curb access is convenient. Traditionally, we would rely on existing/proposed residential and employment densities and high-traffic destinations to identify
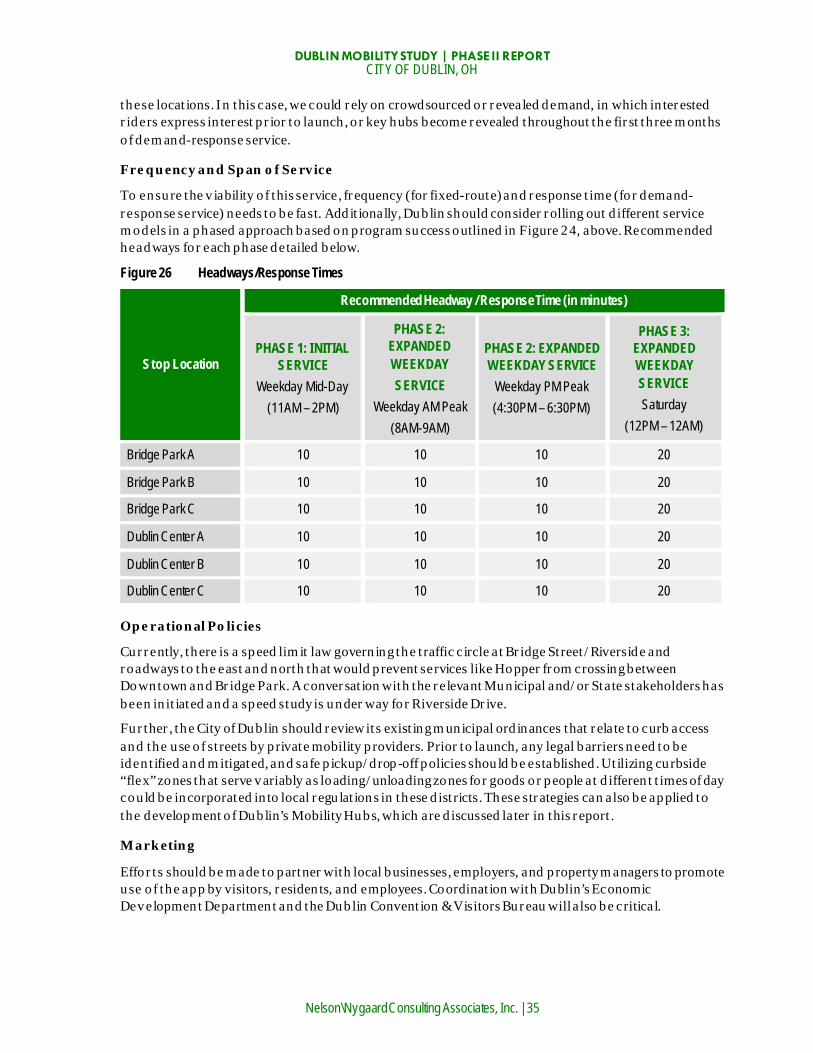
DUBLIN MOBILITY STUDY | PHASE II REPORT CITY OF DUBLIN, OH
Nelson\Nygaard Consulting Associates, Inc. | 35
these locations. In this case, we could rely on crowdsourced or revealed demand, in which interested riders express interest prior to launch, or key hubs become revealed throughout the first three months of demand-response service.
Frequency and Span of Service
To ensure the v iability of this service, frequency (for fixed-route) and response time (for demand-response service) needs to be fast. Additionally, Dublin should consider rolling out different service models in a phased approach based on program success outlined in Figure 24, above. Recommended headways for each phase detailed below.
Figure 26 Headways/Response Times
Stop Location
Recommended Headway / Response Time (in minutes)
PHASE 1: INITIAL SERVICE
Weekday Mid-Day (11AM – 2PM)
PHASE 2: EXPANDED WEEKDAY SERVICE
Weekday AM Peak (8AM-9AM)
PHASE 2: EXPANDED WEEKDAY SERVICE
Weekday PM Peak (4:30PM – 6:30PM)
PHASE 3: EXPANDED WEEKDAY SERVICE Saturday
(12PM – 12AM)
Bridge Park A 10 10 10 20
Bridge Park B 10 10 10 20
Bridge Park C 10 10 10 20
Dublin Center A 10 10 10 20
Dublin Center B 10 10 10 20
Dublin Center C 10 10 10 20
Operational Policies
Currently, there is a speed limit law governing the traffic circle at Bridge Street/Riverside and roadways to the east and north that would prevent services like Hopper from crossing between Downtown and Bridge Park. A conversation with the relevant Municipal and/or State stakeholders has been initiated and a speed study is under way for Riverside Drive.
Further, the City of Dublin should review its existing municipal ordinances that relate to curb access and the use of streets by private mobility providers. Prior to launch, any legal barriers need to be identified and mitigated, and safe pickup/drop-off policies should be established. Utilizing curbside “flex” zones that serve variably as loading/unloading zones for goods or people at different times of day could be incorporated into local regulations in these districts. These strategies can also be applied to the development of Dublin’s Mobility Hubs, which are discussed later in this report.
Marketing
Efforts should be made to partner with local businesses, employers, and property managers to promote use of the app by visitors, residents, and employees. Coordination with Dublin’s Economic Development Department and the Dublin Convention & Visitors Bureau will also be critical.

DUBLIN MOBILITY STUDY | PHASE II REPORT CITY OF DUBLIN, OH
Nelson\Nygaard Consulting Associates, Inc. | 36
Funding Opportunities
As a pilot, the circulator service would be funded through the service provider, presumably utilizing advertising revenue and customer tips. The funding options outlined in Figure 17 could be explored during the pilot period to uncover additional sources of support for ongoing operations.
Service Level Agreement (SLA)
To begin implementing a pilot service, we recommend outlining priority service needs with the selected operator through a Service Level Agreement (SLA). An SLA is useful in helping two parties agree on particular aspects of the service – quality, availability, and the split of responsibilities, such as pickup/drop-off safety. The service parameters outlined above provide examples of criteria to be included in an SLA. Additionally, any rules of City rights-of-way use that apply to operators should be included in legal documentation, as deemed necessary by the City of Dublin legal team.
IMPLEMENTATION & NEXT STEPS City council has reaffirmed their commitment to the mobility strategies outlined in this report and allocated funds within the Capital Improvement Program (CIP) for implementation. Establishing a Downtown Circulator service, as well as a Senior/Disabled and Access to Jobs circulator/shuttle service, via vendor pilot program, will be the focus of Phase III of the Mobility Plan. Attention could be given here to the current COTA analysis of commuter shuttles in the region. The opportunity for collaboration with MORPC’s Gohio Commute and downtown Columbus’s C-Pass transit incentive program (the “Dublin D-Pass”) could also be explored during this next phase.
A Memorandum of Understanding and /or Service Level Agreement language will be developed to allow the City to initiate a downtown circulator pilot, to be operated by a selected vendor, at no cost to the City.
The Senior/Disabled service pilot program will be in coordination with Dublin’s Aging in Place efforts, local senior living communities, and the Volunteer Services Department, who all currently facilitate ad-hoc transportation services. The Senior/Disabled service will focus on transportation to destinations that can enhance quality of life, such as the local branch of the Columbus Metropolitan Library, local restaurants, or shopping destinations.
An Access to Jobs (workforce) pilot program will be coordinated with the City of Dublin Economic Development team and will complement their efforts to attract and retain businesses and employees. Coordination with COTA and its First/Last mile initiatives will be ongoing, sharing data on ridership, employment locations, shift schedules, and the opportunity for a Dublin/COTA universal pass program (D-Pass). Collaboration with MORPC and inclusion in their Gohio Commute programs will be facilitated as part of implementation.

DUBLIN MOBILITY STUDY | PHASE II REPORT CITY OF DUBLIN, OH
Nelson\Nygaard Consulting Associates, Inc. | 37
BIKE SHARE Bike share systems are increasingly popular mobility options provided by a variety of public and private partners to facilitate healthy, affordable, local trips. In many places, they are treated as an extension of the public transportation network, with fare structures that are similar to or, in some places, are linked to traditional transit fare cards. In other places, they are used more as a recreational or v isitor amenity. Bike share has become an expected option throughout the United States and abroad with systems ranging in size from 2 stations to more than 700. According to the National Association of City Transportation Officials (NACTO), there were more 35 million bike share trips taken in the U.S. in 2017.14 The rapid spread of dockless operators over the past two years has made bike share an option for a far broader range of locales, with lower barriers to entry and more flexible implementation options. Yet, while the number of bikes between docked and dockless systems is now roughly equal, the vast majority of trips are still taken on docked system bikes.
Figure 27 Supply Versus Ridership
CONVENTIONAL DOCK-BASED BIKE SHARE Bike share programs provide short-term use of bicycles from a shared fleet distributed across a defined service area. Typically, a user can either become a member or pay per use (at a kiosk or online); in some cases, members use a member card or a transit fare card to check out a bicycle. Occasional users can pay with a credit card at kiosks. Damage or theft of bicycles is minimized by linking accounts to a user’s credit card and tracking the bikes via GPS.
14 https://nacto.org/bike-share-statistics-2017/

DUBLIN MOBILITY STUDY | PHASE II REPORT CITY OF DUBLIN, OH
Nelson\Nygaard Consulting Associates, Inc. | 38
Ty pically, the first half hour of bicycle use is free with the membership or covered by the occasional use fee; rides longer than 30 minutes tend to cost more. This pricing scheme incentivizes short trips and the availability of bicycles, making commuters a key market for most programs.
In a dock-based system, the rental exchange occurs at the docking point. All trips start and end at a docking point, several of which are distributed across the service area at prominent destinations. These stations are equipped with payment kiosks, locking mechanisms, and technologies to send station occupancy/utilization information to system software, tracking maps, and smartphone apps.
Most established, formal bike share systems in North America have followed this model. The following table summarizes the key advantages and challenges associated with this service model.
Figure 28 Advantages and Challenges of the Dock-Based Systems
Advantages Challenges/Issues
Proven technology backed by several years of performance data
Operators tend to have deep experience and understanding to ensure smooth operations and responses to issues
Docks and kiosks provide high-visibility advertising space
Docks are clearly identifiable for wayfinding and access/use
Iconic, predictable, and reliable station locations Familiar to tourists from other cities
Capital costs can be significant Less flexibility in where users can dock bicycles
(relies on dense network of stations) Can require substantial rebalancing effort with high
commuter use during peak periods Potential for proprietary issues with docks, bicycles,
and technology equipment (e.g. kiosks, mobile apps, etc.)
Wireless internet connectivity outages and solar power disruptions can interrupt an entire station
May be less suitable for a lower-density setting with fewer prominent trip generators
GPS technology can be added on bikes for an additional cost
Bike share has proven effective in improving transit commutes, by providing a new resource for addressing "first-mile/last-mile" gaps between transit stations, homes, and workplaces. Bike share programs are an effective means of reducing vehicle miles of travel (VMT) and parking demand in urban areas. Researchers have estimated that bike share is responsible for declines in VMT of between 7 and 21 percent among members surveyed in several large cities.15 Bike share can also function as a local circulator service, connecting area destinations and parking options separated by distances beyond typical walking ranges.
CoGo, Columbus
In Columbus, the CoGo Bike Share system features 46 stations and 365 bikes across the City. CoGo is operated by Motivate, a full-service bike share operator and technology provider who manages the largest U.S. systems and several others globally. Station density is key to dock-based system utility and CoGo’s stations are therefore concentrated in a roughly 6 square mile area, between Ohio State University and German Village. Passes are available for periods of 24 hours ($8), 3 days ($18) or a full y ear ($75). Each option comes with an unlimited number of 30-minute rides, with additional fees accruing if a single trip lasts longer than 30 minutes. Options are available for corporate memberships and bulk pass purchase. Significant system expansion is planned in 2018, potentially adding 50% more stations and reaching a broader geography of Columbus neighborhoods and adjacent municipalities.
15 Fishman, Eliott, Washington, Simon. & Haworth, Narelle. 2014. “Bikeshare’s impact on car use: Evidence from the United States, Great Britain, and Australia.” Transportation Research Part D. 31: 13– 20. . DOI:10.1016/j.trd.2014.05 .013.

DUBLIN MOBILITY STUDY | PHASE II REPORT CITY OF DUBLIN, OH
Nelson\Nygaard Consulting Associates, Inc. | 39
Figure 29 CoGo Bike Share in Columbus
Zagster, Ohio State University
Also in Columbus, Zagster operates a 20 station system on the Ohio State University campus. The Zagster model focuses on “smart” bikes and light station infrastructure, leading to lower cost implementation and more location flexibility. The system’s 115 bikes include 100 “cruiser” bikes and 15 accessible bikes, which serve users with a variety of abilities. Discounted annual rates are available to OSU students ($35) and faculty ($55), while visitors can choose from a day pass ($6) or annual rate $75). Rides can last up to 2 hours on weekdays and 3 hours on weekends.
Figure 30 Zagster Bike Share at OSU
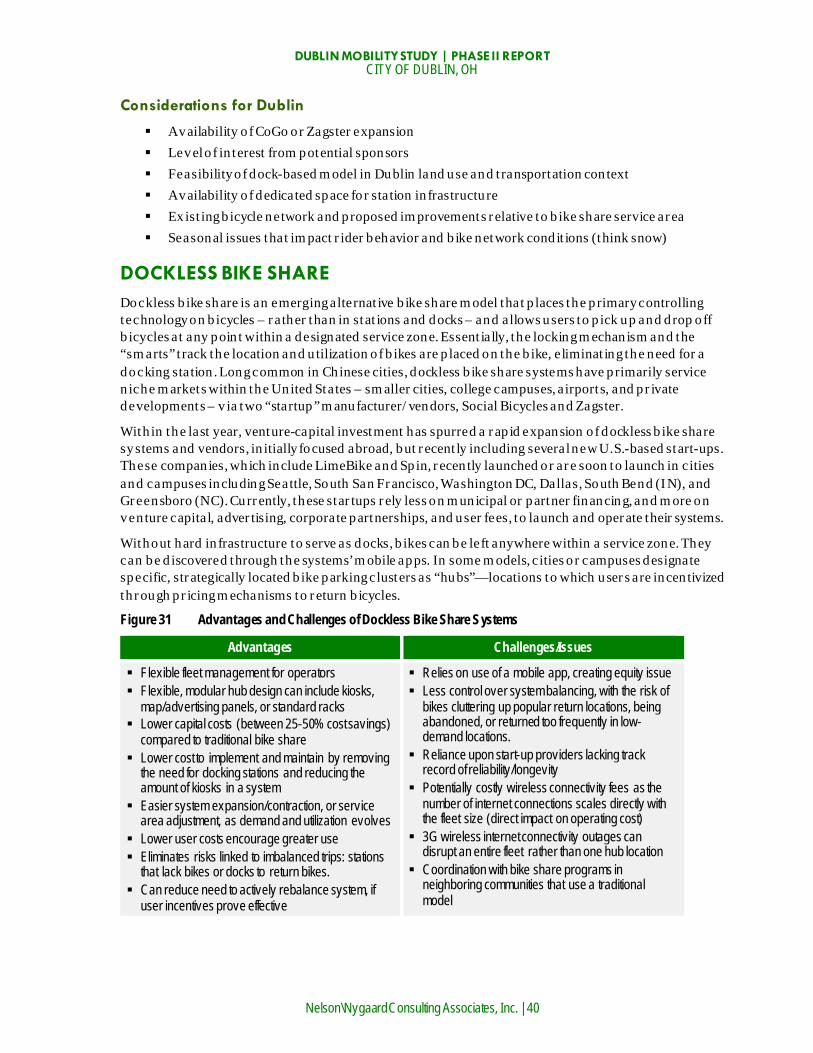
DUBLIN MOBILITY STUDY | PHASE II REPORT CITY OF DUBLIN, OH
Nelson\Nygaard Consulting Associates, Inc. | 40
Considerations for Dublin
Availability of CoGo or Zagster expansion Level of interest from potential sponsors Feasibility of dock-based model in Dublin land use and transportation context Availability of dedicated space for station infrastructure Existing bicycle network and proposed improvements relative to bike share service area Seasonal issues that impact rider behavior and bike network conditions (think snow)
DOCKLESS BIKE SHARE Dockless bike share is an emerging alternative bike share model that places the primary controlling technology on bicycles – rather than in stations and docks – and allows users to pick up and drop off bicycles at any point within a designated service zone. Essentially, the locking mechanism and the “smarts” track the location and utilization of bikes are placed on the bike, eliminating the need for a docking station. Long common in Chinese cities, dockless bike share systems have primarily service niche markets within the United States – smaller cities, college campuses, airports, and private developments – v ia two “startup” manufacturer/vendors, Social Bicycles and Zagster.
Within the last year, venture-capital investment has spurred a rapid expansion of dockless bike share sy stems and vendors, initially focused abroad, but recently including several new U.S.-based start-ups. These companies, which include LimeBike and Spin, recently launched or are soon to launch in cities and campuses including Seattle, South San Francisco, Washington DC, Dallas, South Bend (IN), and Greensboro (NC). Currently, these startups rely less on municipal or partner financing, and more on venture capital, advertising, corporate partnerships, and user fees, to launch and operate their systems.
Without hard infrastructure to serve as docks, bikes can be left anywhere within a service zone. They can be discovered through the systems’ mobile apps. In some models, cities or campuses designate specific, strategically located bike parking clusters as “hubs”— locations to which users are incentivized through pricing mechanisms to return bicycles.
Figure 31 Advantages and Challenges of Dockless Bike Share Systems
Advantages Challenges/Issues
Flexible fleet management for operators Flexible, modular hub design can include kiosks,
map/advertising panels, or standard racks Lower capital costs (between 25-50% cost savings)
compared to traditional bike share Lower cost to implement and maintain by removing
the need for docking stations and reducing the amount of kiosks in a system
Easier system expansion/contraction, or service area adjustment, as demand and utilization evolves
Lower user costs encourage greater use Eliminates risks linked to imbalanced trips: stations
that lack bikes or docks to return bikes. Can reduce need to actively rebalance system, if
user incentives prove effective
Relies on use of a mobile app, creating equity issue Less control over system balancing, with the risk of
bikes cluttering up popular return locations, being abandoned, or returned too frequently in low-demand locations.
Reliance upon start-up providers lacking track record of reliability/longevity
Potentially costly wireless connectivity fees as the number of internet connections scales directly with the fleet size (direct impact on operating cost)
3G wireless internet connectivity outages can disrupt an entire fleet rather than one hub location
Coordination with bike share programs in neighboring communities that use a traditional model

DUBLIN MOBILITY STUDY | PHASE II REPORT CITY OF DUBLIN, OH
Nelson\Nygaard Consulting Associates, Inc. | 41
Considerations for Dublin
Potential cost savings over docked model for both users and system sponsors Offers a point-to-point, flexible mobility option Likelihood of CoGo expansion to Dublin could negate need for dockless system Existing bicycle network and proposed improvements relative to bike share service area Availability of operational funding for bike share is unclear Seasonal issues that impact rider behavior and bike network conditions (think snow) Uncertainty in new bike share systems/operators who rely on user fees for operations
COMPARISON Each approach clearly has a mix of benefits and challenges. The table below compares traditional docked and smart bike docked systems with purely dockless systems.
Figure 32 Docked and Dockless Bike Share System Comparison
Docked Systems Dockless Systems
Technology Smart Dock System: Technology (e.g. communications, payment, etc) resides in dock kiosks, which tend to be fixed infrastructure.
Smart Bike System: Technology resides in the bikes, which can be parked at designated docks or within geo-hubs (geo-fenced areas, similar to a dockless system)
Smart Bike System: Technology resides in bikes, which can be parked anywhere.
Communication and Equipment Providers (not exhaustive)
Social Bicycles (Sobi): San Mateo, CA; Portland, OR, Atlanta, GA; University of Virginia Zagster: 200+ locations including small towns and businesses B-Cycle: Philadelphia, Los Angeles Motivate: (Bay Area, Boston, Chicago, New York)
LimeBike: South San Francisco, Scottdale, Durham, Dallas, Seattle Jump (owned by Social Bicycles): San Francisco, Washington DC, Spin: Seattle, Washington DC Ofo: Seattle, Dallas, Miami, Denver, Washington DC, Scottsdale Pace (owned by Zagster): Tallahassee
Operators (not exhaustive)
Motivate: (Bay Area, Boston, Chicago, New York) Zagster Contracting agencies
Apparently Same as communication and equipment providers
Membership Historically requires annual, weekly, or daily membership Options available, but no requirement for daily or ongoing membership, per trip charge
Parking Can be difficult to find space for docking stations in rights-of-way
Can use regular bike racks or designated docks
Disruptive and mobile system allows quick and unpermitted bike distribution; companies may provide guidance to users on proper parking etiquette and may

DUBLIN MOBILITY STUDY | PHASE II REPORT CITY OF DUBLIN, OH
Nelson\Nygaard Consulting Associates, Inc. | 42
Docked Systems Dockless Systems be required by cities with permitting processes to enforce
RFPs and Contracts
Contractual relationship with city results in enforceable commitments to system coverage, data sharing, and service quality Operators are experienced in responding to RFPs
No or limited contractual relationship with cities; rules regarding rebalancing unproven Most recently, operators deploy equipment rapidly and sometimes without permit for proof of concept and profit
Safety Great safety record16 Unproven safety record
Equipment Smart-dock stations have robust equipment
Smart-bikes may have higher maintenance costs than smart-dock systems due to wear and tear of bikes
Haven’t yet had to demonstrate their maintenance plan and bikes are not built to last
Permitting Coordinated permitting of public space through established legislative processes
Several cities adopted new dockless bike share permitting processes in 2017, but most have no formal process
Costs Higher capital costs due to smart dock system, installation, and operating costs System typically requires sponsorship
Lower capital costs for system launch; potential higher cost due to wear and tear on smart-bikes
No cost to municipality; currently, dockless companies rely on user revenues and venture capital
End of Trip End of trip is typically the closest station to a destination
End of trip is typically the closest station to a destination or a designated geo-fenced area. These can be temporary, i.e., a temporary large geo-fenced area at a concert that will attract many trips.
End of trip is at the destination of the rider
User Interaction
Can be unlocked with an app, or at kiosk, or on bike Can be unlocked with an app only; typically requires smartphone and linked credit card. Limebike now allows cash payments and a non-smart phone to access bikes on select systems.
Etiquette Docked stations lend clarity to what the bikes are and how to interact with the system
Relies on riders to be courteous on where bikes are left at end of trip; lack of kiosk may confuse
16 http://transweb.sjsu.edu/PDFs/research/1204-bikesharing-and-bicycle-safety.pdf

DUBLIN MOBILITY STUDY | PHASE II REPORT CITY OF DUBLIN, OH
Nelson\Nygaard Consulting Associates, Inc. | 43
Docked Systems Dockless Systems potential users on how to gain access
Penalties Undocked bikes have a financial penalty
The built-in GPS systems also allow flexibility with regard to pricing as fees—if any—can change based on where someone parks the free-floating, smart lock bike, or no fee if parked at the designated parking hub.
Operators can utilize preferred parking locations. Operators can reward or penalize riders for supporting or violating good behavior through a fee or a point reward system
Operations Manual rebalancing and equipment checks necessary for maintenance.
Since smart-bikes communicate with the operator when service is needed or are low on battery, potential delays of service can be reduced.
Since smart-bikes communicate with the operator when service is needed or are low on battery, potential delays of service can be reduced.
IMPLEMENTATION STEPS Dublin has entered into an MOU with the LimeBike Company to allow use of City right-of-way for dockless bike share operations, at no cost to the City. Several local businesses and hotels are also participating in this pilot program.
Developing the MOU took approximately 9 months and included input from Dublin staff in the following divisions: Police, City Manager’s office, Planning, Engineering, Parks & Recreation, Volunteer Services, GIS, and Events. The Wellness Manager, Community Services Advisory Committee (CSAC), Bike Advisory Team (now BFCAT), and Dublin Visitor and Convention Bureau (DVCB) also contributed to the process.
The MOU defines the terms of use of the Shared-use-Paths (SUP), identifies preferred bike parking locations, data sharing and reporting requirements, and number of bikes to be deployed (250). Additional contingencies include options for increasing or decreasing the number of bikes, contacts and procedures for reporting issues, and responsible parties for issue resolution.
The bike share pilot was launched on May 5th at a Bike Day event with approximately 25 single-speed bikes on-hand. The program will continue to grow, adding bikes until it reaches the 250 pilot program maximum. It is anticipated that additional bikes will include 3-speed and electric-assist bikes.
A dashboard has been initiated for staff to review usage data. To date, over 900 riders have tried LimeBike and have completed over 1 ,400 trips. The average distance ridden is 0.56 miles, with popular destinations including Bridge Park, Tuller Flats, the Rec Center, and the North Pool. Future reviews should include comparing results with like communities and understanding the financial sustainability of the pilot based on usage rates.

DUBLIN MOBILITY STUDY | PHASE II REPORT CITY OF DUBLIN, OH
Nelson\Nygaard Consulting Associates, Inc. | 44
WAYFINDING The City has worked with Kolar Design to develop vehicular wayfinding solutions and intends to re-engage on a Secondary Path (pedestrian/bicycle) wayfinding study. The study intent is to map the existing experience and develop recommendations for implementation. The study should include mapping of paths/sidewalks (existing and gaps), destinations, significant intersections, and points of conflict. Kolar will benchmark existing signs and industry best practices, and will outline opportunities for smart signs and mobile and VR interaction, such as the use of Snaptags technology. Recommendations will include details regarding placement, brand consistency, scale, pedestrian experience, iconography, and text.
Based on the recommendations the City will engage a consultant to provide construction drawings, vendor bidding, and construction oversight. The study is anticipated to take approximately 6 months, with implementation in late spring 2019.

DUBLIN MOBILITY STUDY | PHASE II REPORT CITY OF DUBLIN, OH
Nelson\Nygaard Consulting Associates, Inc. | 45
MOBILITY HUBS Elevating multimodal travel options in Dublin will require successful implementation of several of the strategies outlined in the previous sections. A final mobility strategy serves as a confluence point between each of them, where information, services, and infrastructure come together in key locations to provide improved access and mobility options to people visiting, living, or working in Dublin.
Mobility hubs are multimodal transportation connection points designed to integrate independent mobility networks and services to make these resources more v iable as primary and connected means of transportation. The mobility hub concept originated as branded public spaces designed and programmed to integrate travel modes with information to guide trip planning and mode-selection.
The first mobility hubs were largely focused on addressing “first-mile/last-mile” gaps, particularly related to connections to and from mass transit services. Providing immediate access to taxis, car-share services, and bike parking/networks gave those alighting buses and trains reliable options for completing their trips. Likewise, these options provided a range of options for getting to stops and stations without driving oneself and having to secure parking.
Figure 33 Customers Using Information Kiosk in Bremen, Germany
Image Source: www.carsharing.de
The concept has proven broadly useful, however, to call attention to points of intersection between two or more travel modes, and to reduce barriers to their regular use. As emerging mobility options increasingly diversify travel options in more places, and as technology makes it increasingly easier to find immediate information on and access to these options, informal mobility hubs are emerging across many of our communities. A bus rider who hails a Ly ft ride upon receiving notice of a bus delay is one example of an informal mobility hub in action.

DUBLIN MOBILITY STUDY | PHASE II REPORT CITY OF DUBLIN, OH
Nelson\Nygaard Consulting Associates, Inc. | 46
Figure 34 Mobility Hubs Can Be as Simple or as Complex as they Need to Be
Image Source: SANDAG
Mobility hubs can include a variety of multimodal infrastructure components customized for their location within the transportation network, and they can range from simple to complex in their range of features. For the purposes of this document, the term “mobility hub” refers to any intentional co-location of two or more publicly accessible travel modes within a public space or facility.
HUB ELEMENTS OVERVIEW To understand how simple and complex Mobility Hubs might be designed for a particular location within the Dublin community, the following table provides an overview of the mobility elements commonly considered for hub design and programming, appropriate land uses contexts and details on space requirements and infrastructure needs for each.

DUBLIN MOBILITY STUDY | PHASE II REPORT CITY OF DUBLIN, OH
Nelson\Nygaard Consulting Associates, Inc. | 47
Figure 35 Mobility Hub Elements Overview
Hub Elements Most Appropriate Hub Locations Typical Space Requirements Essential Infrastructure Needs
Bus/Circulator Stop
Employment centers, Tourist locations, Residential/Mixed-Use Developments, High Schools, Community Center, COTA P/R lots
Minimum of 200 SF
Shelter, bench, refuse receptacle, posted (digital or static) service information, lighting,
Bike Parking High Schools, Community Center, COTA P/R, Regional bike network connections
Minimum set-aside of 100 SF
Shelter, bike racks
Bike House Residential/Mixed-Use developments 1,500 SF Repair station, restrooms, showers/lockers Class B retail-space amenities
Bike share Station
Centers of employment, Centers of tourism, Residential/Mixed-Use Developments, High Schools, Community Center, Bus Stops
Minimum of 100 SF
10-20 bikes, wayfinding/signage, mobile app
Kiss-and-ride Bus Stops 200 SF of curbside space, when designated
Dedicated Curbside space (by time of day), Signage
Ride-Share Connection Points
Centers of employment, Centers of tourism, Residential/Mixed-Use developments, High Schools, Community Center, Bus Stops
200 SF per space
Dedicated parking (by time of day), Signage, Signage, WiFi to ensure connection to apps that facilitate ride-matching (e.g. Gohio)
Hailed-Ride Service Connection Point
Centers of employment, Centers of tourism, Residential/Mixed-Use Developments, High Schools, Community Center, COTA P/R lots
200 SF of curbside space, per parked vehicle
Dedicated Curbside space (by time of day), Signage
Car share Parking
Downtown Streets & Parking Facilities Minimum of 3 spaces @ 200 – 250 SF per space
Dedicated Curbside space, Signage
Ride-share Waiting Lounges
Residential/Mixed-Use Developments 250 SF of building-interior space
Standard retail-space amenities + Real-time transit information (e.g. TransitScreen, Roadify)
Mobility Kiosks Centers of tourism, Residential/Mixed-Use Developments, High Schools, Community Center
10 SF of sheltered space
Utility hookups (e.g. electric, Internet), internet connection, WiFi
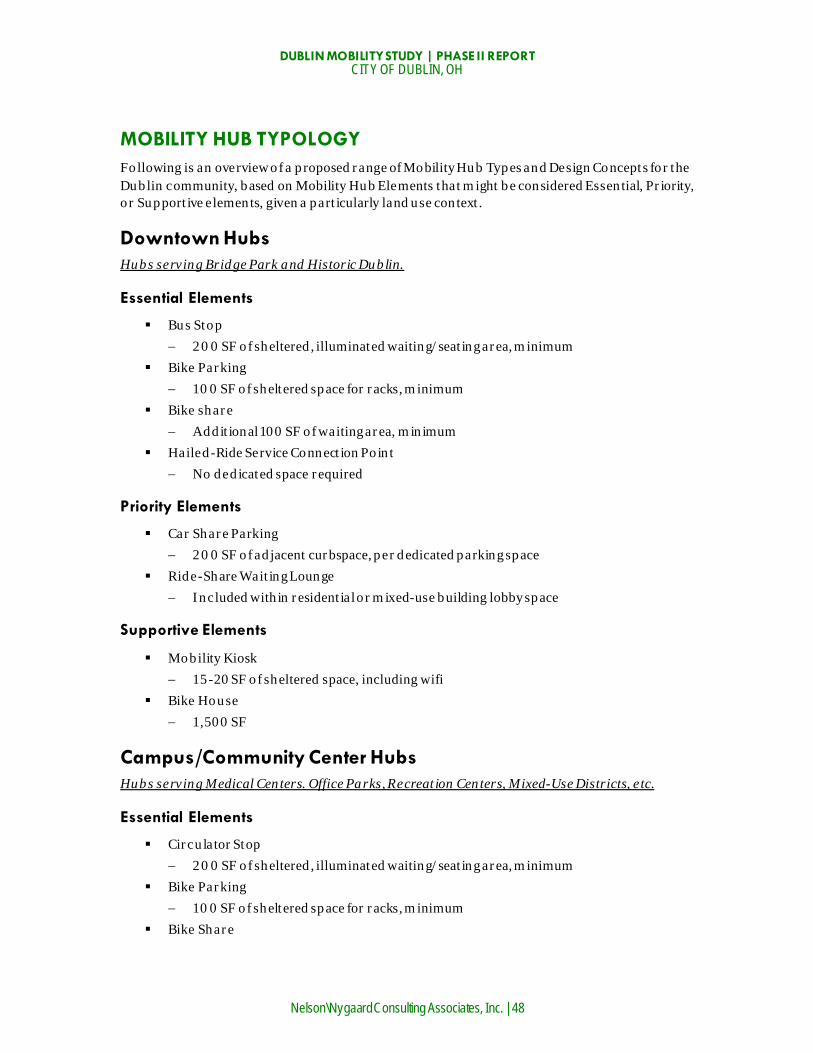
DUBLIN MOBILITY STUDY | PHASE II REPORT CITY OF DUBLIN, OH
Nelson\Nygaard Consulting Associates, Inc. | 48
MOBILITY HUB TYPOLOGY Following is an overview of a proposed range of Mobility Hub Types and Design Concepts for the Dublin community, based on Mobility Hub Elements that might be considered Essential, Priority, or Supportive elements, given a particularly land use context.
Downtown Hubs Hubs serving Bridge Park and Historic Dublin.
Essential Elements
Bus Stop − 200 SF of sheltered, illuminated waiting/seating area, minimum
Bike Parking − 100 SF of sheltered space for racks, minimum
Bike share − Additional 100 SF of waiting area, minimum
Hailed-Ride Service Connection Point − No dedicated space required
Priority Elements
Car Share Parking − 200 SF of adjacent curbspace, per dedicated parking space
Ride-Share Waiting Lounge − Included within residential or mixed-use building lobby space
Supportive Elements
Mobility Kiosk − 15-20 SF of sheltered space, including wifi
Bike House − 1 ,500 SF
Campus/Community Center Hubs Hubs serving Medical Centers. Office Parks, Recreation Centers, Mixed-Use Districts, etc.
Essential Elements
Circulator Stop − 200 SF of sheltered, illuminated waiting/seating area, minimum
Bike Parking − 100 SF of sheltered space for racks, minimum
Bike Share
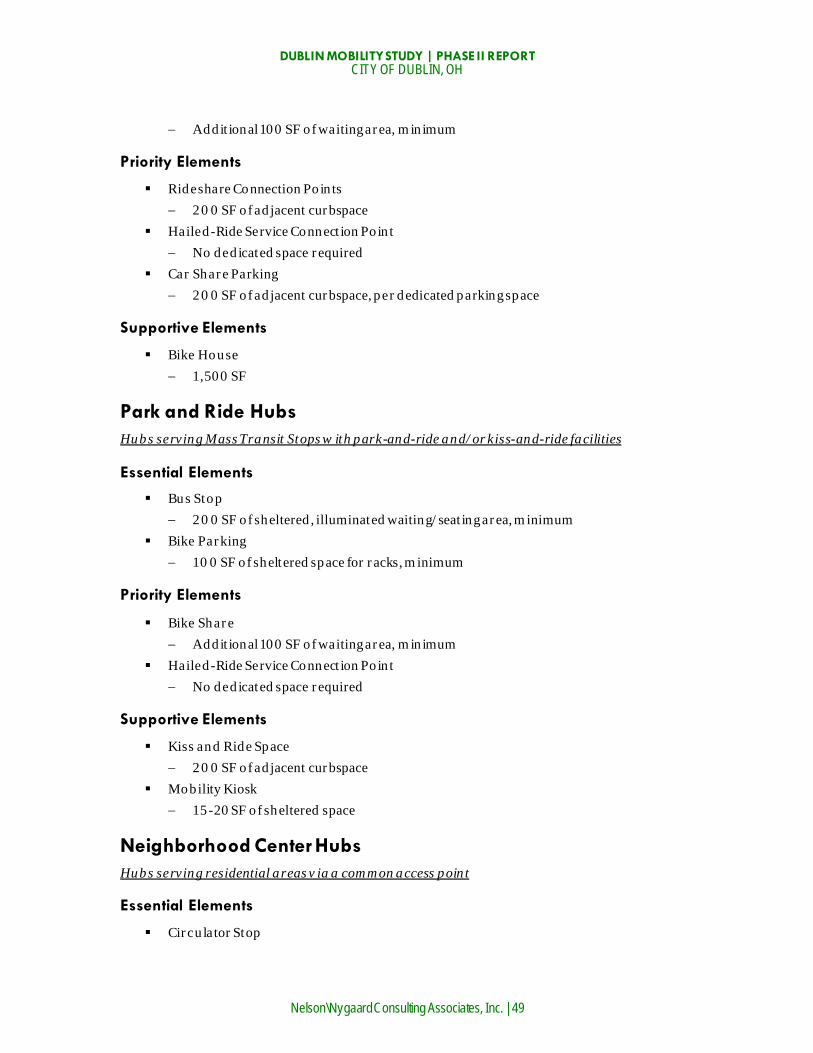
DUBLIN MOBILITY STUDY | PHASE II REPORT CITY OF DUBLIN, OH
Nelson\Nygaard Consulting Associates, Inc. | 49
− Additional 100 SF of waiting area, minimum
Priority Elements
Rideshare Connection Points − 200 SF of adjacent curbspace
Hailed-Ride Service Connection Point − No dedicated space required
Car Share Parking − 200 SF of adjacent curbspace, per dedicated parking space
Supportive Elements
Bike House − 1 ,500 SF
Park and Ride Hubs Hubs serving Mass Transit Stops with park-and-ride and/or kiss-and-ride facilities
Essential Elements
Bus Stop − 200 SF of sheltered, illuminated waiting/seating area, minimum
Bike Parking − 100 SF of sheltered space for racks, minimum
Priority Elements
Bike Share − Additional 100 SF of waiting area, minimum
Hailed-Ride Service Connection Point − No dedicated space required
Supportive Elements
Kiss and Ride Space − 200 SF of adjacent curbspace
Mobility Kiosk − 15-20 SF of sheltered space
Neighborhood Center Hubs Hubs serving residential areas via a common access point
Essential Elements
Circulator Stop
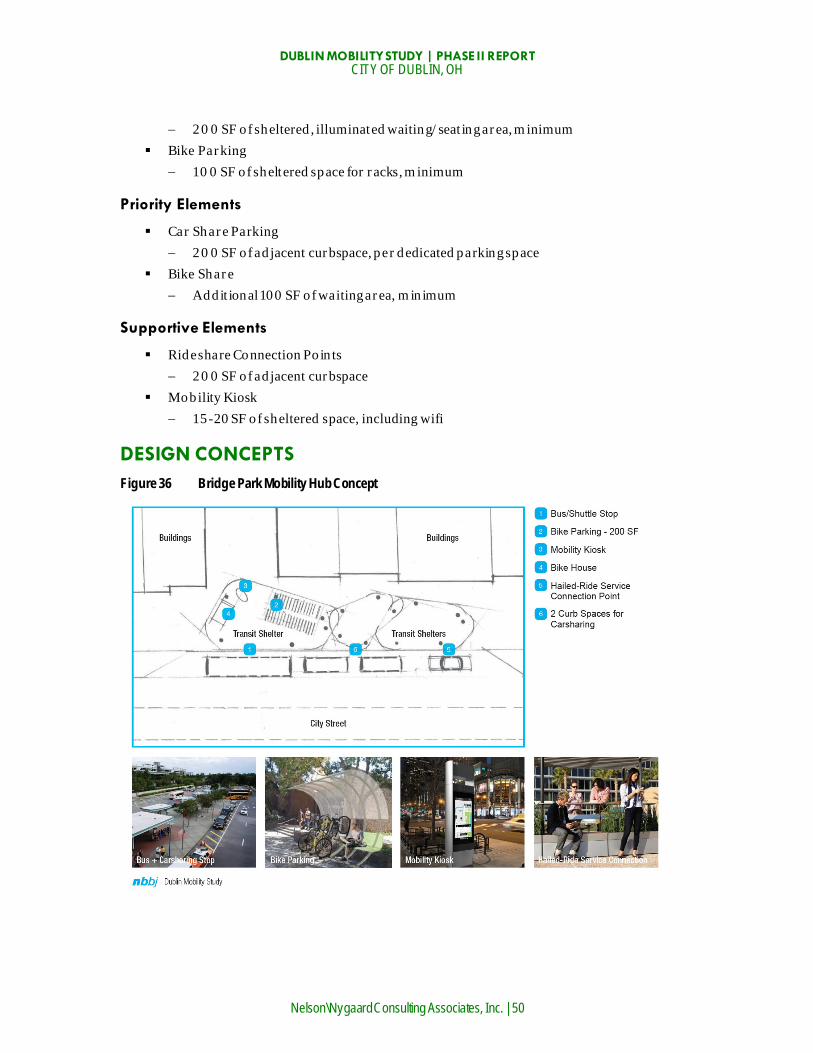
DUBLIN MOBILITY STUDY | PHASE II REPORT CITY OF DUBLIN, OH
Nelson\Nygaard Consulting Associates, Inc. | 50
− 200 SF of sheltered, illuminated waiting/seating area, minimum Bike Parking
− 100 SF of sheltered space for racks, minimum
Priority Elements
Car Share Parking − 200 SF of adjacent curbspace, per dedicated parking space
Bike Share − Additional 100 SF of waiting area, minimum
Supportive Elements
Rideshare Connection Points − 200 SF of adjacent curbspace
Mobility Kiosk − 15-20 SF of sheltered space, including wifi
DESIGN CONCEPTS Figure 36 Bridge Park Mobility Hub Concept

DUBLIN MOBILITY STUDY | PHASE II REPORT CITY OF DUBLIN, OH
Nelson\Nygaard Consulting Associates, Inc. | 51
Figure 37 Campus - Community Center Mobility Hub
Figure 38 Neighborhood Center Mobility Hub