
Driving value - PwC · Driving value 4 2015 Midyear Automotive M&A Insights Global automotive –...
16
www.pwc.com/auto Driving value: 2015 Midyear Automotive M&A Insights In this issue 2 Welcome 3 Key trends at a glance 4 2015—first half review 7 Insights into regions 9 Analyzing industry segments 11 Who’s buying: Financial versus Trade buyers 13 The road ahead 14 Contact information
Transcript of Driving value - PwC · Driving value 4 2015 Midyear Automotive M&A Insights Global automotive –...

www.pwc.com/auto
Driving value:2015 Midyear Automotive M&A Insights
In this issue
2 Welcome
3 Key trends at a glance
4 2015—first half review
7 Insights into regions
9 Analyzing industry segments
11 Who’s buying: Financial versus Trade buyers
13 The road ahead
14 Contact information

Driving value 2 2015 Midyear Automotive M&A Insights
We are pleased to present Driving Value: 2015 Midyear Automotive M&A Insights, PwC’s review of mergers and acquisitions (M&A) activity and key trends impacting the global automotive industry.
In this edition, we look at:
• The status of global automotive deal activity amongst vehicle manufacturers, suppliers, financiers, and other related sectors
• Key trends that impacted the deal market
• Transaction activity by sector and region
• Our perspective on the journey to the future
This latest edition is meant to serve only as a preface to the insights and observations that we can provide to drive successful transactions. M&A leaders in the automotive and financial sectors frequently turn to us for advice on potential transactions and the strategies underpinning those deals. Your feedback is important to us, and we welcome the opportunity to provide you with a deeper look into any of these trends that may be of benefit to your organization.
Paul G. Elie
PwC US Automotive Deals Leader
+1 (313) 394 3517
Welcome

Driving value 3 2015 Midyear Automotive M&A Insights
Global automotive deal volume grew by
10% closing276
$34.1 billionin global automotive deal value
Key trends at a glance Automotive
$449million highest in over 10 years
Predicted global automotive assembly growth 2015
2021
3.5% CAGR
Vehicle Manufactuers’ deal value declined to
billion
$4.1 billion$26.6
$20 billion
megadeals
$12.5 billion
Financial buyers share of
global automotive M&A
activity increased to 31%
compared to 26% in 2014
50%TOP 10 DEALSTARGETED ASIAN ASSETS
COMPONENT SUPPLIERS
consecutive increase
Global cross-sector M&A volume increased
7Source: Thomson Reuters and other publicly available resources.
5th
ZF Friedrichshafen AG acquisition of TRW Automotive Holdings Corp—largest deal since 2007
with a total aggregated disclosed value of
deals in first half 2015 compared to 2014 24% from first half of 2014 Average global
automotive deal size
HIGHEST DISCLOSED AVERAGE FIRST HALF DEAL VALUE IN 10 YEARS
58% 2014from
Up
10% in 2015compared to 2014
deal value soared to 97%
and
$13.4 2014
from 2014
billion compared to

Driving value 4 2015 Midyear Automotive M&A Insights
Global automotive – strong midyear results
Automotive M&A deal volume for the first half of 2015 was up ten percent, further extending gains made in the first half of 2014. With 276 deals, the industry saw its highest volume of deals transacted since 2011 and slightly below pre-recession levels.
In many respects, the financial strength of the automotive industry is back. This is evidenced by deal value increasing by 24% in the first half of 2015 up to $34.1 billion, the highest value of deals in the past decade (excluding the United States Treasury facilitated investments in 2009). Much of this increase in deal value is driven by seven megadeals with a total aggregated disclosed value of $26.6 billion, the largest of which was ZF Friedrichshafen AG’s $12.5 billion acquisition of TRW Automotive Holdings Corp.
In the first half of 2015, average global automotive deal size increased 58% from $284 million to $449 million. This also marks the highest average deal value in the past decade and four times its low in 2012.
Further, the number of megadeals increased from five to seven in the first half of 2015. Continuing the trend from the first half of 2014, larger megadeals have led to a significant increase in overall average deal value in the first half of 2015.
H1 2015 181 days—276 deals— $34.1 billion total aggregate disclosed value
0
20
40
60
80
100
120
140
160
180
H1 2015H1 2014 H1 2013H1 2012H1 2011H1 2010
<$100 mn $100 mn–$1 bn >$1 bn
Source: Thomson Reuters and other publicly available sources.
56
13
751178370
32
73
16
$127
5
7$203
Average deal size (R-Axis)
Dea
l vo
lum
e o
f d
iscl
ose
d d
eal v
alue
Averag
e disclo
sed d
eal value ($bn)
0
50
100
150
200
250
300
350
400
450
500
$99
$17117
$449
244
192
5
$284
Global Automotive M&A Deals by Disclosed Value H1 2010–H1 2015
Source: Thomson Reuters and other publicly available resources
0
5
10
15
20
25
30
35
40
H1 2015H1 2014H1 2013H1 2012H1 2011H1 2010H1 2009H1 20080
50
100
150
200
250
300
350
Disclosed deal value UST Facilitated investments
Source: Thomson Reuters and other publicly available sources.
282257 265
303
264
222
276
Deal volume (R-Axis)
Dis
clo
sed
dea
l val
ue ($
bn)
Deal vo
lume
$16 $24.2
$7.5
$11.6 $18.8 $10.6 $13.1 $27.5 $34.1
250
Global Automotive M&A Deal Volume and Value H1 2008–H1 2015
Source: Thomson Reuters and other publicly available resources
First half 2015

Driving value 5 2015 Midyear Automotive M&A Insights
Cross-Sector M&A
Global cross-sector M&A activity shows similar trends as global automotive M&A with regards to increases in deal volume and value. As evidenced in the chart below, global cross-sector M&A is continually trending upward, approaching 2008 levels. In 2015, both deal volume and value increased by 10% and 40% respectively.
0.0
0.2
0.4
0.6
0.8
1.0
1.2
1.4
1.6
H1 2015H1 2014H1 2013H1 2012H1 2011H1 2010H1 2009H1 20080
2
4
6
8
10
12
14
16
18
20
Disclosed deal value
Source: Thomson Reuters and other publicly available sources.
1615
13.6
15
Deal volume (R-Axis)
Deal vo
lume (tho
usands)
$1.45 $0.81 $0.91 $1.30 $0.93 $0.98 $1.01 $1.41
12.9
1615.1
18.7
Dis
clo
sed
dea
l val
ue ($
trn)
Global Automotive M&A Deals by Disclosed Value H1 2008–H1 2015
Source: Thomson Reuters and other publicly available resources
Global light vehicle assembly outlook
Ass
emb
ly v
olu
mes
(mill
ions
)
Deal vo
lume
Automotive M&A deal volume (FY14 projection)
Source: PwC Autofacts 2014 Q3 Data Release, Thomson Reuters and other publicly available sources, PwC Analysis
20
30
40
50
60
70
80
90
100
110
20212020201920182017201620152014201320122011201020092008200720062005200420032002
5556 58
63 65 6669
58
7275
8084 86 89
9398
102106 107 109
621588
515
584 594 604
520
594
490465
543
597
200
300
400
500
600
700
800
900
549532
2015–2021 CAGR = 3.5%
Global Automotive M&A Deals by Disclosed Value H1 2002–H1 2021
Source: Thomson Reuters and other publicly available resources
Automotive Assembly – Steady Growth Pace Despite Obstacles
While global assembly continues to grow at a modest pace, economic volatility, political uncertainty and to a lesser extent, vehicle recalls affect the overall assembly outlook. We’ve noted that mature markets are sustaining global growth despite the accelerated decline in markets like Brazil and Russia. PwC’s Autofacts reports that
long-term outlooks are still positive, however, recent setbacks in Brazil and Russia, along with a slowdown in China, have caused volatility in the industry’s near-term growth plans. According to PwC Autofacts, the industry is expected to add 20.0 million units of production between 2015 and 2021 for a compounded annual growth rate (CAGR) of 3.5%.
Following up on a very strong 2014, North America’s total production volumes
continue to grow due to new investments in expanding capacity at existing plants as well as new plants.
Despite economic challenges in Europe due to hectic discussions about overall stability of the European banking system, higher foreign demand will help drive automakers to raise their output further, and is expected to improve overall utilization and industry profitability. The European Union forecasted assembly in 2015 of 17.6 million units, which is up 5.1% year-over-year.
Driving value 6 2015 Midyear Automotive M&A Insights
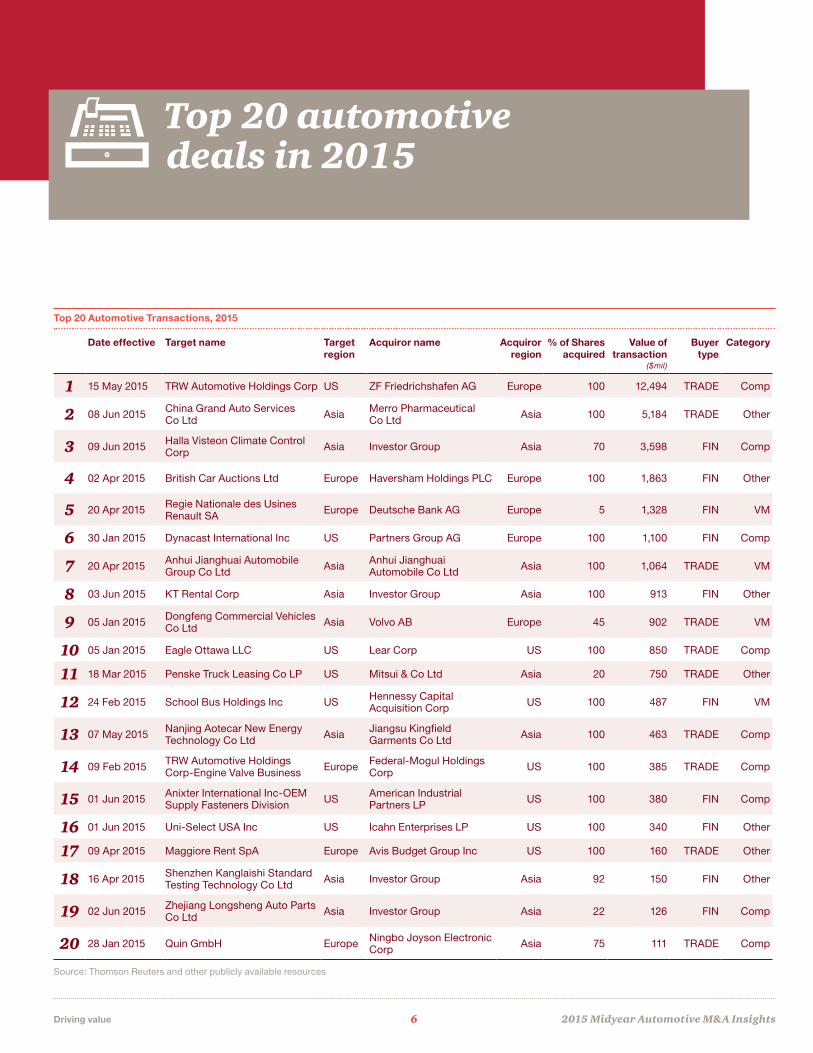
Top 20 automotive deals in 2015
Top 20 Automotive Transactions, 2015
Date effective Target name Target region
Acquiror name Acquiror region
% of Shares acquired
Value of transaction
($mil)
Buyer type
Category
1 15 May 2015 TRW Automotive Holdings Corp US ZF Friedrichshafen AG Europe 100 12,494 TRADE Comp
2 08 Jun 2015 China Grand Auto Services Co Ltd Asia Merro Pharmaceutical
Co Ltd Asia 100 5,184 TRADE Other
3 09 Jun 2015 Halla Visteon Climate Control Corp Asia Investor Group Asia 70 3,598 FIN Comp
4 02 Apr 2015 British Car Auctions Ltd Europe Haversham Holdings PLC Europe 100 1,863 FIN Other
5 20 Apr 2015 Regie Nationale des Usines Renault SA Europe Deutsche Bank AG Europe 5 1,328 FIN VM
6 30 Jan 2015 Dynacast International Inc US Partners Group AG Europe 100 1,100 FIN Comp
7 20 Apr 2015 Anhui Jianghuai Automobile Group Co Ltd Asia Anhui Jianghuai
Automobile Co Ltd Asia 100 1,064 TRADE VM
8 03 Jun 2015 KT Rental Corp Asia Investor Group Asia 100 913 FIN Other
9 05 Jan 2015 Dongfeng Commercial Vehicles Co Ltd Asia Volvo AB Europe 45 902 TRADE VM
10 05 Jan 2015 Eagle Ottawa LLC US Lear Corp US 100 850 TRADE Comp
11 18 Mar 2015 Penske Truck Leasing Co LP US Mitsui & Co Ltd Asia 20 750 TRADE Other
12 24 Feb 2015 School Bus Holdings Inc US Hennessy Capital Acquisition Corp US 100 487 FIN VM
13 07 May 2015 Nanjing Aotecar New Energy Technology Co Ltd Asia Jiangsu Kingfield
Garments Co Ltd Asia 100 463 TRADE Comp
14 09 Feb 2015 TRW Automotive Holdings Corp-Engine Valve Business Europe Federal-Mogul Holdings
Corp US 100 385 TRADE Comp
15 01 Jun 2015 Anixter International Inc-OEM Supply Fasteners Division US American Industrial
Partners LP US 100 380 FIN Comp
16 01 Jun 2015 Uni-Select USA Inc US Icahn Enterprises LP US 100 340 FIN Other
17 09 Apr 2015 Maggiore Rent SpA Europe Avis Budget Group Inc US 100 160 TRADE Other
18 16 Apr 2015 Shenzhen Kanglaishi Standard Testing Technology Co Ltd Asia Investor Group Asia 92 150 FIN Other
19 02 Jun 2015 Zhejiang Longsheng Auto Parts Co Ltd Asia Investor Group Asia 22 126 FIN Comp
20 28 Jan 2015 Quin GmbH Europe Ningbo Joyson Electronic Corp Asia 75 111 TRADE Comp
Source: Thomson Reuters and other publicly available resources

Driving value 7 2015 Midyear Automotive M&A Insights
Insights into regions
The big picture
Local deals (transactions by targets and acquirers within the same borders) dominated the M&A landscape again across all regions in the first half of 2015, as 83% of the total deals volume were local. Only 53% of deal value (or $17.94 billion) was attributable to these local deals; however, this is largely due to the cross-border transaction between ZF Friedrichshafen AG’s and TRW Automotive Holding Corp., which inflated the value of non-local deals.
Much of the movement in share of deal volume and value was between the United States, Europe, and Asia, while the Rest of the World remained relatively flat. United States, European, and Asian assets experienced the greatest benefit from the mega deals transacted in the first half of 2015, with all seven deals being with a United States, European or Asian target and/or acquirer.
North America
The United States continued its steady increases in share of deal volume by acquirer and target region, trailing only Europe in this regard. Share of deal volume by acquirer increased for the second consecutive year up to 33%, while share of deal volume by target increased for the third consecutive year up to 31%.
Europe
European activity was the most robust in the first half of 2015 with its share of deal volume by acquirer and target region (37% and 43%, respectively) being the highest since 2013.
Asia
While 50% of the top deals targeted Asian assets, the Asian region saw decreases in share of deal volume by both acquirer and target regions, continuing the pattern of decline seen over the past three years.
Source: PwC Analysis
Source: PwC Analysis
Source: PwC Analysis
Share of Deal Volume by Acquirer Region 2010-H1 2015
Share of Deal Volume by Target Region 2010-H1 2015
Source: Thomson Reuters and other publicly available sources
Source: Thomson Reuters and other publicly available sources
0%
10%
20%
30%
40%
50%
60%
70%
80%
90%
100%
H1 201520142013201220112010
27% 27% 33%
20% 23%27%
46%41%
31%
9% 9%
25%
25%
40%
10%
25%
30%
35%
10%23%
33%
37%
7%7%
Europe US Asia Row
Source: Thomson Reuters and other publicly available sources.
0%
10%
20%
30%
40%
50%
60%
70%
80%
90%
100%
H1 201520142013201220112010
Europe US Asia Row
Source: Thomson Reuters and other publicly available sources.
4% 7% 8%31% 28% 32%
20% 22%24%
45% 43%36%
8%
25%
24%
43%
8%
23%
29%
40%
7%19%
31%
43%

Driving value 8 2015 Midyear Automotive M&A Insights
Share of Disclosed Deal Value by Acquirer Region 2010-H1 2015
Share of Disclosed Deal Value by target Region 2010-H1 2015
Source: Thomson Reuters and other publicly available sources
Source: Thomson Reuters and other publicly available sources
Source: Thomson Reuters and other publicly available sources
0%
10%
20%
30%
40%
50%
60%
70%
80%
90%
100%
H1 201520142013201220112010
36%
2%
31%
31%
31%
24%
41%
4%
21%
31%
43%
5%46%
38%
12%
4%21%
39%
39%
1%39%
9%
52%
Europe US Asia Row
Source: Thomson Reuters and other publicly available sources.
0%
10%
20%
30%
40%
50%
60%
70%
80%
90%
100%
H1 201520142013201220112010
30%
45%
24%
2%
33%
26%
39%
2%
28%
22%
48%
2%
44%
12%
42%
49%
39%
12%
47%4%
35%
14%
1%
Europe US Asia Row
Source: Thomson Reuters and other publicly available sources.
USLocal: 78 deals, $2.34 billionInbound: 8 deals, $14.43 billionOutbound: 14 deals, $0.61 billion
Asia (Asia & Oceania)Local: 48 deals, $12.25 billionInbound: 4 deals, $0.90 billionOutbound: 16 deals, $1.09 billionRest of the World
Local: 10 deals, $0.001 billionInbound: 9 deals, $0.06 billionOutbound: 9 deals, No value disclosed
EuropeLocal: 93 deals, $3.35 billionInbound: 26 deals, $0.79 billionOutbound: 8 deals, $14.50 billion
Source: Thomson Reuters and other publicly available sources.

Driving value 9 2015 Midyear Automotive M&A Insights
The big pictureDeal value increased significantly in the first half of 2015 compared to first half of 2014 for Component Suppliers and Others with the largest increase ($9.9 billion) being with Component Suppliers, primarily driven by ZF Friedrichshafen AG’s acquisition of TRW Automotive Holdings Corp for $12.5 billion.
Components suppliersThis marks the fifth consecutive period of increasing deal value for Component Suppliers despite a 28% decrease in deal volume from the first half of 2014. The 97% increase in deal value, when compared to 2014, is driven by ZF Friedrichshafen AG’s acquisition of TRW Automotive Holdings Corp, which is the largest mega deal since 2007. Excluding this single megadeal, Component Suppliers deal value is down 26% to $7.5 million.
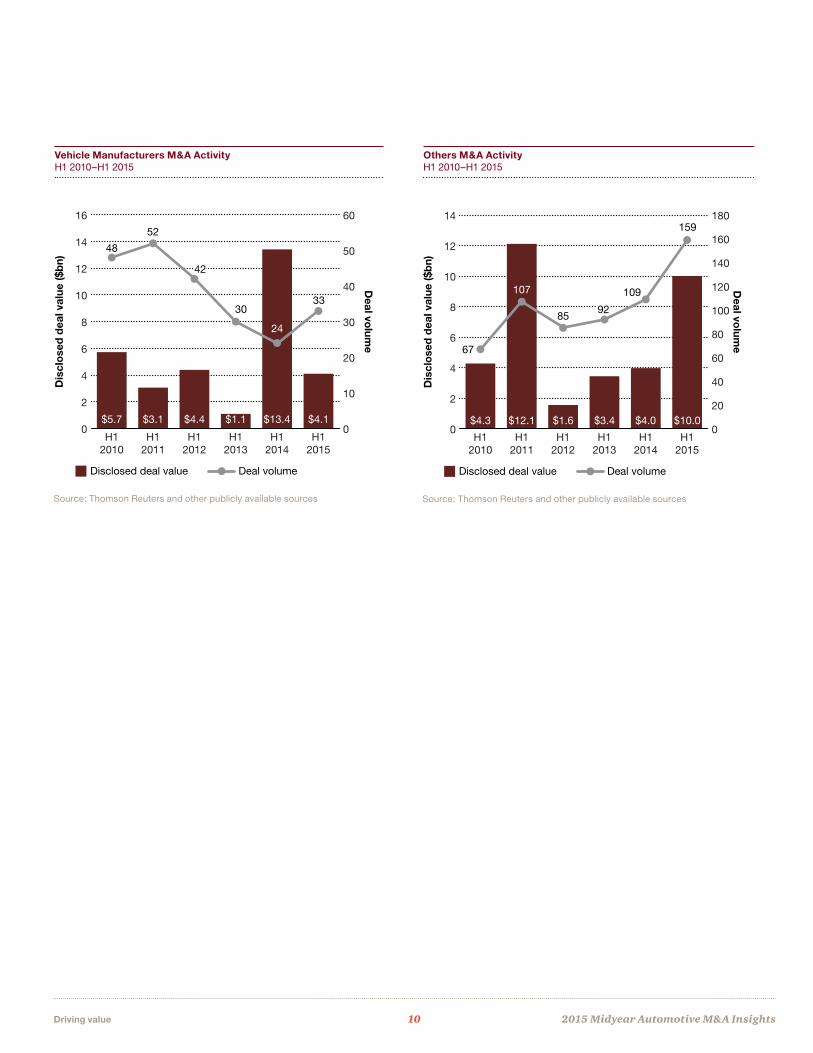
Vehicle manufacturersOn the other hand, Vehicle Manufacturers deal value decreased by 69% in the first half of 2015, falling back in line with pre-2013 numbers. The large spike in 2014 can be attributed primarily to two large mega deals with a total aggregate disclosed value of $11.9 billion that occurred in the first half of 2014.
Even so, deal volume amongst Vehicle Manufacturers actually increased by 38% in 2015 from the first half of 2014.
OthersThe Others category—including retail/dealership, aftermarket, rental/leasing and wholesale, etc. continues to recover after steady declines during the peak of the recession. This segment showed large gains in the first half of 2015 compared to the first half of 2014. Deal value increased by 152%, fueled by a 46% increase in deal volume and two megadeals totaling over $7 billion in value.
Component Suppliers M&A Activity H1 2010–H1 2015
Source: Thomson Reuters and other publicly available sources
Disclosed deal value
Dis
clo
sed
dea
l val
ue ($
bn)
Deal vo
lume
Deal volume
Source: Thomson Reuters and other publicly available sources.
0
5
10
15
20
25
100
84
137
0
20
40
60
80
100
120
140
160
H12015
H12014
H12013
H12012
H12011
H12010
150144
$1.6 $3.7 $4.7 $8.6 $10.1 $20.0
117
Analyzing industry segments
Driving value 10 2015 Midyear Automotive M&A Insights
Vehicle Manufacturers M&A Activity H1 2010–H1 2015
Others M&A Activity H1 2010–H1 2015
Source: Thomson Reuters and other publicly available sources Source: Thomson Reuters and other publicly available sources
Disclosed deal value
Dis
clo
sed
dea
l val
ue ($
bn)
Deal vo
lume
Deal volume
Source: Thomson Reuters and other publicly available sources.
0
2
4
6
8
10
12
14
16
3033
42
0
10
20
30
40
50
60
H12015
H12014
H12013
H12012
H12011
H12010
48
52
$5.7 $3.1 $4.4 $1.1 $13.4 $4.1
24
Disclosed deal value
Dis
clo
sed
dea
l val
ue ($
bn)
Deal vo
lume
Deal volume
Source: Thomson Reuters and other publicly available sources.
0
2
4
6
8
10
12
14159
85
0
20
40
60
80
100
120
140
160
180
H12015
H12014
H12013
H12012
H12011
H12010
67
107
$4.3 $12.1 $1.6 $3.4 $4.0 $10.0
109
92

Driving value 11 2015 Midyear Automotive M&A Insights
The big picture Financial buyers saw increases in the volume and value of deals initiated in the first half of 2015. Deal volume increased 33% and deal value by 174% as compared to the first half of 2014.
Financial buyers—Green lightFinancial buyers saw increases in both deal value and deal volume in first half of 2015. The increase in deal value is primarily driven by financial buyer’s representing three of the top five acquisitions for the first half of 2015, with the most significant being an acquisition of Halla Visteon Climate Control Corp.
Overall, financial buyers’ share of M&A activity increased for the second consecutive year to 31%, this is the highest over the review period.
Trade buyers—Green lightDeal value and deal volume remained steady for trade buyers for the first half of 2015 as compared to the first half of 2014. Volume increased 3% and value was flat.
The continued strong results by trade buyers’ was significantly driven by mega deals, as the two largest deals for 2015 were with trade buyers. The most significant mega deal being ZF Friedrichshafen AG’s acquisition of TRW Automotive Holdings Corp for $12.5 billion.
Financial Buyer M&A Activity H1 2010–H1 2015
Source: Thomson Reuters and other publicly available sources
Financial value
Dis
clo
sed
dea
l val
ue ($
bn)
Deal vo
lume
Financial volume (R-axis)
Source: Thomson Reuters and other publicly available sources.
0
2
4
6
8
10
12
H12015
H12014
H12013
H12012
H12011
H12010
46
58
0
10
20
30
40
50
60
70
80
90
7279
$4.3 $8.5 $1.3 $6.8 $4.0 $11.0
64
85
Who’s buying Financial vs. Trade buyers

Driving value 12 2015 Midyear Automotive M&A Insights
Trade Buyers M&A Activity H1 2010-H1 2015
Financial Buyer Share of M&A Activity H1 2010–H1 2015
Source: Thomson Reuters and other publicly available sourcesSource: Thomson Reuters and other publicly available sources
Trade value
Dis
clo
sed
dea
l val
ue ($
bn)
Deal vo
lume
Trade volume (R-axis)
Source: Thomson Reuters and other publicly available sources.
0
5
10
15
20
25
H12015
H12014
H12013
H12012
H12011
H12010
176
206
0
50
100
150
200
250
193
224
$7.2 $10.3 $9.3 $6.3 $23.5 $23.2
186 191
Financial Buyer Share of Total Value
Sha
re o
f M
&A
act
ivit
y
Source: Thomson Reuters and other publicly available sources.
Financial Buyer Share of Total Volume
0
10
20
30
40
50
60
H12015
H12014
H12013
H12012
H12011
H12010
21%22%
27%26%
37% 45% 12% 52% 15% 32%
31%
26%

Driving value 13 2015 Midyear Automotive M&A Insights
The Road Ahead
A positive outlook for Automotive M&AIt is all systems go for the automotive industry, where M&A activity has continued to heat up on the backs of a few strong years. The first half of 2015 brought further improvements to already strong numbers in both deal volume and value, driven by some of the largest megadeals seen in the last decade.
With robust automotive assembly outlook, PwC expects the M&A markets will continue to stay strong as companies continue to invest in R&D for next-gen technologies and innovation, and as the industry as a whole looks to consolidate after years of fragmentation.
These are the key factors that we anticipate will spark automotive M&A growth going forward:
• High levels of liquidity on corporate balance sheets
• Strategic initiatives to expand market share and grow customer, technology and product portfolios
• Strong economic recovery and pent-up demand in developed countries such as the US
• Financial investors will continue to see opportunities for growth in the automotive industry
The Road Ahead

Driving value 14 2015 Midyear Automotive M&A Insights
Contact us To have a deeper discussion about our point of view on automotive M&A, please contact:
Authors Automotive leadership
Automotive transaction services
Paul Elie PwC US, US Automotive Deals Leader
[email protected] +1 (313) 394 3517
Harry Gruits PwC US, Director, Automotive Transaction Services
[email protected] +1 (313) 394 3023
Christopher Becker PwC US, Senior Associate, Automotive Transaction Services
[email protected] +1 (313) 394 3237
Richard Hanna Global Automotive Leader
[email protected] +1 (313) 394 3450
Felix Kuhnert PwC Germany, European Automotive Leader
[email protected] +49 (711) 25034 3309
Hitoshi Kiuchi PwC Japan, Asia Pacific Automotive Leader
[email protected] +81 (0)80 3158 6934
Dietmar Ostermann Global Automotive Advisory Leader
[email protected] +1 (972) 672 4425
Evan Hirsh PwC US, US Automotive Advisory Leader
[email protected] +1 (312) 578 4725
Alexander Unfried Global Automotive Tax Leader
[email protected] +49 (711) 25034 3216
Humberto Tognelli PwC Brazil
[email protected] +55 (11) 3674 3855
Damiano Peluso PwC Canada
[email protected] +1 (416) 814 5776
Leon Qian PwC China
[email protected] +86 (10) 6533 2940
Tang Xun PwC China
[email protected] +86 (21) 2323 3396
Steven Perrin PwC France
[email protected] +33 (0)156 578 296
Martin Schwarzer PwC Germany
[email protected] +49 (0) 69 9585 5667
Sanjeev Krishan PwC India
[email protected] +91 (12) 4330 6017
Francesco Giordano PwC Italy
[email protected] +39 348 1505447
Taizo Iwashima PwC Japan
[email protected] +81 (3) 6266 5572
Jason Wakelam PwC UK
[email protected] +44 (0) 77 1471 1133
Paul Elie PwC US
[email protected] +1 (313) 394 3517

About PwC’s Automotive Practice
PwC’s global automotive practice leverages its extensive experience in the industry to help companies solve complex business challenges with efficiency and quality. One of PwC’s global automotive practice’s key competitive advantages is Autofacts®, a team of automotive industry specialists dedicated to ongoing analysis of sector trends. Autofacts provides our team of more than 5,000 automotive professionals and our clients with data and analysis to assess implications make recommendations, and support decisions to compete in the global marketplace.
About the Transaction Services Practice
The PwC’s Transaction Services practice provides due diligence on both the buy and sell side of a deal, along with advice on M&A strategy, valuation, accounting, financial reporting, and capital raising. For companies in distressed situations, we advise on crisis avoidance, financial and operational restructuring and bankruptcy. With approximately 1,000 deal professionals in 16 cities in the US and over 6,000 deal professionals in over 90 countries, experienced teams are deployed with deep industry and local market knowledge, and technical experience tailored to each client’s situation. Our field-proven, globally consistent, controlled deal process helps clients decrease minimize their risks, progress with the right deals, and capture value both at the deal table and after the deal closes.
About Autofacts®
Autofacts is a key strategic asset of PwC’s global automotive practice. Fully integrated with PwC’s more than 5,000 global automotive professionals, Autofacts provides ongoing auto industry analysis our clients use to shape business strategy, assess implications and support a variety of operational decisions. The Autofacts team also draws from the strengths of PwC’s marketing, sales and financial services groups to support other key areas of automotive companies’ functions. Since 1985, our market-tested approach, diverse service offerings and dedication to client service have made Autofacts a trusted advisor throughout the industry. For more information, visit www.autofacts.com.
Corporate financeDamian Peluso PwC Canada
[email protected] +1 (416) 814 5776
Martin Schwarzer PwC Germany
[email protected] +49 (0) 69 9585 5667
Marco Tanzi Marlotti PwC Italy
[email protected] +39 (02) 8064 6330
Taizo Iwashima PwC Japan
[email protected] +81 (3) 6266 5572
Darren Jukes PwC UK
[email protected] +44 (20) 7804 8555
Andrew Kanfer PwC US
[email protected] +1 (312) 298 3258
Visit our automotive industry website at www.pwc.com/auto
*Corporate finance services in the US are provided through PricewaterhouseCoopers Corporate Finance LLC (“PwC CF”). PwC CF is owned by PricewaterhouseCoopers LLP, a member firm of the PricewaterhouseCoopers Network, and is a member of FINRA and SIPC. PwC CF is not engaged in the practice of public accountancy. US persons, please contact the FINRA registered representatives noted with an *.
“PwC has been rated as an IDC MarketScape leader in Worldwide Strategy Consulting Services 2014 Vendor Assessment.”Source: IDC MarketScape: Worldwide Business Consulting Services 2015 Vendor Assessment (Doc #254320)

All dollar amounts are expressed in US dollars, unless otherwise noted.
This publication has been prepared for general guidance on matters of interest only, and does not constitute professional advice. You should not act upon the information contained in this publication without obtaining specific professional advice. No representation or warranty (express or implied) is given as to the accuracy or completeness of the information contained in this publication, and, to the extent permitted by law, PricewaterhouseCoopers LLP, its members, employees and agents do not accept or assume any liability, responsibility or duty of care for any consequences of you or anyone else acting, or refraining to act, in reliance on the information contained in this publication or for any decision based on it.
© 2015 PricewaterhouseCoopers LLP, a Delaware limited liability partnership. All rights reserved. PwC refers to the United States member firm, and may sometimes refer to the PwC network. Each member firm is a separate legal entity. Please see www.pwc.com/structure for further details. This content is for general information purposes only, and should not be used as a substitute for consultation with professional advisors.
83734-2016