Driving through the consumer’s mind Considerations for · PDF fileDriving through the...
28
Driving through the consumer’s mind Considerations for Car purchase February 2014 www.deloitte.com/in
Transcript of Driving through the consumer’s mind Considerations for · PDF fileDriving through the...

Driving through the consumer’s mind Considerations for Car purchase
February 2014www.deloitte.com/in

2
Key Terms 3
Introduction 4
About the Study 5
Purchase Drivers 6
Brand Considerations 12
Brand Perception 20
Conclusion 24
Appendix 25
Contacts 27
Contents

Driving through the consumer’s mind 3
Key Terms
Gen X Born between 1965 - 1976falling in the age group of 37 to 48 years
Gen YBorn between 1977-1994falling in the age group of 19 to 36 years
OEMOriginal equipment manufacturers

4
Introduction
Today, India stands as one of the top ten automotive markets in the world and is likely to scale-up to third position by 2020, thanks to the expanding middle-class population with buying potential. This expectation has already led to a number of key global Original Equipment Manufacturers (OEMs) to establish their operations in India.
In spite of the longer term promise, the OEMs have had to deal with a very sluggish market in the recent past. While some individual products have had spectacular success, the others are struggling to maintain volumes. In this context, we wanted to explore the purchase considerations that can potentially help the OEMs in targeting better. We also wanted to explore if there has been any behavioural change in the slow years that the marketers can take advantage or be wary of.
During the year 2013, we surveyed over 1800 respondents in India. This was a part of a global initiative where our survey covered over 23,000 people in 19 countries. We have used the responses received from the sample population in India alone to draw inferences and conclusions in this report.
While there were some respondents who did not own a vehicle or owned a two-wheeler, the sample
is significantly car owning and as a result is skewed towards the current geographical dispersion of car population in India. This results in the dominance of urban consumers in the sample size. Further, the sample may not represent the various brands proportionate to market share those brands may enjoy. Though we have attempted to cover a large cross-section of consumers, this random sample may have limitations of representing all the strata of car owners or car buyers. Please refer to the Appendix-1 for details of respondent profiles.
While analysing data or drawing inferences, we have taken only statistically significant data into consideration. As true to most surveys, the analysis presented in this report may be taken as directionally valid and may not accurately reflect the realities relating to a brand, customer category, etc. The reader is advised not to take the conclusions or the inferences drawn as professional counsel or assume these to be premises on which they would make decisions.
We hope that this report will help provide additional perspectives to OEMs in devising their marketing strategies to drive future growth.

Driving through the consumer’s mind 5
About the study
Based on the dataset we had, our endeavour was to answer the following:1. What are drivers for the new vehicle purchase
decision?2. How many brands are considered by the potential
consumers for vehicle purchase both car owners and non–owners?
3. What are the key attributes that consumers look in a vehicle during the purchase process?
We have attempted to answer the above questions as per the consumer decision making process illustrated below:
Purchase Drivers
Identify the drivers which may impact the vehicle purchase using the past purchasing behavior and next purchase inputs
Demographic factors such as age, gender, residential location etc.
# of brands in consideration set
Brands by vehicle price range
Key brands on different attributes
Past purchasing behavior
Current preferences & lifestyle
Next purchase considerations
Determine the consideration set for different consumer types and their requirements
Understand the perception of the brands in the consideration set and identify key attributes required in the vehicle
Consideration Set Brand Perception of Car Owners

6
Purchase Drivers

Driving through the consumer’s mind 7
Capturing the purchase triggers
First-time buyers
Unlike the developed markets where a car is bought to cater to an individual’s requirement, the Indian first time car buyer, looks to buy a car for his family primarily. Contrary to the popular belief that the car buyer is motivated by the opportunity to make a statement of success, it is interesting that this is a very rational and practical requirement. Given that the first time buyer has really no comparable reference, it is natural that this buying decision is not influenced by the ‘improvement of fuel efficiency’ factor.
Respondents from both Gen X and Gen Y categories have expressed similar requirements for their first car, irrespective of their gender.
Top Reasons for Vehicle Purchase
My familymembers or
dependents canuse it
Need for morespace/larger
vehicle
New technologyavailable
Can afford tobuy/lease
another vehicle
Improve fuelefficiency
Improvereliability
Purchasevehicle with a
betterbrand/image
8x
x
Rela
tive
scal
e w
ith r
espe
ct t
o Br
and
Imag
e(1
X=
% r
espo
nden
ts fo
r w
hom
Bra
nd im
age
acte
d as
pur
chas
e tr
igge
r)
0
1
2
3
4
5
6
7
8
9
Family needs is rated as the top trigger in purchase decision of a car, and is 8x more important as a trigger than better brand image.
This section covers the reasons the car buyers look to buy a car. It also explores the difference between the first- time and repeat buyers.

8
Once the decision to buy is made, the study reveals that the first-time buyers use reliability, the dealer services and resale value as filters while making brand choices. However, it was observed that female respondents attached less importance to reliability and dealer ability as compared to the male respondents.
Repeat buyers
0%
20%
40%
60%
80%
100%
Important
Overall Female Male Overall Female Male Overall Female Male Overall Female MaleDealership’s ability to repair and service
Ability to repair / service vehicle on your own
Re-sale value Reliability (e.g., low maintenance required)
% o
f Res
pond
ents
Rating of Attributes for Choosing a Vehicle (First time buyers)
Neutral Not Important
Note: Ratings / points were captured on a 5 point scale. Rating of 4 & 5 as important, 3 as neutral and 1&2 as not important
New technologyavailable
Need for more space/larger vehicle
My family members ordependents can use it
Can afford to buy/lease another vehicle
Improve fuel efficiency
Improvereliability
Purchase vehicle with abetter brand/image
Top Reasons for Vehicle Re-purchase
3x 3x
x
Rela
tive
scal
e w
ith r
espe
ct t
o Br
and
Imag
e(1
X=
% r
espo
nden
ts fo
r w
hom
Bra
nd
imag
e ac
ted
as p
urch
ase
trig
ger)
0
1
2
3
4
Technology and need for more space are rated as the top triggers in purchase decision of a car, and are 3x more important as a trigger than better brand image.

Driving through the consumer’s mind 9
Unlike the first time buyer, the repeat buyer understandably looks to upgrade, going by the reasons cited by the respondents. A more sophisticated product is the primary requirement. While most purchase drivers were common across the repeat buyers, the responses given by Gen X and Gen Y presented an interesting mix. While technology stood out as a ruling factor for Gen Y, Gen X gave precedence to larger space requirement. This trend held true irrespective of the respondent’s gender.
Interestingly, Gen X male alone have rated ‘can afford to buy’ as a reason ahead of the utility for family members, thereby suggesting their desire to use the car as a statement of success.
As is the case of first time buyers, the repeat buyers also use reliability, the dealer services and resale value as filters to making brand choices. However, the Gen X attached more importance to the vehicle reliability as compared to Gen Y.
Important
Overall Gen X Gen Y Overall Gen X Gen Y Overall Gen X Gen Y Overall Gen X Gen Y
Dealership’s ability to repair and service
Ability to repair / service vehicle on your own
Re-sale value Reliability (e.g., low maintenance required)
% o
f Res
pond
ents
Rating of Attributes for Choosing a Vehicle (Repeat buyers)
Neutral Not Important
0%
20%
40%
60%
80%
100%
Note: Ratings / points were captured on a 5 point scale. Rating of 4 & 5 as important, 3 as neutral and 1&2 as not important

10
Are the usage patterns undergoing changes?
The study suggests that the average time between purchases of two cars was almost 6-7 years.
Respondents considered changing their car after it had clocked a distance of 50,000 to 55,000 km.
While males typically drive a car for 55,000 km or more before making a new purchase, female consumers change cars after 45,000 km.
The distance consideration also varied between Gen X and Gen Y consumers, as the former preferred to change their cars after driving a longer distance as compared to the other sub-set.
Size of the vehicle also matters. Vehicles like van and wagons are driven for more than 60,000 km before changing.
It is perhaps understandable that consumer’s preferences change faster as the price of vehicles goes up.
Note: The average time between purchases has been calculated as the sum of the average vehicle age and average time to next vehicle purchase for each respondent. The total distance travelled per year has been calculated based on the average working travel time. It has been assumed that the number of working days per year is 300 days to accommodate the travel not related to work.
0
10
20
30
40
50
60
70
80
3.00
4.00
5.00
6.00
7.00
8.00
9.00
Overall Female Male Gen X Gen Y
Time & Distance between Purchases
Time Distance
Tim
e in
yea
rs (Y
ear)
Distance (‘000) km
The respondents provided the indication of the point of purchase which typically falls between 6 and 7 years after having travelled 50,000 to 55,000 kilometers

Driving through the consumer’s mind 11
Future usage trends
% o
f Tot
al R
equi
rem
ent
Tim
e in
Yea
rs
0%
20%
40%
60%
80%
100%
Current Usage Usage after 5 Years
PersonalCar Moped TaxiPvtCarpool RentalCar PublicCarPoolPublicTransportation
Increase in usage of personal cars by ~5% over the next 5 years
Bike Walking
6.3
5.6
5.20
5.40
5.60
5.80
6.00
6.20
6.40
Time Period betweenPurchases - Current
Time Period betweenPurchases - 5 years
later
Time Period between Vehicle PurchasesUsage of Transportation Means - Overall
Imp
act on P
urch
ase of N
ew V
ehicles
Note: The expected time period between purchases after 5 years has been calculated based on the change in the usage of personal cars from 35% to 40%. Considering that the distance between purchases typically remain same, the time period reduces in the same ratio as the increase in the usage (i.e. 40%/35% = 1.13)
Consequent to the increased usage, it is expected that the time for which people would own a car to reduce from the current 6+ years to about 5.5 years.
The share of the personal car is expected to increase over the next five years, at the cost of other mobility solutions. This increased usage is driven largely by Gen Y and women drivers

12
Brand consideration

Driving through the consumer’s mind 13
Mapping the consumer mindset
Brand considerationMost of the car buyers – both first time and repeat – consider 3 – 5 brands from which they make their final selection.
This trend seems to be true for the last seven years covering both the high growth and difficult periods. Clearly, the buyer goes through a detailed evaluation
Note: The sum of all the stacks in the graph does not add to 100% as data has been depicted only for the last six years and some did not respond. Please read the graph on incremental basis and not on cumulative basis while you transition from one year to next.
No. of Brands Typically Considered (By Car Age)
% o
f Res
pond
ents
Number of Brands Considered
0%
5%
10%
15%
20%
25%
1 2 3 4 5 6 7 8 9 10
< 1 year (2013) 2 years (2011) 3 years (2010)
4 years (2009) 5 years (2008) 6 years (2007)
7 years (2006)
Once the decision is made to buy a car, and after the respondents cited their selection parameters, we asked them as to how they made their brand choices.
irrespective of the economic circumstances that he/she may be in.
However, SUV and mini-van owners tend to look for more number of brands before they make their selection as compared to consumers who consider a hatchback and sedan.

14
Price-point buying patterns
Respondents Considering 6 or more Brands (By Car Value)
% o
f Res
pond
ents
0%
10%
20%
30%
40%
50%
2 - 4 Lakhs 4 - 6 Lakhs 6 - 8 Lakhs 8 - 12 Lakhs 12 - 16 Lakhs 16 - 30 Lakhs
As the buyers go through the repeat purchase, they don’t necessarily behave any different from the first time buyer in shopping around. It does not seem to be a case where they identify themselves with a brand in terms of personality or performance.
We asked the owners of different brands as to how many other brands they considered before they made their selection of the brands they owned. Not surprisingly, we found a large number of them looking at several options, with some interesting variations across brands.
Respondents Considering >= 4 Brands (By Car Brand)
% o
f Res
pond
ents
Num
ber of brands
3.7 3.7 3.8 3.8 3.9 3.9 3.8 3.7 3.8 3.64.0
4.34.0
0
1
2
3
4
5
6
7
8
0%
20%
40%
60%
80%
100%
Brand1
Brand2
Brand3
Brand4
Brand5
Brand6
Brand8
Brand9
Brand10
Brand11
Brand12
Brand13
LuxuryCars
Greater or equal to 4 brands Less than 4 brands Median
Note: We are not drawing any brand comparisons and therefore the brand names have been masked
The number of brands considered remains similar for non-luxury as well as luxury cars, indicating importance of value proposition in both the consumer segments.

Driving through the consumer’s mind 15
The urban, sub-urban and rural trends
0%
20%
40%
60%
80%
100%
Rural Suburban Urban
1 2 3 4 5 6 7 8 9 10 or more
No. of Brands Typically Considered by Location
% o
f Res
pond
ents
Note: The sum of all the stacks in the graph may not add to 100% as some of the individuals did not respond
Rural buyers tend to look at a more limited number of options. This could be a function of the choices available and the price points they consider. The analysis in the following two graphs gives the number of brands considered by the buyers over the last seven years.
Rural consumers take lesser number of brands into consideration as compared to the semi-urban or urban consumers.

16
0%
20%
40%
60%
80%
100%
2013 2012 2011 2010 2009 2008 2007
1 2 3 4 5 6 7 8 9 10 or more
No. of Brands Considered during Last Purchase (Urban)
% o
f Res
pond
ents
Vehicle Purchase Year
Note: The sum of all the stacks in the graph may not add to 100% as some of the individuals did not respond
There is an increasing trend amongst the urban population of going with a single brand, which could be on account of familiarity of the brand, loyalty programs of OEMs, or the aspirational value offered by a brand at that point of time for a particular product.
No. of Brands Considered during Last Purchase (Rural/Semi Urban)
0%
20%
40%
60%
80%
100%
2013 2012 2011 2010 2009 2008 2007
1 2 3 4 5 6 7 8 9 10 or more
% o
f Res
pond
ents
Vehicle Purchase Year
Note: The sum of all the stacks in the graph may not add to 100% as some of the individuals did not respond
When you look at the 80 percentile level, the number of brands considered remains comparable. However, the number of buyers considering lesser number of brands has been reducing.

Driving through the consumer’s mind 17
Car type & pricing trends
Note: The sum of all the stacks in the graph may not add to 100% as some of the individuals did not respond
The consideration set increases with the rise in the car price point across Gen X and Gen Y car owners. Gen X consumers, who own a car between Rs 6 to 8 Lakhs, tend to evaluate more number of brands, with more than 40% evaluating 6 or more cars for their last purchase. However, less than 20% of Gen Y consumers evaluated 6 or more cars across the price range.
No. of Brands Typically Considered (By Car Price and Age Groups)
% o
f Res
pond
ents
0%
20%
40%
60%
80%
100%
1 2 3 4 5 6 7 8 9 10 or more
Gen X Gen Y Gen X Gen Y Gen X Gen Y Gen X Gen Y
2 - 4 Lakhs 4 - 6 Lakhs 6 - 8 Lakhs 8 - 12 Lakhs
With the increase in the car price, consumers tend to evaluate greater number of brands, with Gen X considering more brands as compared to Gen Y consumers

18
Note: The sum of all the stacks in the graph may not add to 100% as some of the individuals did not respond
The trend further differs in case of the type of vehicle owned by the respondents; both Gen X and Gen Y have a consideration set of 3 to 5 cars while evaluating sedans and hatchbacks.
Sedans are placed at the top of the consideration set by the current hatchback owners for their next vehicle purchase while SUVs are preferred by the current sedan owners.
No. of Brands Typically Considered (By Car Type)
% o
f Res
pond
ents
0%
20%
40%
60%
80%
100%
1 2 3 4 5 6 7 8 9 10 or more
Hatchback SedanGen X Gen Y
Hatchback Sedan
Car Type Selected for Next Vehicle Purchase
% o
f Res
pond
ents
0%
20%
40%
60%
80%
100%
Hatchback Sedan SUV Van/Minivan
Sedan SUV Hatchback Coupe Wagon Van/Minivan Convertible
Current Vehicle Type
Driving through the consumer’s mind 19
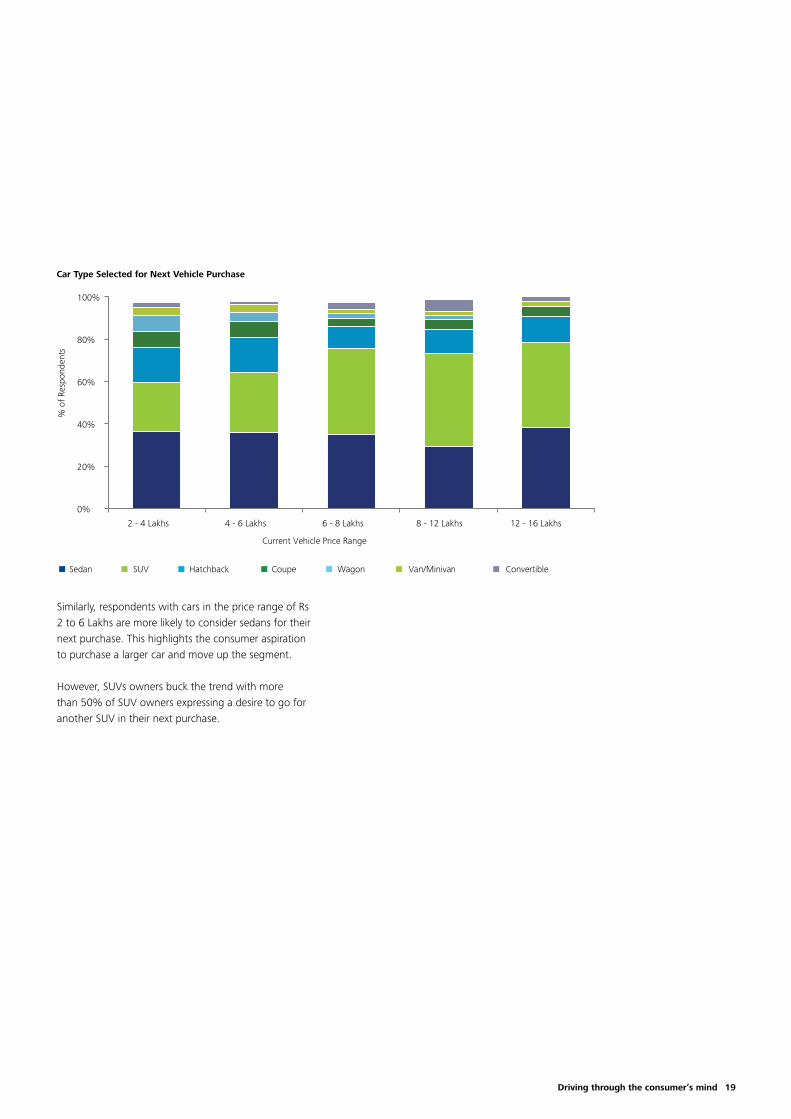
Car Type Selected for Next Vehicle Purchase
% o
f Res
pond
ents
0%
20%
40%
60%
80%
100%
2 - 4 Lakhs 4 - 6 Lakhs 6 - 8 Lakhs 8 - 12 Lakhs 12 - 16 Lakhs
Current Vehicle Price Range
Sedan SUV Hatchback Coupe Wagon Van/Minivan Convertible
Similarly, respondents with cars in the price range of Rs 2 to 6 Lakhs are more likely to consider sedans for their next purchase. This highlights the consumer aspiration to purchase a larger car and move up the segment.
However, SUVs owners buck the trend with more than 50% of SUV owners expressing a desire to go for another SUV in their next purchase.

20
Brand perception

Driving through the consumer’s mind 21
Identifying key influencers
Last purchase considerations by type of vehicle
Brands Considered for Last Purchase (By Vehicle Type)
% o
f Res
pond
ents
Current Vehicle Type
0%
20%
40%
60%
80%
100%
Van/Minivan Hatchback Sedan SUV
Brand 1 Brand 2 Brand 3 Brand 4 Brand 5 Brand 6 Brand 7
Brand 8 Brand 9 Brand 10 Brand 11 Brand 12 Brand 13 Others
Note: We are not drawing any brand comparisons and therefore the brand names have been masked
Interestingly, when customers were asked to specifically mark the brands they considered before making their selection, they ended up with more number than their stated position of considering 3 to 5 brands. This would suggest they started with a long list of several brands but seem to think of a smaller number as a serious set of possibilities
When we looked at the brands considered by existing car owners, we are able to see that the SUV owners tend to consider more brands as compared with van/mini-van users. From the number of brands that are considered, it is apparent that product types other than what they eventually select are considered. This further strengthens the view that India is a price-point driven market.
Consumers tend to look at offerings across brands and also offerings at the price band they are considering, while making the purchase.

22
Last purchase considerations by value of car
Note: We are not drawing any brand comparisons and therefore the brand names have been masked
Based on the responses obtained from car owners about their last purchase, the number of brands contributing mindshare of around 40% does not change in the 2~12 Lakhs price range. However, at the higher price points, the brands that constitute the top 40% change.
Brands Considered for Last Purchase (By Car Value)
0%
20%
40%
60%
80%
100%
2 - 4 Lakhs 4 - 6 Lakhs 6 - 8 Lakhs 8 - 12 Lakhs 12 - 16 Lakhs
Brand 5
Brand 10
Brand 1
Brand 6
Brand 11
Brand 2
Brand 7
Brand 12
Brand 3
Brand 8
Brand 12
Brand 4
Brand 9
Others
% o
f Res
pond
ents
Current Vehicle Price Range

Driving through the consumer’s mind 23
It is an interesting situation the OEMs have to deal with. The car buyers considered several brands and made their choices and will once again consider several brands when they are in the market to buy their next car. However, as owners, they seem to be reasonably happy with what they have. It is therefore incumbent upon the OEMs to convert this satisfaction into brand loyalty and repeat purchase.
Ratings of car owners of their own brands
Ratings on different attributes by brand owners
Attributes
Bran
ds
Highest Rated Attribute
for a Brand
Lowest Rated Attribute
for a Brand
Brand Reputation Reliability
Overall Quality
Performance & Handling Safety
Value for Money Interiors Styling
Technology features
Fuel Efficiency
Resale Value
Brand 1
Brand 2
Brand 3
Brand 4
Brand 5
Brand 6
Brand 7
Brand 8
Note: Ratings / points were captured on a 5 point scale (1. for Poor, 2, 3, 4, 5. for Excellent) by owners of their brands. Above heat map for brands is for illustrating the shift in trends. The representation above is not intended for making any comparisons between brands as the respondent datasets are independent and hence not comparative. Therefore, the brand names have been masked.

24
Conclusion
The Indian car buyer comes across as a very rational person during the entire process, contrary to the popular notion of car buying being a very emotional activity. There are very practical reasons to buy a car – space, need of the family or to upgrade to a higher quality of vehicle. Once the need for a car is established, the buyer looks for quality of service, product reliability and re-sale value.
Given these factors, the potential buyer looks at several products, presumably at the same price point, and tends to make the final selection. This appears to be a deliberate and a detailed process.
The lessons for the OEMs seem to be • Ithelpstoappealtherationalsideofthebuyer.• Whilethebranditselfandtheperceptionsaroundit
are important, the buyer looks at the quality of the dealership for service, vehicle reliability and resale value to shortlist the brands.
• Thechanceofalmostallbrandstogetintotheconsideration of a buyer seems bright.
• Consumersnotcomplainingshouldnottobemisunderstood to mean satisfaction and brand loyalty! Most of the consumers would tend to look at all possible options before making the next buying decision, at least, at the present moment. While only a very small number of customers seem to be loyal to a brand, the population, however, seems to be growing. This would, therefore, suggest a need to revisit loyalty programs to make the ownership experience compelling.
There may be a case for the expectations of the customers to be managed appropriately through the life cycle of the product, to be in a position to be considered favourably for the next purchase. Given the fact that there is likely to be greater usage of the car, and lesser period for which it is owned, it may be an imperative to plan the relationship management in an effective way.

Driving through the consumer’s mind 25
Appendix

26
Respondent profile
Overall, 1813 respondents were a part of the survey, of which 1066 respondents comprising ~ 59% of the survey population belong to Gen Y, while ~ 22% belong to Gen X and 16% belong to the “Baby Boomers” segment. The four-wheeler owners also show a similar age profile.
In the overall population almost ~ 79% had purchased new vehicle during their last purchase. In the sample related to car owners, ~ 91% had purchased a new car during their last purchase. In the context of the above, all the analysis and conclusions in the report are aligned to behaviour exhibited by consumers during new vehicle purchase.
By Respondent Age
1%
59%
22%
16%
2%
Overall Respondents
1%
57%
24%
17%
2%
Car Owners
16-18 years Gen Y (19~36 years)
Gen X (37~48 years) Boomers (49~67 years)
68 years and older
91%
9%
79%
21%
By Used Vehicles vs. New Vehicles
Overall Respondents Car Owners
New Old

Driving through the consumer’s mind 27
Contacts
Ajay TiwariEmail: [email protected]: +91 (0) 124 679 2887
MS ManiEmail: [email protected]: +91 (0) 22 6619 8552
Sumeet KumarEmail: [email protected]: +91 (0) 124 679 2000
Vijay IyerEmail: [email protected]: +91 (0) 22 6622 0504
Kumar KandaswamiSenior Director & Manufacturing Leader, Deloitte in IndiaEmail: [email protected]: +91 (0) 44 6688 5401

Deloitte refers to one or more of Deloitte Touche Tohmatsu Limited, a UK private company limited by guarantee, and its network of member firms, each of which is a legally separate and independent entity. Please see www.deloitte.com/about for a detailed description of the legal structure of Deloitte Touche Tohmatsu Limited and its member firms.
Deloitte in India refers to Deloitte Touche Tohmatsu Limited member firms in India.
This survey report prepared by Deloitte Touche Tohmatsu India Private Limited (DTTIPL) contains general information only, and none of Deloitte Touche Tohmatsu Limited, its member firms, and their related entities (Deloitte Network) are, by means of this rendering accounting, business, financial, investment, legal, tax, or other professional advice or services. While due care has been taken to ensure the accuracy of the information contained herein, no warranty, express or implied, is being made, by DTTIPL as regards the accuracy and adequacy of the information contained herein.
The information in this report is limited by the sample size of study conducted and information made available to us. Also, where applicable source has been mentioned for all information obtained from external sources and such information has been reproduced “as-is”. DTTIPL takes no responsibility for the authenticity of such information.
Further, no entity in the Deloitte Network shall be responsible for any loss whatsoever sustained by any person who relies on this material.
©2014 Deloitte Touche Tohmatsu India Private Limited. Member of Deloitte Touche Tohmatsu Limited


![Neuroethical considerations in mind, brain, and education ......ethics in educational neuroscience and Mind, Brain, and Education [MBE]. We present a synthesis of neuroethics concepts](https://static.fdocuments.net/doc/165x107/5ffc4a5bb061065ffb153e7e/neuroethical-considerations-in-mind-brain-and-education-ethics-in-educational.jpg)