Driving Innovative IT Metrics 2015 PMI Conference
43
Driving Innovative IT Metrics By Embracing Human Nature © 2015 Computer Aid, Inc.
-
Upload
joe-hessmiller -
Category
Documents
-
view
166 -
download
1
Transcript of Driving Innovative IT Metrics 2015 PMI Conference

Driving Innovative IT MetricsBy Embracing Human Nature
© 2015 Computer Aid, Inc.

Joe Hessmiller
• Over 30 years in IT; analyst, programmer,
programmer training manager, project manager,
project management consultant, software
consulting sales business unit management and
marketing manager.
• Worked with dozens of IT managers from
Fortune 50 corporations and large government
agencies.
1. To establish the need for monitoring the
metrics that really matter.
2. To identify why this is such a challenge.
3. To identify the types of metrics that really
matter.
4. Show how familiar framework can be adapted
for metrics identification (and communication).
5. Give you enough to use back at your office to
improve your metrics program.
Objective of Session

Agenda
1. The Innovative Metrics Opportunity
2. Why Do These Opportunities Still Exist?
3. What Metrics Should We Monitor?
4. Working With Conditions Data
5. Developing Innovative Metrics for Your
Organization

Part One
The Innovative Metrics
Opportunity
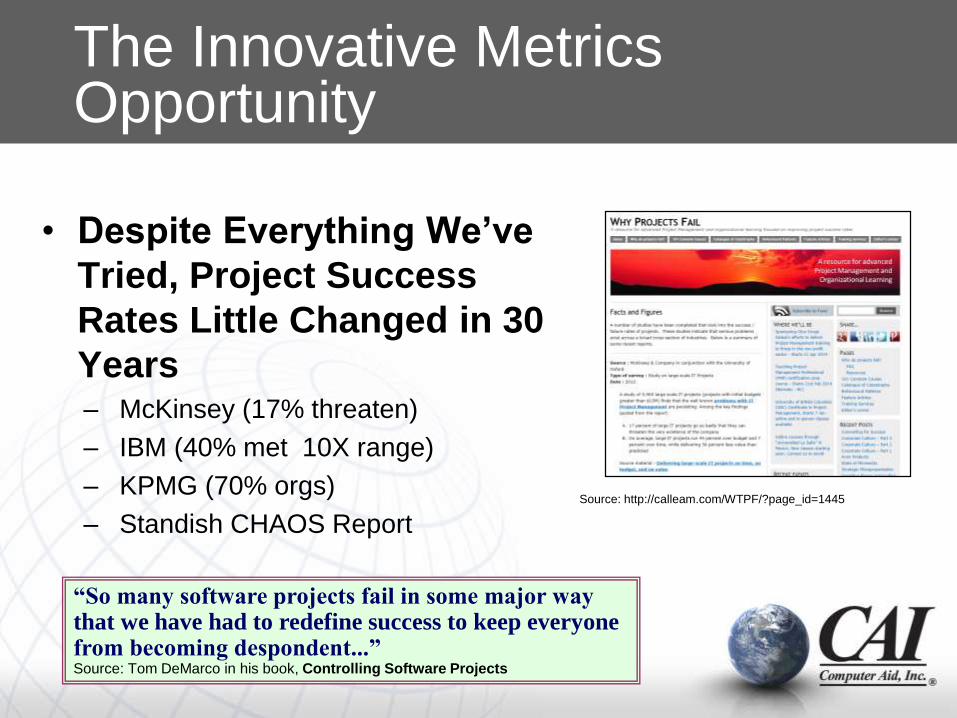
• Despite Everything We’ve
Tried, Project Success
Rates Little Changed in 30
Years– McKinsey (17% threaten)
– IBM (40% met 10X range)
– KPMG (70% orgs)
– Standish CHAOS ReportSource: http://calleam.com/WTPF/?page_id=1445
The Innovative Metrics Opportunity
“So many software projects fail in some major way that we have had to redefine success to keep everyone from becoming despondent...”Source: Tom DeMarco in his book, Controlling Software Projects

• There Is Plenty of Opportunity for Improving
Challenged Project Success Rates
Source: http://versionone.com/assets/img/files/ChaosManifesto2013.pdf
The Innovative Metrics Opportunity

• It’s About Competitive CapabilityOrganizations with a mature PMO outperform those
with an immature PMO by:
28% for on-time project delivery;
24% for on-budget delivery; and
20% for meeting original goals and business
intent of projects.Source: www.metier.com, According to PMI
The Innovative Metrics Opportunity

The Innovative Metrics Opportunity
9 © 2015 Computer Aid, Inc.
• It’s About Competitive Capability

The NEW Software Reality
“We believe that every industrial company will
become a software company.” Source: GE CEO, Jeffrey Immelt, 2013 GE Annual Report, Letter to
shareholders.
It’s Happening NOW– Number of top 100 product and service companies - that are
now dependent on software – has DOUBLED (to nearly 40%) in
the past 20 years.
– Revenues from digitized products and channels are expected to
exceed 40% in industries such as insurance, retailing and
logistics.

Part Two
Why Do These “Opportunities”
Still Exist?

Why Do These Opportunities Still Exist?
Self-deceptionPeople (including PMs) are
predisposed to see a perfect end
state (e.g., successful project
completion, and tend to practice
self-deception (confirmation bias,
fact filtering, etc.) to support this
expectation.

It’s Who We Are
• Outside of IT for
Neurophysiological
Perspective
– Anthropology
Research
– Psychology
Research

Self-deception Is “Natural”
In fact, all humans self-deceive:
• “self-deception is a kind of strategy which allows us to better
deceive others by first deceiving ourselves…”
• “self-deception occurs as a social intelligence
strategy”
• “there is a neuro-physiological basis for self-deception
in humans.”
Paper by: James Sage, Ph.D, Vice Chancellor @ Univ. of Wisconsin
Research by: Robert Trivers, Ph.D, Evolutionary Biologist, Crafoord Prize recipient
Research by: V.S. Ramachandran, Ph.D, Neuroscientist, Center for Brian and Cognition

• How many people consider themselves to
be above average drivers?
Quick Survey
15 © 2015 Computer Aid, Inc.
“For driving skills, 93% of the U.S. sample and 69% of
the Swedish sample put themselves in the top 50%“
Svenson, Ola (February 1981). "Are We All Less Risky and More Skillful Than Our Fellow
Drivers?". Acta Psychologica 47 (2): 143–148. doi:10.1016/0001-6918(81)90005-6.
“almost 80% of participants had evaluated
themselves as being an above-average driver.”Iain A. McCormick; Frank H. Walkey; Dianne E. Green (June 1986). "Comparative
Perceptions of Driver Ability: A Confirmation and Expansion". Accident Analysis &
Prevention 18 (3): 205–208. doi:10.1016/0001-4575(86)90004-7.

We Just Proved It
• “A survey of university professors found that 94% thought they
were better at their jobs than their average colleague”
• “A survey of 1 Million high school seniors found that all thought
they were above average [in their] ability to get along with
others”
- Thomas Gilovich, 1993, How We Know What Isn’t So
The “Problem State” Takeaways
1. Stop expecting PMs to ‘do the right thing’. Despite all the training and encouragement, PMs are still human
and will tend to self-deceive (and then pass it on).
2. Make self deception impossible.Provide PMs with timely, objective, action-compelling information.
3. Make ignoring important information impossible. Provide PM management with information necessary to hold PMs
accountable.
Part Three
What Metrics Should We
Monitor?

What Metrics Should We
Monitor?
• Backward Looking– Lagging Indicators
– Tracking Progress
• Forward Looking– Leading Indicators
– Managing Risk
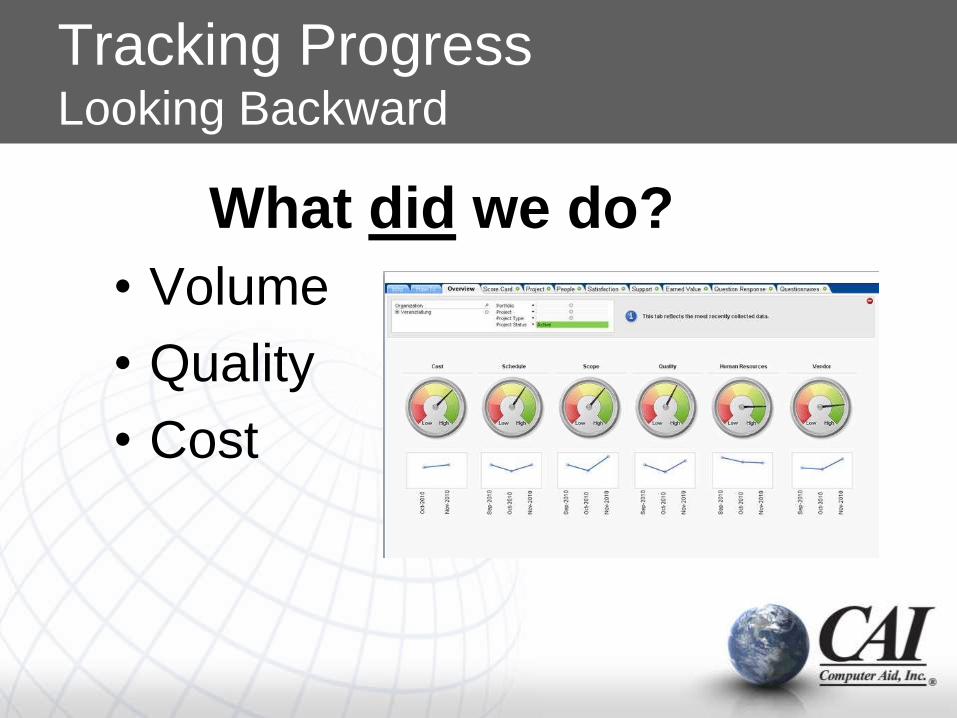
Tracking Progress Looking Backward
• Volume
• Quality
• Cost
What did we do?

• Alignment of IT Investments to Business Strategy
• Cumulative Business Value of IT Investment
• IT Spend Ratio – New Versus Maintenance
• Critical Business Services– Customer Satisfaction
– Service Level Performance
• Operational Health– Outages
– Security Incidents
– Project Success Rate
– Average Defect Rate
Source: Craig Symons, Forrester Research, 4-4-08
Tracking Progress Looking Backward – Enterprise Level

http://www.slideshare.net/anandsubramaniam/project-metrics-measures
Tracking Progress Looking Backward – Project Level

Managing RiskLooking Forward – Experts Agree on EWS
What should we do?

Managing RiskLooking Forward – Kappelman Research
• Kappelman
Research
– Derived List of
• Six People Factors
• Six Process Factors
• For In-process
Audits

Managing RiskLooking Forward – Dominant Dozen

• PM Competency
Conditions– 10 Knowledge Areas
– Things You Should
Know
– Things You Should
Do
Managing Risk PMI Knowledge Areas
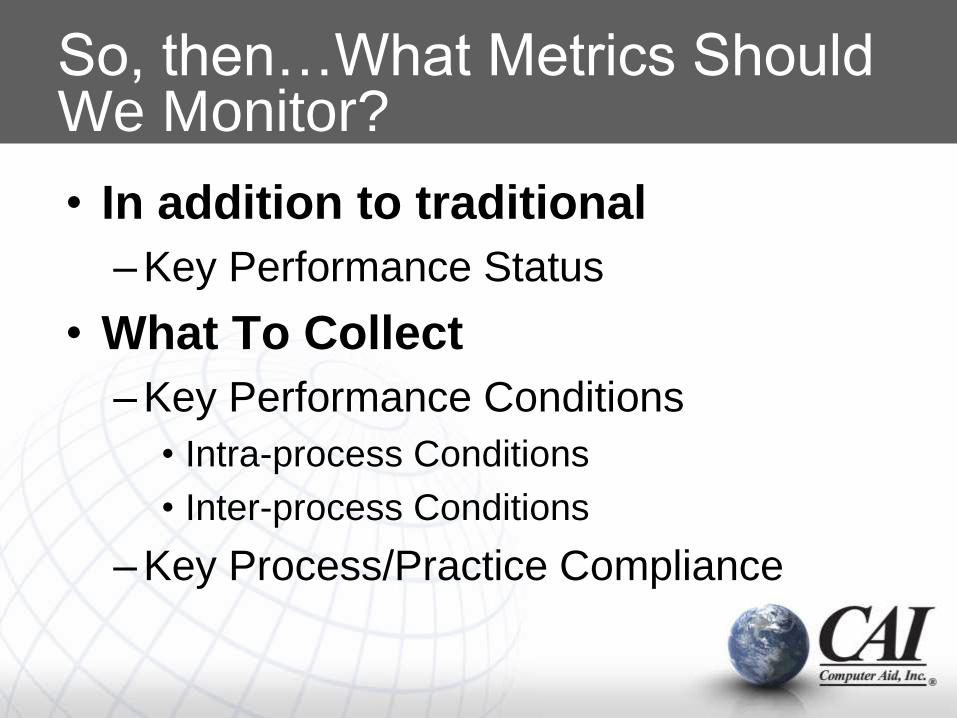
• In addition to traditional
– Key Performance Status
• What To Collect
– Key Performance Conditions
• Intra-process Conditions
• Inter-process Conditions
– Key Process/Practice Compliance
So, then…What Metrics Should We Monitor?

• How Collect the
Metrics that
Matter
– Intuition
– MBWA
– Survey Software
– Purpose Designed
Software
What Metrics Should We Monitor?

Part Four
Working with Conditions Data
(The Tale of the Four Missing Metrics)

Three Important CONDITIONS to Monitor
• Expectations Management
• Sponsor Involvement
• Process Compliance
To Minimize One Project Risk Factor
• Project Rework Probability
Managing Risk You Need “ESP” to Know “PRP”
According to the Carnegie Mellon Software Engineering Institute, “Data indicate that 60-80% of the cost of software development is in rework.” Source: Paul D. Nielsen, “About Us: From Director and CEO Paul D. Nielsen,” Carnegie
Mellon Software Engineering Institute, http://www.sei.cmu.edu/about/message/

The Four Missing Metrics
• SMART – Are expectations clear?
• SMPL – Is sponsor engaged?
• PAL - Are processes being
followed?
• PRPL – Are causes of
Rework being avoided?

SMART Level
Tracks the clarity of
assignments. The higher
the SMART Level, the
higher the level of
understanding of what is
expected. Therefore,
less Rework and less
management intervention
required.
The SMART Level
0.0
20.0
40.0
60.0
80.0
100.0
120.0
SMART Index
Upper Control Limit
Lower Control Limit
The SMART Level

SMPL Line
Tracks the
participation level of
the senior
management and/or
sponsor.
The SMPL Line
Senior Management Participation Level
Attention Needed
0.0
20.0
40.0
60.0
80.0
100.0
120.0
SMPL
Upper Control Limit
Lower Control Limit

PALMeasures likely level of
process adherence
based on conditions that
would tend to lead to
‘short cuts’ on process..
Process Adherence Likelihood

Project Rework Probability LevelPRPL Line
Tracks the ‘probability’
of Rework based on
changes in the
conditions that are
known to cause
Rework.
0.0
5.0
10.0
15.0
20.0
25.0
PRPL
Upper Control Limit
Lower Control Limit
Attention Needed
The PRPL Line

Part Five
Developing Innovative Metrics
for Your Organization

How Did You Get Here?
37 © 2015 Computer Aid, Inc.
In one of
these?

A Gauge for Every Condition
Automotive Engineers Long Ago Defined
the Critical Measures for Safe, Effective
Engine Operation.

The Basic Automobile Dashboard
Automotive Gauge
Odometer
Clock
Fuel Level
Speedometer
Tachometer
Oil Pressure
Oil Temperature
Water Pressure
Water Temperature
Voltmeter

The Basic Measures
Automotive Gauge Asks the Question To MeasureOdometer How far? Deliverables Delivered
Clock How long? Duration
Fuel Level How much further? Input Units Available
Speedometer How fast? Deliverables per Unit of Time
Tachometer How intensely? Effort Intensity
Oil Pressure Do we have enough lubrication to
smooth interactions?Supply of Lubricant to Smooth Interaction
Between Components
Oil Temperature How smooth are interactions? Ability of Lubricant to smooth Interaction
Between Components
Water Pressure Do we have enough coolant to keep the
engine producing?Supply of Coolant to dissipate excess
engine heat
Water Temperature How effective is the coolant in keeping
the engine cool?Ability of Coolant to dissipate engine heat
Voltmeter Is enough energy being applied to the
other important systems?Ability to Support other Control and
Comfort Systems

Comparative Metrics
To Measure
Automotive
Metric IT Metric
Deliverables Delivered Miles Service Level Achieved, Function Point Delivered
Duration Hour Hour
Input Units Available Gallons Resource Hour
Deliverables per Unit of Time Miles Per Hour Earned Value Per Clock Hour
Effort Intensity RPM Hours Worked Per Week/Available Hours
Supply of Lubricant to Smooth
Interaction Between Components
PSI Stakeholder Interaction Satisfaction
Ability of Lubricant to Smooth Interaction
Between Components
Degrees Number of Open Issues from Stakeholder Interactions
Supply of Coolant to dissipate excess
engine heat
PSI Duration to Close Issues/Number of Issues
Ability of Coolant to dissipate engine
heat
Degrees Number of Escalated Issues
Ability to Support other Control and
Comfort Systems
Volts On Time Process Deliverables (Status, Reporting, Training)

The More Complex the Environment…

To establish the need for monitoring the metrics
that really matter.
To identify why this is such a challenge.
To identify the types of metrics that really
matter.
Show how familiar framework can be adapted
for metrics identification (and communication).
Give you enough to use back at your office to
improve your metrics program.
Did We Accomplish Our Objectives?