Extending CMMI Level 4/5 Organizational Metrics Beyond ... · 5 Major Pitfalls 1. Getting the cart...
28
0 Extending CMMI Level 4/5 Organizational Metrics Beyond Software Development CMMI Technology Conference and User Group Denver, Colorado 14-17 November 2005 Linda Brooks Northrop Grumman Corporation
Transcript of Extending CMMI Level 4/5 Organizational Metrics Beyond ... · 5 Major Pitfalls 1. Getting the cart...

Copyright 2005 Northrop Grumman Corporation0 12/14/2005 10:11 AM
Extending CMMI Level 4/5 Organizational Metrics Beyond Software Development
CMMI Technology Conference and User GroupDenver, Colorado14-17 November 2005
Linda BrooksNorthrop Grumman Corporation

Copyright 2005 Northrop Grumman Corporation1 12/14/2005 10:11 AM
Topics
• The Challenge
• The Pitfalls
• Background
• Proposed Approach
• Northrop Grumman Mission Systems Case Studies
• Summary

Copyright 2005 Northrop Grumman Corporation2 12/14/2005 10:11 AM
The Challenge
Extending organizational metrics beyond software development to achieve CMMI Levels 4/5 requires breaking new ground.
A repeatable process for developing such metrics that avoids typical pitfalls is needed.
Few examples exist for project types such as systems engineering (SE), operations and maintenance (O&M), services, hardware development.

Copyright 2005 Northrop Grumman Corporation3 12/14/2005 10:11 AM
5 Major Pitfalls
1. Getting the cart before the horse - business needs not driving metrics definition
2. Not taking advantage of in-house and/or industry experience
3. Industry or in-house examples implemented organization wide without evaluating needs and/or impact
4. Insufficient stakeholder buy-in5. Cost of collecting the metrics greater than the
benefits to be derived

Copyright 2005 Northrop Grumman Corporation4 12/14/2005 10:11 AM
Northrop Grumman Mission Systems
A leading global integrator of complex systems
Based on information technology and systems engineering expertiseIntegrated solutions: architecture, development and sustainment
Over $5B 2004 Revenue18,000+ Employees Diverse business base
300 locations in 20 countries, 50 states2,000 active contracts and task orders
Technical & Management Services
Command, Control & Intelligence
Missile Systems

Copyright 2005 Northrop Grumman Corporation5 12/14/2005 10:11 AM
Causal Analysis and ResolutionOrganizational Innovation and Deployment5 Optimizing
4 Quantitatively Managed
3 Defined
2 Managed
Quantitative Project ManagementOrganizational Process Performance
Requirements DevelopmentTechnical SolutionProduct IntegrationVerificationValidation Organizational Process FocusOrganizational Process DefinitionOrganizational Training Risk ManagementIntegrated Project Management (for IPPD*)Integrated Teaming*Integrated Supplier Management**Decision Analysis and ResolutionOrganizational Environment for Integration*Requirements Management Project PlanningProject Monitoring and ControlSupplier Agreement Management Measurement and AnalysisProcess and Product Quality AssuranceConfiguration Management
1 Performed
Process AreasLevel
CMMI Organizational Metrics Support Meeting Business Needs
Leverage organization historical data to ensure accurate estimates for new work• Level 3: Historical data is
the foundation for cost credibility and accuracy
Understand process performance to enable more effective management• Level 4: Statistical process
control – a means for understanding performance
Improve process performance to increase competitive edge• Level 5: Improvement
activities based on accurate measures

Copyright 2005 Northrop Grumman Corporation6 12/14/2005 10:11 AM
Supporting Infrastructure
CMMI Level 5• Mature processes• Structure for sharing best practices
Mature metrics collection• Metrics repository• Organization Metrics Manual• Established organization baselines &
models• Established collection process
Engineering Process Group• Provides stakeholder input• Metrics/QM working group
Six Sigma/Lean• Structure for improvement • Tools & methods
0 5 10 15
0
5
10
15
Observation Number
Indi
vidu
al V
alue
Mean=7.268
UCL=11.17
LCL=3.363
1 2

Copyright 2005 Northrop Grumman Corporation7 12/14/2005 10:11 AM
Standard Metric Development Process Overview
Starts when the metric sponsor identifies a business need A Metric Development Project Lead is appointed to lead the processThe standard process ensures:
Metric development is integrated into the annual overall organizational metrics planning; The relationship and effect on the organizational standard processes is considered; All stakeholders are kept informed and can provide inputs; Results are documented and appropriate approvals are obtained.

Copyright 2005 Northrop Grumman Corporation8 12/14/2005 10:11 AM
Step 1 – Business Need & Plan
Develop business need descriptionIdentify Metric Sponsor, Metric Development Project Lead, affected process owners, other stakeholdersEstablish initial schedule for each process step and identify resourcesCoordinate with the organization stakeholders for integration with organization priorities and plansDocument results
Copyright 2005 Northrop Grumman Corporation9 12/14/2005 10:11 AM
Step 2 – Analysis & Initial Recommendations
Assess and evaluate related in-house metrics useAssess and evaluate related industry metrics useAnalyze fit related to meeting business needsEvaluate potential impact on policy/processes/projectsSpecify proposed metricsEvaluate cost vs. benefitDocument results

Copyright 2005 Northrop Grumman Corporation10 12/14/2005 10:11 AM
Step 3 – Verification & Approval
Obtain stakeholder input and verification of satisfaction of business needsUpdate plans and metrics definition as neededPrepare draft Change Request and supporting documentationDocument resultsObtain required organization/CCB approvals (provide documented process results to approval authorities)

Copyright 2005 Northrop Grumman Corporation11 12/14/2005 10:11 AM
Step 4 – Implementation & Evaluation
Implement metrics collectionAnalyze resultsPrepare results for usePrepare recommendations for changes or needed actions

Copyright 2005 Northrop Grumman Corporation12 12/14/2005 10:11 AM
Metric Development Documentation Outline
Business Need and Plan (documents results of process step 1)Business need descriptionMetric Sponsor, Metric Dev Project Lead, stakeholder identificationTarget/actual completion date and status for each process step
Analysis and Initial Recommendation (documents results of process step 2)In-house metrics assessmentIndustry metrics assessmentOther analysis resultsImpact evaluationDefinition of proposed metric(s)
Verification and Approval (documents results of process step 3)Record of stakeholder input and reviewMapping to business needs Change Request to related documentationRecord of required org/CCB approvals
Post Collection Analysis and Recommendations (documents results of process step 4)
Summary of analysis results and recommendations

Copyright 2005 Northrop Grumman Corporation13 12/14/2005 10:11 AM
Northrop Grumman Mission SystemsCase Studies
O&M Metrics ExampleSystems Engineering Metrics Example

Copyright 2005 Northrop Grumman Corporation14 12/14/2005 10:11 AM
O&M Metrics Development Example

Copyright 2005 Northrop Grumman Corporation15 12/14/2005 10:11 AM
Step 1 Highlight – Business Needs
Prediction of effort for new work requires productivity values for key O&M processes
Defect CorrectionSmall EnhancementsHelp Desk SupportOperations Support
Additional needs to provide the organization with more useful process performance baselines and/or models
Background goal to limit impact on projects and the organization collection system

Copyright 2005 Northrop Grumman Corporation16 12/14/2005 10:11 AM
Step 2 Highlight – Analysis: Sources & EvalIn-house metric sources
Projects A, B and C• Projects used defect related metrics
similar to development projects for project specific baselines/models
• Recommend expanding defect metrics to O&M project activities
Metrics currently collected as part of the organization data collection
• Potentially useful productivity measures could be computed from metrics already being collected
• Need more data pointsIndustry metric sources considered
SEER-SEM and COCOMO cost models• Use to validate productivity values
Copyright 2005 Northrop Grumman Corporation17 12/14/2005 10:11 AM
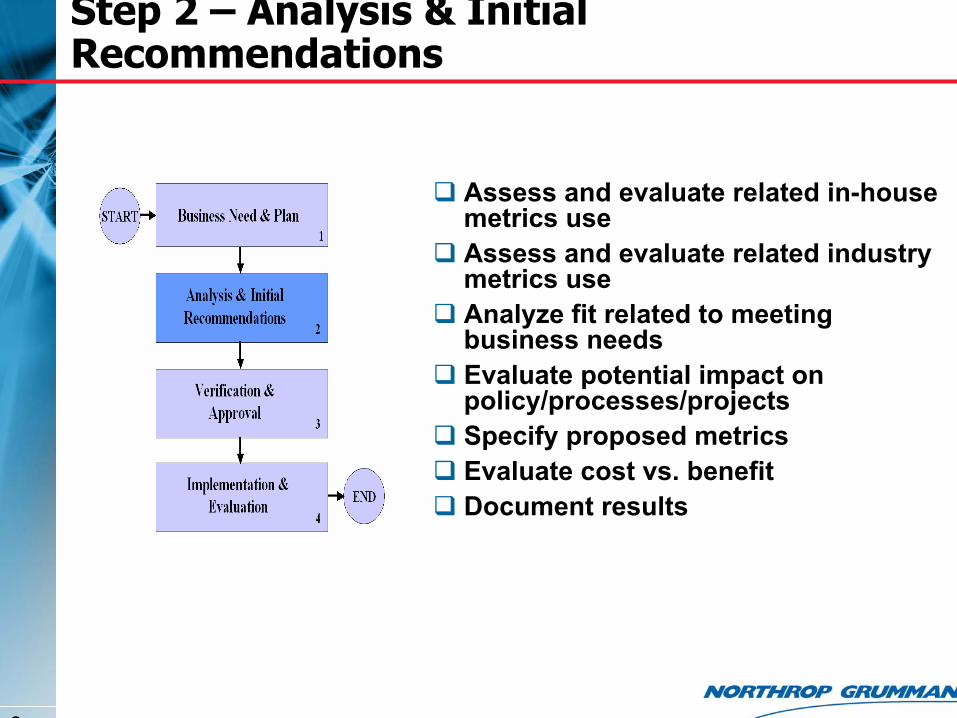
Step 3 Highlight – Verification Against Business Needs
Prediction of effort for new workCurrently collect potentially useful metrics to enable computation of needed productivity measures
Providing more useful organization process performance baselines/models
Potentially this need will be met by the currently collected data and the addition of selected defect dataAnalysis against productivities derived from existing data shows promise
Productivity = Size/Effort P r o c e s s P o t e n t i a l S i z e M e t r i c ( s )
E f f o r t M e t r i c F r o m R e l a t e d S t a n d a r d W B S L i n e I t e m ( s )
S o f t w a r e D e f e c t C o r r e c t io n # b a s e c o d e S L O C , 1 2 . 1 . 3 S o f t w a r e D e f e c t C o r r e c t io n
S m a l l S W E n h a n c e m e n t s
# b a s e c o d e S L O C , # b a s e c o d e S L O C a f f e c t e d , # S L O C a d d e d , # S L O C c h a n g e d# S L O C d e le t e d
1 2 . 1 . 6 S o f t w a r e E n h a n c e m e n t s
H e lp D e s k S u p p o r t
# s i t e s s u p p o r t e d ,# u s e r s s u p p o r t e d ,# c a l l s p e r w e e k ,# h o u r s p e r w e e k
1 2 . 1 . 9 H e lp D e s k S u p p o r t

Copyright 2005 Northrop Grumman Corporation18 12/14/2005 10:11 AM
Step 4 Highlight – Eval of Collected Data
Productivity useful for estimating and as organization baseline data
Notional raw defect correction productivity data
Check shows data to be normally distributed
Control chart shows in-control process

Copyright 2005 Northrop Grumman Corporation19 12/14/2005 10:11 AM
Systems Engineering (SE) Metrics Development
Example

Copyright 2005 Northrop Grumman Corporation20 12/14/2005 10:11 AM
Step 1 Highlight – Business Needs
Prediction of effort for new work requires productivity values for key systems engineering processes
Architecture definition, Concept of Operations Development (including scenario and use case development)Requirements Analysis (including system, software, and hardware)Major Interface DefinitionPerformance Modeling
Additional needs to provide the organization with useful process performance baselines and/or modelsProvide ability to support development and use of COSYSMO estimating model

Copyright 2005 Northrop Grumman Corporation21 12/14/2005 10:11 AM
Step 2 Highlight – Analysis: Sources & EvalIn-house metric sources considered & eval
Division Six Sigma Project on System Sizing Cost Estimating Relationships
• COSYSMO size measures fit primary needs for division and organization use
Projects A, B use of cycle-time and other metrics for key processes
• Metrics too specific for organization useCurrently collected SE metrics
• Need a few additions to support desired productivity calculations
SE metrics discussion with stakeholdersIndustry metric sources considered
USC/Industry COSYSMO SE cost modelINCOSE Systems Engineering Measurement PrimerPapers and Presentations
Copyright 2005 Northrop Grumman Corporation22 12/14/2005 10:11 AM
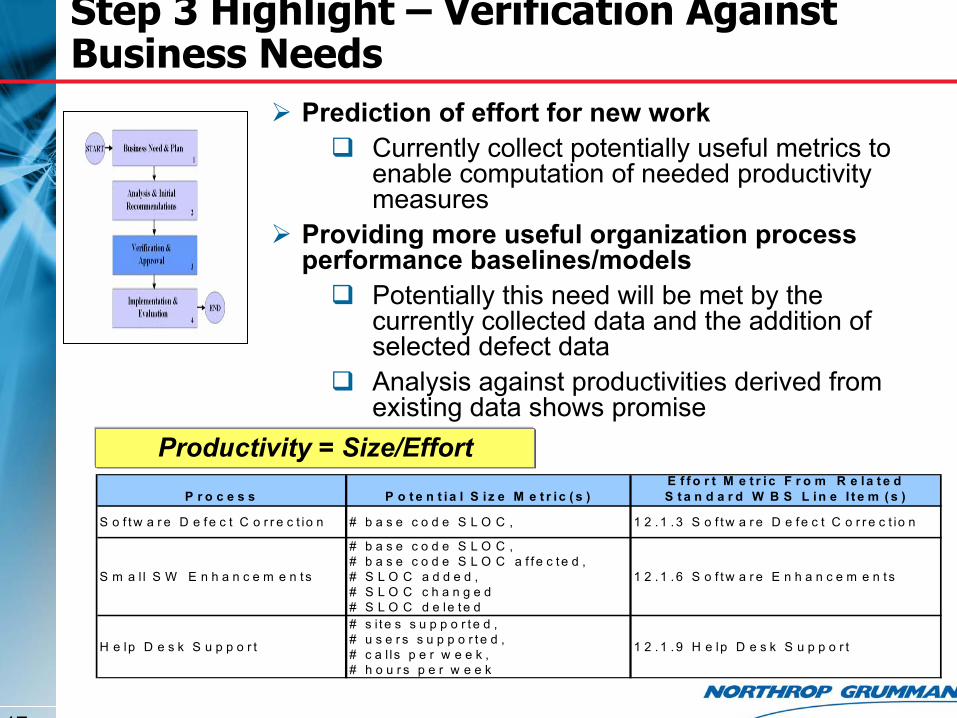
Step 2 Highlight – Analysis: Candidate Process Performance Metrics
Size
Productivity = Size/Effort
EffortProcess Potential Size Metric(s)
Effort Metric From Related Standard WBS Line Item(s)
Requirements Analysis
# system reqs, # SW reqs, # HW reqs, # scenarios
2.3 System Requirements, 2.5 SW Requirements Analsyis, 2.4 HW Requirements Analysis,
Architecture/Concept of Operations
# system reqs, # SW reqs, # HW reqs, # scenarios
2.6 Architecture Analysis/System Design, 2.8 Operations Concept Definition
Major Interface Definition # interfaces 2.7 Interface Definition

Copyright 2005 Northrop Grumman Corporation23 12/14/2005 10:11 AM
Step 2 Highlight – Analysis: Constructive Systems Engineering Cost Model (COSYSMO)
Part of COCOMO Suite of models being developed under the guidance of Dr. Barry Boehm, the Director of the Center for Software Engineering at USC Goal to more accurately estimate the time and effort associated with performing the system engineering tasks defined by ISO/IEC 15288Development started in 2002, with industry (USC affiliates) and INCOSE involvement42 historical data points from 6 companies; 15 business unitsNorthrop Grumman participating in the development and submittal of history data
* Used with permission of Dr. Barry Boehm
COSYSMO Operational Concept*
COSYSMO Background

Copyright 2005 Northrop Grumman Corporation24 12/14/2005 10:11 AM
Step 2 Highlight – Initial Recommendations
Include the four COSYSMO size parameters, with difficulty level Add hardware requirements metricsAdd collection of defect data for system requirements, hardware requirements and scenario/use case reviewsProposed Mods to the organization Standard WBS
Separate architecture, SW COTS assessment, HW COTS assessmentSeparate performance modeling and life cycle cost analysis
Modifications to the organization data collection, Metrics Manual and related
documents

Copyright 2005 Northrop Grumman Corporation25 12/14/2005 10:11 AM
Step 3 Highlight – Verification Against Business Needs
Prediction of effort for new workSize and accounting data already collected or identified for addition can potentially meet this needCOSYSMO should be of use as well
Development of organization process performance baselines/models
Potentially this need will be met by the recommended dataAnalysis against productivities derived from existing data shows promise
Support of COSYSMO development & use
Existing plus new metrics support this

Copyright 2005 Northrop Grumman Corporation26 12/14/2005 10:11 AM
Step 4 Highlight – Eval of Collected Data
Productivity useful for estimating and organization baseline data
Notional raw system requirements productivity data
Check shows data to be normally distributed
Control chart shows in-control process

Copyright 2005 Northrop Grumman Corporation27 12/14/2005 10:11 AM
Summary
Ensure business needs drive the processTake advantage of in-house and industry experience and best practicesInclude obtaining stakeholder input and buy-inEnsure benefits are worth the costInclude documentation and post-implementation evaluation
A metrics development process should:
![[CMMI Portugal] Cmmi implementation using open source tools](https://static.fdocuments.net/doc/165x107/554dd53fb4c905d10e8b4bb3/cmmi-portugal-cmmi-implementation-using-open-source-tools.jpg)


![Cmmi agile kulpa 2004meas cmmi[1]](https://static.fdocuments.net/doc/165x107/5455d335af795994188b4aed/cmmi-agile-kulpa-2004meas-cmmi1.jpg)