
Supersonic Aircraft Workshop Supersonic Aircraft Workshop - FAA
1
Ninth International Conference on Computational Fluid Dynamics (ICCFD9), Istanbul, Turkey, July 11-15, 2016
ICCFD9-2016-239
Drag Analysis of a Supersonic Fighter Aircraft
Osman Akgun1, Ali Ihsan Golcuk1, Dilek Funda Kurtulus2, Ünver Kaynak3
1TUBITAK UZAY Space Research Institute, ODTU, Ankara 06800, Turkey 2
Associate Professor at Department of Aerospace Engineering, Middle East Technical University,
Ankara 06800, Turkey 3Prof. Dr., TOBB University, Ankara, Turkey
Corresponding author: [email protected]
Abstract: For aircraft design, drag optimization is very important for having better
flight performance and less fuel consumption. In this study, drag effects of fuselage,
wing and tail section are separately analyzed using a generic F-16 fighter aircraft
model in ANSYS Fluent CFD tool with polyhedral mesh. Pressure drag and viscous
drag effects are shown on different section of the aircraft as fuselage, wing, vertical
tail and horizontal tail. Drag values are presented on subsonic, transonic and
supersonic flights.
Keywords: CFD, viscous drag, induced drag, wave drag, F-16.
1 Introduction To optimize the aircraft drag, it is required to analyze drag effects of fuselage, wing and tail sections.
In supersonic flight, effects of aircraft sections to drag becomes more important due to shock wave
formations which causes wave drags. The effect of viscous drag, induced drag and wave drag differs
on different section of the aircraft. This analysis will help to understand the effects and contributions of
aircraft sections to various subsonic and supersonic drag types which may show possible geometric or
shape improvements.
Several analytical [1,2,5], experimental [3,4,7,8] and numerical [6,9-11] studies are made related to
aerodynamic characteristics of either F-16 or other fighter aircrafts for supersonic, transonic or subsonic
regimes. Current CFD tools have now better level of accuracy and may be used to verify the analytical
drag estimation methods in order to improve new aircraft designs.
2 Problem Statement A generic F-16 model with AIM120 on wing tips at 0° angle of attack is analyzed using ANSYS Fluent
Version 16.2. 3D F-16 model is created by projections using fuselage cross sections and publicly
available pictures and sketches.
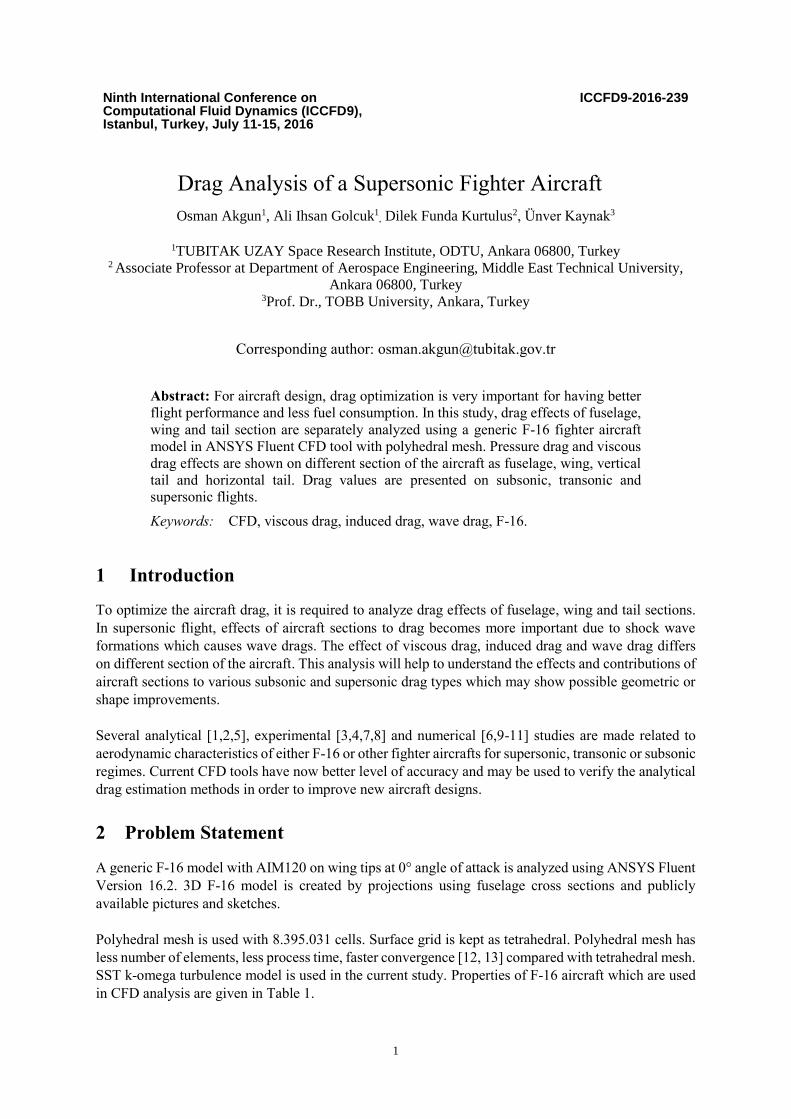
Polyhedral mesh is used with 8.395.031 cells. Surface grid is kept as tetrahedral. Polyhedral mesh has
less number of elements, less process time, faster convergence [12, 13] compared with tetrahedral mesh.
SST k-omega turbulence model is used in the current study. Properties of F-16 aircraft which are used
in CFD analysis are given in Table 1.
2
Figure 1. Polyhedral mesh generated by ANSYS Fluent
Table 1: F-16 properties used in CFD analysis
Property Attribute
Length 15.03 m
Wing span 10 m
Wing area 27.88 m2
Engine 131.6kN GE F110
Wing airfoil NACA 64A204 variable chamber
Aspect ratio 3.09
Flight altitude 50.000 ft
Thrust is calculated using momentum change thrust formulation (1). Thus ram drag is also considered
in the analysis. Mass flow in engine air inlet and exhaust are calculated by iteration which equalizes
thrust to total drag force. Engine air inlet is defined as pressure outlet and engine exhaust is defined as
mass flow inlet with average exhaust temperature of 1200 °K. Target mass flow in engine inlet is given
in Fluent settings which will be the mass flow equalizing the thrust to drag.
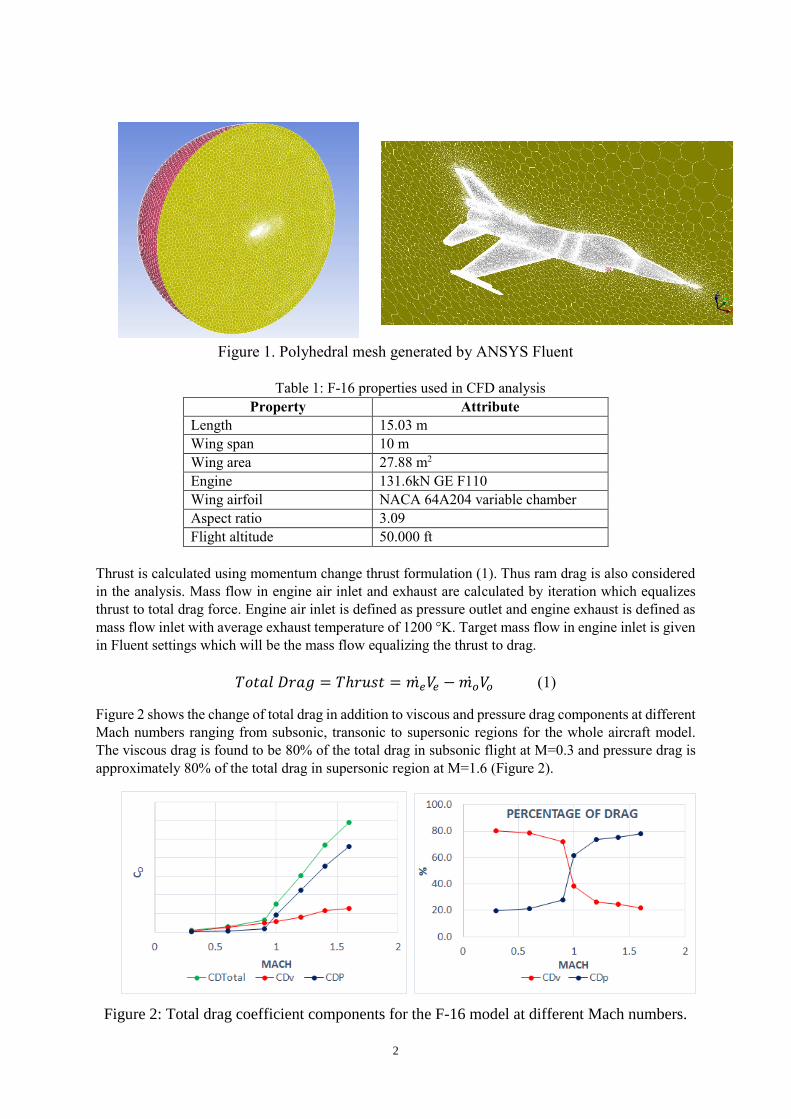
𝑇𝑜𝑡𝑎𝑙 𝐷𝑟𝑎𝑔 = 𝑇ℎ𝑟𝑢𝑠𝑡 = 𝑚𝑒̇ 𝑉𝑒 − 𝑚𝑜̇ 𝑉𝑜 (1) Figure 2 shows the change of total drag in addition to viscous and pressure drag components at different
Mach numbers ranging from subsonic, transonic to supersonic regions for the whole aircraft model.
The viscous drag is found to be 80% of the total drag in subsonic flight at M=0.3 and pressure drag is
approximately 80% of the total drag in supersonic region at M=1.6 (Figure 2).
Figure 2: Total drag coefficient components for the F-16 model at different Mach numbers.
3
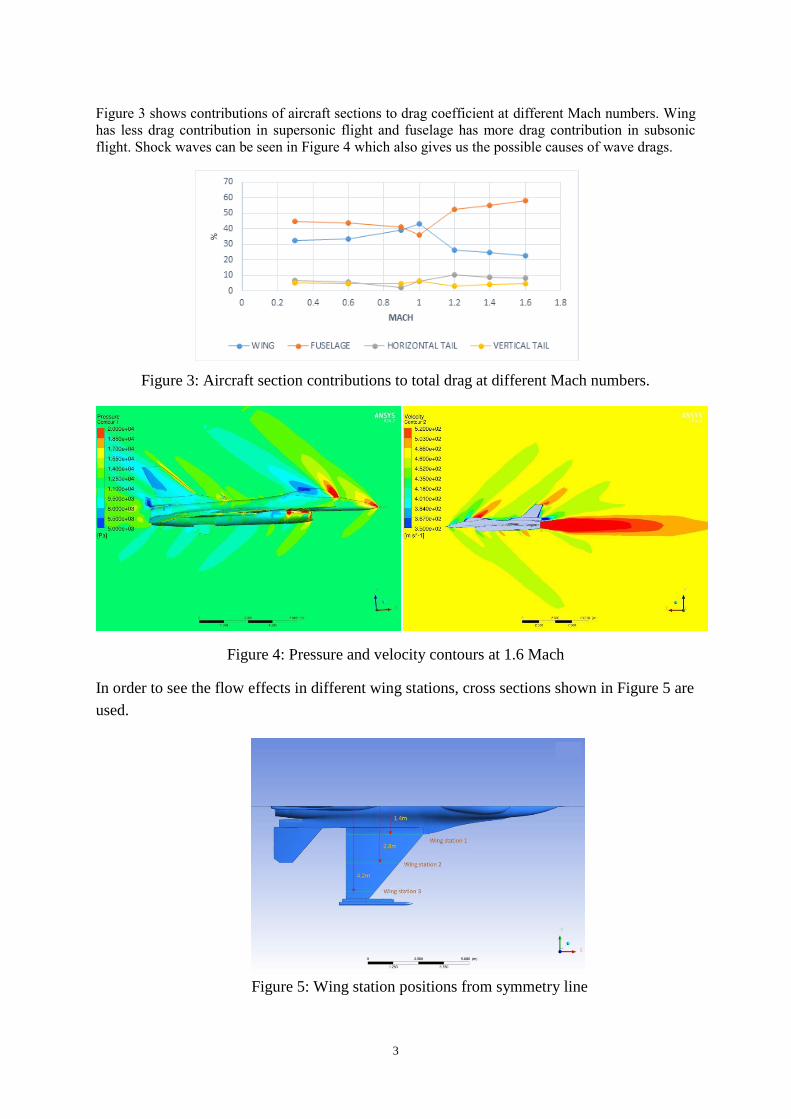
Figure 3 shows contributions of aircraft sections to drag coefficient at different Mach numbers. Wing
has less drag contribution in supersonic flight and fuselage has more drag contribution in subsonic
flight. Shock waves can be seen in Figure 4 which also gives us the possible causes of wave drags.
Figure 3: Aircraft section contributions to total drag at different Mach numbers.
Figure 4: Pressure and velocity contours at 1.6 Mach
In order to see the flow effects in different wing stations, cross sections shown in Figure 5 are
used.
Figure 5: Wing station positions from symmetry line
4
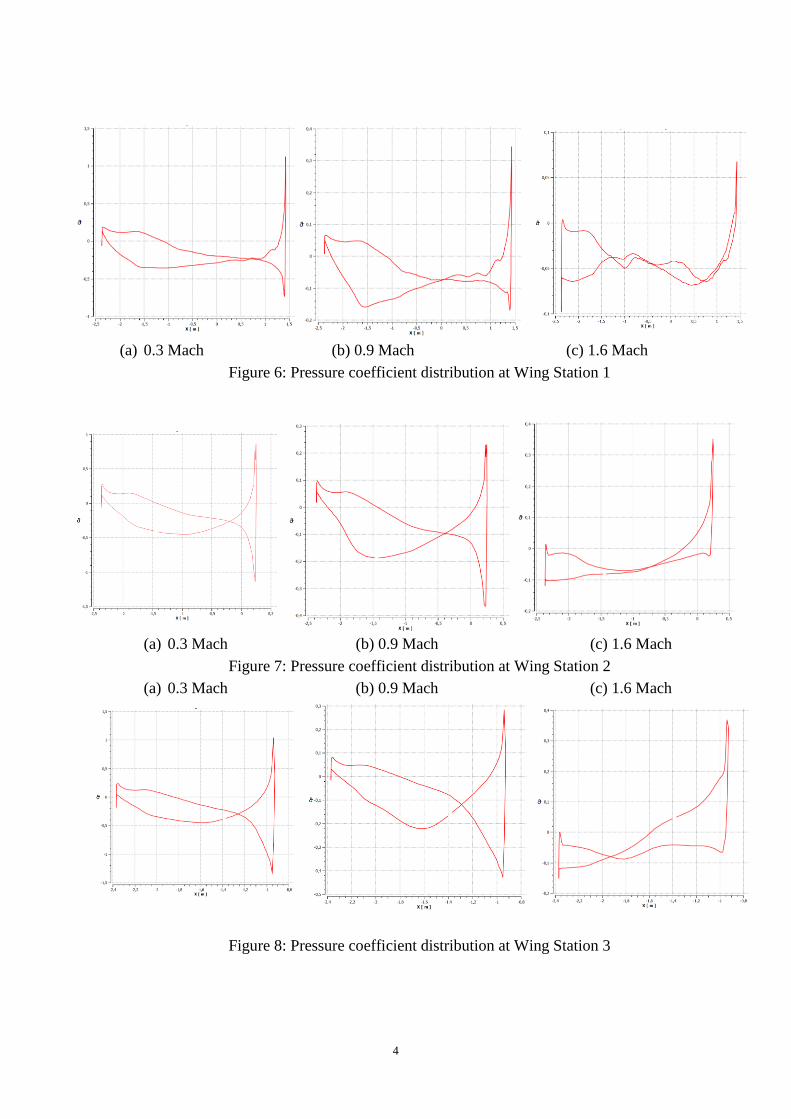
(a) 0.3 Mach (b) 0.9 Mach (c) 1.6 Mach
Figure 6: Pressure coefficient distribution at Wing Station 1
(a) 0.3 Mach (b) 0.9 Mach (c) 1.6 Mach
Figure 7: Pressure coefficient distribution at Wing Station 2
(a) 0.3 Mach (b) 0.9 Mach (c) 1.6 Mach
Figure 8: Pressure coefficient distribution at Wing Station 3
5
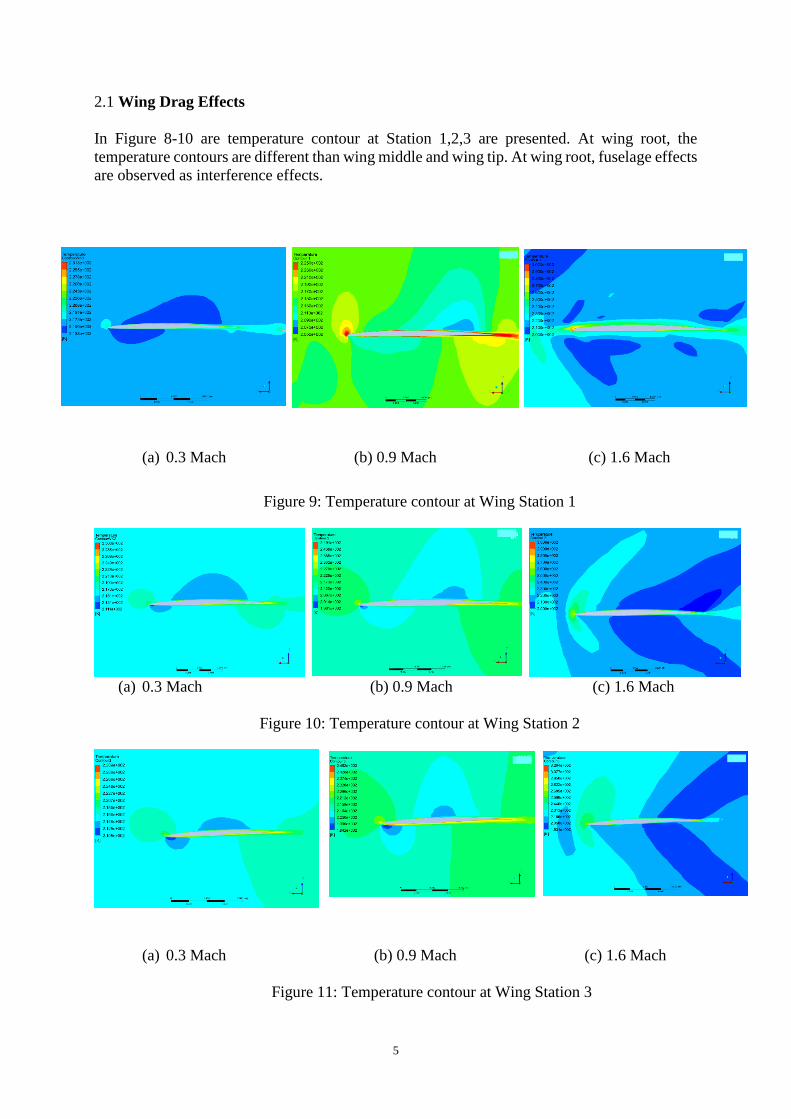
2.1 Wing Drag Effects
In Figure 8-10 are temperature contour at Station 1,2,3 are presented. At wing root, the
temperature contours are different than wing middle and wing tip. At wing root, fuselage effects
are observed as interference effects.
(a) 0.3 Mach (b) 0.9 Mach (c) 1.6 Mach
Figure 9: Temperature contour at Wing Station 1
(a) 0.3 Mach (b) 0.9 Mach (c) 1.6 Mach
Figure 10: Temperature contour at Wing Station 2
(a) 0.3 Mach (b) 0.9 Mach (c) 1.6 Mach
Figure 11: Temperature contour at Wing Station 3
6
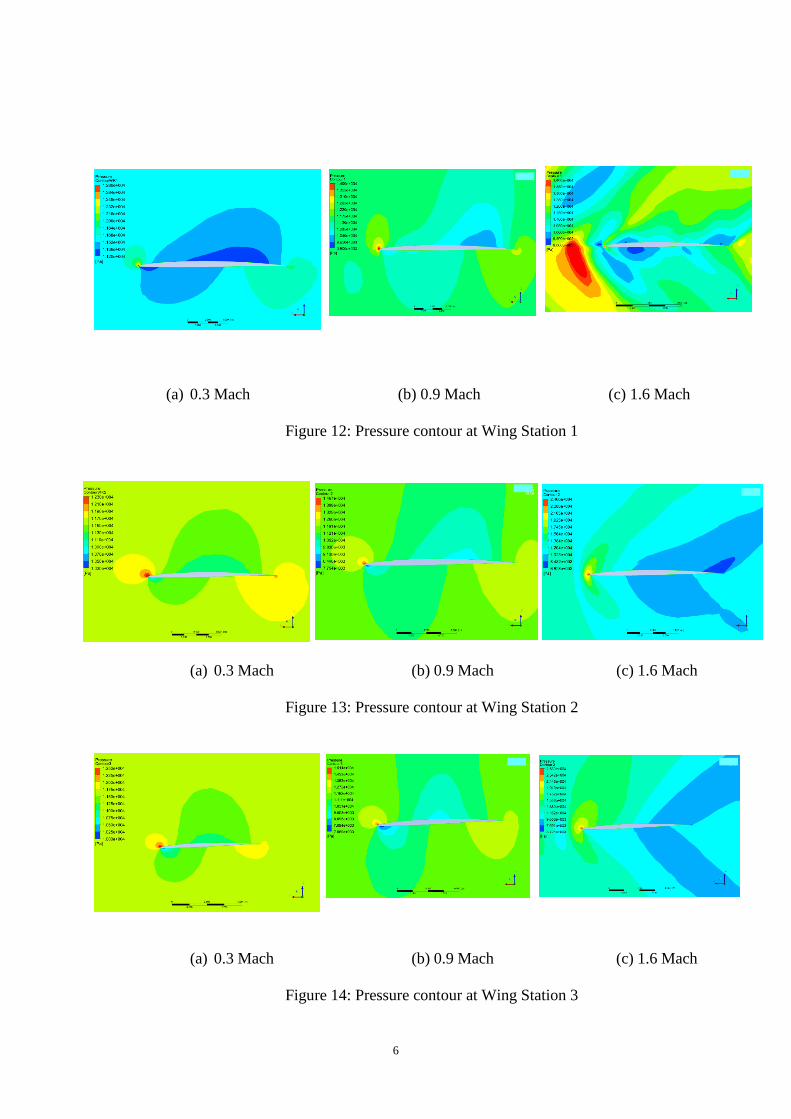
(a) 0.3 Mach (b) 0.9 Mach (c) 1.6 Mach
Figure 12: Pressure contour at Wing Station 1
(a) 0.3 Mach (b) 0.9 Mach (c) 1.6 Mach
Figure 13: Pressure contour at Wing Station 2
(a) 0.3 Mach (b) 0.9 Mach (c) 1.6 Mach
Figure 14: Pressure contour at Wing Station 3
7
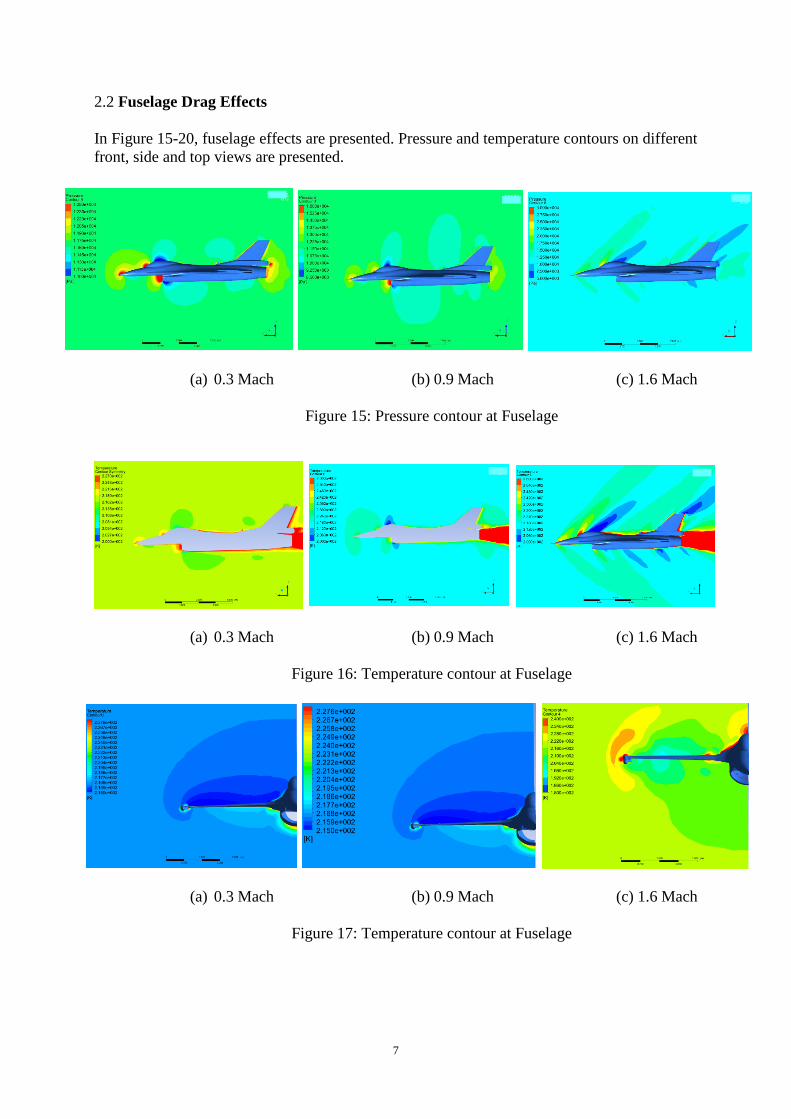
2.2 Fuselage Drag Effects
In Figure 15-20, fuselage effects are presented. Pressure and temperature contours on different
front, side and top views are presented.
(a) 0.3 Mach (b) 0.9 Mach (c) 1.6 Mach
Figure 15: Pressure contour at Fuselage
(a) 0.3 Mach (b) 0.9 Mach (c) 1.6 Mach
Figure 16: Temperature contour at Fuselage
(a) 0.3 Mach (b) 0.9 Mach (c) 1.6 Mach
Figure 17: Temperature contour at Fuselage
8
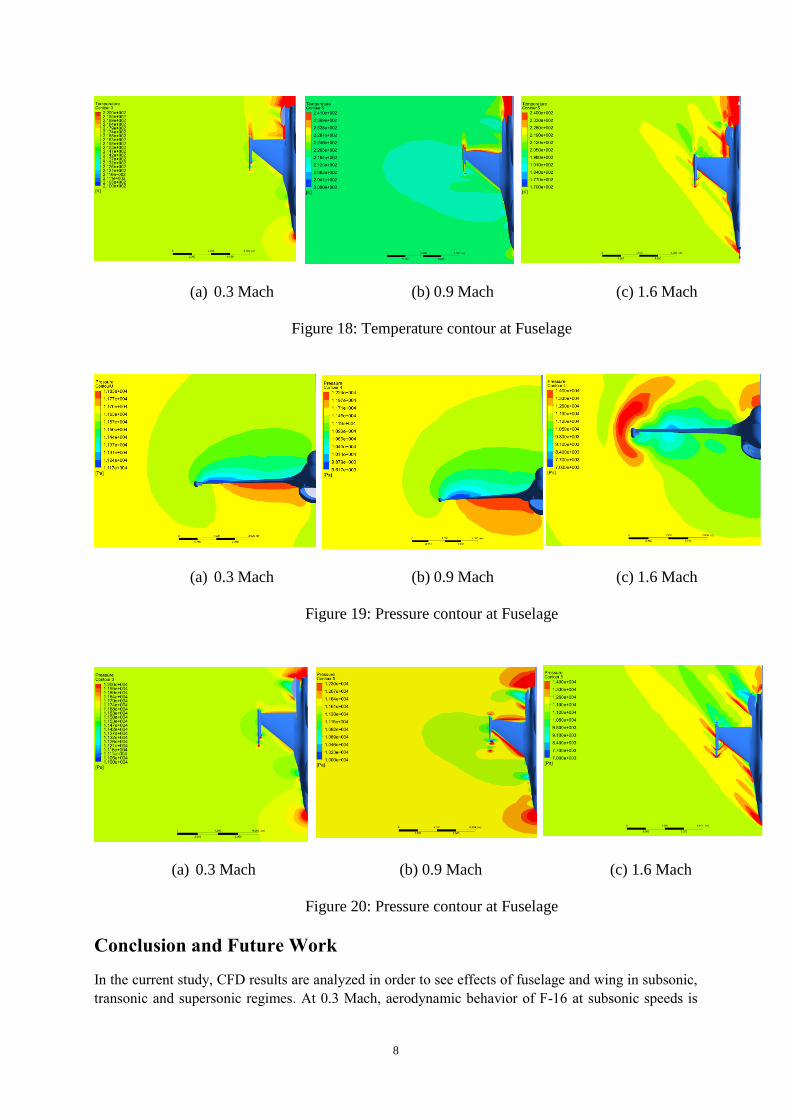
(a) 0.3 Mach (b) 0.9 Mach (c) 1.6 Mach
Figure 18: Temperature contour at Fuselage
(a) 0.3 Mach (b) 0.9 Mach (c) 1.6 Mach
Figure 19: Pressure contour at Fuselage
(a) 0.3 Mach (b) 0.9 Mach (c) 1.6 Mach
Figure 20: Pressure contour at Fuselage
Conclusion and Future Work In the current study, CFD results are analyzed in order to see effects of fuselage and wing in subsonic,
transonic and supersonic regimes. At 0.3 Mach, aerodynamic behavior of F-16 at subsonic speeds is
9
observed. At 0.9 Mach, aerodynamic behavior of aircraft at transonic regime is presented and at 1.6
Mach aerodynamic behavior of aircraft at supersonic regime is presented. Fuselage has highest drag
contribution due to its high cross section area at subsonic and supersonic speeds. At subsonic regime,
viscous drag has more contribution and at supersonic regime, pressure drag has more contribution. This
research is supported by TUBITAK fonds.
References [1] Ohad Gur, William H.Mason and Joseph A. Schetz, Full-Configuration Drag Estimation. Journal
of Aircraft Vol.47, No 4 July-August 2010.
[2] Charles A. Jobe, Prediction of Aerodynamic Drag, Air Force Right Aerodynamic Laboratories,
July 1984.
[3] Bowes, G.M., Aircraft Lift and Drag Prediction and Measurement. ACARD-LS-67, May 1974,
pp. 4-1 - 4-44.
[4] C. W. Smith, J. N. Ralston, and H. W. Mann, Aerodynamic Characteristics of Forebody and Nose
Strakes Based on F-16 Wind Tunnel Test Experience, NASA Contractor Report 3053, July 1979
[5] Sighard .F. Hoerner, Fluid Dynamic Drag, 1965
[6] Manish Sharma, T. Ratna Reddy, Ch. Indira Priyadarsini, Flow Analysis over and F-16 Aircraft
Using Computational Fluid Dynamics: A complete work. International Journal of Emerging
Technology and Advanced Engineering. Volume 3, Issue 5, May 2013.
[7] Webb, T.S., Kent, D.R., Webb, J.B. Correlation of F-16 aerodynamics and performance
predictions with early flight test results. Agard Conference Proceedings. n 242. Oct 11-13, 1977.
[8] Arnaiz, H.H., Flight-Measured Lift and Drag Characteristics of a Large, Flexible, High
Supersonic Cruise Airplane, NASA TM X-3532, May 1977.
[9] Kyle D. Squires, James R. Forsythe and Scott A. Morton, William Z. Strang, Kenneth E. Wurtzler,
and Robert F., Tomaro, Matthew J. Grismer, Philippe R. Spalart, Progress on Detached-Eddy
Simulation of Massively Separated Flows, Aerospace Sciences Meeting 14–18 January 2002.
[10] John P. Dean, James D. Clifton, David J. Bodkin, Scott A. Morton, David R. McDaniel,
Determining the Applicability and Effectiveness of Current CFD Methods in Store Certification
Activities, 48th AIAA Aerospace Sciences Meeting Including the New Horizons Forum and
Aerospace Exposition 4 - 7 January 2010.
[11] John P. Dean, James D. Clifton, David J. Bodkin, C. Justin Ratcliff. McDaniel, High Resolution
CFD Simulations of Maneuvering Aircraft Using the CREATE-AV/Kestrel Solver, 49th AIAA
Aerospace Sciences Meeting including the New Horizons Forum and Aerospace Exposition, 4 - 7
January 2011.
[12] Polyhedral, Tetrahedral, and Hexahedral Mesh Comparison
http://www.symscape.com/polyhedral-tetrahedral-hexahedral-mesh-comparison
[13] Georgios Balafas, Polyhedral Mesh Generation for CFD-Analysis of Complex Structures,
Master of Science Thesis, Faculty of Civil Engineering and Geodesy Technische Universitat
München, 2014.


