
DRAFT Sleep Mood Swim PDF
17
Sleep, Mood & Swimming What Is The Effect Of Sleep Quality And Sleep Duration On The Interplay Between Mood And Swimming? Performance? Luke Costley White
-
Upload
luke-costley-white -
Category
Documents
-
view
21 -
download
1
Transcript of DRAFT Sleep Mood Swim PDF

Sleep, Mood & Swimming
What Is The Effect Of Sleep Quality And Sleep Duration On The Interplay Between
Mood And Swimming? Performance?
Luke!Costley!White
What is sleep?1. Neurobiology 2. Function 3. how is it studied? 4. Why is it important for sport? 5. How does sleep affect mood?

NeurobiologyI’m sure you all remember these sleep basics but just in case:
NREM Sleep Stage 1
NREM Sleep Stage 2
NREM Sleep Stage 3
REM Sleep
Awake
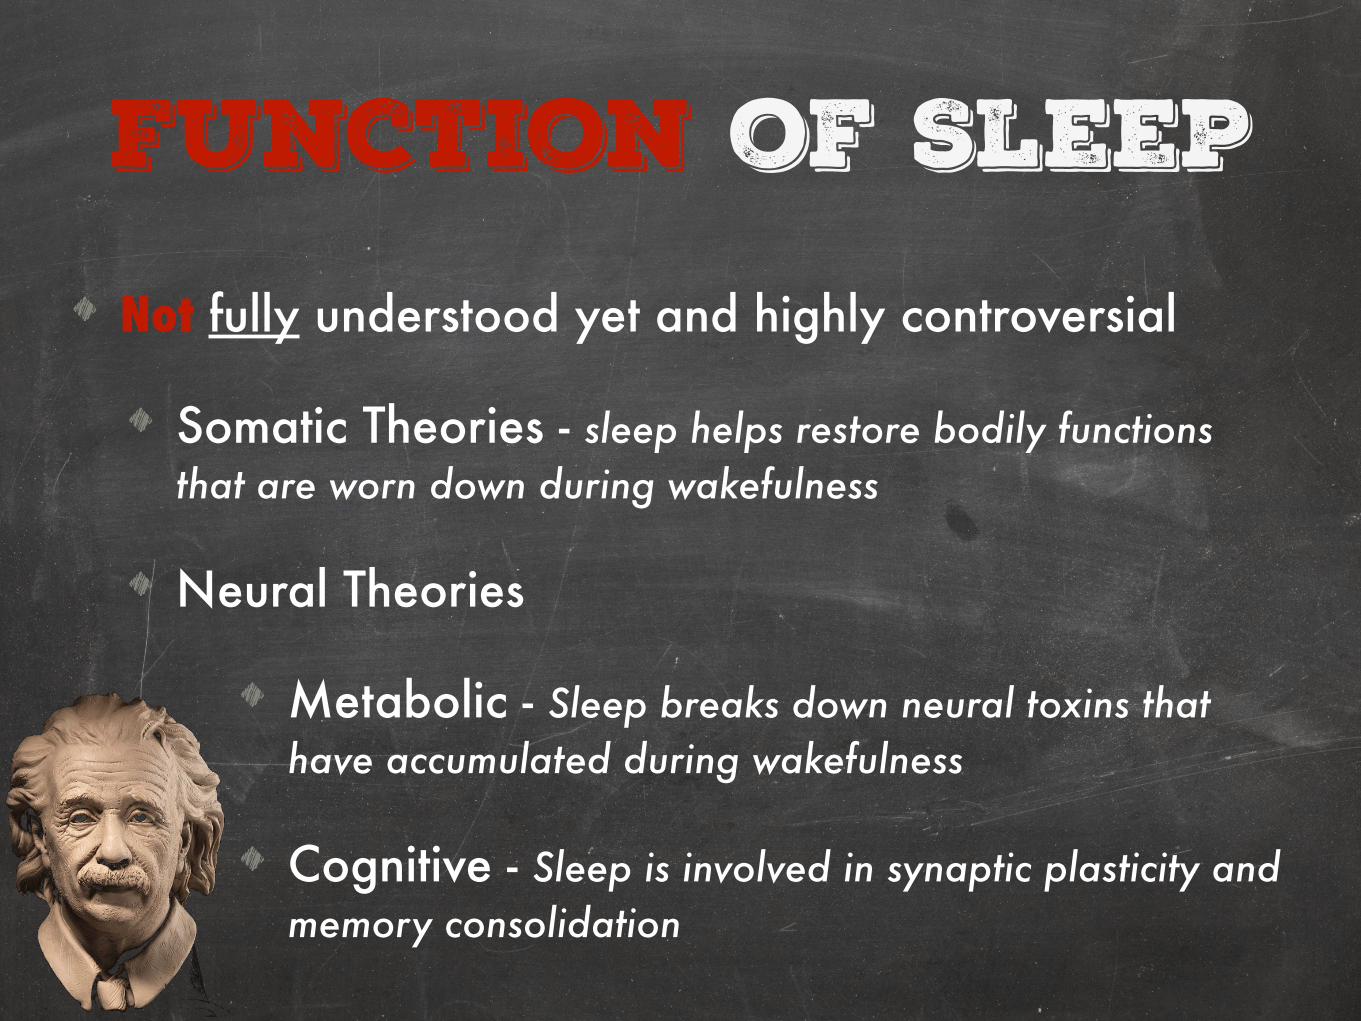
Function of SleepNot fully understood yet and highly controversial
Somatic Theories - sleep helps restore bodily functions that are worn down during wakefulness
Neural Theories
Metabolic - Sleep breaks down neural toxins that have accumulated during wakefulness
Cognitive - Sleep is involved in synaptic plasticity and memory consolidation
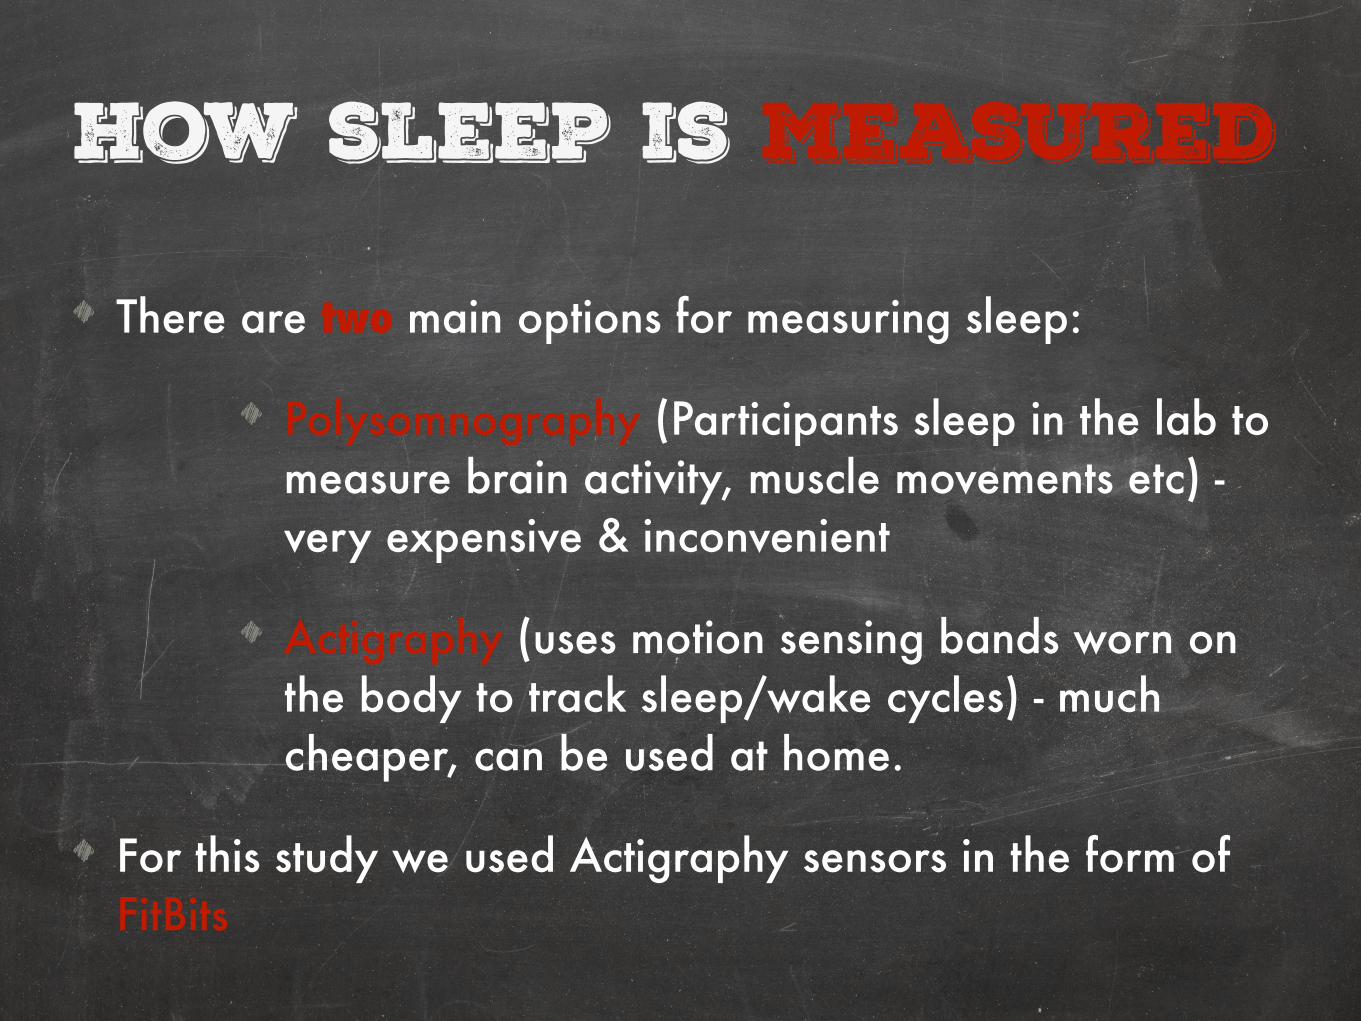
How sleep is Measured
There are two main options for measuring sleep:
Polysomnography (Participants sleep in the lab to measure brain activity, muscle movements etc) - very expensive & inconvenient
Actigraphy (uses motion sensing bands worn on the body to track sleep/wake cycles) - much cheaper, can be used at home.
For this study we used Actigraphy sensors in the form of FitBits
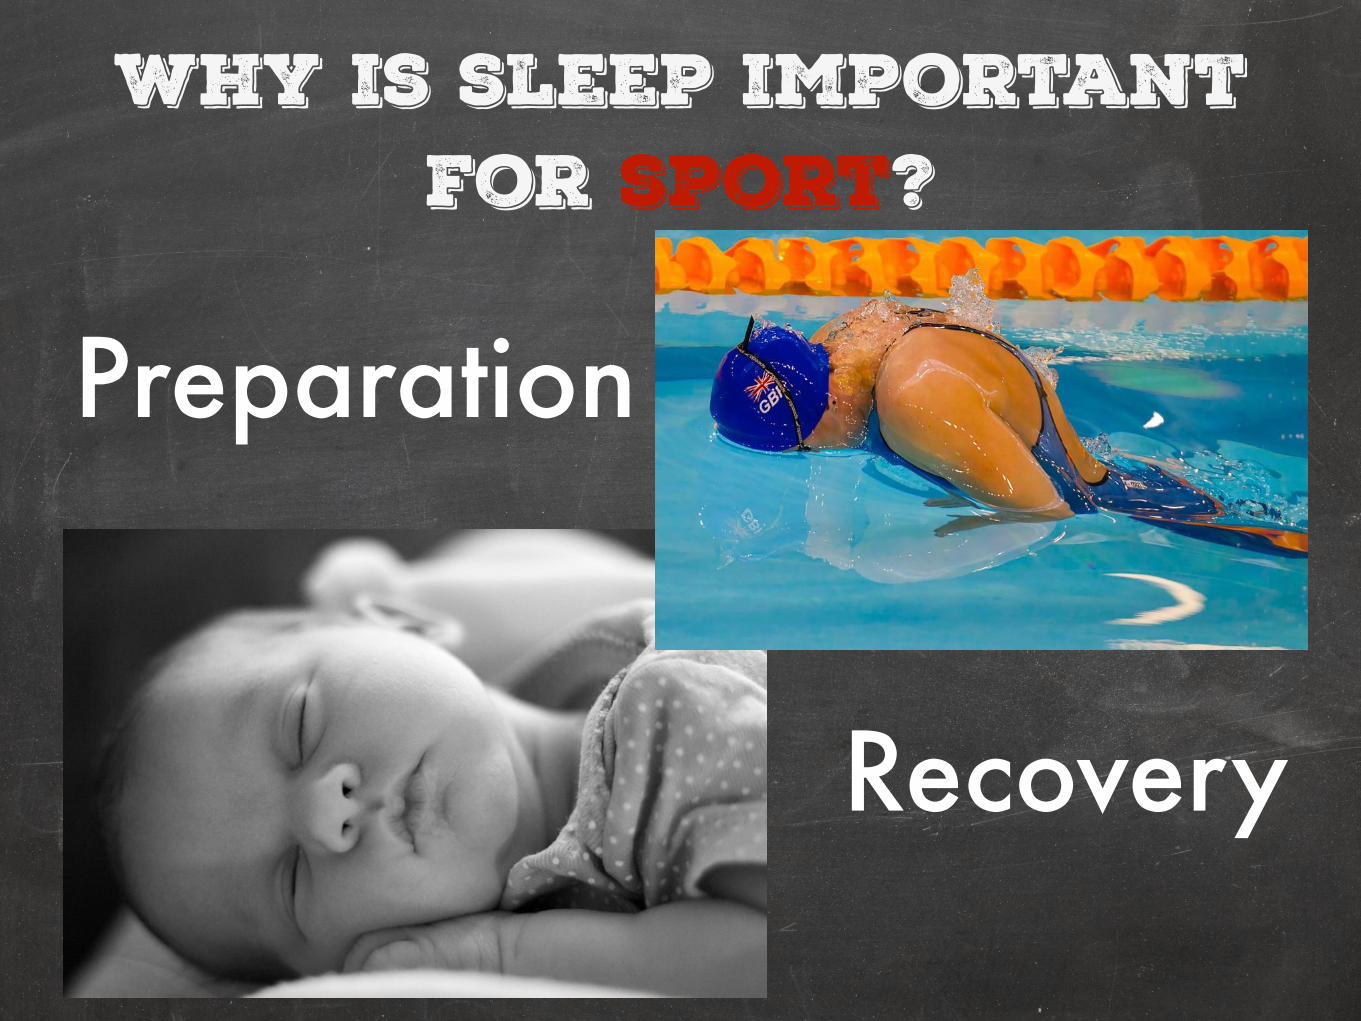
Why is sleep important for sport?
Preparation
!
Recovery
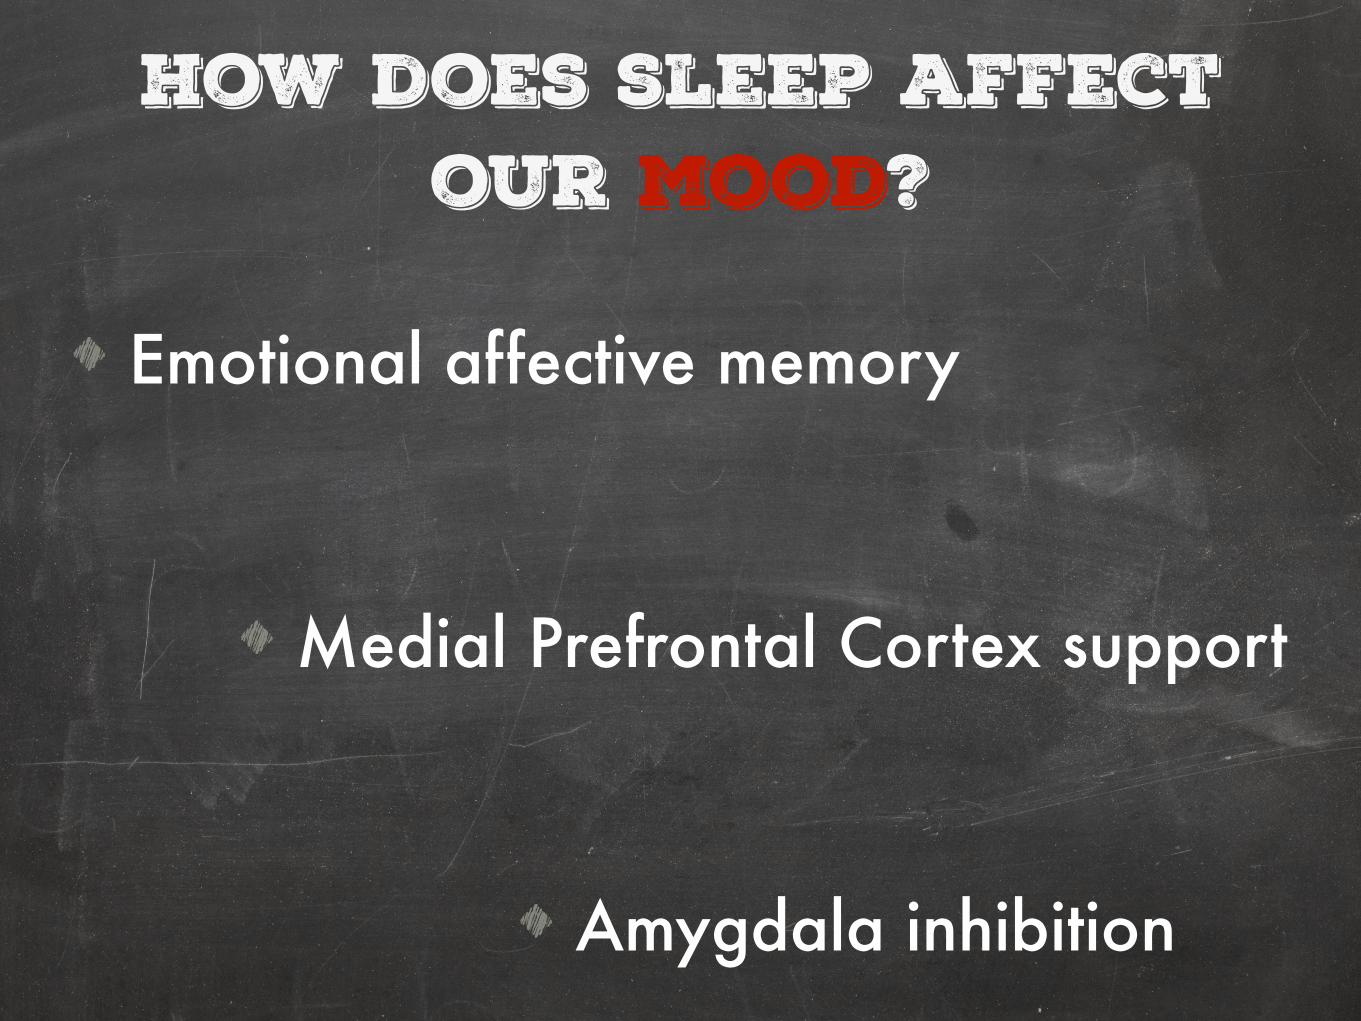
How does sleep affect our mood?
Emotional affective memory
!
Medial Prefrontal Cortex support
!
Amygdala inhibition

Methods:1. Sample 2. Apparatus 3. Materials 4. procedure
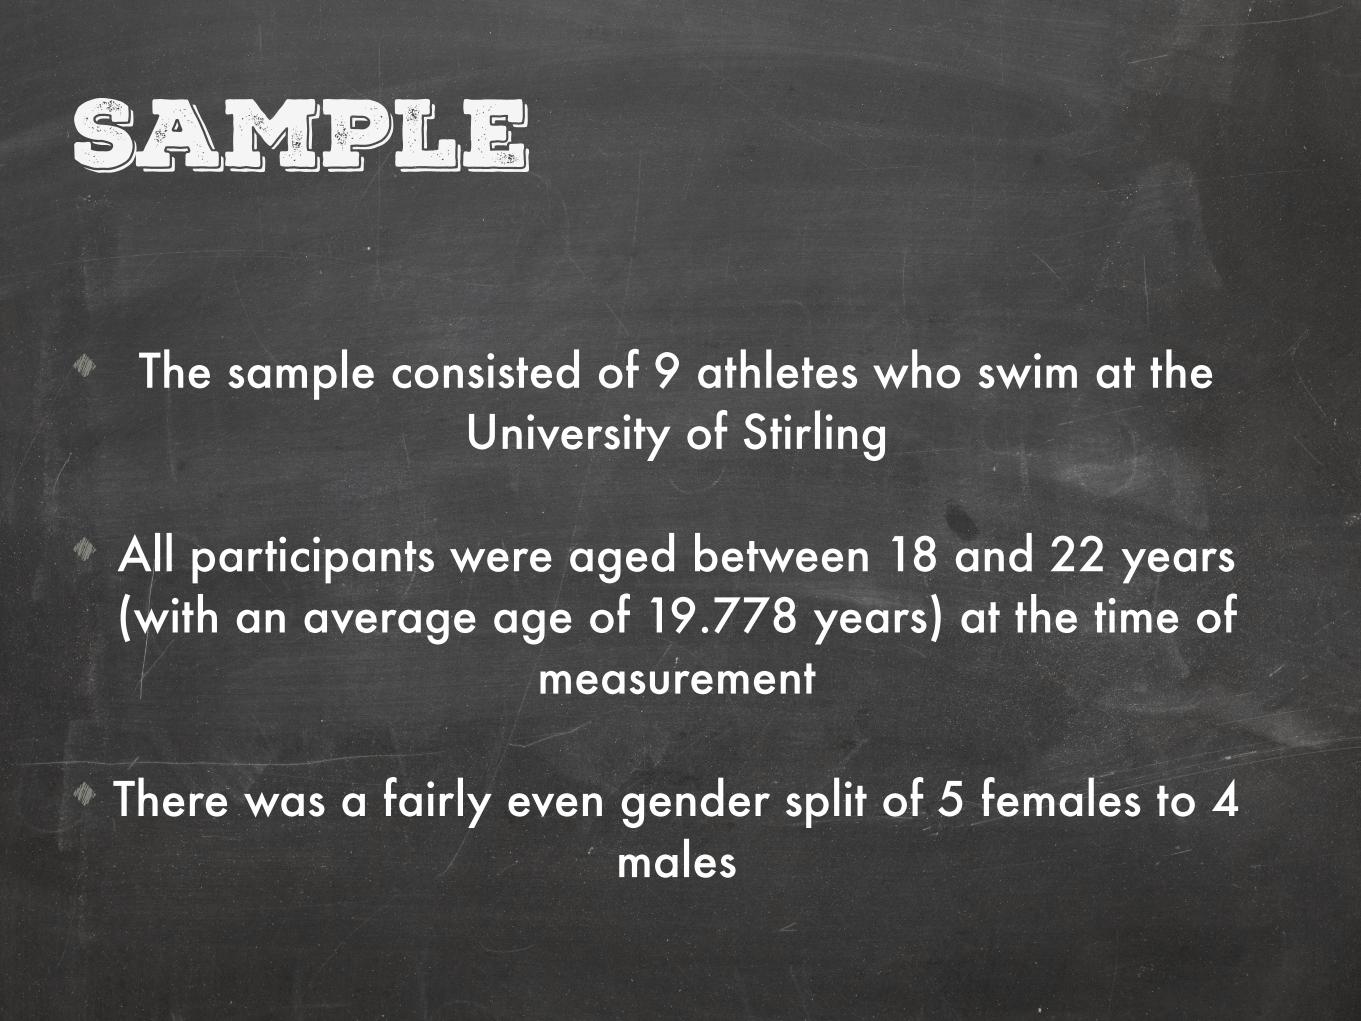
Sample
The sample consisted of 9 athletes who swim at the University of Stirling
!
All participants were aged between 18 and 22 years (with an average age of 19.778 years) at the time of
measurement !
There was a fairly even gender split of 5 females to 4 males
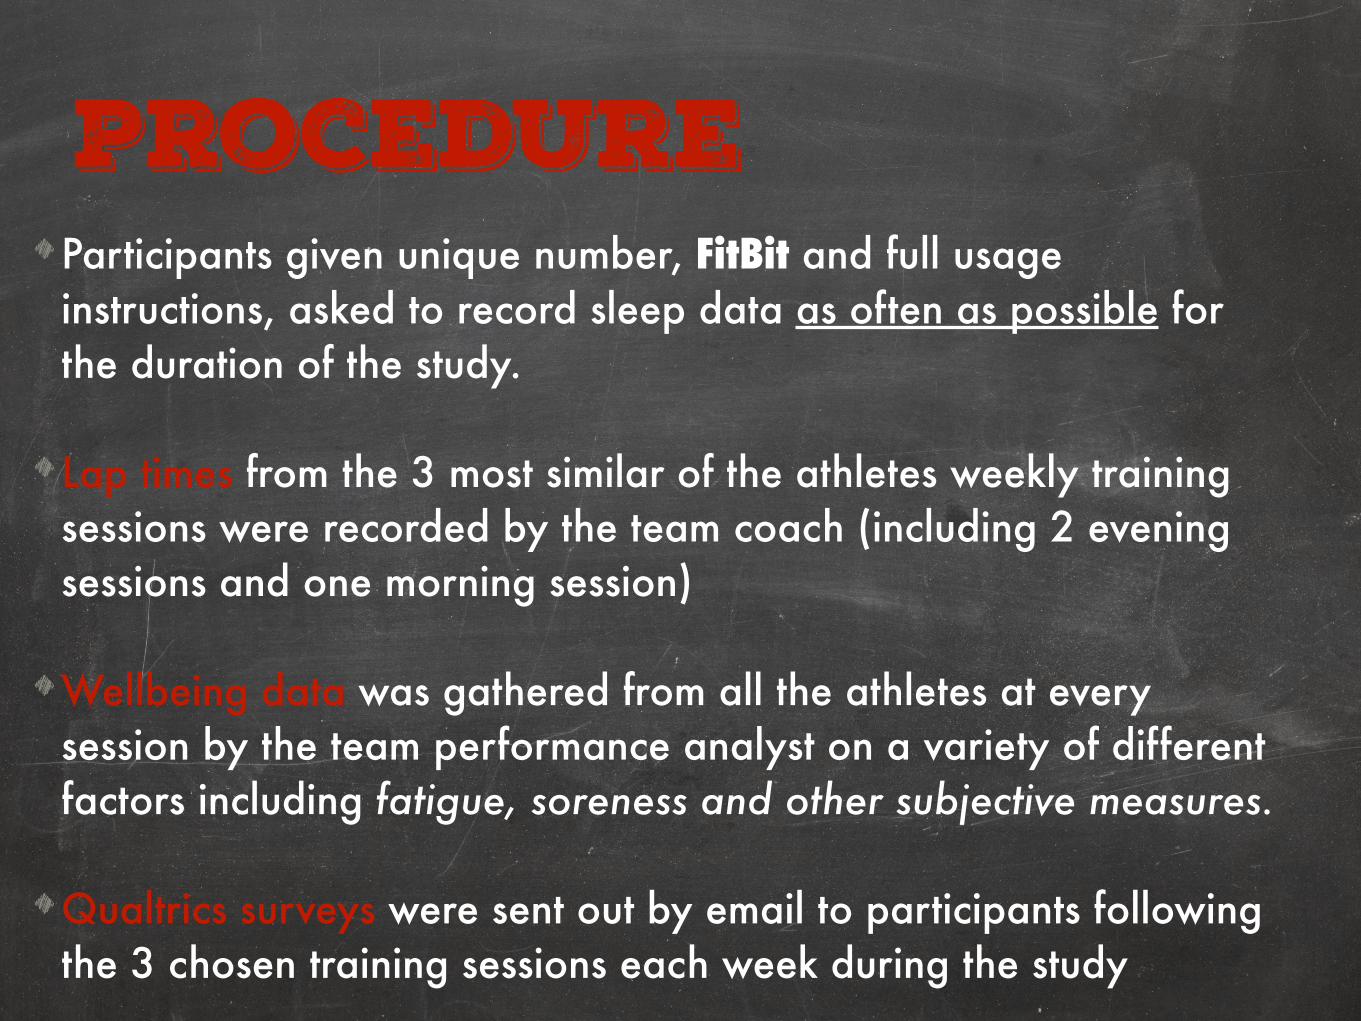
procedureParticipants given unique number, FitBit and full usage instructions, asked to record sleep data as often as possible for the duration of the study.
!Lap times from the 3 most similar of the athletes weekly training sessions were recorded by the team coach (including 2 evening sessions and one morning session)
!Wellbeing data was gathered from all the athletes at every session by the team performance analyst on a variety of different factors including fatigue, soreness and other subjective measures.
!Qualtrics surveys were sent out by email to participants following the 3 chosen training sessions each week during the study
Results:1. Sleep variation 2. Mood as a product of sleep 3. Wellbeing data 4. The elusive swim data
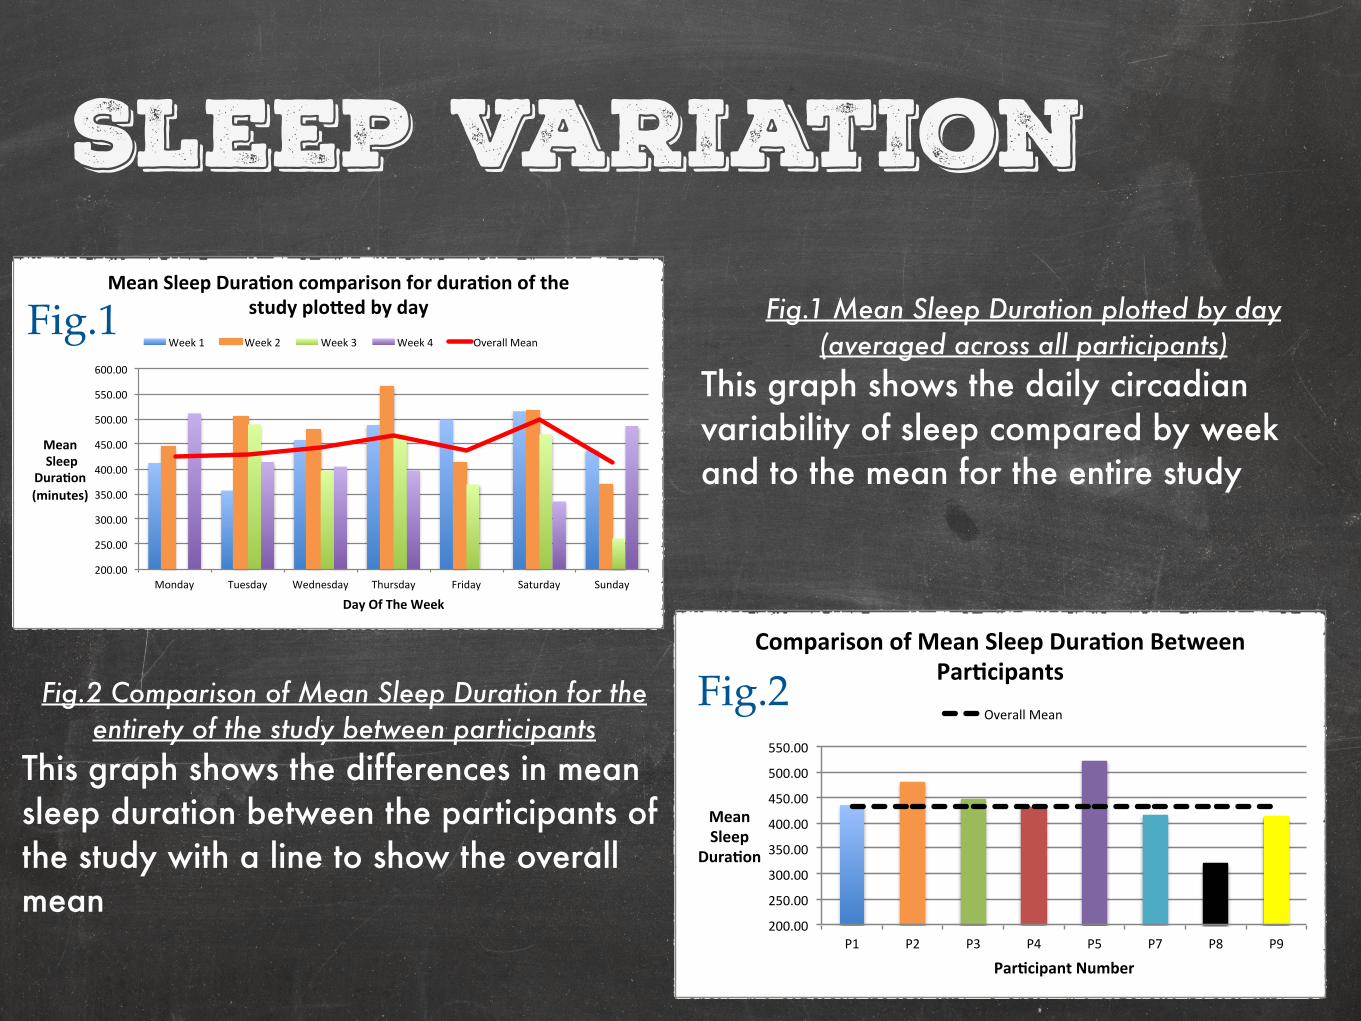
Sleep variationFig.1 Mean Sleep Duration plotted by day
(averaged across all participants) This graph shows the daily circadian variability of sleep compared by week and to the mean for the entire study
Fig.2 Comparison of Mean Sleep Duration for the entirety of the study between participants
This graph shows the differences in mean sleep duration between the participants of the study with a line to show the overall mean
200.00$
250.00$
300.00$
350.00$
400.00$
450.00$
500.00$
550.00$
600.00$
Monday$ Tuesday$ Wednesday$ Thursday$ Friday$ Saturday$ Sunday$
Mean%%Sleep%%
Dura,on%(minutes)%
Day%Of%The%Week%
Mean%Sleep%Dura,on%comparison%for%dura,on%of%the%study%plo=ed%by%day%
Week$1$ Week$2$ Week$3$ Week$4$ Overall$Mean$
200.00$
250.00$
300.00$
350.00$
400.00$
450.00$
500.00$
550.00$
P1$ P2$ P3$ P4$ P5$ P7$ P8$ P9$
Mean%Sleep%
Dura,on%
Par,cipant%Number%
Comparison%of%Mean%Sleep%Dura,on%Between%Par,cipants%
Overall$Mean$Fig.2
Fig.1
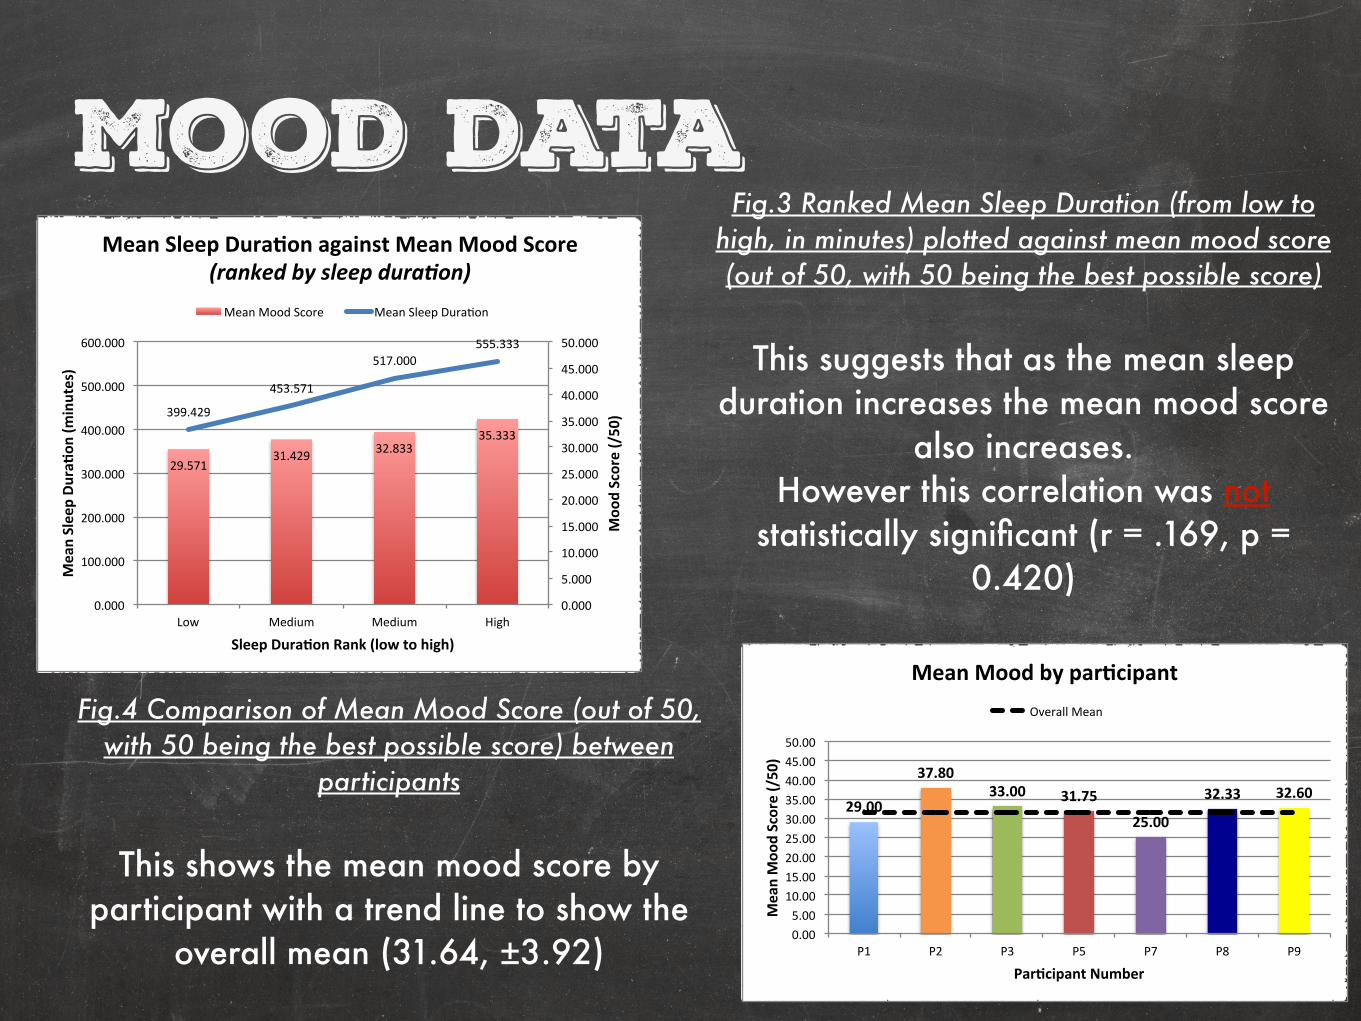
Mood dataFig.3 Ranked Mean Sleep Duration (from low to
high, in minutes) plotted against mean mood score (out of 50, with 50 being the best possible score)
!This suggests that as the mean sleep
duration increases the mean mood score also increases.
However this correlation was not statistically significant (r = .169, p =
0.420)
29.571'31.429' 32.833'
35.333'
399.429'
453.571'
517.000'555.333'
0.000'
5.000'
10.000'
15.000'
20.000'
25.000'
30.000'
35.000'
40.000'
45.000'
50.000'
0.000'
100.000'
200.000'
300.000'
400.000'
500.000'
600.000'
Low' Medium' Medium' High'Moo
d$Score$(/50)$
Mean$Sleep$Du
ra4o
n$(m
inutes)$
Sleep$Dura4on$Rank$(low$to$high)$
Mean$Sleep$Dura4on$against$Mean$Mood$Score$(ranked(by(sleep(dura/on)(
Mean'Mood'Score' Mean'Sleep'DuraAon'
Fig.4 Comparison of Mean Mood Score (out of 50, with 50 being the best possible score) between
participants !
This shows the mean mood score by participant with a trend line to show the
overall mean (31.64, ±3.92)
29.00%
37.80%33.00% 31.75%
25.00%
32.33% 32.60%
0.00#5.00#10.00#15.00#20.00#25.00#30.00#35.00#40.00#45.00#50.00#
P1# P2# P3# P5# P7# P8# P9#
Mean%Moo
d%Score%(/50)%
Par9cipant%Number%
Mean%Mood%by%par9cipant%Overall#Mean#
’Wellbeing’ Data
0"
1"
2"
3"
4"
5"
6"
7"
8"
9"
0" 1" 2" 3" 4" 5" 6" 7" 8" 9"
Overall''Soreness'
Fa-gue'
Overall'Soreness'(upper'&'lower'body)'plo8ed'against'Fa-gue'
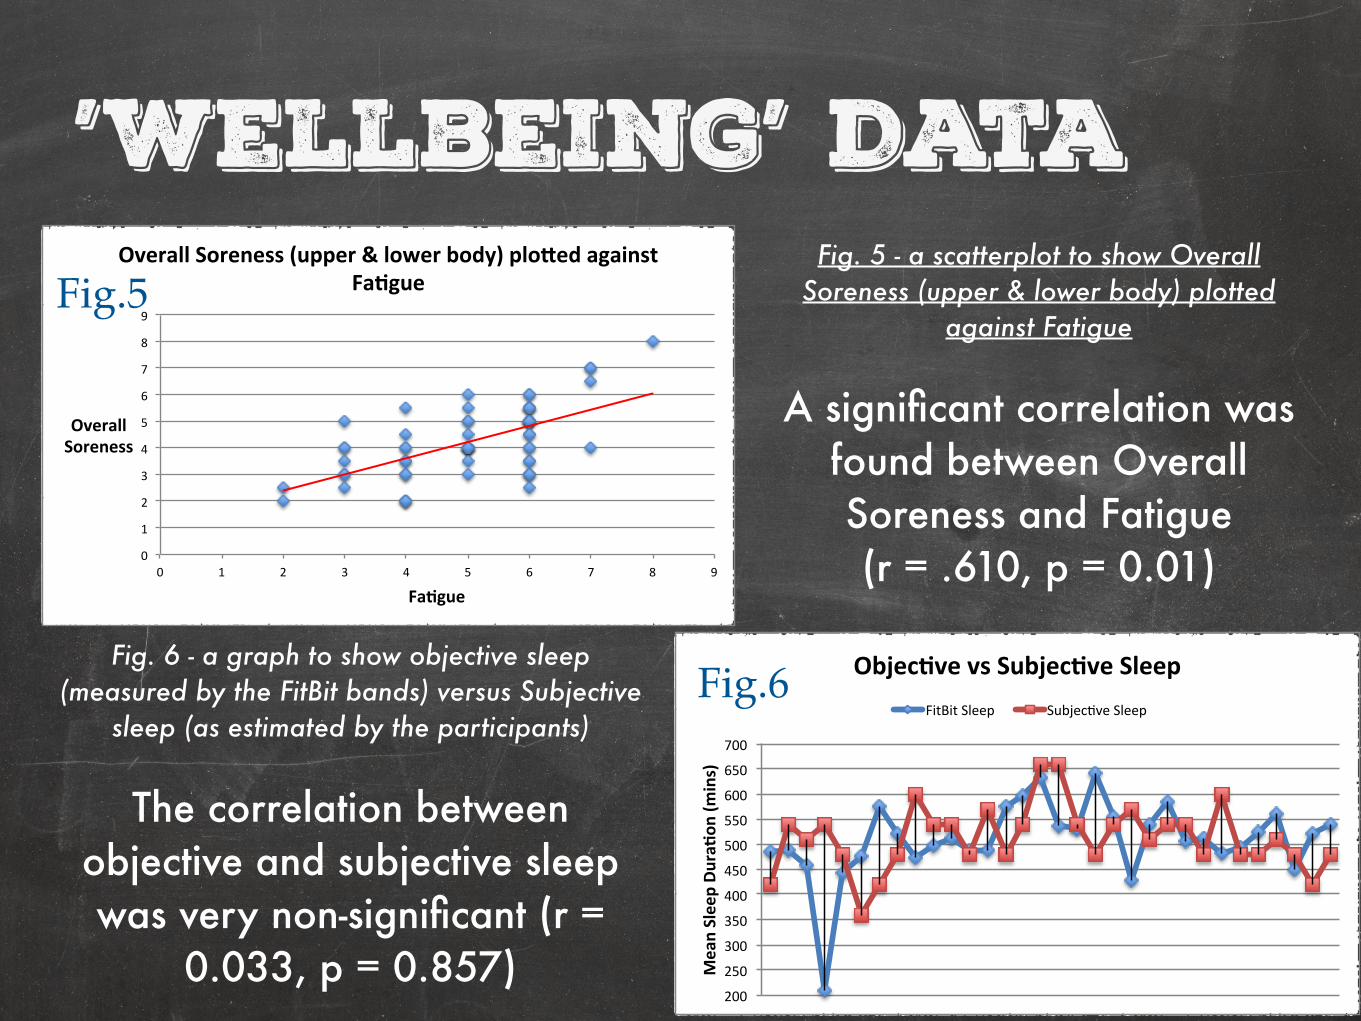
Fig. 5 - a scatterplot to show Overall Soreness (upper & lower body) plotted
against Fatigue !
A significant correlation was found between Overall Soreness and Fatigue (r = .610, p = 0.01)
200#
250#
300#
350#
400#
450#
500#
550#
600#
650#
700#
Mean%Sleep%Du
ra,o
n%(m
ins)%
Objec,ve%vs%Subjec,ve%Sleep%FitBit#Sleep# Subjec5ve#Sleep#
Fig. 6 - a graph to show objective sleep (measured by the FitBit bands) versus Subjective
sleep (as estimated by the participants) !
The correlation between objective and subjective sleep was very non-significant (r =
0.033, p = 0.857)
Fig.6
Fig.5
about that swim data...The averaged pace data previously provided cannot show individual variability and does not allow for a correlation to be performed. Therefore discussions are underway to receive day-by-day time data for the sessions studied.
Based on the literature we would suggest that these further results will show that improvements in sleep quality and mood lead to corresponding improvements in swim performance
What can we take from these results? a discussion of sorts
- Implications of the results
- Possible mechanisms
- How to improve our sleep (and thereby improve performance?)
- Limitations…
- Future Research

REFerences:Stickgold, R., & Walker, M. P. (2005). Memory consolidation and reconsolidation: what is the role of sleep?. Trends in neurosciences, 28(8), 408-415. !Halson, S. L. (2014). Sleep in elite athletes and nutritional interventions to enhance sleep. Sports Medicine, 44(1), 13-23. !Dijk, D. J. (2010). Slow-wave sleep deficiency and enhancement: implications for insomnia and its management. World Journal of Biological Psychiatry,11(S1), 22-28. !Walker, M. P., & Stickgold, R. (2014). Sleep, memory and plasticity.Neuroscience and Psychoanalysis, 1, 93. !Nishida, M., & Walker, M. P. (2007). Daytime naps, motor memory consolidation and regionally specific sleep spindles. PloS one, 2(4), e341. !Yoo, S. S., Gujar, N., Hu, P., Jolesz, F. A., & Walker, M. P. (2007). The human emotional brain without sleep—a prefrontal amygdala disconnect. Current Biology, 17(20), R877-R878.


![Sleep Problems are associated with Chronic Pain …...1]. Sleep problems are also associated with impairments in mood, cognition and physical ability 2[]. As people with chronic pain](https://static.fdocuments.net/doc/165x107/5fbf48b7579b4275f7585553/sleep-problems-are-associated-with-chronic-pain-1-sleep-problems-are-also.jpg)