Principles of Food Analysis for Filth, Decomposition and Foreign Material


Foodborne Illness Outbreaks from Microbial Contaminants in Spices, 1973-2010 | 2
FDA Draft Risk Profile | 14
Spice Linked to Outbreak Date
Country: Outbreak (Spice)a
Pathogenb Total Casesc
Hospital-izations (Deaths)
Other pathogens
isolated during
investigation
Comments Reference(s)
Fennel seed (Foeniculum
vulgare) (in “baby” tea
containing fennel seed,
anise seed, and caraway)
Mar 2007- Sep
2008
Serbia (Not
reported)
Salmonella Senftenberg 14 4 of 14
(Not reported) None reported
Microbiological link between spice and illness established. Parents of case-patients reported pouring boiling water over (dry) baby tea mixture during preparation but did not heat tea infusion to boiling. 71% of cases of illness in infants <12 months.
Ilic et al., 2010
White pepper (Piper nigrum)
Dec 2008 - Apr 2009
United States (Vietnam)
Salmonella Rissen 87
8 of 60 ; 14 additional
patients were hospitalized
before illness (1)
None reported
Microbiological link between spice and illness established. Environmental samples from spice processing facility tested positive for the outbreak strain. Multiple violations of CGMP noted during inspection of spice processing facility. Identification of implicated vehicle aided by knowledge that the outbreak strain had been isolated in 2006 from an FDA import sample of black pepper.
CDPH/FDB/ ERU, 2010; FDA, 2009a; Higa, 2011;
Hajmeer and Myers, 2011;
Higa, 2012
Black pepper (Piper nigrum) and red pepper (Capsicum spp.) (on Italian-style
salami)
Jul 2009 – Apr 2010
United States (black
pepper-Vietnam; red
pepper - India & China)
Salmonella Montevideo 272f 52 of 203
(0) S. Senftenberg
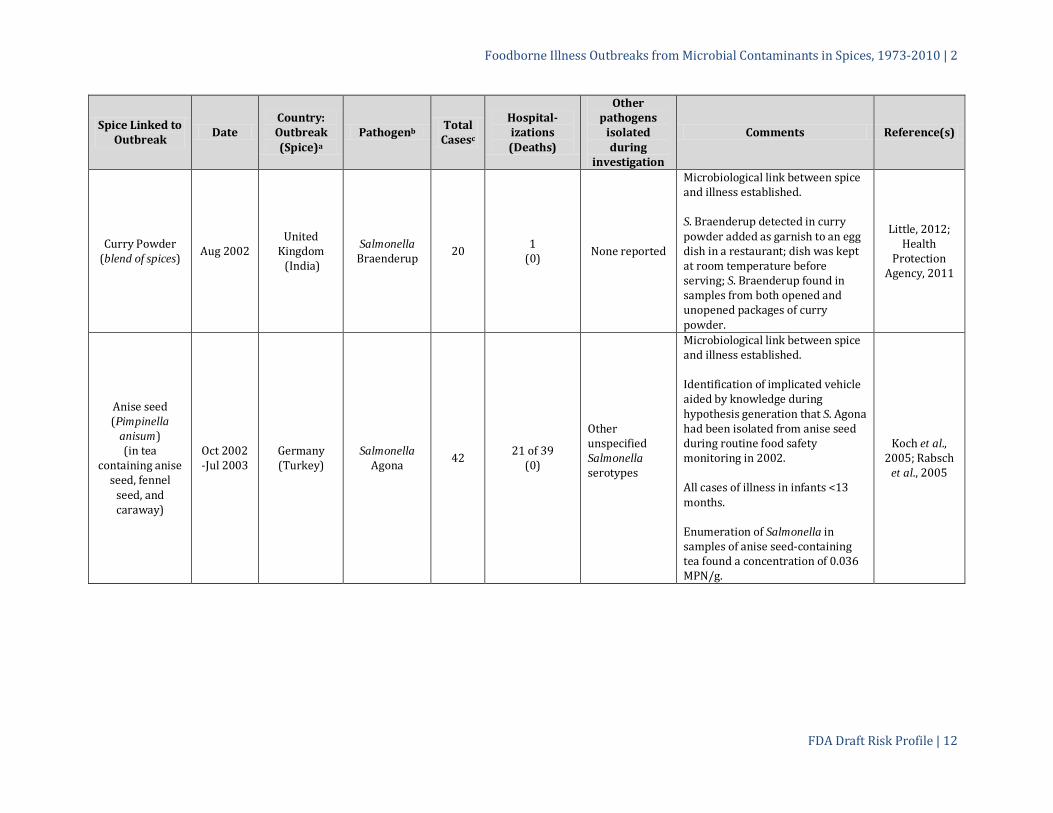
Microbiological link between spice and illness established. Black pepper and red pepper applied to salami products after the final pathogen reduction step. Isolating S. Senftenberg from implicated product led to identification of a linked S. Senftenberg outbreak.
CDC, 2010; Gieraltowski et al., 2012; DuVernoy,
2012
Foodborne Illness Outbreaks from Microbial Contaminants in Spices, 1973-2010 | 2
FDA Draft Risk Profile | 15
Spice Linked to Outbreak Date
Country: Outbreak (Spice)a
Pathogenb Total Casesc
Hospital-izations (Deaths)
Other pathogens
isolated during
investigation
Comments Reference(s)
Black pepper (Piper nigrum) and red pepper (Capsicum spp.) (on Italian-style
salami) continued
Jul 2009 – Apr 2010
United States (black
pepper-Vietnam; red
pepper - India & China)
Salmonella Senftenberg 11 Not reported
(Not reported) S. Montevideo
Microbiological link between spice and illness established. Outbreak identified during S. Montevideo outbreak investigation after sample of unopened retail package of salami was positive for S. Senftenberg.
CDC, 2010; DuVernoy,
2012
White pepper (Piper nigrum)
(in stew) 2010 Denmark
(Unknown) Bacillus cereus 112 0
(0) Unknown
Microbiological link between spice and illness established. Contaminated white pepper in stew. Canteen/workplace catering setting. Storage time/temperature abuse suspected as contributing.
EFSA, 2013; EFSA, 2011a
a Country where outbreak occurred following by country of origin of the spice in parentheses. b Salmonella serotypes listed are serotypes of Salmonella enterica subspecies enterica. c Number of cases of illness listed are the number of documented cases of illness. Several sources indicate that this number significantly underestimates the actual number of illnesses
associated with the outbreak (Scallan et al, 2011; Mead et al., 1999; Voetsch et al., 2004; Chalker and Blaser, 1988). See text for further details. d Number of human cases of illness associated with rare serotypes of Salmonella found in paprika or paprika-powdered potato chips during the outbreak. Approximately 42% of illnesses
were associated with the three prevailing S. serotypes e Duration of outbreak not known (Little, 2012; Health Protection Agency, 2011) f Number of cases of illness listed are number of epidemiologically linked cases of illness (CDC, 2010). A SNP-based evolutionary analysis of Montevideo isolates suggests that a portion of the
epidemiologically linked cases of illness may not be associated with this outbreak (see text, den Bakker et al., 2011).

Foodborne Illness Outbreaks from Microbial Contaminants in Spices, 1973-2010 | 2
FDA Draft Risk Profile | 16
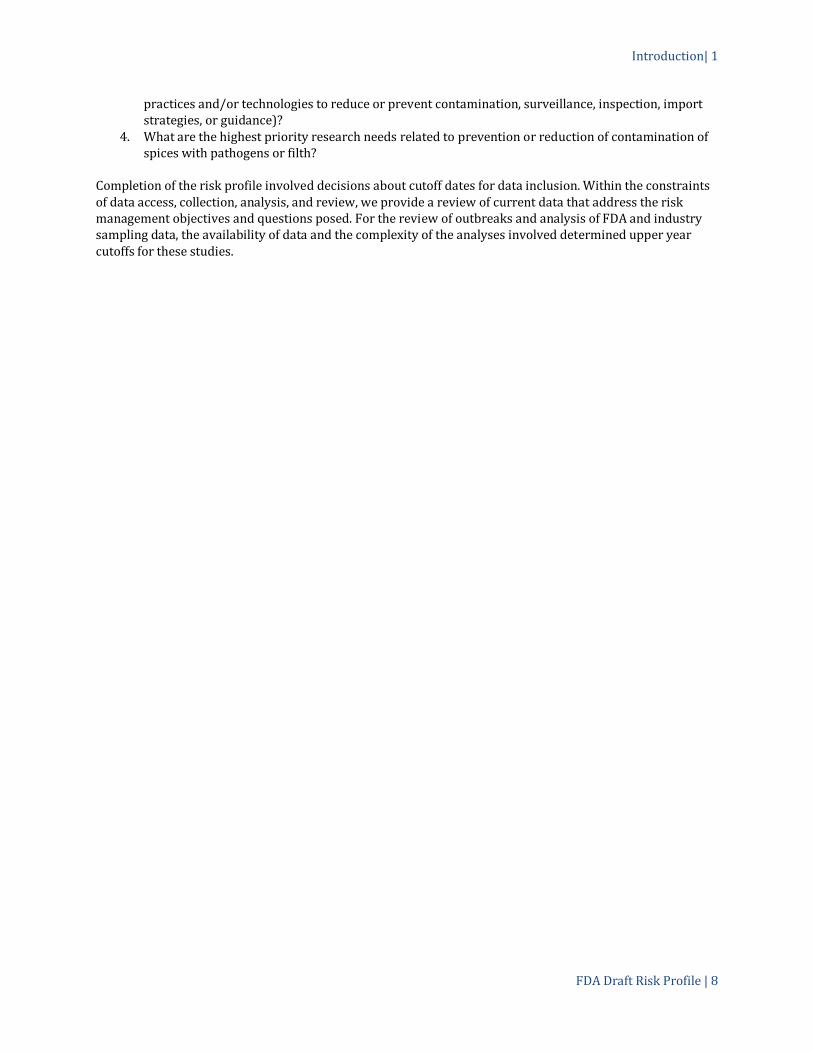
Ten of the fourteen (71%) spice-associated outbreaks and 87% of the illnesses were caused by serotypes of Salmonella enterica subspecies enterica. Four outbreaks were caused by Bacillus spp., accounting for 13% of the illnesses. Four outbreaks were associated with two or more different organisms (multiple serotypes of Salmonella or multiple species of Bacillus). Salmonella serotypes associated with human illnesses in these outbreaks included Agona (1 outbreak), Braenderup (1), Enteritidis (1), Javiana (1), Montevideo (1), Oranienburg (1), Rissen (1), Rubislaw (1), Saintpaul (1), Senftenberg (2), Typhimurium (1), Wandsworth (1), and Weltevreden (1) (Table 2.1). Bacillus species identified as causative agents in spice-associated outbreaks included B. cereus (2 outbreaks), B. subtilis (2) and B. pumilus (1). The evidence for the spice-associated B. subtilis and B. pumilus illness outbreaks reported in Table 2.1 included both epidemiological and microbiological data (Little, 2012). B. subtilis and B. pumilus are seldom reported as foodborne pathogens but these organisms may produce a mild toxin after growing to high numbers in a food (Logan, 2011).
Spices implicated in the outbreaks were black pepper (Piper nigrum; 4 outbreaks), red pepper (Capsicum spp.; 2 outbreaks), white pepper (Piper nigrum; 2 outbreaks), unspecified pepper (1 outbreak), curry powder (a blend of spices; 1 outbreak), anise seed (Pimpinella anisum; 1 outbreak), fennel seed (Foeniculum vulgare; 1 outbreak), turmeric (Curcuma longa; 1 outbreak), a spice blend (1 outbreak) and a seasoning blend containing contaminated broccoli powder (1 outbreak); some outbreaks were associated with multiple spices or food vehicles (Table 2.1). Seventy-one percent (10/14) of the outbreaks were associated with spices classified as fruits or seeds of the source plant. The countries/regions of origin of the implicated spices were identified in nine outbreaks and included Brazil (1 outbreak), China (2), India (3), Malaysia (1), South America (1), Turkey (1), and Vietnam (2) (Table 2.1). In every case where it could be determined (9/14 outbreaks), the spices implicated in the outbreaks were imported. This observation is not unexpected because many of the countries in which outbreaks were identified are not major spice producing countries (FAO, 2013b). In at least two of the outbreaks, post-import cross-contamination is suspected to have contributed to the outbreak (Salmonella Rissen in white pepper [Piper nigrum] and Salmonella Montevideo in black pepper [Piper nigrum] and red pepper (Capsicum spp.); see discussion in Section 2.2).
2.2 OUTBREAKS IN THE UNITED STATES
Three foodborne illness outbreaks attributed to consumption of pathogen-contaminated spices were reported in the United States during the study period. All three outbreaks took place within a 40 month period (Jan 2007-April 2010) and accounted for 457 laboratory-confirmed illnesses, 68 hospitalizations, and one death (Table 2.1). Age data were available for 404 of the 457 confirmed cases. The age breakdown for these three outbreaks was: <1 year, 5%; 1 to 4 years, 17%; 5 to 9 years, 14%; 20 to 49 years, 32%; and >50 years, 32%. The distribution of ages affected in these three U.S. outbreaks demonstrates that nearly all ages in the population have been affected by these outbreaks.
In the earliest spice-associated outbreak identified in the United States, 69 cases of Salmonella Wandsworth illness were confirmed from 23 states between January 2007 and December 2007; 96% of ill persons were children < 6 years old (Sotir et al., 2009). Public health investigations performed by state and federal regulatory authorities implicated a seasoning mix consisting of broccoli powder, parsley powder, and other spices used to coat a snack puff after the final food manufacturing pathogen reduction step (Sotir et al., 2009). The only ingredient in the seasoning mix to test positive for Salmonella Wandsworth was the broccoli powder, collected at two U.S. snack food manufacturing facilities and imported from China. It is not known whether the broccoli powder had undergone a pathogen reduction treatment before its application to the snack food (Sotir et al., 2009). None of the environmental samples collected in the two snack food manufacturing facilities tested positive for Salmonella (Sotir et al., 2009). Product testing also identified Salmonella Typhimurium from the seasoning mix and Salmonella Mbandaka from parsley powder (Sotir et al., 2009). A cluster of 11 human cases of Salmonella Typhimurium illness epidemiologically linked to the snack puffs was subsequently identified; no confirmed human cases of Salmonella Mbandaka illness were reported (Sotir et al., 2009).

Foodborne Illness Outbreaks from Microbial Contaminants in Spices, 1973-2010 | 2
FDA Draft Risk Profile | 17
In the second spice- associated outbreak in the United States, 87 cases of Salmonella Rissen illness that occurred between December 2008 and April 2009 were reported from 5 states (CDPH/FDB/ERU, 2010; Higa, 2011). Human cases of illness resulted from food consumption at restaurants and hospitals and included individuals from age 5 months to 94 years (Higa, 2011). Epidemiologic investigations, traceback investigations, and product testing implicated white pepper (Piper nigrum) ground and packed by a single company in California (CDPH/FDB/ERU, 2010; Higa, 2011; Hajmeer and Myers, 2011).
Samples of whole and ground white pepper were collected from the California spice processing and packing facility and analyzed during the investigation. One unopened bag of imported whole white peppercorns was found to contain the Salmonella Rissen outbreak strain, suggesting contamination of the spice took place before import (CDPH/FDB/ERU, 2010). The whole white peppercorns implicated in this outbreak originated from Vietnam and had been sold as “steam washed” (CDPH/FDB/ERU, 2010; Myers and Higa, 2011; Hajmeer and Myers, 2011). While steam treatments are often applied to spices to reduce/eliminate microbial pathogens (ASTA, 2011), “steam washing” is primarily used to clean dirt from spices and may not provide an effective pathogen reduction step (Myers and Higa, 2011; Hajmeer and Myers, 2011). No other pathogen reduction treatment had been applied to the spice (Myers and Higa, 2011) but the suspected imported whole white pepper lot was accompanied by a Certificate of Analysis (COA) that indicted that the lot had tested negative for Salmonella before import (CDPH/FDB/ERU, 2010). The sensitivity of the screening test used for the COA is not known so it is possible that the lot could have contained a low concentration of Salmonella or a highly clustered distribution of Salmonella undetected by the screening test (ICMSF, 2002; Bassett et al., 2010).
Environmental sampling data collected in the implicated spice processing and packing facility in California found widespread contamination of the spice processing facility, with ~40% (46/116) of swab samples taken throughout the facility testing positive for Salmonella (CDPH/FDB/ERU, 2010). All of the Salmonella isolates for which a strain was determined (19/46) matched the Salmonella Rissen outbreak strain (CDPH/FDB/ERU, 2010). Contamination of the grinding room was particularly extensive, with 94% (34/36) of swabs collected in the grinding room testing positive for Salmonella Rissen and 100% (14/14) of the isolates examined for strain, matching the outbreak strain (Hajmeer and Myers, 2011; FDA, 2009). Inspections (CDPH/FDB/ERU, 2010; FDA, 2009; Hajmeer and Myers, 2011) of the facility revealed multiple violations of the Current Good Manufacturing Practices (CGMP) regulation for foods at 21 CFR 110 (FDA, 2012i; U.S.C., 2007). FDA issued a Warning Letter to the firm that stated in part, “The finding of Salmonella in multiple processing locations within your facility indicates that this pathogenic organism may have become established in a niche environment in your facility” (FDA, 2009). With such gross contamination of the spice processing/packing facility, it is possible that cross-contamination from the facility environment to the spice also played a role in this outbreak.
During the third spice- associated outbreak in the United States, epidemiological investigations identified 272 laboratory-confirmed cases of Salmonella Montevideo illness from 44 states and the District of Columbia during the period July 2009 to April 2010 (CDC, 2010; Gieraltowski et al., 2012); ill persons ranged in age from <1 to 93 years (CDC, 2010; Gieraltowski et al., 2012). A next generation sequencing (NGS) analysis of human isolates collected during the time of the outbreak suggested that the total number of cases of illness associated with this outbreak may have been significantly smaller (den Bakker et al., 2011). However, the NGS analysis only included 20 putative outbreak isolates and relied on comparison with NGS data from known outbreak isolates analyzed on a different experimental platform (Lienau et al., 2011) which may have impacted the study conclusions.
Epidemiologic and traceback investigations of the Salmonella Montevideo outbreak implicated consumption of ready-to-eat salami products (including pepper-coated salami) manufactured by a single company in Rhode Island (Gieraltowski et al., 2012). Traceback and product testing determined that black pepper (Piper nigrum) from Vietnam and red pepper (Capsicum spp.) from India and China used in the salami products were contaminated with Salmonella Montevideo (CDC, 2010; Gieraltowski et al., 2012; DuVernoy, 2012). A

Foodborne Illness Outbreaks from Microbial Contaminants in Spices, 1973-2010 | 2
FDA Draft Risk Profile | 18
private laboratory also isolated Salmonella Senftenberg from an unopened retail sample of the implicated product (Gieraltowski et al., 2012). PulseNet subsequently identified 11 human cases of Salmonella Senftenberg with the same pulsed-field gel electrophoresis pattern (PFGE), and two of the patients reported purchasing the implicated product (Gieraltowski et al., 2012).
Evidence collected during the outbreak investigation revealed that some of the black pepper used in the manufacture of the salami products was reported to have been treated with steam (Gieraltowski et al., 2012). Descriptions of the treatments included “steam washed” and “steam sterilized” (DuVernoy, 2012). Some of the red pepper lots implicated in the investigation were reported to have been treated with ethylene oxide, some before and some after import into the United States (DuVernoy, 2012). It is not known if the steam or ethylene oxide treatments had been validated as an effective reduction step for Salmonella. Some of the treated imported black pepper shipments were accompanied by Certificates of Analysis (COAs) reporting negative tests for Salmonella (DuVernoy, 2012). However, review of the COAs revealed that at least some of the tests were conducted on a smaller sample size than FDA typically uses to examine spices at import (i.e., examining one 25 g sample as compared with 30 x 25 g [two-375 g composite samples]) (Andrews and Hammack, 2003). Therefore, it is possible that some of the treated imported black pepper contained low concentrations of Salmonella or highly localized contamination (ICMSF, 2002; Bassett et al., 2010) unreached by steam. As in the Salmonella Wandsworth outbreak associated with snack puffs, investigation of the food manufacturing process revealed that spices were applied to the salami products after the final (meat production/fermentation and drying) pathogen reduction step (CDC, 2010; Gieraltowski et al., 2012). Growth of Salmonella in the salami products is not suspected as contributing to this outbreak because salami is a low-moisture, shelf-stable food.
While it was not possible to definitively determine where in the supply chain the spices were contaminated, the weight of evidence suggests that contamination of the black and red pepper with Salmonella Montevideo took place after the spice shipments were imported into the United States, that is, from cross-contamination. Experimental evidence supporting this hypothesis includes the NGS study that demonstrated that clinical, product, and environmental isolates associated with the outbreak were most closely related with one Salmonella Montevideo isolate collected from the east coast of the United States and were distinct from Montevideo strains from other parts of the world (Lienau et al., 2011; Allard et al., 2012). Other evidence supporting post-import contamination includes the facts that the spice associated with the outbreak was imported from three different countries that are geographically distinct (CDC, 2010; Gieraltowski et al., 2012) and that “a common source in the distribution path from production to the Company A facility [salami manufacturing facilities] was not identified between the black and red pepper” (Gieraltowski et al., 2012). While “unopened” boxes of spice in the salami manufacturer were found to contain the outbreak strain (Gieraltowski et al., 2012), the spice in these boxes came from U.S. suppliers who had stored, repacked, and in some cases, processed (e.g., ground/cracked) the spice before shipment to the salami manufacturing facility (DuVernoy, 2012).
2.3 SELECTED NON-U.S. OUTBREAKS
The largest spice-associated outbreak was identified in Germany in 1993 (Lehmacher et al., 1995; Table 2.1) in which an estimated 1000 cases of Salmonella illness occurred between April and September 1993. The majority of illnesses were in children ≤14 years old, including 14 infants <1 year old. A large number of Salmonella serotypes were associated with this outbreak; Salmonella Saintpaul, Javiana, and Rubislaw accounted for 42% of the human illnesses and many other Salmonella serotypes were isolated from patients or implicated foods (Lehmacher et al. 1995).
Traceback investigations and product testing identified paprika (Capsicum annum), used in seasoning for potato chips, as the contaminated food vehicle (Lehmacher et al., 1995). Some, if not all, of the paprika was imported from South America. It was not known where or when the paprika was contaminated or whether a pathogen reduction treatment had been applied to the paprika. Enumeration experiments revealed that the

Foodborne Illness Outbreaks from Microbial Contaminants in Spices, 1973-2010 | 2
FDA Draft Risk Profile | 19
concentrations of Salmonella in samples of spice and food implicated in the outbreak were small − 2.5 MPN/g (25 MPN per 10 g; paprika), 0.04-11 MPN/g (4 MPN per 100 g to 11 MPN per g; paprika-containing spice mixes) and 0.05-0.45 MPN/g (5 MPN per 100 g to 45 MPN per 100 g paprika-powdered potato chips) − and that Salmonella can survive in the dry environments of paprika and paprika-powdered potato chips for at least 8 and 12 months, respectively (Lehmacher et al., 1995). As noted for other outbreaks, the spice mix was applied after the final food manufacturing (potato chip) pathogen reduction step (Lehmacher et al., 1995).
Four outbreaks of Bacillus spp. illness attributed to consumption of foods containing contaminated spice took place in Denmark (EFSA, 2011a; EFSA, 2013), France (EFSA, 2009a; EFSA, 2013), New Zealand (Cameron, 1998), and the United Kingdom (Little et al., 2003; Little, 2012; Health Protection Agency, 2011), accounting for 262 illnesses. Three of these outbreaks took place in settings where food services provide meals for large numbers of people (a canteen/workplace, a restaurant, and a school/kindergarten). Growth of the pathogen in the food was suspected as contributing to at least one of the outbreaks (EFSA, 2011a). Two outbreaks were attributed to consumption of tea infusions prepared from Salmonella-contaminated spices and served primarily to infants who were ≤13 months of age (Koch et al., 2005; Rabsch et al., 2005; Ilic et al., 2010). Taken together, 52 (93%) of 56 of the individuals who became ill in these two outbreaks were infants (Koch et al., 2005; Ilic et al., 2010). In both investigations, contamination of the multicomponent tea was traced to a single contaminated spice ingredient: aniseed (Pimpinella anisum) in the Salmonella Agona outbreak in Germany (Koch et al., 2005; Rabsch et al., 2005) and fennel seed (Foeniculum vulgare) in the Salmonella Senftenberg outbreak in Serbia (Ilic et al., 2010). Epidemiological investigations revealed that in some cases, boiling water was not used (Koch et al., 2005) or was probably not used (Ilic et al., 2010) to prepare the tea infusions. Subsequent growth of surviving Salmonella cells in the cooled tea infusion may have also contributed to the number of cases of illness observed (Koch et al., 2005). The outbreak investigations did not reveal where in the supply chain tea contamination took place but both identified weaknesses in supplier control, i.e., the use of unregistered producers (fennel seed; Ilic et al., 2010) and the reported use of manure as fertilizer in seed production (anise seed, reported by the spice importer; Koch et al., 2005).
2.4 PUBLIC HEALTH BURDEN
Although an estimated 1946 human illnesses were identified in the fourteen outbreaks reported above, the actual health burden is likely much larger due to underreporting and challenges in foodborne disease surveillance and outbreak response. In the United States, the CDC estimates that 1.0 million people in the United States become ill from Salmonella-contaminated food consumed each year (Scallan et al., 2011; CDC, 2011). This estimated value includes a correction for underreporting derived from data obtained from several surveillance/reporting systems (Scallan et al., 2011). Applying the CDC underreporting multiplier for Salmonella (29.3; Scallan et al., 2011), the public health burden of the three spice-associated outbreaks in the United States is roughly estimated at ~13,400 human illnesses.
Many countries do not have the ability to track foodborne illness and for those countries that do track foodborne illness, the reporting structure/information may be insufficient to attribute outbreaks to spices. For example, until recently, European Union member country reports of outbreaks attributed to spices were reported together with outbreaks attributed to fresh herbs (see for example EFSA, 2009a) and the additional information reported did not always allow distinction between fresh and dry. In the United States, reporting to PulseNet is limited to selected pathogens, which makes detection of geographically dispersed outbreaks of other pathogens, such as Bacillus spp., more difficult. Even when a spice is suspected as being the contamination source, it cannot or is not always confirmed. For example, our research identified seven additional outbreaks attributed to consumption of contaminated spice (4 Salmonella illness outbreaks, 2 Bacillus cereus illness outbreaks, 1 Clostridium perfringens outbreak) (Millet and Staff, 1999; Little et al., 2003; Little, 2012; Health Protection Agency, 2011; EFSA, 2013), but which did not meet our inclusion criteria

Foodborne Illness Outbreaks from Microbial Contaminants in Spices, 1973-2010 | 2
FDA Draft Risk Profile | 20
(lacking microbiological or epidemiological evidence specified in Section 2: Materials and Methods). As a result, the number of world-wide outbreaks associated with consumption of pathogen-contaminated spice is likely underreported.
Ingredient-related outbreaks are especially challenging to investigate because of the many possible foods that could be involved and the potentially complex supply chains associated with each ingredient. In addition, consumers of contaminated food may not be aware of all ingredients in the food, especially minor ingredients such spices. As a result, it is possible that more spice-associated outbreaks occurred within the United States or in other countries that reported one or more spice- associated outbreaks. According to the CDC, only 43% of reported foodborne disease outbreaks in the United States in 2009-10 had a food reported (CDC, 2013a). The long shelf-life of spices and the ability of pathogens to persist in spice for long periods (demonstrated for Salmonella) also create challenges for outbreak identification because illnesses from consumption of contaminated spice may be separated by time and space.
2.5 RELATED OUTBREAKS – SPICE INGREDIENTS USED IN NON-SPICE CAPACITIES
At least five outbreaks associated with spice ingredients that are used in non-spice capacities took place during the study period. Three Salmonella outbreaks associated with tahini (Unicomb et al., 2005) and one Salmonella outbreak linked to helva (Andersson et al., 2001; Fisher et al., 2001; Little, 2001; Brockmann, 2001; Guérin et al., 2001) were identified during the literature review. Both of these products are made predominantly of sesame seeds (Sesamum spp.). Together these outbreaks were responsible for at least 128 illnesses in six countries (Unicomb et al., 2005; Andersson et al., 2001; Fisher et al., 2001; Little, 2001; Brockmann 2001; Guérin et al., 2001). Some spice seeds, such as fennel (Foeniculum vulgare) and mustard (Brassica spp.), are also used to produce sprouts for human consumption. Numerous sprout-associated outbreaks have occurred, and many of these outbreaks have been traced to bacterial contamination of the seed (EFSA, 2011b) amplified during the sprout production process. One B. cereus illness outbreak associated with sprout consumption took place in the United States in 1973 and was traced to contamination of the seed mixture, which included soy, cress and mustard (Portnoy et al., 1976). The large-scale 2011 outbreak of Shiga-toxin producing Escherichia coli serotype O104:H4 in Germany and France, while not in the temporal scope of this review, was also attributed to sprout consumption and traced to contaminated fenugreek seeds (Trigonella foenum-graecum), although the bacterium was never isolated from the seeds (EFSA, 2011c). These outbreaks highlight the fact that some spices have multiple applications in food production and can carry a risk of foodborne illness in these other applications. Application of mitigation and control strategies to the production, storage and handling of spices could also reduce the risk of illness from these foods.
2.6 GENERAL OBSERVATIONS REGARDING FOODBORNE ILLNESS OUTBREAKS ATTRIBUTED TO MICROBIAL CONTAMINANTS IN SPICES
Our review identified fourteen foodborne illness outbreaks attributed to consumption of pathogen-contaminated spices between 1973 and 2010. These outbreaks demonstrate that consumption of pathogen-contaminated spices can result in human illnesses and that the illnesses that arise can be severe enough to necessitate hospitalization and, occasionally, result in death. The review also demonstrates that outbreaks attributed to consumption of contaminated spice can involve large numbers of illnesses. Individuals of all ages can be affected, including infants and young children, who comprised the majority of cases of illness in five outbreaks and were the apparent target consumer of some of the contaminated foods consumed (Lehmacher et al., 1995; Koch et al., 2005; Ilic et al., 2010; Sotir et al., 2009; EFSA, 2009a). Within our review, Salmonella enterica subspecies enterica and Bacillus spp. were the most common bacterial pathogens linked to spice-associated outbreaks. A single spice vehicle can be contaminated with multiple Salmonella serotypes or Bacillus species, resulting in multi-serotype/species outbreaks. As evidenced by the 1993 paprika

Foodborne Illness Outbreaks from Microbial Contaminants in Spices, 1973-2010 | 2
FDA Draft Risk Profile | 21
(Capsicum annum)-associated outbreak (Lehmacher et al., 1995) and documented by other studies (Keller et al., 2013; Podolak et al., 2010 and references therein) Salmonella can survive in dried spices and other low moisture foods for prolonged periods. Enumeration data collected during three outbreak investigations found low concentrations of contamination, indicating that low concentrations of contamination in spices can cause human illness (Gustavsen and Breen, 1984; Lehmacher et al., 1995; Koch et al., 2005). The Salmonella Wandsworth outbreak (Sotir et al., 2009) illustrated that dried vegetable powders used in seasoning blends may carry the risk of illness if contaminated.
Consumption of ready-to-eat foods prepared with spices applied after the final food manufacturing pathogen reduction step accounted for at least 70% of the illnesses (CDC, 2010; Sotir et al., 2009; Lehmacher et al., 1995). In three out of four outbreaks for which spice process treatment information was recorded, it was found that no pathogen reduction treatment had been applied to the spice (Rabsch et al., 2005; Sotir et al., 2009; Myers and Higa, 2011). Pathogen growth in spiced food was suspected to have played a role in some outbreaks but it was probably not a contributing factor in three of the larger Salmonella illness outbreaks, which involved low-moisture foods (CDC, 2010; Sotir et al., 2009; Lehmacher et al., 1995) that do not support microbial growth when maintained at a low water activity.
The root cause of spice contamination was not determined in most of the outbreaks. In four outbreaks, the outbreak strain was isolated from unopened packages of the spice ingredient in the food manufacturing facility, which supports the hypothesis that contamination of the spice took place at an early stage in the farm-to-table continuum (e.g., during production, early processing, or packing/storage before import) (Laidley et al., 1974; Gustavsen and Breen, 1984; CDC, 2010). In two outbreaks, evidence supported possible contributions from cross-contamination in later stages of the farm-to-table continuum (e.g., post-import spice processing or food manufacturing environments) (Hajmeer and Myers, 2011; Lienau et al., 2011; Allard et al., 2012). Most investigations did not report whether the spice had been subjected to a pathogen reduction treatment before receipt by the spice/food manufacturer/retail user and did not enumerate the pathogen in the spice ingredient and food. Gathering this information in future outbreak investigations, could help investigators determine which of the possible routes of contamination were involved.
FDA Draft Risk Profile | 22
3. TYPES OF PATHOGEN AND FILTH CONTAMINATION FOUND IN SPICES
3.1 MICROBIAL PATHOGENS FOUND IN SPICES
3.1.1 TYPES OF MICROBIAL PATHOGENS FOUND IN SPICES
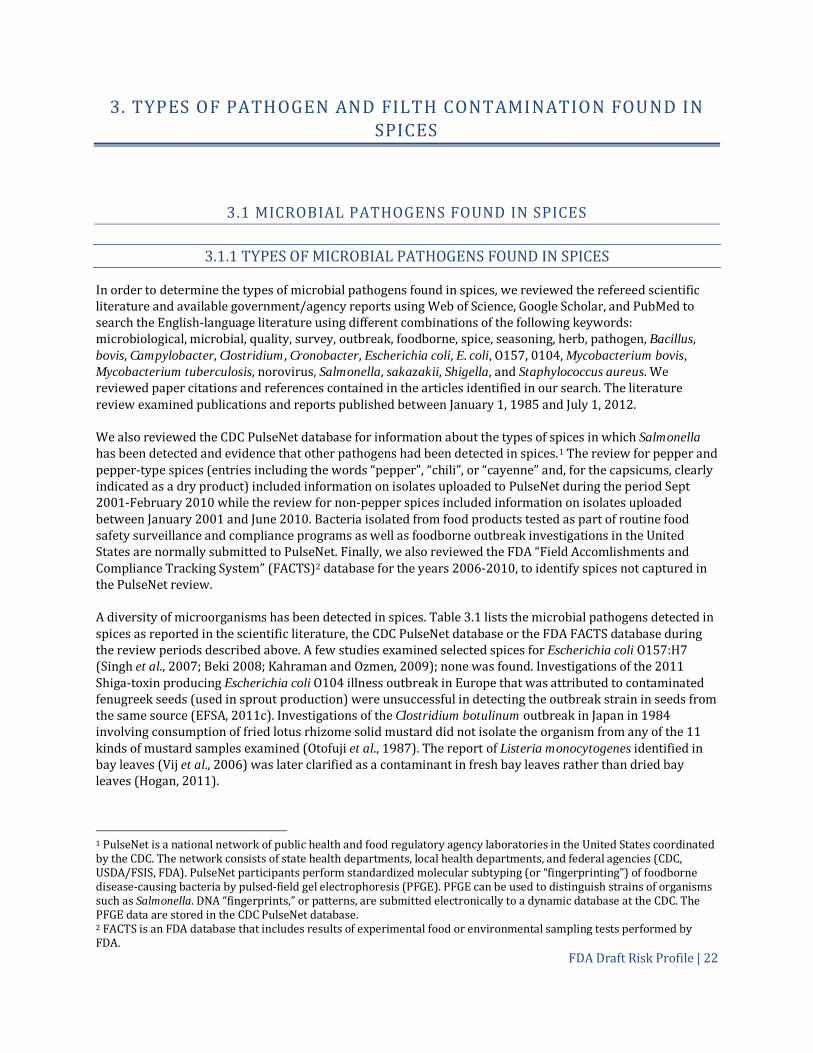
In order to determine the types of microbial pathogens found in spices, we reviewed the refereed scientific literature and available government/agency reports using Web of Science, Google Scholar, and PubMed to search the English-language literature using different combinations of the following keywords: microbiological, microbial, quality, survey, outbreak, foodborne, spice, seasoning, herb, pathogen, Bacillus, bovis, Campylobacter, Clostridium, Cronobacter, Escherichia coli, E. coli, O157, 0104, Mycobacterium bovis, Mycobacterium tuberculosis, norovirus, Salmonella, sakazakii, Shigella, and Staphylococcus aureus. We reviewed paper citations and references contained in the articles identified in our search. The literature review examined publications and reports published between January 1, 1985 and July 1, 2012. We also reviewed the CDC PulseNet database for information about the types of spices in which Salmonella has been detected and evidence that other pathogens had been detected in spices.1 The review for pepper and pepper-type spices (entries including the words “pepper”, “chili”, or “cayenne” and, for the capsicums, clearly indicated as a dry product) included information on isolates uploaded to PulseNet during the period Sept 2001-February 2010 while the review for non-pepper spices included information on isolates uploaded between January 2001 and June 2010. Bacteria isolated from food products tested as part of routine food safety surveillance and compliance programs as well as foodborne outbreak investigations in the United States are normally submitted to PulseNet. Finally, we also reviewed the FDA “Field Accomlishments and Compliance Tracking System” (FACTS)2 database for the years 2006-2010, to identify spices not captured in the PulseNet review. A diversity of microorganisms has been detected in spices. Table 3.1 lists the microbial pathogens detected in spices as reported in the scientific literature, the CDC PulseNet database or the FDA FACTS database during the review periods described above. A few studies examined selected spices for Escherichia coli O157:H7 (Singh et al., 2007; Beki 2008; Kahraman and Ozmen, 2009); none was found. Investigations of the 2011 Shiga-toxin producing Escherichia coli O104 illness outbreak in Europe that was attributed to contaminated fenugreek seeds (used in sprout production) were unsuccessful in detecting the outbreak strain in seeds from the same source (EFSA, 2011c). Investigations of the Clostridium botulinum outbreak in Japan in 1984 involving consumption of fried lotus rhizome solid mustard did not isolate the organism from any of the 11 kinds of mustard samples examined (Otofuji et al., 1987). The report of Listeria monocytogenes identified in bay leaves (Vij et al., 2006) was later clarified as a contaminant in fresh bay leaves rather than dried bay leaves (Hogan, 2011).
1 PulseNet is a national network of public health and food regulatory agency laboratories in the United States coordinated by the CDC. The network consists of state health departments, local health departments, and federal agencies (CDC, USDA/FSIS, FDA). PulseNet participants perform standardized molecular subtyping (or “fingerprinting”) of foodborne disease-causing bacteria by pulsed-field gel electrophoresis (PFGE). PFGE can be used to distinguish strains of organisms such as Salmonella. DNA “fingerprints,” or patterns, are submitted electronically to a dynamic database at the CDC. The PFGE data are stored in the CDC PulseNet database. 2 FACTS is an FDA database that includes results of experimental food or environmental sampling tests performed by FDA.
Types of Pathogen and Filth Contamination Found in Spices | 3
FDA Draft Risk Profile | 23
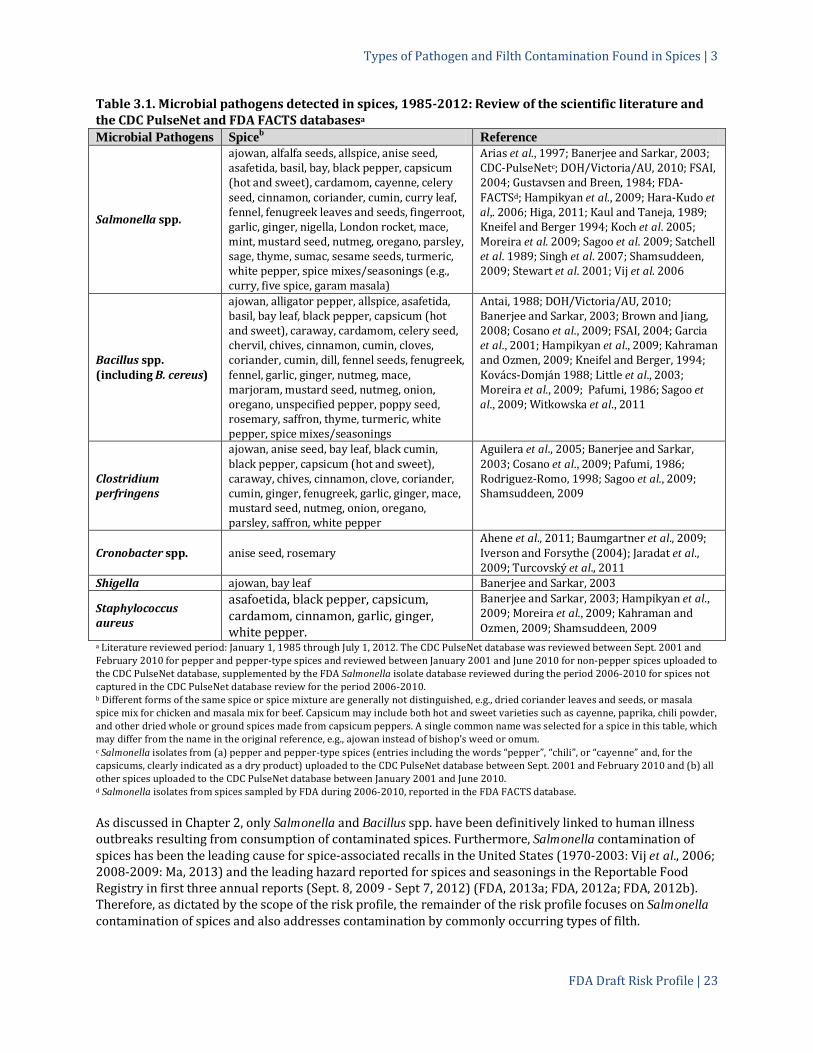
Table 3.1. Microbial pathogens detected in spices, 1985-2012: Review of the scientific literature and the CDC PulseNet and FDA FACTS databasesa Microbial Pathogens Spiceb Reference
Salmonella spp.
ajowan, alfalfa seeds, allspice, anise seed, asafetida, basil, bay, black pepper, capsicum (hot and sweet), cardamom, cayenne, celery seed, cinnamon, coriander, cumin, curry leaf, fennel, fenugreek leaves and seeds, fingerroot, garlic, ginger, nigella, London rocket, mace, mint, mustard seed, nutmeg, oregano, parsley, sage, thyme, sumac, sesame seeds, turmeric, white pepper, spice mixes/seasonings (e.g., curry, five spice, garam masala)
Arias et al., 1997; Banerjee and Sarkar, 2003; CDC-PulseNetc; DOH/Victoria/AU, 2010; FSAI, 2004; Gustavsen and Breen, 1984; FDA-FACTSd; Hampikyan et al., 2009; Hara-Kudo et al,. 2006; Higa, 2011; Kaul and Taneja, 1989; Kneifel and Berger 1994; Koch et al. 2005; Moreira et al. 2009; Sagoo et al. 2009; Satchell et al. 1989; Singh et al. 2007; Shamsuddeen, 2009; Stewart et al. 2001; Vij et al. 2006
Bacillus spp. (including B. cereus)
ajowan, alligator pepper, allspice, asafetida, basil, bay leaf, black pepper, capsicum (hot and sweet), caraway, cardamom, celery seed, chervil, chives, cinnamon, cumin, cloves, coriander, cumin, dill, fennel seeds, fenugreek, fennel, garlic, ginger, nutmeg, mace, marjoram, mustard seed, nutmeg, onion, oregano, unspecified pepper, poppy seed, rosemary, saffron, thyme, turmeric, white pepper, spice mixes/seasonings
Antai, 1988; DOH/Victoria/AU, 2010; Banerjee and Sarkar, 2003; Brown and Jiang, 2008; Cosano et al., 2009; FSAI, 2004; Garcia et al., 2001; Hampikyan et al., 2009; Kahraman and Ozmen, 2009; Kneifel and Berger, 1994; Kovács-Domján 1988; Little et al., 2003; Moreira et al., 2009; Pafumi, 1986; Sagoo et al., 2009; Witkowska et al., 2011
Clostridium perfringens
ajowan, anise seed, bay leaf, black cumin, black pepper, capsicum (hot and sweet), caraway, chives, cinnamon, clove, coriander, cumin, ginger, fenugreek, garlic, ginger, mace, mustard seed, nutmeg, onion, oregano, parsley, saffron, white pepper
Aguilera et al., 2005; Banerjee and Sarkar, 2003; Cosano et al., 2009; Pafumi, 1986; Rodriguez-Romo, 1998; Sagoo et al., 2009; Shamsuddeen, 2009
Cronobacter spp. anise seed, rosemary Ahene et al., 2011; Baumgartner et al., 2009; Iverson and Forsythe (2004); Jaradat et al., 2009; Turcovský et al., 2011
Shigella ajowan, bay leaf Banerjee and Sarkar, 2003
Staphylococcus aureus
asafoetida, black pepper, capsicum, cardamom, cinnamon, garlic, ginger, white pepper.
Banerjee and Sarkar, 2003; Hampikyan et al., 2009; Moreira et al., 2009; Kahraman and Ozmen, 2009; Shamsuddeen, 2009
a Literature reviewed period: January 1, 1985 through July 1, 2012. The CDC PulseNet database was reviewed between Sept. 2001 and February 2010 for pepper and pepper-type spices and reviewed between January 2001 and June 2010 for non-pepper spices uploaded to the CDC PulseNet database, supplemented by the FDA Salmonella isolate database reviewed during the period 2006-2010 for spices not captured in the CDC PulseNet database review for the period 2006-2010. b Different forms of the same spice or spice mixture are generally not distinguished, e.g., dried coriander leaves and seeds, or masala spice mix for chicken and masala mix for beef. Capsicum may include both hot and sweet varieties such as cayenne, paprika, chili powder, and other dried whole or ground spices made from capsicum peppers. A single common name was selected for a spice in this table, which may differ from the name in the original reference, e.g., ajowan instead of bishop’s weed or omum. c Salmonella isolates from (a) pepper and pepper-type spices (entries including the words “pepper”, “chili”, or “cayenne” and, for the capsicums, clearly indicated as a dry product) uploaded to the CDC PulseNet database between Sept. 2001 and February 2010 and (b) all other spices uploaded to the CDC PulseNet database between January 2001 and June 2010. d Salmonella isolates from spices sampled by FDA during 2006-2010, reported in the FDA FACTS database. As discussed in Chapter 2, only Salmonella and Bacillus spp. have been definitively linked to human illness outbreaks resulting from consumption of contaminated spices. Furthermore, Salmonella contamination of spices has been the leading cause for spice-associated recalls in the United States (1970-2003: Vij et al., 2006; 2008-2009: Ma, 2013) and the leading hazard reported for spices and seasonings in the Reportable Food Registry in first three annual reports (Sept. 8, 2009 - Sept 7, 2012) (FDA, 2013a; FDA, 2012a; FDA, 2012b). Therefore, as dictated by the scope of the risk profile, the remainder of the risk profile focuses on Salmonella contamination of spices and also addresses contamination by commonly occurring types of filth.
Types of Pathogen and Filth Contamination Found in Spices | 3
FDA Draft Risk Profile | 24
3.1.2 SALMONELLA SEROTYPES IDENTIFIED IN SPICES
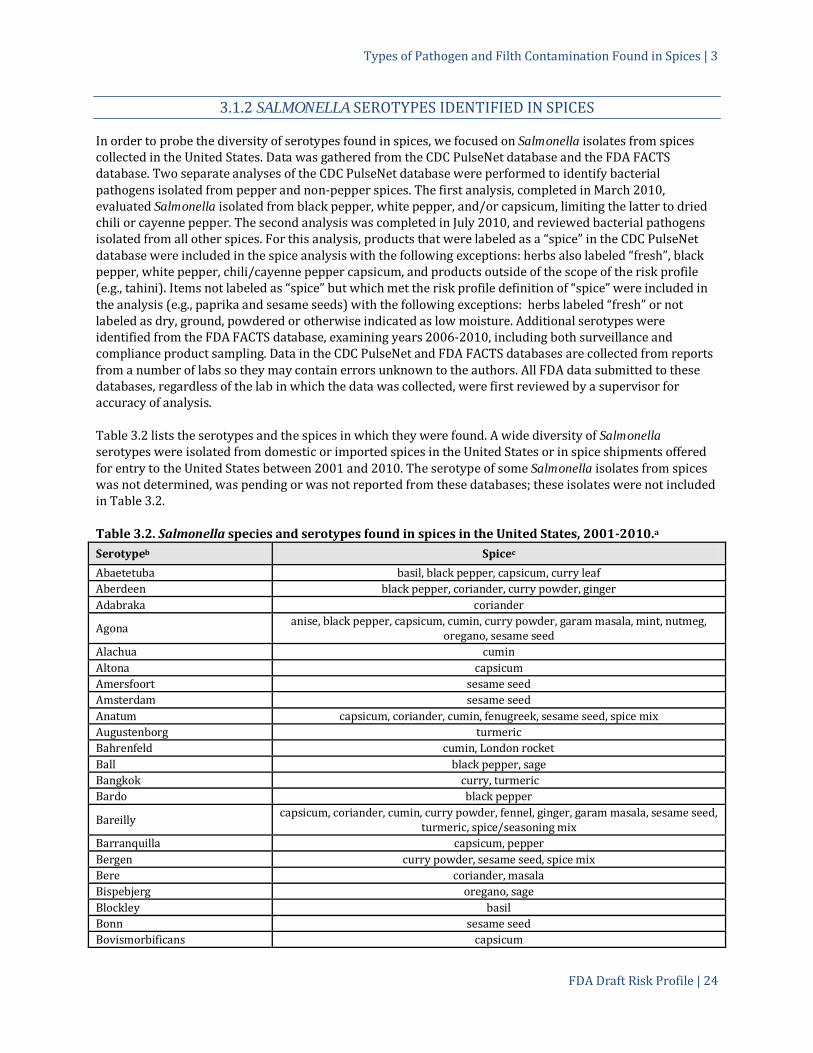
In order to probe the diversity of serotypes found in spices, we focused on Salmonella isolates from spices collected in the United States. Data was gathered from the CDC PulseNet database and the FDA FACTS database. Two separate analyses of the CDC PulseNet database were performed to identify bacterial pathogens isolated from pepper and non-pepper spices. The first analysis, completed in March 2010, evaluated Salmonella isolated from black pepper, white pepper, and/or capsicum, limiting the latter to dried chili or cayenne pepper. The second analysis was completed in July 2010, and reviewed bacterial pathogens isolated from all other spices. For this analysis, products that were labeled as a “spice” in the CDC PulseNet database were included in the spice analysis with the following exceptions: herbs also labeled “fresh”, black pepper, white pepper, chili/cayenne pepper capsicum, and products outside of the scope of the risk profile (e.g., tahini). Items not labeled as “spice” but which met the risk profile definition of “spice” were included in the analysis (e.g., paprika and sesame seeds) with the following exceptions: herbs labeled “fresh” or not labeled as dry, ground, powdered or otherwise indicated as low moisture. Additional serotypes were identified from the FDA FACTS database, examining years 2006-2010, including both surveillance and compliance product sampling. Data in the CDC PulseNet and FDA FACTS databases are collected from reports from a number of labs so they may contain errors unknown to the authors. All FDA data submitted to these databases, regardless of the lab in which the data was collected, were first reviewed by a supervisor for accuracy of analysis. Table 3.2 lists the serotypes and the spices in which they were found. A wide diversity of Salmonella serotypes were isolated from domestic or imported spices in the United States or in spice shipments offered for entry to the United States between 2001 and 2010. The serotype of some Salmonella isolates from spices was not determined, was pending or was not reported from these databases; these isolates were not included in Table 3.2. Table 3.2. Salmonella species and serotypes found in spices in the United States, 2001-2010.a Serotypeb Spicec
Abaetetuba basil, black pepper, capsicum, curry leaf Aberdeen black pepper, coriander, curry powder, ginger Adabraka coriander
Agona anise, black pepper, capsicum, cumin, curry powder, garam masala, mint, nutmeg, oregano, sesame seed
Alachua cumin Altona capsicum Amersfoort sesame seed Amsterdam sesame seed Anatum capsicum, coriander, cumin, fenugreek, sesame seed, spice mix Augustenborg turmeric Bahrenfeld cumin, London rocket Ball black pepper, sage Bangkok curry, turmeric Bardo black pepper
Bareilly capsicum, coriander, cumin, curry powder, fennel, ginger, garam masala, sesame seed, turmeric, spice/seasoning mix
Barranquilla capsicum, pepper Bergen curry powder, sesame seed, spice mix Bere coriander, masala Bispebjerg oregano, sage Blockley basil Bonn sesame seed Bovismorbificans capsicum

Types of Pathogen and Filth Contamination Found in Spices | 3
FDA Draft Risk Profile | 25
Serotypeb Spicec
Braenderup black pepper, turmeric Brandenburg black pepper, thyme Brazzaville capsicum Bredeney capsicum Brindisi sage Brooklyn sage Canada black pepper Caracas basil, cumin Carmel coriander Carrau oregano, sesame seed, paprika Cerro capsicum, sesame seed, turmeric Champaign capsicum, chili powder, fenugreek Chandans masala mix, oregano Chingola spice and seasonings Claibornei coriander Colindale cumin Corvallis cumin Cubana celery, coriander, cumin, sesame seed, garam masala Derby black pepper, capsicum, five spice, sage Djibouti coriander Dublin curry Eastbourne turmeric Elokate black pepper Enteritidis black pepper, capsicum, fenugreek, oregano, spice/seasoning mix Everleigh sesame seed Freetown capsicum, cumin, spice/seasoning mix Fresno sesame seed Gamaba cumin Gaminara anise seed, capsicum, coriander, sesame seed Give capsicum, oregano, sesame seed, turmeric Glostrup Sage, sesame seed Gozo capsicum Grumpensis capsicum Haifa basil Havana anise seed, capsicum, coriander, masala, sesame seed Heidelberg black pepper, sesame seed Hermannswerder sage Hindmarsh capsicum
Hvittingfoss basil, black pepper, capsicum, coriander, fenugreek leaf, turmeric, sesame seed, white pepper
Idikan sesame seed, white pepper Infantis capsicum, spice/seasoning mix Inpraw turmeric powder Istanbul capsicum Javiana allspice, black pepper, cumin, sage, white pepper Johannesburg ginger Kentucky capsicum, cumin, mint, fennel, sesame seed, thyme Kingabwa capsicum Kottbus black pepper, white pepper Kumasi black pepper Lexington ginger Liverpool oregano

Types of Pathogen and Filth Contamination Found in Spices | 3
FDA Draft Risk Profile | 26
Serotypeb Spicec
Livingstone cumin Llandoff sesame seed London coriander, fenugreek Luke garam masala Madelia oregano, white pepper Magwa cumin Martonos capsicum
Mbandaka black pepper, capsicum, cumin, curry powder, garlic, fennel seed, parsley, sesame seed, turmeric, spice/seasoning mix
Mgulani black pepper, capsicum, coriander, turmeric, spice/seasoning mix Miami sage Mikawasima laurel leaf Milwaukee capsicum Minnesota basil, sesame seed Molade capsicum
Montevideo arnica, black pepper, capsicum, coriander, cumin, mint, oregano, nutmeg, sesame seed, thyme, spice/seasoning mix
Muenchen capsicum, cumin, thyme Muenster spice/seasoning mix Nchanga cumin
Newport allspice, black pepper, capsicum, cardamom, coriander, cumin, curry powder, nutmeg, oregano, sesame seed, turmeric, spice/seasoning mix
Nordrhein capsicum Nottingham capsicum, oregano Onarimon cumin Onderstepoort cumin, rosemary Oranienburg capsicum, coriander, oregano, sage Orion anise seed, curry powder Oslo black pepper Othmarschen sage Panama capsicum Paratyphi B turmeric, sage, spice mix Paratyphi B var. L(+) tartrate + black pepper, capsicum, coriander, mint, turmeric, spice mix Pomona turmeric
Poona black pepper, capsicum, celery, coriander, turmeric, sesame seed, spice/seasoning mix
Potsdam cumin, sesame seed Reading cumin Richmond capsicum, coriander, fenugreek, masala, rosemaryd, sesame seed, spice/seasoning mix
Rissen black pepper, capsicum, white pepper Rubislaw black pepper, caraway seed, sesame seed, white pepper, spice/seasoning mix Saintpaul coriander, cumin, ginger, mustard, sesame seed, spice/seasoning mix Salford cumin, sage Sandiego black pepper, capsicum, cardamom, coriander, cumin Saugus capsicum Schleissheim sesame seeds, thyme, turmeric Schwarzengrund capsicum, sesame seed, turmeric, spice/seasoning mix
Senftenberg black pepper, capsicum, celery seed, coriander, cumin, curry powder, garam masala nutmeg, sesame seed, thyme
Simi sage Singapore capsicum Stanley black pepper, capsicum, cumin, white pepper

Types of Pathogen and Filth Contamination Found in Spices | 3
FDA Draft Risk Profile | 27
Serotypeb Spicec
Stormont curry powder Sundsvall capsicum, chili powder Tallahassee masala Teddington annatto seed Telaviv cumin, laurel leaf, mint, sage Telelkebir cumin Telhashomer fenugreek leaf, spice/seasoning mix Tennessee capsicum, celery, sesame seed, spice/seasoning mix Thompson capsicum, curry powder, spice/seasoning mix Treforest capsicum Tucson capsicum
Typhimurium basil, black pepper, capsicum, coriander, curry powder, dill weed, fenugreek, five spice, ginger, masala, mint, oregano, rosemary, saffron, sage, sesame seed
Umbilo five spice, garam masala Urbana black pepper Vejle black pepper Virchow basil, black pepper, turmeric, coriander, spice/seasoning mix Wandsworthd broccoli powderd Warragul sage
Weltevreden anise, basil, bay, black pepper, capsicum, coriander, cumin, curry powder, mace, masala, nigella, onion, sesame seed, turmeric, white pepper, spice/seasoning mix
Westhampton capsicum Westminster cumin, sesame seed Wichita spice/seasoning mix I 3,15,34:d:- sesame seed II 40:z4,z24:- oregano II 40:z4,z24:z39 anise seed, oregano II 48:d:z6 cinnamon IIIa 48:z4,z24:- sesame seed IIIb 60:r:e,n,x,z15 capsicum, cumin IV 43:z4,z23:- fingerroot VI 6,14:a:1,5 spice mix a Salmonella isolates from (a) black pepper, white pepper, and chili/cayenne pepper capsicums uploaded to the CDC PulseNet database between Sept. 2001 and February 2010 (b) all other spices uploaded to the CDC PulseNet database between January 2001 and June 2010 and (c) additional isolates from spices sampled by FDA during 2006-2010 in the FDA FACTS database. Data in the CDC PulseNet and FDA FACTS databases are collected from reports from a number of labs so they may contain errors unknown to the authors. b Salmonella enterica subspecies enterica (I) unless noted otherwise c Different forms of the same spice or spice mixture are generally not distinguished, e.g., dried coriander leaves and seeds, or masala spice mix for chicken and masala mix for beef. Capsicum may include both hot and sweet varieties such as cayenne, paprika, chili powder, and other dried whole or ground spices made from capsicum peppers. A single common name was selected for a spice, which may differ from the name in the original reference, e.g., ajowan instead of bishop’s weed or omum. d Broccoli powder was the contaminated ingredient in the seasoning mix implicated in the S. Wandsworth outbreak (Sotir et al., 2009; see also Chapter 2 and Table 2.1). Investigations of the microbiological quality of spices produced and examined outside of the United States have reported some of the same serotypes reported in Table 3.2 but also have identified additional serotypes isolated from spices. For example, Sagoo et al. (2009) identified four additional serotypes associated with spices (Aequatoria, Edinburg, Friedenau, and Hato) and isolated 13 of the serotypes listed in Table 3.2. These studies demonstrate that a wide variety of spices can become contaminated with a wide variety of Salmonella serotypes. We were unable to identify any data to support the hypothesis that spice contamination is limited to a subset of Salmonella serotypes. Frequency data for individual serotypes (e.g., numbers of isolates reported) derived from the CDC PulseNet or FDA FACTS databases are not reported because these data cannot be easily interpreted, e.g., serotypes associated with a large outbreak are likely to have multiple entries arising from sampling during the outbreak investigation and therefore provide no information on

Types of Pathogen and Filth Contamination Found in Spices | 3
FDA Draft Risk Profile | 28
relative prevalence in the spice supply (percentage of the contaminated spice supply containing a particular serotype). Salmonella prevalence in spices (percentage of the spice supply contaminated with Salmonella), including relative prevalence by serotype and antimicrobial resistance, was estimated for shipments of imported spice offered for entry to the United States during FY2007-FY2009 and is discussed in Chapter 4.
3.2 FILTH ADULTERANTS FOUND IN SPICES
A finding of filth adulteration of spice can arise from the presence of avoidable defects in spice or excessive concentrations of natural or unavoidable defects in spice. Avoidable defects in spice are extraneous materials, defined by FDA as “any foreign matter in a product associated with objectionable conditions or practices in production, storage, or distribution” and includes “objectionable matter contributed by insects, rodents, and birds; decomposed material; and miscellaneous matter such as sand, soil, glass, rust, or other foreign substances” (FDA, 2012g). Spice adulterated with avoidable filth can result in a food being deemed “adulterated” under section 402(a)(1) of the Federal Food, Drug, and Cosmetic Act (FD&C Act) , which prohibits “any poisonous or deleterious substance that may render it injurious to health,” or section 402(a)(4) of the FD&C Act, which prohibits foods “prepared, packed or held under insanitary conditions whereby it may have become contaminated with filth, or whereby it may have been rendered injurious to health.” The concentration of avoidable filth elements that constitute filth adulteration depends on the nature of the adulterant and is determined on a case-by-case basis. FDA regulations at 21 CFR 110.110 (FDA, 2012h) address how FDA establishes maximum concentrations of natural or unavoidable defects in foods for human use that present no health hazard. FDA established Food Defect Action Levels (DALs) which define the maximum “levels” (concentrations) of specific elements of filth in specific foods (FDA, 2013g). FDA based DALs on an extensive survey of retail foods including spices in the 1980s and set values to reflect significant deviation from the best practices of industry and agriculture at that time. The spices for which a DAL has been established are given in Table 3.3. Not all spices have DALs nor have DALs been established for all possible adulterants in a spice. If no DAL has been established for a filth Table 3.3. Spices for which filth Food Defect Action Level(s) has/have been established in the United States
Spice Ground Whole Allspice x x Bay (Laurel) Leaves x Capsicum x x Paprika x Cinnamon or Cassia x x Cloves x Condimental seeds x Cumin seed x Curry Powder x Fennel seed x Ginger x Hops x Mace x Marjoram x x Nutmeg x x Oregano x x Pepper (black or white) x x Sage x x Sesame seeds x Spices, leafy x Thyme x x
Types of Pathogen and Filth Contamination Found in Spices | 3
FDA Draft Risk Profile | 29
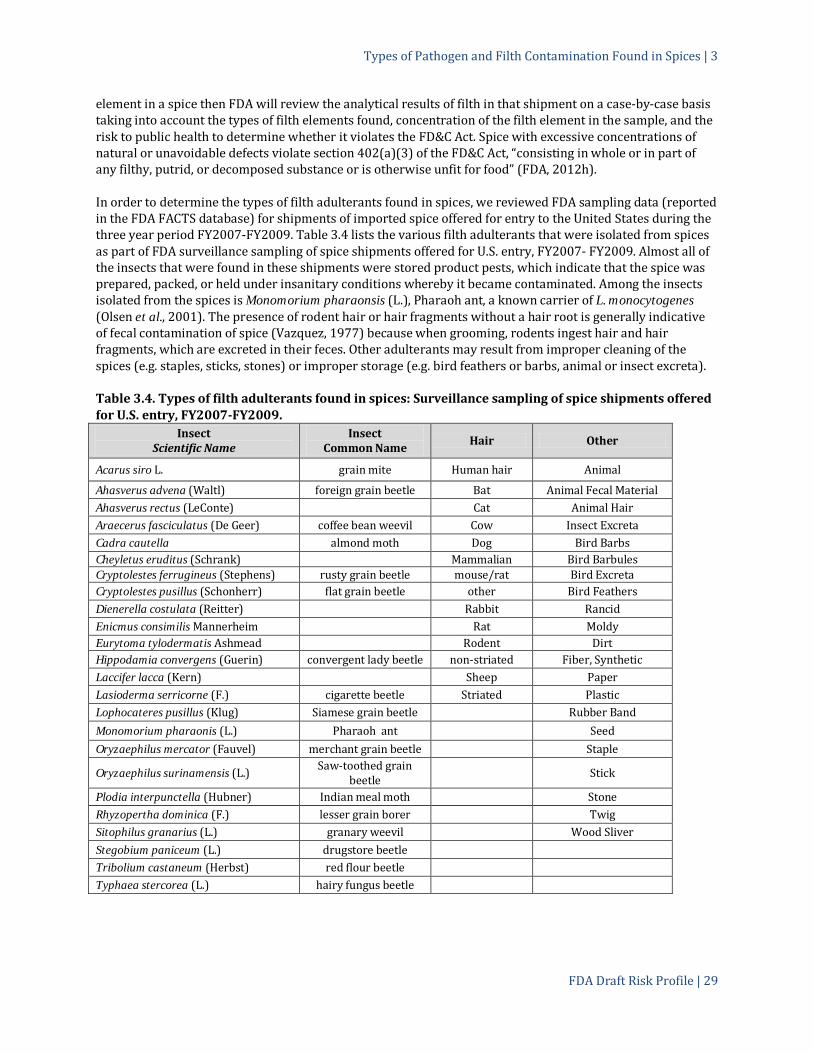
element in a spice then FDA will review the analytical results of filth in that shipment on a case-by-case basis taking into account the types of filth elements found, concentration of the filth element in the sample, and the risk to public health to determine whether it violates the FD&C Act. Spice with excessive concentrations of natural or unavoidable defects violate section 402(a)(3) of the FD&C Act, “consisting in whole or in part of any filthy, putrid, or decomposed substance or is otherwise unfit for food” (FDA, 2012h). In order to determine the types of filth adulterants found in spices, we reviewed FDA sampling data (reported in the FDA FACTS database) for shipments of imported spice offered for entry to the United States during the three year period FY2007-FY2009. Table 3.4 lists the various filth adulterants that were isolated from spices as part of FDA surveillance sampling of spice shipments offered for U.S. entry, FY2007- FY2009. Almost all of the insects that were found in these shipments were stored product pests, which indicate that the spice was prepared, packed, or held under insanitary conditions whereby it became contaminated. Among the insects isolated from the spices is Monomorium pharaonsis (L.), Pharaoh ant, a known carrier of L. monocytogenes (Olsen et al., 2001). The presence of rodent hair or hair fragments without a hair root is generally indicative of fecal contamination of spice (Vazquez, 1977) because when grooming, rodents ingest hair and hair fragments, which are excreted in their feces. Other adulterants may result from improper cleaning of the spices (e.g. staples, sticks, stones) or improper storage (e.g. bird feathers or barbs, animal or insect excreta). Table 3.4. Types of filth adulterants found in spices: Surveillance sampling of spice shipments offered for U.S. entry, FY2007-FY2009.
Insect Scientific Name
Insect Common Name Hair Other
Acarus siro L. grain mite Human hair Animal
Ahasverus advena (Waltl) foreign grain beetle Bat Animal Fecal Material Ahasverus rectus (LeConte) Cat Animal Hair Araecerus fasciculatus (De Geer) coffee bean weevil Cow Insect Excreta Cadra cautella almond moth Dog Bird Barbs Cheyletus eruditus (Schrank) Mammalian Bird Barbules Cryptolestes ferrugineus (Stephens) rusty grain beetle mouse/rat Bird Excreta Cryptolestes pusillus (Schonherr) flat grain beetle other Bird Feathers Dienerella costulata (Reitter) Rabbit Rancid Enicmus consimilis Mannerheim Rat Moldy Eurytoma tylodermatis Ashmead Rodent Dirt Hippodamia convergens (Guerin) convergent lady beetle non-striated Fiber, Synthetic Laccifer lacca (Kern) Sheep Paper Lasioderma serricorne (F.) cigarette beetle Striated Plastic Lophocateres pusillus (Klug) Siamese grain beetle Rubber Band Monomorium pharaonis (L.) Pharaoh ant Seed Oryzaephilus mercator (Fauvel) merchant grain beetle Staple
Oryzaephilus surinamensis (L.) Saw-toothed grain beetle Stick
Plodia interpunctella (Hubner) Indian meal moth Stone Rhyzopertha dominica (F.) lesser grain borer Twig Sitophilus granarius (L.) granary weevil Wood Sliver Stegobium paniceum (L.) drugstore beetle Tribolium castaneum (Herbst) red flour beetle Typhaea stercorea (L.) hairy fungus beetle
FDA Draft Risk Profile | 30
4. PREVALENCE AND CONCENTRATION OF SALMONELLA AND FILTH IN SPICES
We reviewed the scientific literature and available government/agency reports for surveillance studies that reported measurements of prevalence and/or concentration of Salmonella and filth in spices at any point along the farm-to-table continuum. We also researched Salmonella concentrations found in spice samples associated with foodborne outbreaks as well as antimicrobial resistance found in Salmonella strains that have been isolated from spices. Our literature review primarily used PubMed, Google, and Google Scholar to search the English-language literature using different combinations of the following keywords: Salmonella, filth, prevalence, level, enumeration, spice, herb, microbiological, quality, bacteriological, quality, evaluation, safety, profile, antimicrobial, activity, resistance, property, properties, drug, resistant, resistance. We also reviewed citations and references contained in the articles identified in our internet searches on this topic and other references collected during our work on this report (e.g., foodborne outbreaks, Chapter 2). In addition to the literature search, we analyzed FDA surveillance sampling data for Salmonella and filth in imported spice shipments offered for import over a three year period, FY2007-FY2009. Full details of the sampling protocols and inclusion criteria are provided in Van Doren et al. (2013a). FDA undertook a targeted sampling assignment to gather information on typical concentrations of Salmonella. Under this assignment, FDA analyzed samples of capsicum and sesame seeds from shipments offered for import to the United States during a five month period in 2010 for Salmonella. Full details of the study design, Salmonella prevalence and concentration results, and data analysis are provided in Van Doren et al. (2013c). The 2010 study also examined shipments for the presence of filth and these results are compared with the FY2007-FY2009 study results in Section 4.2.3. Finally, we analyzed FDA surveillance data over a ten year period (FY2000-FY2009) to explore the potential correlation between presence of Salmonella and filth in imported spice shipments. Details of the U.S. study are provided in Section 4.3. FDA requested scientific data and information from the spice industry and other stakeholders through a Federal Register Notice announcing the risk profile project, identifying data gaps, and requesting comments and scientific data and information to help fill the data gaps (FDA, 2010e). In response to this request, the American Spice Trade Association submitted spice sampling data collected in ASTA member spice processing facilities over a two year period by some of its members (ASTA, 2010; Ruckert, 2010). These data are discussed in Section 4.1.4. The discussion that follows summarizes data available from studies around the world on the prevalence and concentration of Salmonella and/or filth in spices. Comparison of prevalence values in different studies is complicated by the fact that each study may have examined a different amount of spice, which generally leads to a different limit of detection. For this reason, we report the mass examined whenever reporting prevalence values, e.g., 6.6 % (750 g; 95% CI 5.7-7.6%). Where possible, we report the 95% confidence intervals (95% CI) for the prevalence values as shown in the previous example. Different studies may have employed different methods of analysis, which can lead to differences in test sensitivities or selectivities. We assume that methods employed in the reported peer-reviewed and government studies have been validated and that results among studies are comparable. Interpretation of differences in prevalence or concentration values across studies should consider context (because the spice examined in each study is different), which we provide in our discussion.

Prevalence and Concentration of Salmonella and Filth in Spices | 4
FDA Draft Risk Profile | 31
4.1 SALMONELLA
4.1.1 SALMONELLA PREVALENCE AND CONCENTRATION IN SPICE: FROM FARM TO TABLE OVERVIEW
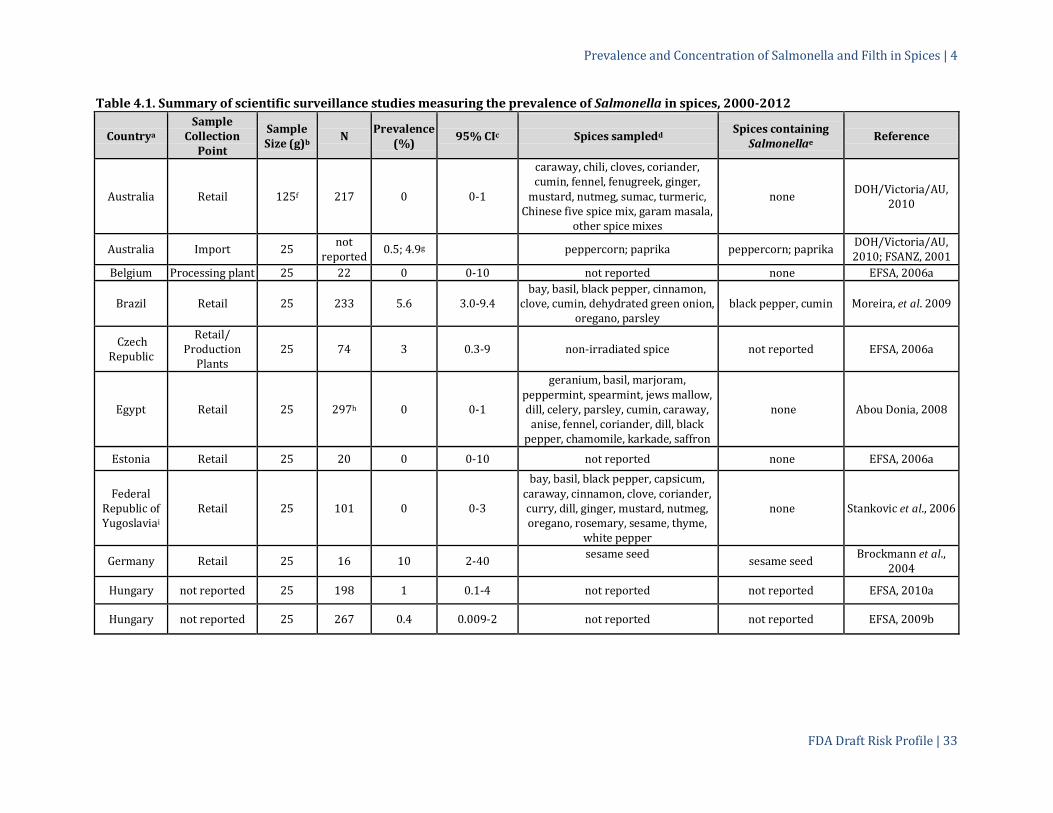
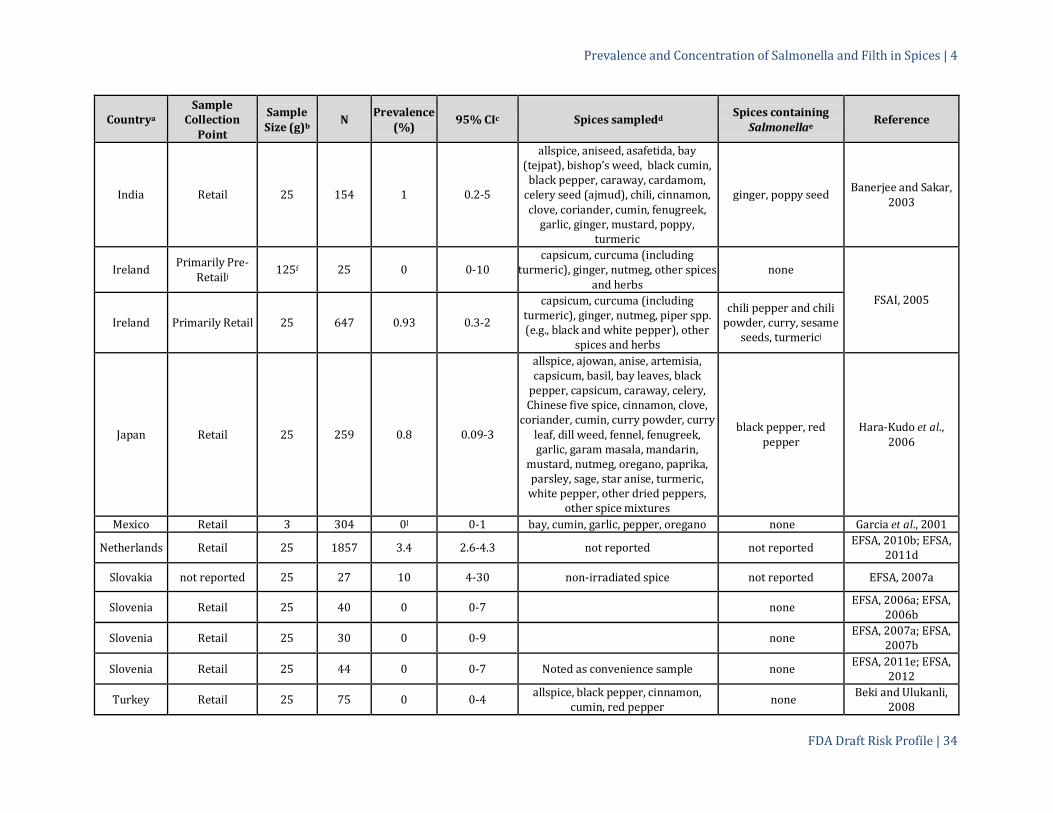
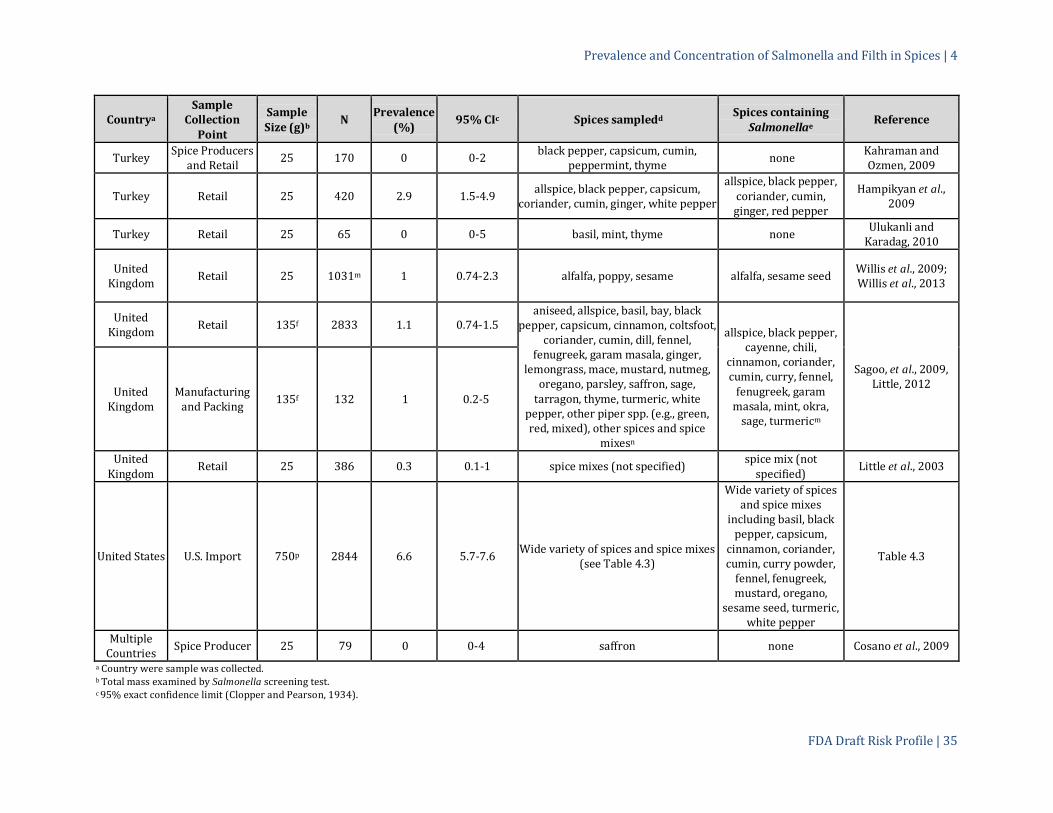
Limited data are available from the scientific literature on the prevalence of pathogens in spices at different points in the farm-to-table continuum. Information provided by studies published during the period 2000-2012 is summarized in Table 4.1. All of the values listed in Table 4.1 are from surveillance studies and most samples were collected from retail establishments. It is likely that a majority of spices examined in Australia, Belgium, Czech Republic, Federal Republic of Yugoslavia, Germany, Hungary, Ireland, Japan, the Netherlands, Slovakia, Slovenia, and the United Kingdom in these studies were imported because these countries are not major producers of the spices examined. All spices examined in the U.S. study described in Table 4.1 were imported. Nineteen studies examined samples exclusively from retail; the observed Salmonella-prevalence in spices in these studies ranged from 0 to 10% (3-135 g; 95% CI 0-40%). Two studies examined samples of spices exclusively from spice processing/packing facilities; these reported Salmonella prevalence values ranging from 0 to 1% (25-135 g; 95% CI 0 – 10%). Two studies examined spices exclusively from the point of import, finding prevalence values of 0.5-6.6% (25-750 g; 95% CI cannot be calculated for one study). Two studies examined “non-irradiated spices”, which we presume to mean spice that had not been subjected to a pathogen reduction treatment, and reported prevalence values ranging from 3 to 10% (25 g; 95% CI 0.3-30%). A majority of the studies summarized in Table 4.1 reported observed Salmonella prevalence values in the range of zero to one percent, regardless of setting, and many of the reported prevalence values reported are statistically smaller than the value determined in the U.S. study (Fisher exact test, p < 0.05). Because the screening test protocols used in all of the non-U.S. studies examined a smaller mass of spice than that used in the U.S. study, it is likely that at least some of the observed differences between the smaller Salmonella prevalence values reported in tests conducted outside the United States versus tests conducted in the United States arise from different limits of detection. The smaller prevalence values reported in the different countries and settings may also reflect real differences in prevalence either arising from a difference in the microbiological quality of the spices examined or differences resulting from the application of one or more processes intended to reduce the microbial load. Pathogen reduction treatments such as ethylene oxide, steam treatment or irradiation are commonly applied to spices to reduce the risk of microbial contamination (ASTA, 2011; see Section 8.2.1 a discussion of pathogen reduction treatments). Some insight into this latter hypothesis is provided in Section 4.1.3, where the prevalence of Salmonella contamination in spice shipments offered for import to the United States are compared on the basis of applied processes, and in Section 4.1.4, where the prevalence of Salmonella in spice lots examined post-pathogen reduction treatment is compared with the value for spice lots pre-treatment. Salmonella prevalence in retail spice samples in the United States is unknown. Neither FDA nor the spice industry collects enumeration data on a regular basis because the regulatory standard is absence of Salmonella. Table 4.2 summarizes Salmonella concentrations measured in spices and products associated with salmonellosis outbreaks attributed to contaminated spices or determined in surveillance studies. While the outbreaks associated with alfalfa seeds were attributed to consumption of alfalfa sprouts, the enumeration data are included in this table because the concentrations were determined in the dry seeds and alfalfa seeds can be consumed as spices. Salmonella concentrations ranging from 0.0007 to 11 MPN/g-spice (7 MPN per 10,000 g to 11 MPN per g) have been reported as shown in Table 4.2. Most of the Salmonella concentrations determined for spices in surveillance and outbreak investigations in other countries reported in Table 4.2 are in the same range as the values for capsicums and sesame seeds determined in the 2010 U.S. surveillance study (Van Doren, et al.,
Prevalence and Concentration of Salmonella and Filth in Spices | 4
FDA Draft Risk Profile | 32
2013c) but the largest values, reported for samples of spice gathered during the paprika- and black pepper-attributed outbreaks listed in Table 4.2 (Lehmacher et al., 1995; Gustavsen and Breen, 1984), are at least one order of magnitude larger than the largest values observed in surveillance studies. It should be noted that the concentrations of Salmonella in spice samples analyzed in surveillance and outbreak investigations may not necessarily reflect actual concentrations in food at the time of consumption. Surveillance data on the prevalence and concentrations of Salmonella in shipments of imported capsicum or sesame seed shipments were gathered by FDA in 2010. These data were used to develop a descriptive model of contamination prevalence and concentrations between-and within- imported shipments of capsicum or sesame seed offered for entry to the United States and are discussed in Section 4.1.3. The study found shipment mean concentrations of Salmonella in contaminated capsicum or sesame seed shipments vary widely between shipments and that many contaminated shipments contain low concentrations of contaminating organisms (Van Doren et al., 2013c). The Salmonella concentrations reported in spices, Table 4.2, are small but not atypical of concentrations reported in other foods associated with foodborne salmonellosis (WHO/FAO, 2002). However, in contrast with many other types of foods, spices are consumed in very small amounts during a single eating occasion (Section 7.2.2) so the Salmonella dose expected from consumption of spice during a single eating occasion is expected to be smaller than that for other foods with similar concentrations of contamination but consumed in larger quantities.
Prevalence and Concentration of Salmonella and Filth in Spices | 4
FDA Draft Risk Profile | 33
Table 4.1. Summary of scientific surveillance studies measuring the prevalence of Salmonella in spices, 2000-2012
Countrya Sample
Collection Point
Sample Size (g)b N Prevalence
(%) 95% CIc Spices sampledd Spices containing Salmonellae Reference
Australia Retail 125f 217 0 0-1
caraway, chili, cloves, coriander, cumin, fennel, fenugreek, ginger,
mustard, nutmeg, sumac, turmeric, Chinese five spice mix, garam masala,
other spice mixes
none DOH/Victoria/AU, 2010
Australia Import 25 not reported 0.5; 4.9g peppercorn; paprika peppercorn; paprika DOH/Victoria/AU,
2010; FSANZ, 2001 Belgium Processing plant 25 22 0 0-10 not reported none EFSA, 2006a
Brazil Retail 25 233 5.6 3.0-9.4 bay, basil, black pepper, cinnamon,
clove, cumin, dehydrated green onion, oregano, parsley
black pepper, cumin Moreira, et al. 2009
Czech Republic
Retail/ Production
Plants 25 74 3 0.3-9 non-irradiated spice not reported EFSA, 2006a
Egypt Retail 25 297h 0 0-1
geranium, basil, marjoram, peppermint, spearmint, jews mallow, dill, celery, parsley, cumin, caraway,
anise, fennel, coriander, dill, black pepper, chamomile, karkade, saffron
none Abou Donia, 2008
Estonia Retail 25 20 0 0-10 not reported none EFSA, 2006a
Federal Republic of Yugoslaviai
Retail 25 101 0 0-3
bay, basil, black pepper, capsicum, caraway, cinnamon, clove, coriander, curry, dill, ginger, mustard, nutmeg, oregano, rosemary, sesame, thyme,
white pepper
none Stankovic et al., 2006
Germany Retail 25 16 10 2-40 sesame seed sesame seed Brockmann et al., 2004
Hungary not reported 25 198 1 0.1-4 not reported not reported EFSA, 2010a
Hungary not reported 25 267 0.4 0.009-2 not reported not reported EFSA, 2009b
Prevalence and Concentration of Salmonella and Filth in Spices | 4
FDA Draft Risk Profile | 34
Countrya Sample
Collection Point
Sample Size (g)b N Prevalence
(%) 95% CIc Spices sampledd Spices containing Salmonellae Reference
India Retail 25 154 1 0.2-5
allspice, aniseed, asafetida, bay (tejpat), bishop’s weed, black cumin,
black pepper, caraway, cardamom, celery seed (ajmud), chili, cinnamon, clove, coriander, cumin, fenugreek,
garlic, ginger, mustard, poppy, turmeric
ginger, poppy seed Banerjee and Sakar, 2003
Ireland Primarily Pre-Retailj 125f 25 0 0-10
capsicum, curcuma (including turmeric), ginger, nutmeg, other spices
and herbs none
FSAI, 2005
Ireland Primarily Retail 25 647 0.93 0.3-2
capsicum, curcuma (including turmeric), ginger, nutmeg, piper spp. (e.g., black and white pepper), other
spices and herbs
chili pepper and chili powder, curry, sesame
seeds, turmericj
Japan Retail 25 259 0.8 0.09-3
allspice, ajowan, anise, artemisia, capsicum, basil, bay leaves, black
pepper, capsicum, caraway, celery, Chinese five spice, cinnamon, clove,
coriander, cumin, curry powder, curry leaf, dill weed, fennel, fenugreek, garlic, garam masala, mandarin,
mustard, nutmeg, oregano, paprika, parsley, sage, star anise, turmeric,
white pepper, other dried peppers, other spice mixtures
black pepper, red pepper
Hara-Kudo et al., 2006
Mexico Retail 3 304 0l 0-1 bay, cumin, garlic, pepper, oregano none Garcia et al., 2001
Netherlands Retail 25 1857 3.4 2.6-4.3 not reported not reported EFSA, 2010b; EFSA, 2011d
Slovakia not reported 25 27 10 4-30 non-irradiated spice not reported EFSA, 2007a
Slovenia Retail 25 40 0 0-7 none EFSA, 2006a; EFSA, 2006b
Slovenia Retail 25 30 0 0-9 none EFSA, 2007a; EFSA, 2007b
Slovenia Retail 25 44 0 0-7 Noted as convenience sample none EFSA, 2011e; EFSA, 2012
Turkey Retail 25 75 0 0-4 allspice, black pepper, cinnamon, cumin, red pepper none Beki and Ulukanli,
2008
Prevalence and Concentration of Salmonella and Filth in Spices | 4
FDA Draft Risk Profile | 35
Countrya Sample
Collection Point
Sample Size (g)b N Prevalence
(%) 95% CIc Spices sampledd Spices containing Salmonellae Reference
Turkey Spice Producers and Retail 25 170 0 0-2 black pepper, capsicum, cumin,
peppermint, thyme none Kahraman and Ozmen, 2009
Turkey Retail 25 420 2.9 1.5-4.9 allspice, black pepper, capsicum, coriander, cumin, ginger, white pepper
allspice, black pepper, coriander, cumin, ginger, red pepper
Hampikyan et al., 2009
Turkey Retail 25 65 0 0-5 basil, mint, thyme none Ulukanli and Karadag, 2010
United Kingdom Retail 25 1031m 1 0.74-2.3 alfalfa, poppy, sesame alfalfa, sesame seed Willis et al., 2009;
Willis et al., 2013
United Kingdom Retail 135f 2833 1.1 0.74-1.5
aniseed, allspice, basil, bay, black pepper, capsicum, cinnamon, coltsfoot,
coriander, cumin, dill, fennel, fenugreek, garam masala, ginger,
lemongrass, mace, mustard, nutmeg, oregano, parsley, saffron, sage,
tarragon, thyme, turmeric, white pepper, other piper spp. (e.g., green, red, mixed), other spices and spice
mixesn
allspice, black pepper, cayenne, chili,
cinnamon, coriander, cumin, curry, fennel,
fenugreek, garam masala, mint, okra,
sage, turmericm
Sagoo, et al., 2009, Little, 2012 United
Kingdom Manufacturing
and Packing 135f 132 1 0.2-5
United Kingdom Retail 25 386 0.3 0.1-1 spice mixes (not specified) spice mix (not
specified) Little et al., 2003
United States U.S. Import 750p 2844 6.6 5.7-7.6 Wide variety of spices and spice mixes (see Table 4.3)
Wide variety of spices and spice mixes
including basil, black pepper, capsicum,
cinnamon, coriander, cumin, curry powder,
fennel, fenugreek, mustard, oregano,
sesame seed, turmeric, white pepper
Table 4.3
Multiple Countries Spice Producer 25 79 0 0-4 saffron none Cosano et al., 2009
a Country were sample was collected. b Total mass examined by Salmonella screening test. c 95% exact confidence limit (Clopper and Pearson, 1934).

Prevalence and Concentration of Salmonella and Filth in Spices | 4
FDA Draft Risk Profile | 36
d Spices sampled list combines different forms of the same kind of spice under one name (e.g., ground and whole caraway seeds are listed as caraway) and combines related species under one name (e.g., cayenne, chili, paprika, and “red pepper” are listed as capsicum). See reference for more detailed list. e Spices containing Salmonella list reports spice name as noted in the reference. f Studies tested five sub-samples per spice sample; total mass examined is listed (i.e., five times sub-sample mass). g Spice-specific prevalence values for peppercorns (0.5%) and paprika (4.9%). h Does not include tea samples. i Currently the State Union of Serbia and Montenegro. j Majority of samples from importers/distributors, producers/blenders, packers/wholesalers or food manufactures/preparers (establishments using large amount of spice). k Four of six samples testing positive for Salmonella were from retail; one turmeric sample was collected from import/production/wholesaler and the curry powder sample was collected
from an establishment that uses large amounts of spices for food production. l Samples examined for the presence of Salmonella Typhi. m Only includes seed samples (sesame, poppy, and alfalfa). n Sagoo et al. (2009) reported spice types from all sample collection points together. p Protocol involved two screening tests, each 375-g composite sample derived from 15 25-g sub-samples (total of 30 sub-samples). Table 4.2. Concentration of Salmonella in spices and spice-containing foods implicated in salmonellosis illness outbreaks
Spice/Food Type of Samplea Concentration (MPN/g) Nb Reference
Black Pepper Outbreak 0.1 - >2.4 12 Gustavsen and Breen, 1984 Paprika Outbreak 2.5 1 Lehmacher et al., 1995 Paprika-containing spice mixtures Outbreakc 0.04-11 9 Lehmacher et al., 1995 Aniseed-containing tea Outbreak 0.036 4 Koch et al., 2005 Paprika Flavored Potato Chips Outbreak 0.04-0.45 5 Lehmacher et al., 1995 Tahini, hummus, and sesame seed -helva Outbreak <0.03-0.46 10 Unicomb et al., 2005 Alfalfa seeds Outbreak-Sprout 0.0007-0.016d 30 Inami et al., 2001 Alfalfa seeds Outbreak-Sprout < 1e NA Stewart et al., 2001 Black Pepper and Red Pepper Surveillance (retail) 0.086f 2 Hara-Kudo et al., 2006 Sesame seeds and mixtures of seedsg Surveillance (retail) <0.1-0.2 6 Willis et al., 2009; Willis, 2013 Alfalfa seeds Surveillanceh 0.0036 30 Inami et al., 2001 Capsicum Surveillance (Import into U.S) 0.002-0.23 18 Table 4.8; Van Doren et al., 2013c Sesame seed Surveillance (Import into U.S) 0.002-0.23 23 Table 4.8; Van Doren et al., 2013c a Samples collected as part of salmonellosis illness outbreak investigations or surveillance. Unless otherwise noted, the outbreak was associated with consumption of the spice or low-
moisture food containing the spice. b Number of total samples tested. NA indicates the number of samples examined was not reported. c Enumeration measurements took place approximately 1 year after the salmonellosis outbreak; samples were produced during the outbreak time period. d Values reported are for the dry seed. Values in table were derived from data reported by Inami et al. (2001) using the excel spreadsheet provided in the FDA Bacteriological Analytical
Manual (Blodgett, 2010). e Values reported are for the seed but seeds were soaked in water for three hours before beginning the enumeration procedure (Stewart et al., 2001), which may have led to some bacterial
growth. f Value was derived from the observations reported by Hara-Kudo et al. (2006) (positive screening test and negative MPN tubes) as described in Van Doren et al. (2013c). g Mixtures of seeds contained sesame, pumpkin, sunflower, linseed, and hemp (Willis, 2013). Identity of seeds sampled from Willis (2013); enumeration values from Willis et al. (2009). h Location of surveillance sampling in the seed supply chain was not reported.

Prevalence and Concentration of Salmonella and Filth in Spices | 4
FDA Draft Risk Profile | 37
4.1.2 PRIMARY PRODUCTION
We were unable to identify any studies examining Salmonella contamination in/on spice producing plants pre-harvest. As a result we can provide no information on the prevalence of Salmonella in/on spice producing plants at this point of production. Cosano et al. (2009) examined 79 25-g samples of saffron spice collected directly from producers from a variety of countries and found no Salmonella, placing a 95% CI on the observed prevalence in these samples of 0-4% (25 g, Table 4.1). Kahraman and Ozmen (2009) examined 25-g spice samples from producers and retailers in Turkey (distribution of samples from the different points in the spice food chain was not specified) and found no Salmonella. It is not possible to evaluate the limit on prevalence specific for primary production from the reported data from Kahraman and Ozmen (2009) but the combined sample set yielded a 95% CI of 0-2%, Table 4.1. The Food Safety Authority of Ireland (FSAI, 2005) reported finding one 25-g sample of turmeric collected from “import or production or packing premises or wholesaler” positive for Salmonella (reported in the “primarily retail” sample set listed in Table 4.1). None of the batch samples examined from “primarily pre-retail” settings, which included a majority of samples from “import or production or packing premises or wholesaler” tested positive for Salmonella (FSAI, 2005). As noted above, the sample size examined in these studies was only 25 g, which limited detection to larger concentrations of Salmonella in the spice samples.
4.1.3 DISTRIBUTION AND STORAGE
As described in Chapter 6, the supply chain for spices can be complex and span long times. Distribution and storage steps can take place at multiple points in the supply chain. Surveillance data on the prevalence and concentration of Salmonella in spices during distribution and storage is limited to evaluations of these quantities at the point of import. We were not able to identify any surveillance studies of Salmonella prevalence or concentrations in spices located in storage facilities or at other points of the distribution chain. Prevalence data reported between 2000 and 2012 is available from Australia and the United States, Table 4.1. In Australia, the prevalence of Salmonella in peppercorns (type not specified) collected at the point of import, was determined to be 0.5% (25 g) while that for paprika was 4.9% (25 g) (DOH/Victoria/AU, 2010). Without knowledge of the total number of samples examined, it is not possible to determine whether the observed differences in prevalence for these two types of spice are significant or whether the observed prevalence values determined in Australia are statistically different from those in the United States. As noted in Table 4.1 the study by the Food Safety Authority of Ireland (FSAI, 2005) included batch and single samples from “import or production or packing premises or wholesaler” as well as from other points in the spice supply chain. One 25-g sample of turmeric collected from “import or production or packing premises or wholesaler” in Ireland tested positive for Salmonella (FSAI, 2005). Reports of Salmonella-positive spice samples in the FDA RFR also provide information on the frequency of Salmonella-positive spice samples found in FDA-registered facilities, which include facilities that distribute, manufacture, process, pack/re-pack, and store spices. Data from the first three years of the RFR are described in Section 4.1.2. Food recalls associated with Salmonella-positive spice may result from samples collected during distribution or storage and these are described in Section 4.1.6.
4.1.3.1 SALMONELLA IN SHIPMENTS OF IMPORTED SPICE OFFERED FOR ENTRY TO THE UNITED STATES
Data reported in this section were derived from two studies of FDA surveillance sampling data unless otherwise noted: (1) review of results of the annual sampling program for the three years FY2007-FY2009 and (2) review of sampling results from a targeted sampling assignment in 2010 (August-December) that focused on enumeration of Salmonella in shipments of imported capsicum and sesame seed offered for entry

Prevalence and Concentration of Salmonella and Filth in Spices | 4
FDA Draft Risk Profile | 38
to the United States. Full reports of both studies were originally published in Food Microbiology (Van Doren et al., 2013a; Van Doren et al., 2013c). The data from these studies are compared with an earlier study of Salmonella prevalence in spice shipments offered for import to the United States (Satchell et al., 1989) and other relevant data. Observed prevalence of Salmonella in shipments of imported spice offered for entry to the United States, FY2007-FY2009 Salmonella prevalence in imported spice shipments offered for entry to the United States during FY2007-FY2009 was 6.6% (750 g; 95% CI 5.7-7.6%), Table 4.3. This value does not differ statistically from the value determined by FDA for examination of a set of 31 imported spice shipments offered for entry to the United States during the period March 1987-January 1988, 6% (750 g; 95% CI 0.8-20%) (Satchell et al., 1989). These two studies are the only published studies to examine the prevalence of Salmonella contamination of spices in the United States. During FY2007-FY2009, sampled imported spice shipments offered for entry to the United States were 1.9 times more likely to be found contaminated than sampled shipments of all other FDA-regulated foods offered for U.S. entry combined (relative risk3 (RR), 95% CI 1.6-2.3; Fisher exact test for difference, p<0.001). Interpretation of this value is complicated by the fact that a number of different sampling protocols were used for imported shipments of FDA-regulated foods other than spices and these differences could lead to test sensitivity differences. Comparing only data for shipments that were sampled with the same FDA Category II food sampling protocol used for spices (Andrews and Hammack, 2003), we found an even larger RR for contamination of imported spice shipments as compared with shipments of other imported FDA-regulated foods: RR = 4.4 (95% CI 3.4-5.8; Fisher exact test for difference, p<0.001). The larger prevalence of Salmonella in imported shipments of spices as compared with other imported FDA-regulated foods can be surprising to some because the low water activity of spices does not support Salmonella growth, whereas the high water activity of some other imported FDA-regulated foods will support growth when other conditions for growth are met (e.g., nutrients and pH) (FDA, 2012d). Further, many spices have inhibitory compounds that provide antibacterial activity against Salmonella (Arora and Kaur, 1999; Hammer et al., 1999; Ceylan and Fung, 2004; Indu et al., 2006; Du et al., 2009a and 2009b; Tajkarimi et al., 2010; Hussien et al., 2011; discussed in Section 5.1.2). These compounds can limit growth and survival of Salmonella in (wet/inoculated) spices and foods containing spices or their essential oils under some conditions (Arora and Kaur, 1999; Hammer et al., 1999; Ceylan and Fung, 2004; Indu et al., 2006; Du et al., 2009a and 2009b; Tajkarimi et al., 2010; Hussien et al., 2011). Clearly, other factors, including the ability of Salmonella to survive in a variety of low moisture foods including some, if not all, spices (Podolak et al., 2010; Lehmacher et al., 1995; Keller et al., 2013), are more important in determining the prevalence of Salmonella in imported spice shipments offered for entry to the United States. Impact of spice properties on observed prevalence of Salmonella in shipments of imported spice offered
for entry to the United States, FY2007-FY2009 Spices are derived from a variety of plant parts, which may result in differences in exposure to pathogen-containing wildlife, insects, and soil during growth, harvest or primary processing. In order to determine whether these differences influence the proportion of imported spice shipments contaminated with Salmonella, we grouped spice screening test results by plant part, Table 4.3. Spices derived from plant fruits, such as black pepper, white pepper, and capsicums, or plant seeds, such as cumin, mustard and sesame, were grouped together in the fruit/seed category. Spices derived from plant roots included dried roots, such as turmeric and ginger, as well as dehydrated onion and garlic. Examples of spices included in the leaf category are oregano, basil, and varieties of mint. Examples of spices included in the bark/flower category include cinnamon/cassia, cloves, and saffron. Data for shipments in which the plant part was ambiguous were excluded from this part of the analysis, e.g., shipments described as “coriander” but lacking information as to whether it was the seed or leaf.
3 Relative risk is the ratio of prevalence values.

Prevalence and Concentration of Salmonella and Filth in Spices | 4
FDA Draft Risk Profile | 39
Table 4.3. Observed prevalence of Salmonella–contaminated shipments of imported spice and other imported FDA-regulated food shipments offered for entry to the United States, FY2007-FY2009.
Spice/Food #
Positive N Salmonella Shipment
Prevalence (%) 95% Confidence
Intervala All Imported Spicesb 187 2844 6.6 5.7-7.6 All other Imported FDA-regulated Foodsb 600 17508 3.4 3.2-3.7 Categories of Spicesc Fruit/Seedd 92 1465 6.3 5.1-8.0 Rootd 15 202 7.4 4.2-12 Leafd 18 160 11 6.8-17 Bark/Flowerd 1 66 2 0-10 Spices subjected to different processes Spices subjected to a Pathogen Reduction Treatmente 4 137 3 0.8-7 Spices Not Treated/Not Known if treatede 183 2707 6.8 5.8-7.8 Spice Blendf 43 790 5.4 4.0-7.3 Spice Not-Blendf 141 1999 7.1 6.0-8.3 Ground/cracked Spice 131 1658 7.9 6.6-9.3 Whole Spice 51 884 5.8 4.3-7.5 Specific Spicesg Capsicumh 35 492 7.1 5.0-9.8 Cinnamon/Clove/Nutmeg 1 73 1 0-7 Coriander 16 110 15 8.5-23 Cumin 11 138 8.0 4.0-14 Curry Powder 17 195 8.7 5.2-14 Fennel/Fenugreek/Mustard 3 112 2.7 1-8 Oregano/Basil 10 82 12 6.0-21 Pepper, Black 13 291 4.5 2.4-7.5 Pepper, White 1 87 1 0-6 Sesame Seed 20 177 11 7.0-17 Turmeric 8 118 7 3-10 Spices/Spices and Seasonings, NECi 32 685 4.7 3.2-6.5 All Other spices 20 284 7.0 4.4-11 a 95% exact confidence limit (Clopper and Pearson, 1934). b All shipments of imported FDA-regulated spices or other imported foods that were sampled during the study period. Salmonella
screening tests for spices examined 750 g of spices; screening tests for all other FDA-regulated foods examined 375, 750, or 1500 g of food, depending on the FDA food category (Andrews and Hammack, 2003).
c Categorizations derived from product code (FDA, 2012j) and description. When description was insufficient to categorize, the sample was not included.
d Categorization of spice shipment based on the part of the plant from which it is derived. e Spice shipment classified as “commercially sterile”, “heat treated” or “irradiated” and those in which the product description identified
treatment (e.g., “treated with steam” or “treated with ethylene oxide”) are categorized as “Treated Spices.” All other spices are categorized as “Not Treated/Not Known if treated.”
f The category “Spice Blend” includes shipments of spice mixtures while “Spice Not Blend” includes shipments of a single type of spice. g Different forms of spices with the same name, such as dried coriander leaves and seeds, are grouped together. h Capsicum includes paprika as well as hot and other sweet dried capsicum peppers. i Shipments of spices “not elsewhere classified” (NEC) in the product code (FDA, 2012j) are assigned to “Spices, NEC”, “Spices and
Seasonings, NEC”, or “Mixed Spices and Seasonings, NEC.” Prevalence values among the plant part categories ranged from a mean of 2% (750 g; 95% CI 0-10%) for spices derived from the bark/flower of the plant to 11% (750 g; 95% CI 6.8-17%) for spices derived from plant leaves and differences among some of the categories are significant (chi-square test statistic for multiple proportions (8.8) > chi-square critical value (7.8) at the 95% confidence level). Application of the Marascuilo procedure establishes that a (statistically) larger proportion of imported shipments of spices in both leaf and fruit/seed spice categories offered for entry to the United States are contaminated with

Prevalence and Concentration of Salmonella and Filth in Spices | 4
FDA Draft Risk Profile | 40
Salmonella than imported shipments of bark/flower spices. Because 95% of the bark/flower samples examined were either cinnamon/cassia or clove, the difference could arise from reduced test sensitivity for these spices (Section 2.2), the antibacterial activity of these spices against Salmonella (Arora and Kaur, 1999; Ceylan and Fung, 2004; Du et al., 2009a; Tajkarimi et al., 2010; Hussien et al., 2011), or differences in growing/processing conditions, including Salmonella exposure. Reduced test sensitivity and antibacterial activity against Salmonella (Hammer et al., 1999; Burt, 2004; Du et al., 2009b; Tajkarimi et al., 2010) were not sufficient to significantly limit the prevalence of Salmonella in imported shipments of oregano and allspice in the U.S. study; the shipment prevalence of Salmonella for these two spices was 12% (750 g; 95% CI 5.8-22%). Salmonella frequency and prevalence in shipments of specific types of imported spices was also evaluated, Table 4.3. Values are presented for spices for which there were at least 65 shipments examined during the three-year period. In this section of Table 4.3, different spices with the same common name, such as coriander seed and leaf, were grouped together. “Capsicum” includes paprika as well as hot and other sweet dried capsicum peppers. In a few cases, we grouped results for different spices together in order to be able to include these data in Table 4.3 and meet the minimum number of shipments. We included the “spices/spices and seasonings, NEC (not elsewhere classified)” category because “NEC” products codes are commonly assigned to imported spice shipments and this category includes less common spices and spice mixtures. Observed prevalence values ranged from 1%, for shipments of white pepper (750 g; 95% CI 0-6%) or the sum of shipments of cinnamon/cassia, clove and nutmeg (750 g; 95% CI 0-7%), to 14% (750 g; 95% CI 8.3- 22%) for coriander. Application of the chi square test for multiple proportions indicates that the prevalence values for the different types of spices are not all the same (test statistic (50.8) > chi-square critical value (21.03) at the 95% confidence level). However, there are not enough data for each type/category of spice to identify which differences are significant; the Marascuilo procedure did not identify any pairs of spice types that were statistically different. Additional research is needed to distinguish prevalence values among the spice types but these data demonstrate that Salmonella shipment contamination is common among a wide range of spice types. The spice-specific prevalence values in Table 4.3 can be compared with values determined for these spices in other countries. Moreira et al. (2009) found major brands of retail black pepper collected in Botucatu, San Paolo, Brazil between January 2004 and April 2006 to have a statistically larger prevalence (18%, 25 g; 95% CI 1-30%, p <0.001) than that found in imported black pepper shipments in this report, even though the Brazilian screening test protocol was less sensitive (examined 25 g as compared with 750 g). While Brazil is a major global producer of black pepper, only 3 (1%) of the black pepper shipments examined in the U.S. study were imported from Brazil. Willis et al. (2009) found a smaller Salmonella prevalence for sesame seeds at retail in the United Kingdom (1.7%; 25 g; 95% CI 0.9-2.9%) than that found in the U.S. study (p<0.001). In this U.K. study, the mass of spice examined in the screening test was smaller than that used in the U.S. study (25 g as compared with 750 g; Willis et al., 2009; Van Doren et al., 2013a; Table 4.1), which could have led to the smaller observed prevalence value. Impact of processing on observed prevalence of Salmonella in shipments of imported spice offered for
entry to the United States, FY2007-FY2009 The frequency and prevalence of Salmonella in shipments of spices that had undergone different processes, including pathogen reduction treatments, blending, or grinding, are compared to those for spices that had not undergone the process in Table 4.3. Spice shipments which were classified as “commercially sterile”, “heat treated”, or “irradiated” or for which the industry supplied product description specified that a pathogen reduction process treatment had been applied to the spice (for example, “steam treated” or “treated with ethylene oxide”) were grouped together in Table 4.3 as “Spices subjected to a Pathogen Reduction Treatment.” A more detailed analysis of these data was precluded because some of these classifications do not differentiate among treatment types and the total number of shipments in this group was small. All other shipments were grouped in “Spices Not Treated/Not known if treated.” We do not know whether the small number of spice shipments in this category is a true reflection of the proportion of imported spice shipments that have been subjected to such treatments because importers are not required to provide process

Prevalence and Concentration of Salmonella and Filth in Spices | 4
FDA Draft Risk Profile | 41
treatment information unless the spice shipment has been irradiated and even in this case, the FDA product code builder (FDA, 2012j) allows importers to choose other ways of defining their product. Therefore, it is possible that the “Spices Not Treated/Not known if treated” group includes spice shipments that had undergone a pathogen reduction treatment before U.S. entry. The observed Salmonella prevalence for spice shipments subjected to a pathogen reduction treatment before U.S. entry was approximately one-half that for shipments of spices that were not treated or for which no treatment information was provided but the difference is not statistically significant (Fisher Exact Test). The confounding of treated and untreated spice shipments in the “Not treated/Not known” category could be responsible for the similarity of these prevalence values. What is more important is the fact that shipments of “treated” spices were found to contain Salmonella. Effective pathogen reduction treatments should not leave any viable Salmonella bacteria in the spice. Sagoo et al. (2009) also reported finding “treated” spice samples at retail in the United Kingdom with unsatisfactory microbiological quality but did not note whether Salmonella was found. Salmonella contamination of “treated” shipments could reflect insufficient pathogen reduction treatment and/or post-treatment contamination. No information was available on whether the treatment processes applied to the spices had been validated and as is discussed in detail in Section 8.2.1, different treatment processes and treatment conditions can result in very different net reductions in microbial populations. The Salmonella prevalence for shipments of blended spices (mixtures) was statistically similar to that for non-blended spice shipments. Similarly, shipments of ground/cracked spice were not found to have statistically different prevalence values than shipments containing whole spice. While no differences were apparent when comparing the average prevalence for these different categories of spice shipments across all types of spices, significant differences did exist for some types of spices. For example, larger prevalence values were found for shipments of imported ground/cracked capsicum and coriander shipments as compared with their whole counterparts, Table 4.4, with relative risks of contamination of 11 (750 g; 95% CI, 2-220) and >10 (750 g; 95% CI , 2-∞) respectively. In contrast, differences in shipment prevalence were not observed for ground/cracked cumin or black pepper as compared with their whole counterparts, Table 4.4. In the United Kingdom, Sagoo et al. (2009) found that a larger proportion of spice flakes had unsatisfactory microbiological quality than those in their whole form, but did not specify whether this difference was primarily related to Salmonella presence/absence. There are a number of hypotheses that can explain the differences in observed prevalence for ground/cracked versus whole forms of capsicum or coriander observed (e.g., introduction of Salmonella during the grinding/cracking process or more efficient detection of Salmonella in these ground spices due to dispersion of originally highly localized contamination); additional research is needed to distinguish among them. Table 4.4. Comparison of observed prevalence of Salmonella-contaminated shipments of some whole and ground/cracked imported spice offered for entry to the United States, FY2007-FY2009.
Whole Spicea Ground/Cracked Spicea
Spice # Positive N Salmonella Shipment
Prevalence (%)
# Positive N
Salmonella Shipment
Prevalence (%)
Relative Risk (RR)
[95% CI]b
Capsicums 1 122 0.8 33 366 9.0 11 [2-220] Coriander 0 43 0.0 16 68 24 >10 [2- ∞] Cumin 5 59 8 6 79 8 0.9 [0.2-3] Pepper, Black 7 156 4 6 135 4 1.0 [0.3-3]
a Categorizations derived from product code (FDA, 2012j) and description. When description was insufficient to categorize, the sample was not included. b Relative risk of shipment contamination for ground/cracked spice as compared with whole spice ; 95% exact confidence limit (Clopper
and Pearson, 1934).

Prevalence and Concentration of Salmonella and Filth in Spices | 4
FDA Draft Risk Profile | 42
Impact of source country on observed prevalence of Salmonella in shipments of imported spice offered for entry to the United States, FY2007-FY2009 In order to examine whether the “country of origin” impacts the observed prevalence of Salmonella contamination of imported spice shipments offered for entry to the United States, values were determined for spice shipments imported from different countries without regard to spice type. In most cases, the exporting country is the country where the spice was grown, dried and, if applicable, processed but in some cases, the export country of record is not the country where the spice was grown.
Shipments from 79 different countries were examined during the study period; contaminated shipments came from 37 different countries. Contamination of spice shipments is not limited to only a few source countries. Salmonella shipment frequency and prevalence values by country are provided in Table 4.5; only countries for which at least 65 imported shipments were examined are included. Country-specific prevalence values range from 0.9% (750 g; 95% CI 0-5%) for spice shipments imported from Canada to 14% (750 g; 95% CI 8.6-21%) for shipments imported from Mexico. Application of the chi-square test for multiple proportions determined that the Salmonella prevalence values among this set of countries are not all statistically similar (Van Doren et al., 2013a). More research is needed to understand the differences in prevalence of Salmonella in spice imported from some countries.
Table 4.5. Observed prevalence of Salmonella-contaminated imported spice shipments offered for entry to the United States as a function of export country, FY2007-FY2009
Exporting Country # Positive N Salmonella Shipment
Prevalence (%) 95% Confidence Intervala
Canada 1 110 0.9 0-5 China 9 245 4 2-7 India 92 1057 8.7 7.1-11 Indonesia 2 82 2 0-9 Mexico 19 136 14 8.6-21 Pakistan 6 205 3 1-6 Thailand 6 111 5 2-10 Vietnam 7 149 5 2-9 All other countriesb 45 749 6.0 4.4-8.0
a 95% exact confidence limit (Clopper and Pearson, 1934). a Totals 71 other countries for which fewer than 65 imported shipments were examined per country during FY2007-FY2009.
Willis et al. (2009) found the Salmonella prevalence for retail samples of seeds sold in the United Kingdom was smaller for seeds imported from the European Union member countries than for seeds imported from non-European Union member countries. Making the same comparison, we find that spice shipments from European Union member countries did not have a statistically smaller Salmonella prevalence value than shipments from non-European Union member countries (p>0.05), but we note that the total number of shipments from these European Union member countries was small (79).
Salmonella serotype diversity isolated from spices in shipments of imported spice offered for entry to the United States, FY2007-FY2009
Salmonella serotypes were identified (or partially identified) for isolates from most of the contaminated spice shipments (180/187). Multiple serotypes were identified in 12% (22) of the contaminated shipments yielding a total of 204 unique isolates. Nearly all of the isolates characterized were determined to be Salmonella enterica subspecies enterica. Six isolates were characterized as Salmonella enterica subspecies II, IIIa or IIIb, Table 4.6. The serotype Salmonella Rissen was not among the serotypes identified from Salmonella isolates examined in this surveillance study despite its association with a large scale outbreak attributed to contaminated imported white pepper that took place during the study period (CDPH/FDB/ERU, 2010). It was isolated from investigative samples associated with the outbreak.
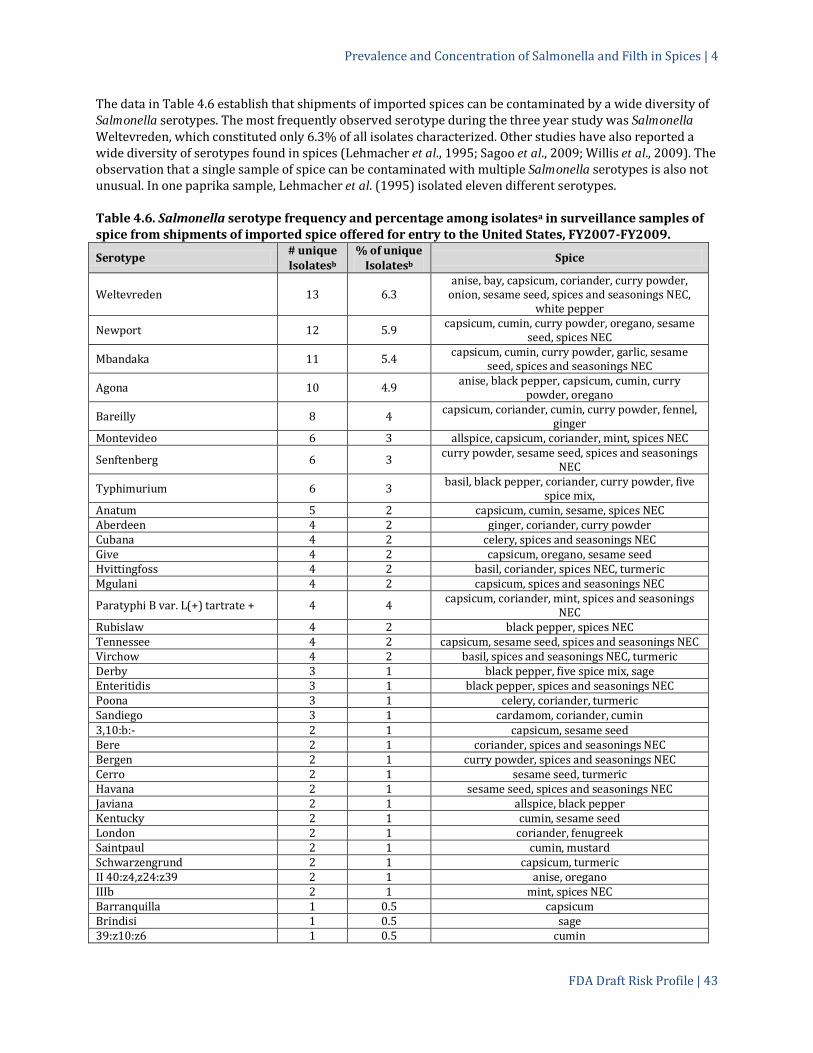
Prevalence and Concentration of Salmonella and Filth in Spices | 4
FDA Draft Risk Profile | 43
The data in Table 4.6 establish that shipments of imported spices can be contaminated by a wide diversity of Salmonella serotypes. The most frequently observed serotype during the three year study was Salmonella Weltevreden, which constituted only 6.3% of all isolates characterized. Other studies have also reported a wide diversity of serotypes found in spices (Lehmacher et al., 1995; Sagoo et al., 2009; Willis et al., 2009). The observation that a single sample of spice can be contaminated with multiple Salmonella serotypes is also not unusual. In one paprika sample, Lehmacher et al. (1995) isolated eleven different serotypes.
Table 4.6. Salmonella serotype frequency and percentage among isolatesa in surveillance samples of spice from shipments of imported spice offered for entry to the United States, FY2007-FY2009.
Serotype # unique Isolatesb
% of unique Isolatesb Spice
Weltevreden 13 6.3 anise, bay, capsicum, coriander, curry powder,
onion, sesame seed, spices and seasonings NEC, white pepper
Newport 12 5.9 capsicum, cumin, curry powder, oregano, sesame seed, spices NEC
Mbandaka 11 5.4 capsicum, cumin, curry powder, garlic, sesame seed, spices and seasonings NEC
Agona 10 4.9 anise, black pepper, capsicum, cumin, curry powder, oregano
Bareilly 8 4 capsicum, coriander, cumin, curry powder, fennel, ginger
Montevideo 6 3 allspice, capsicum, coriander, mint, spices NEC
Senftenberg 6 3 curry powder, sesame seed, spices and seasonings NEC
Typhimurium 6 3 basil, black pepper, coriander, curry powder, five spice mix,
Anatum 5 2 capsicum, cumin, sesame, spices NEC Aberdeen 4 2 ginger, coriander, curry powder Cubana 4 2 celery, spices and seasonings NEC Give 4 2 capsicum, oregano, sesame seed Hvittingfoss 4 2 basil, coriander, spices NEC, turmeric Mgulani 4 2 capsicum, spices and seasonings NEC
Paratyphi B var. L(+) tartrate + 4 4 capsicum, coriander, mint, spices and seasonings NEC
Rubislaw 4 2 black pepper, spices NEC Tennessee 4 2 capsicum, sesame seed, spices and seasonings NEC Virchow 4 2 basil, spices and seasonings NEC, turmeric Derby 3 1 black pepper, five spice mix, sage Enteritidis 3 1 black pepper, spices and seasonings NEC Poona 3 1 celery, coriander, turmeric Sandiego 3 1 cardamom, coriander, cumin 3,10:b:- 2 1 capsicum, sesame seed Bere 2 1 coriander, spices and seasonings NEC Bergen 2 1 curry powder, spices and seasonings NEC Cerro 2 1 sesame seed, turmeric Havana 2 1 sesame seed, spices and seasonings NEC Javiana 2 1 allspice, black pepper Kentucky 2 1 cumin, sesame seed London 2 1 coriander, fenugreek Saintpaul 2 1 cumin, mustard Schwarzengrund 2 1 capsicum, turmeric II 40:z4,z24:z39 2 1 anise, oregano IIIb 2 1 mint, spices NEC Barranquilla 1 0.5 capsicum Brindisi 1 0.5 sage 39:z10:z6 1 0.5 cumin

Prevalence and Concentration of Salmonella and Filth in Spices | 4
FDA Draft Risk Profile | 44
Serotype # unique Isolatesb
% of unique Isolatesb Spice
43:z4,z23:- 1 0.5 spices NEC 47: z4, z23: - 1 0.5 curry powder 48:d:z6 1 0.5 cinnamon/cassia 6, 14 : a : 1, 5 1 0.5 spices NEC 6,7,14:e,n,z15 1 0.5 capsicum Abaetetuba 1 0.5 basil Adabraka 1 0.5 coriander Altona 1 0.5 capsicum Ball 1 0.5 black pepper Bangkok 1 0.5 spices and seasonings NEC Bonn 1 0.5 sesame seed Braenderup 1 0.5 black pepper Brazzaville 1 0.5 capsicum Bredeney 1 0.5 capsicum Canada 1 0.5 black pepper Carmel 1 0.5 coriander Carrau 1 0.5 oregano Dublin 1 0.5 curry powder Eastbourne 1 0.5 turmeric Elokate 1 0.5 black pepper Freetown 1 0.5 spices NEC Gamaba 1 0.5 cumin Gaminara 1 0.5 coriander Glostrup 1 0.5 sesame seed Hermannswerder 1 0.5 sage Idikan 1 0.5 sesame seed Lexington 1 0.5 ginger Llandoff 1 0.5 sesame seed Martonos 1 0.5 capsicum Minnesota 1 0.5 basil Molade 1 0.5 capsicum Muenchen 1 0.5 capsicum Muenster 1 0.5 spices and seasonings NEC Nordrhein 1 0.5 capsicum Nottingham 1 0.5 oregano Oranienburg 1 0.5 oregano Orion 1 0.5 curry powder Othmarschen 1 0.5 spices NEC Paratyphi B 1 0.5 turmeric Potsdam 1 0.5 sesame seed Richmond 1 0.5 spices and seasonings NEC Simi 1 0.5 sage Stanley 1 0.5 capsicum Sundsvall 1 0.5 capsicum Telelkebir 1 0.5 cumin Telhashomer 1 0.5 fenugreek Umbilo 1 0.5 five spice mix Vejle 1 0.5 black pepper Westminster 1 0.5 sesame seed Wichita 1 0.5 spices and seasonings NEC IIIa 48:z4,z24:- 1 0.5 sesame seed IIIa 1 0.5 capsicum a Salmonella enterica subspecies enterica unless otherwise note; partial serotypes included. Where appropriate, serotype names reported have been combined in this frequency table e.g., “Sieburg” is listed with Cerro, as compared with the table presented in Van Doren et al., 2013a. b For each spice shipment sampled, the number of unique isolates identified is the number of different serotypes identified. Therefore, the number (percent) of isolates is the number (percent) of contaminated spice shipments found with that serotype.

Prevalence and Concentration of Salmonella and Filth in Spices | 4
FDA Draft Risk Profile | 45
Similar serotype diversity has been observed among Salmonella isolates from all FDA-regulated imported foods (Zhao et al., 2003; Zhao et al., 2006). Further, the most common serotypes found in spice shipments offered for entry to the United States do not appear to differ substantially from those reported for all types of FDA-regulated imported food shipments offered for entry and sampled by FDA (Zhao et al. 2003, Zhao et al. 2006). For example, Weltevreden and Newport were the two most common serotypes isolated from imported spice shipments offered for entry to the United States during FY2007-FY2009 (U.S. study) and were among the top four serotypes isolated in 2000 and 2001 from examined imported shipments of FDA-regulated foods offered for U.S. entry (Zhao et al., 2003; Zhao, et al. 2006). These data support the hypothesis that the serotypes most frequently isolated from imported spices are not specific to or preferentially found in spices. A more detailed comparison of serotype prevalence values for spices and other imported FDA-regulated foods is not possible because of the significant differences in sample design between the FDA FY2007-FY2009 study (Van Doren et al., 2013a) and the studies of Zhao and coworkers (Zhao et al., 2003; Zhao et al., 2006; Zhao, 2008), where data for spices and targeted samples, such as samples collected as part of an outbreak investigation, were included in the summary statistics. Inclusion of targeted samples in the analysis of serotype prevalence will generally bias values to serotypes associated with the triggering event because multiple samples of the same food source are sampled.
We can also compare the Salmonella serotypes isolated from spices offered for import to the United States with those isolated from food samples in other countries. Among the 42 serotypes isolated from food samples collected during 2007-2009 in Asia (a major source of spices for the United States) and reported to the World Health Organization (WHO) Global Foodborne Infections Network (WHO/GFN, 2012), half were also isolated from spices in the U.S. study (Table 4.6).
The serotype diversity observed for isolates from spices offered for import to the United States and imported FDA-regulated foods in general, differs in character with that generally observed for isolates from animal meats for which a small number of predominant serotypes is common (USDA/FSIS, 2012; FDA, 2012a; FDA, 2012c; Sasaki et al., 2012; Guo et al., 2011; Yang et al., 2010; Kudaka et al., 2006; Cui et al., 2005). The much wider diversity of Salmonella serotypes found in spices may be a reflection of a much wider diversity of contamination sources, such as soil, water, rodents, birds, and insects, as compared with that for animal-derived meat products.
Antimicrobial resistance of Salmonella isolated from spices in shipments of imported spice offered for entry to the United States, FY2007-FY2009
Fourteen (6.8%) of the Salmonella isolates from imported spice shipments offered for entry to the United States during the three-year study period FY2007-FY2009 were found to exhibit antimicrobial resistance, Table 4.7. Approximately half (8/14) of the isolates with antimicrobial resistance were found to be resistant to three or more antimicrobials. Two isolates (Salmonella serotypes Agona and Newport) were resistant to seven antimicrobials. Perhaps most importantly, approximately one-quarter of the resistant strains (4/14) were resistant to first-line antimicrobial agents used to treat salmonellosis in some populations (Guerrant et al., 2001; Thielman and Guerrant, 2004): trimethoprim/sulfamethoxazole (2) and ceftriaxone (2). None of the isolates was resistant to ciprofloxacin, another first-line antimicrobial for salmonellosis (Guerrant et al., 2001), although many were resistant to nalidixic acid (8/14), which has been found to be an indicator of low level resistance to fluoroquinolones (Rodriguez-Avial et al., 2005; Threlfall et al., 2006) and may be a first step towards the development of resistance to ciprofloxacin (Van Looveren et al., 2001). Other common antimicrobial resistances exhibited among the resistant isolates were to sulfisoxazole (10/14), tetracycline (9/14), chloramphenicol (6/14), streptomycin (5/14), kanamycin (4/14) and ampicillin (3/14). No resistance was observed among the isolates to amikacin, amoxicillin/clavulanic acid, or cefoxitin. The isolation of highly resistant Salmonella strains from spices has been reported by others (Zhao et al., 2006, Zhao, 2008; Brockmann et al., 2004) including Salmonella Typhimurium DT 104, which was involved in the 2001 salmonellosis outbreak associated with sesame seed-helva consumption (Fisher et al., 2001; Brockmann, 2001; Little, 2001; Guérin, 2001) and is characteristically resistant to ampicillin,

Prevalence and Concentration of Salmonella and Filth in Spices | 4
FDA Draft Risk Profile | 46
chloramphenicol, streptomycin, sulfonamide and tetracycline (ACSSuT). This phenotype was observed in one isolate each of serotype Typhimurium and Agona in the U.S. study, Table 4.7.
The prevalence of antimicrobial resistant Salmonella strains in imported spices contaminated with Salmonella does not appear to be larger than that found for strains isolated from imported FDA-regulated foods in general (Zhao et al., 2003; Zhao et al., 2006; Zhao, 2008) and is smaller than that reported for retail meats in the United States (USDA/FSIS, 2012), Japan (chickens; Sasaki et al., 2012) or in China (Yang et al. 2010). As with the serotype diversity, the smaller antimicrobial resistance profile for spices as compared with retail meats is consistent with a much wider diversity of contamination sources.
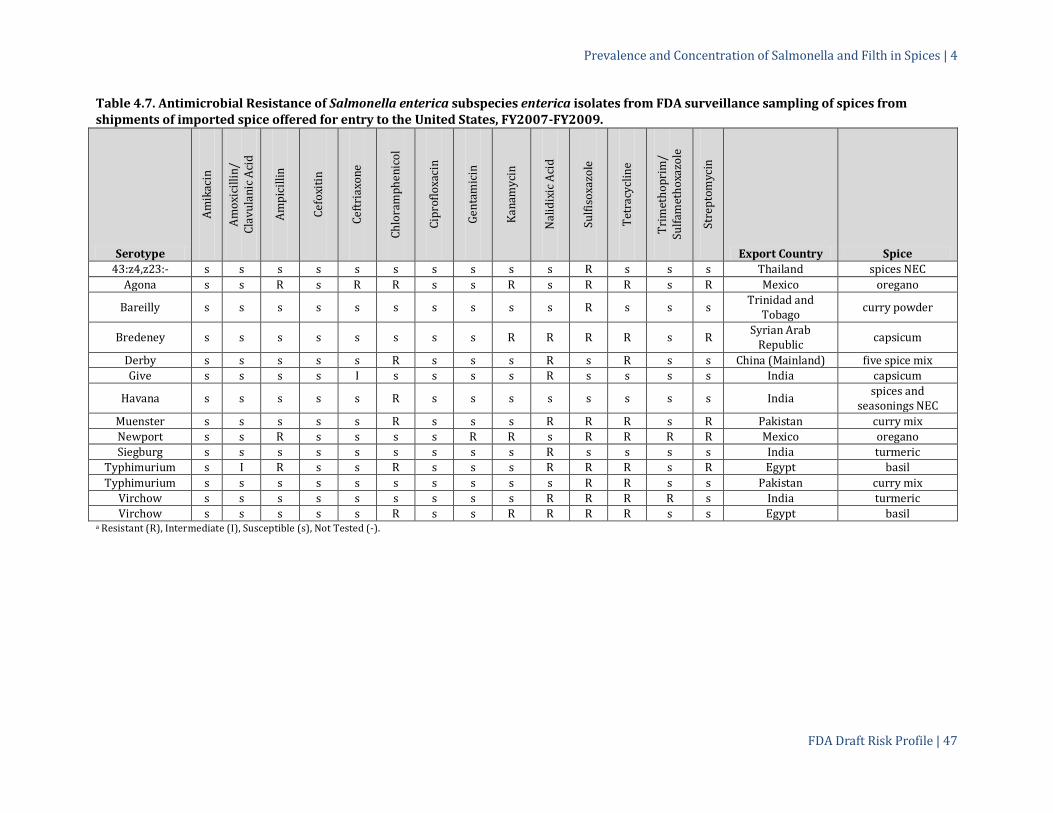
Prevalence and Concentration of Salmonella and Filth in Spices | 4
FDA Draft Risk Profile | 47
Table 4.7. Antimicrobial Resistance of Salmonella enterica subspecies enterica isolates from FDA surveillance sampling of spices from shipments of imported spice offered for entry to the United States, FY2007-FY2009.
Serotype
Amik
acin
Amox
icill
in/
Cl
avul
anic
Aci
d
Ampi
cilli
n
Cefo
xitin
Ceftr
iaxo
ne
Chlo
ram
phen
icol
Cipr
oflo
xaci
n
Gent
amic
in
Kana
myc
in
Nal
idix
ic A
cid
Sulfi
soxa
zole
Tetr
acyc
line
Trim
etho
prim
/
Sulfa
met
hoxa
zole
Stre
ptom
ycin
Export Country Spice
43:z4,z23:- s s s s s s s s s s R s s s Thailand spices NEC Agona s s R s R R s s R s R R s R Mexico oregano
Bareilly s s s s s s s s s s R s s s Trinidad and Tobago curry powder
Bredeney s s s s s s s s R R R R s R Syrian Arab Republic capsicum
Derby s s s s s R s s s R s R s s China (Mainland) five spice mix Give s s s s I s s s s R s s s s India capsicum
Havana s s s s s R s s s s s s s s India spices and seasonings NEC
Muenster s s s s s R s s s R R R s R Pakistan curry mix Newport s s R s s s s R R s R R R R Mexico oregano Siegburg s s s s s s s s s R s s s s India turmeric
Typhimurium s I R s s R s s s R R R s R Egypt basil Typhimurium s s s s s s s s s s R R s s Pakistan curry mix
Virchow s s s s s s s s s R R R R s India turmeric Virchow s s s s s R s s R R R R s s Egypt basil
a Resistant (R), Intermediate (I), Susceptible (s), Not Tested (-).

Prevalence and Concentration of Salmonella and Filth in Spices | 4
FDA Draft Risk Profile | 48
Salmonella concentration in shipments of imported capsicum and sesame seed offered for entry to the United States, Aug-Dec 2010. In order to determine the typical concentrations of Salmonella in spice shipments offered for entry to the United States, FDA undertook a special sampling assignment targeting two spices: capsicum and sesame seed. The short term assignment was designed to sample shipments randomly and thereby provide a snapshot of the shipment distribution with respect to Salmonella presence and concentration. A full report on this study has been published (Van Doren et al., 2013c). A total of 299 capsicum and 233 sesame seed shipments were sampled. Results and discussion relevant to this section of the risk profile are presented below. Full details of the sampling plan and methods used in the study as well as characteristics of the shipments sampled are provided in Appendix C. Screening and MPN test results are presented in Table 4.8. Between-shipment distributions of Salmonella mean concentrations in contaminated shipments examined varied widely among sampled shipments with estimated mean shipment concentrations among contaminated shipments ranging from 6 x 10⁻⁴ to 0.09 MPN/g (6 MPN per 10,000 g to 9 MPN per 100 g) for capsicum shipments and 6 x 10⁻⁴ to 0.04 MPN/g (6 MPN per 10,000 g to 4 MPN per 100 g) for sesame seed shipments. Within-shipment contamination observed was not inconsistent with a Poisson distribution. Our experiments were not capable of discerning the within-shipment contamination distribution among spice-serving sized samples. Observations from this 2010 FDA study were used to develop a model of between- and within-shipment Salmonella contamination of imported capsicum or sesame seed shipments offered for entry to the United States. Six parametric models were examined; four of these are illustrated in Figures 4.1 and 4.2. The best-fit models of contamination for both shipments of imported capsicum and imported sesame seed were gamma-Poisson distributions (nominal shipment contamination prevalence of 100%), as determined by AIC, i.e., between-shipment mean concentrations of contamination were described by a gamma distribution while within-shipment distribution was described by a Poisson distribution. The assumption of Poisson-distributed within-shipment contamination was explicitly examined in the study for both types of spices and it was found that the data were not inconsistent with the assumption (Van Doren et al., 2013c). The observations and models developed in the 2010 FDA study predict that most contaminated shipments of capsicum or sesame seeds contain relatively small mean concentrations of Salmonella. As a consequence, sampling plan design, particularly selections of an appropriate sample size and validated method of analysis, are critical to ensure efficient surveillance. For the best-fit parametric model descriptions of Salmonella contamination found in this study, we estimate that approximately 25-50% of contaminated capsicum or sesame seed shipments examined would be detected by FDA’s standard 750 g or 1500 g testing protocols. In contrast, sampling protocols examining only 25 g of sample would be much less efficient, detecting approximately 5-10% of contaminated shipments examined. These results and others are shown in Appendix C, Table C3.
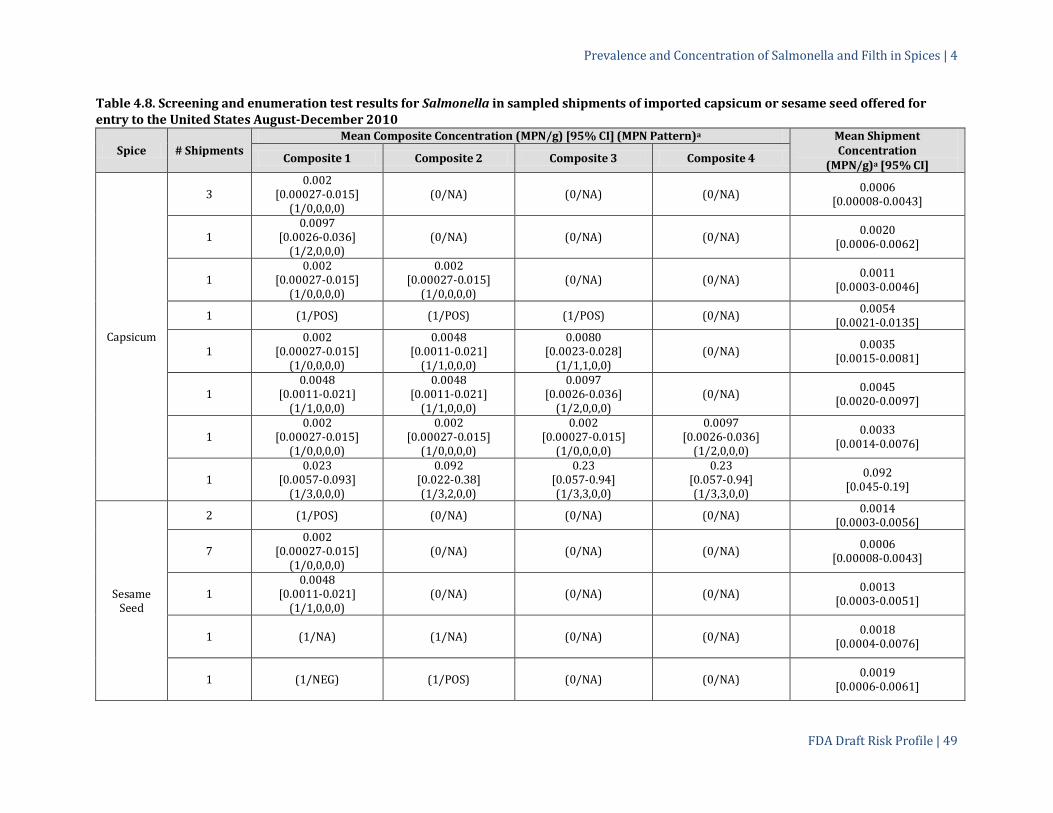
Prevalence and Concentration of Salmonella and Filth in Spices | 4
FDA Draft Risk Profile | 49
Table 4.8. Screening and enumeration test results for Salmonella in sampled shipments of imported capsicum or sesame seed offered for entry to the United States August-December 2010
Spice # Shipments Mean Composite Concentration (MPN/g) [95% CI] (MPN Pattern)a Mean Shipment
Concentration (MPN/g)a [95% CI] Composite 1 Composite 2 Composite 3 Composite 4
Capsicum
3 0.002
[0.00027-0.015] (1/0,0,0,0)
(0/NA)
(0/NA) (0/NA) 0.0006
[0.00008-0.0043]
1 0.0097
[0.0026-0.036] (1/2,0,0,0)
(0/NA) (0/NA) (0/NA) 0.0020 [0.0006-0.0062]
1 0.002
[0.00027-0.015] (1/0,0,0,0)
0.002 [0.00027-0.015]
(1/0,0,0,0)
(0/NA)
(0/NA) 0.0011
[0.0003-0.0046]
1 (1/POS) (1/POS) (1/POS) (0/NA) 0.0054 [0.0021-0.0135]
1 0.002
[0.00027-0.015] (1/0,0,0,0)
0.0048 [0.0011-0.021]
(1/1,0,0,0)
0.0080 [0.0023-0.028]
(1/1,1,0,0) (0/NA) 0.0035
[0.0015-0.0081]
1 0.0048
[0.0011-0.021] (1/1,0,0,0)
0.0048 [0.0011-0.021]
(1/1,0,0,0)
0.0097 [0.0026-0.036]
(1/2,0,0,0) (0/NA) 0.0045
[0.0020-0.0097]
1 0.002
[0.00027-0.015] (1/0,0,0,0)
0.002 [0.00027-0.015]
(1/0,0,0,0)
0.002 [0.00027-0.015]
(1/0,0,0,0)
0.0097 [0.0026-0.036]
(1/2,0,0,0)
0.0033 [0.0014-0.0076]
1 0.023
[0.0057-0.093] (1/3,0,0,0)
0.092 [0.022-0.38] (1/3,2,0,0)
0.23 [0.057-0.94] (1/3,3,0,0)
0.23 [0.057-0.94] (1/3,3,0,0)
0.092 [0.045-0.19]
Sesame Seed
2 (1/POS) (0/NA) (0/NA) (0/NA) 0.0014 [0.0003-0.0056]
7 0.002
[0.00027-0.015] (1/0,0,0,0)
(0/NA)
(0/NA) (0/NA) 0.0006
[0.00008-0.0043]
1 0.0048
[0.0011-0.021] (1/1,0,0,0)
(0/NA) (0/NA) (0/NA) 0.0013 [0.0003-0.0051]
1 (1/NA)
(1/NA)
(0/NA) (0/NA) 0.0018 [0.0004-0.0076]
1 (1/NEG)
(1/POS)
(0/NA) (0/NA) 0.0019 [0.0006-0.0061]

Prevalence and Concentration of Salmonella and Filth in Spices | 4
FDA Draft Risk Profile | 50
Spice # Shipments Mean Composite Concentration (MPN/g) [95% CI] (MPN Pattern)a Mean Shipment
Concentration (MPN/g)a [95% CI] Composite 1 Composite 2 Composite 3 Composite 4
2 0.002
[0.00027-0.015] (1/0,0,0,0)
0.002 [0.00027-0.015]
(1/0,0,0,0)
(0/NA)
(0/NA) 0.0011
[0.0003-0.0046]
1 (1/NA) (1/NA)
(1/NA)
(0/NA) 0.0037 [0.0011-0.0126]
2
(1/POS)
(1/POS)
(1/POS)
(0/NA) 0.0054
[0.0021-0.0135]
1
0.0043 [0.001-0.018] (1/0,1,0,0)b
Revisedc: (1/POS)
0.032 [0.013-0.078] (1/2,0,2,2)b
Revisedc: (1/POS)
0.038 [0.0096-0.15] (1/3,0,1,0)b
Revisedc: (1/POS)
(0/NA) 0.0104 [0.0059-0.019]
1 (1/POS) (1/POS) (1/POS) (1/POS) > 0.006
1 0.0048
[0.0011-0.021] (1/1,0,0,0)
0.0097 [0.0026-0.036]
(1/2,0,0,0)
0.0097 [0.0026-0.036]
(1/2,0,0,0)
0.015 [0.0046-0.048]
(1/2,1,0,0)
0.0091 [0.0048-0.017]
1 0.0097
[0.0026-0.036] (1/2,0,0,0)
0.0097 [0.0026-0.036]
(1/2,0,0,0)
0.015 [0.0046-0.048]
(1/2,1,0,0)
0.023 [0.0057-0.093]
(1/3,0,0,0)
0.013 [0.0069-0.024]
1 0.023
[0.0057-0.093] (1/3,0,0,0)
0.042 [0.0098-0.18]
(1/3,1,0,0)
0.042 [0.0098-0.18]
(1/3,1,0,0)
0.093 [0.022-0.39] (1/3,2,0,0)
0.042 [0.020-0.088]
1 0.023
[0.0057-0.093] (1/3,0,0,0)
0.023 [0.0057-0.093]
(1/3,0,0,0)
0.023 [0.0057-0.093]
(1/3,0,0,0)
0.23 [0.057-0.94] (1/3,3,0,0)
0.036 [0.017-0.074]
a Screening and enumeration test results as reported and described in Van Doren et al., (2013c). 95% confidence limits on mean concentration are provided in brackets (Blodgett, 2010). MPN pattern for composite samples, given in parentheses, includes 1/ for the positive screening test followed by the number of tubes at each dilution that tested positive, ordered from highest to lowest sample mass used (375g/100g,10g,1g,0.1g); 1/POS for composites in which one or more tubes in the dilution assay tested positive for Salmonella; 1/NEG for composites in which none of the dilution assay tubes tested positive; 1/NA or 0/NA for composites in which no follow-up dilution assay was performed. Estimates for the mean Salmonella concentration in the shipment was determined from the full set of test results for that shipment. See Van Doren et al. (2013c) for details.
b Rarity index for dilution assay results is small (<0.05), indicating the pattern is unusual/unexpected. c We use the binary dilution assay result (POS/NEG) (noted as “Revised”) when developing models of shipment contamination. See Van Doren et al. (2013c) for additional detail

Prevalence and Concentration of Salmonella and Filth in Spices | 4
FDA Draft Risk Profile | 51
Figure 4.1. Complementary cumulative distribution functions (p × (1-CDF(λ)) for models of Salmonella contamination among shipments of imported capsicum offered for entry to the United States compared with observations. The series of solid black steps illustrates the observed between-shipment distribution; dashed series of steps describe the 95% confidence limits for observed values (Kaplan-Meier estimates; Kaplan and Meier, 1958). Smooth curves illustrate model estimates: gamma-Poisson (blue), lognormal-Poisson (orange), log-logistic-Poisson (green), and Weibull-Poisson (red).
-3.5 -3.0 -2.5 -2.0 -1.5 -1.0
0.00
0.01
0.02
0.03
0.04
0.05
S almonel la level, log10(MPN/g)
Pro
babi
lity

Prevalence and Concentration of Salmonella and Filth in Spices | 4
FDA Draft Risk Profile | 52
Figure 4.2. Complementary cumulative distribution functions (p× (1-CDF(λ)) for models of Salmonella contamination among shipments of imported sesame seeds offered for entry to the United States compared with observations. The series of solid black steps illustrates the observed between-shipment distribution; dashed series of steps describe the 95% confidence limits for observed values (Kaplan-Meier estimates; Kaplan and Meier, 1958). Smooth curves illustrate model estimates: gamma-Poisson (blue), lognormal-Poisson (orange), log-logistic-Poisson (green), and Weibull-Poisson (red).
4.1.4 SECONDARY PROCESSING AND FOOD MANUFACTURING
As described in Chapter 6, spices may undergo a number of processes such as removal of debris, cracking/grinding, blending, pathogen reduction treatment, and/or re-packing at secondary spice processing facilities and may be added to foods in food manufacturing facilities. Once added to foods, the spice may be subjected to a pathogen reduction treatment, such as cooking. Because spices are shelf-stable, they are commonly warehoused. Information about the prevalence of Salmonella in spice lots in ASTA member spice processing facilities was provided by data submitted by ASTA in response to the Federal Register Notice and is discussed below in Section 4.1.4.1. Sagoo et al. (2009) found a Salmonella prevalence of 1% (135 g; 95% CI 0.2-5%) for a wide variety of spices collected from spice “production” facilities (secondary spice processing facilities) in the United Kingdom, Table 4.1. Two of the Salmonella-positive spice samples in the study reported by the Food Safety Authority of Ireland (FSAI, 2005) were from (1) an “import or production or packing premises or wholesaler” and (2) an “establishment[s] using large amounts of herbs/spices for food preparation.” A study
-3.5 -3.0 -2.5 -2.0 -1.5 -1.0
0.00
0.02
0.04
0.06
0.08
0.10
0.12
Sal monel l a level, log10(MPN/g)
Prob
abili
ty

Prevalence and Concentration of Salmonella and Filth in Spices | 4
FDA Draft Risk Profile | 53
examining spices in processing plant facilities in Belgium found no samples contaminated with Salmonella (25 g; 95% CI 0-10%; EFSA, 2006a), Table 4.1. The FDA RFR also provides data on the frequency of Salmonella-positive spice samples found in FDA-registered facilities, which include facilities that distribute, process, pack/re-pack, and store spices. Data from the first three years of the RFR are described below. Spice/food recalls associated with Salmonella-positive samples may arise from samples collected from pre-retail sites or retail/end user sites. Information about spice-associated U.S. recalls is provided in Section 4.1.6.
4.1.4.1 SALMONELLA PREVALENCE IN SPICE SAMPLES COLLECTED IN SPICE INDUSTRY MANUFACTURING FACILITIES (ASTA MEMBERS)
ASTA submitted a large set of microbiological testing data on spice lots (ASTA, 2010; Ruckert, 2010) in response to the Federal Register Notice requesting scientific data and information to support development of the risk profile on pathogens and filth in spices (FDA, 2010e). According to the submission, “The ASTA members that provided the information handled more than 50% of the spices distributed during the reporting period (August 1, 2007-July 31, 2009)” (Ruckert, 2010), i.e., domestic and imported spices sold in the United States (Van Doren, 2011). Unfortunately, it is not possible to determine from the information provided, the fraction of spice distributed that are represented by this data set. However, this data set does provide some information on the relative prevalence of Salmonella and generic Escherichia coli in spice lots that had not undergone a pathogen reduction treatment as compared with those that had undergone such a treatment, information that is not easily determined from FDA surveillance data. Methods of analysis and sample mass tested in the Salmonella screening tests varied somewhat among the different contributing ASTA members, according to the ASTA submission (Ruckert, 2010). Specifically, the submission indicates that at least one composite sample was tested for Salmonella for each result, that “a number of participants followed the Bacteriological Analytical Manual FDA Category II or Category III testing procedures for Salmonella,” and that the mass of that composite sample “ranged between 25 to 375 grams.” (Ruckert, 2010). No other method/sample-mass information was provided. Because the sensitivity of the test depends strongly on the mass of spice analyzed and can also depend on the sample compositing scheme (Bassett et al., 2010), the absence of this information complicates interpretation of the Salmonella lot prevalence values derived from these data and quantitative comparisons within this data set and with other data sets. Table 4.9 summarizes the data ASTA provided on the prevalence of Salmonella in spice lots that had not been subjected to a pathogen reduction treatment and includes an average prevalence value for all spice lots tested and individual prevalence values for types of spice for which at least 55 lots were tested. We decided to use this slightly smaller cutoff for inclusion to allow more comparisons between pre/no treatment and post-treatment spice from this data set. Confidence limits are provided for all values. Table 4.9. Observed prevalence of Salmonella contamination in spice lots from some ASTA member companies to which no pathogen reduction treatment had been applied, August 1, 2007-July 31, 2009
Spice # Positivea N Salmonella Lot Prevalence (%)a
95% Confidence Intervalb
All Spices 228 12178 1.87 1.64-2.13 Specific Spices Cassia 0 877 0 0.0-0.3 Cloves 0 60 0 0-5 Cumin Seed 50 191 26 20-33 Parsley 0 1032 0 0.0-0.3 Paprika 155 9731 1.59 1.35-1.86 Pepper, Black 19 55 35 22-49 All other spices 4 232 2 0.5-4 a Screening tests examined a total of 25-375 g spice. b 95% exact confidence limit (Clopper and Pearson, 1934).
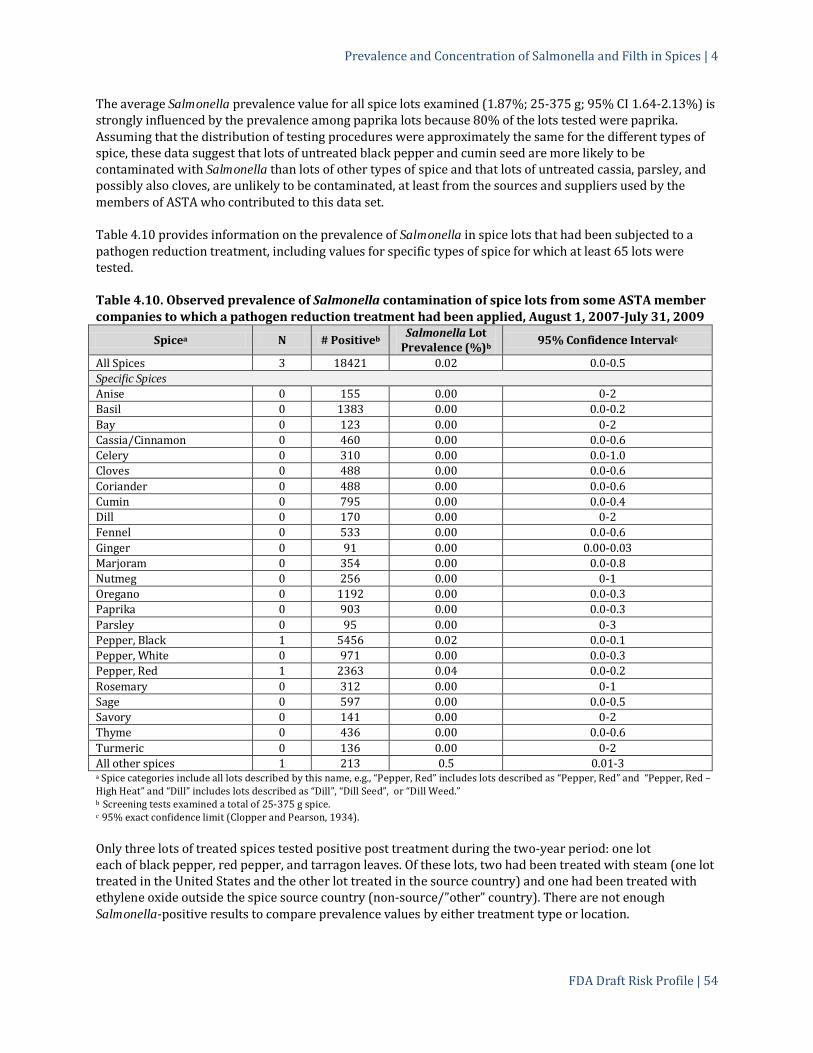
Prevalence and Concentration of Salmonella and Filth in Spices | 4
FDA Draft Risk Profile | 54
The average Salmonella prevalence value for all spice lots examined (1.87%; 25-375 g; 95% CI 1.64-2.13%) is strongly influenced by the prevalence among paprika lots because 80% of the lots tested were paprika. Assuming that the distribution of testing procedures were approximately the same for the different types of spice, these data suggest that lots of untreated black pepper and cumin seed are more likely to be contaminated with Salmonella than lots of other types of spice and that lots of untreated cassia, parsley, and possibly also cloves, are unlikely to be contaminated, at least from the sources and suppliers used by the members of ASTA who contributed to this data set. Table 4.10 provides information on the prevalence of Salmonella in spice lots that had been subjected to a pathogen reduction treatment, including values for specific types of spice for which at least 65 lots were tested. Table 4.10. Observed prevalence of Salmonella contamination of spice lots from some ASTA member companies to which a pathogen reduction treatment had been applied, August 1, 2007-July 31, 2009
Spicea N # Positiveb Salmonella Lot Prevalence (%)b 95% Confidence Intervalc
All Spices 3 18421 0.02 0.0-0.5 Specific Spices Anise 0 155 0.00 0-2 Basil 0 1383 0.00 0.0-0.2 Bay 0 123 0.00 0-2 Cassia/Cinnamon 0 460 0.00 0.0-0.6 Celery 0 310 0.00 0.0-1.0 Cloves 0 488 0.00 0.0-0.6 Coriander 0 488 0.00 0.0-0.6 Cumin 0 795 0.00 0.0-0.4 Dill 0 170 0.00 0-2 Fennel 0 533 0.00 0.0-0.6 Ginger 0 91 0.00 0.00-0.03 Marjoram 0 354 0.00 0.0-0.8 Nutmeg 0 256 0.00 0-1 Oregano 0 1192 0.00 0.0-0.3 Paprika 0 903 0.00 0.0-0.3 Parsley 0 95 0.00 0-3 Pepper, Black 1 5456 0.02 0.0-0.1 Pepper, White 0 971 0.00 0.0-0.3 Pepper, Red 1 2363 0.04 0.0-0.2 Rosemary 0 312 0.00 0-1 Sage 0 597 0.00 0.0-0.5 Savory 0 141 0.00 0-2 Thyme 0 436 0.00 0.0-0.6 Turmeric 0 136 0.00 0-2 All other spices 1 213 0.5 0.01-3 a Spice categories include all lots described by this name, e.g., “Pepper, Red” includes lots described as “Pepper, Red” and “Pepper, Red – High Heat” and “Dill” includes lots described as “Dill”, “Dill Seed”, or “Dill Weed.” b Screening tests examined a total of 25-375 g spice. c 95% exact confidence limit (Clopper and Pearson, 1934). Only three lots of treated spices tested positive post treatment during the two-year period: one lot each of black pepper, red pepper, and tarragon leaves. Of these lots, two had been treated with steam (one lot treated in the United States and the other lot treated in the source country) and one had been treated with ethylene oxide outside the spice source country (non-source/”other” country). There are not enough Salmonella-positive results to compare prevalence values by either treatment type or location.

Prevalence and Concentration of Salmonella and Filth in Spices | 4
FDA Draft Risk Profile | 55
The overall prevalence of Salmonella in the ASTA-member pathogen reduction treated spice lots sampled is statistically smaller than the value for imported spice shipments sampled at the point of entry to the United States during FY2007-FY2009. The difference is so large that it cannot be fully explained by a difference in sample size examined in the screening tests (25-375 g versus 750 g). Assuming that the methods of analysis used by ASTA members were validated and are comparable with the data from FDA and that the distribution of contamination within lots was not dramatically different than that found in the shipments examined by FDA, a plausible explanation for the difference observed is a difference in the sampled lots/shipments that had undergone a pathogen reduction treatment. ASTA members also tested spice lots for generic Escherichia coli post treatment during this time period, Table 4.11. As with Salmonella sampling and testing data, contributing members used a number of different methods of analysis for Escherichia coli. “Typically,” two methods with similar detection limits were employed (AOAC method 991.14 (< 10 CFU/g; as reported by Ruckert, 2010)4 and AOAC method 966.24 (< 3 MPN/g; as reported by Ruckert, 2010). We presume both methods examined 50 g of sample (AOAC method 966.23, referenced in methods 991.13 and 966.24). Method descriptions are available from AOAC International (2005a, 2005b, 2005c). The three lots that tested positive for Salmonella post-treatment were not tested for the presence of Escherichia coli. The data on the prevalence of generic Escherichia coli post-treatment in Table 4.11 provide insights into the effectiveness of bacterial reduction treatments and post-treatment preventive controls. The predominance of black pepper lots in the data set (representing 30% of all lots sampled and 78% of lots testing positive) strongly influences the summary statistics and confounds other factors such as spice form (ground/whole) or the type of pathogen reduction treatment applied. The observations of positive Escherichia coli tests on spice lots after pathogen reduction treatment indicate that either the treatments were not totally effective or post-treatment preventive controls were ineffective in preventing contamination or growth of remaining Escherichia coli in the spice. Further research is needed to determine the cause(s) for these observations and whether the cause could have implications for contamination of spice lots with other pathogens. The sampling results in Table 4.11 also indicate that lots of ground black pepper sampled had a statistically larger prevalence of Escherichia coli when compared with raw/whole black pepper. This differs from the result found for Salmonella prevalence among sampled shipments of black pepper offered for entry to the United States (Table 4.4). These same data are reflected in the summary data for all raw/whole spices and ground spices in Table 4.11. Additional data are needed to determine the reason for the difference.
4 Ruckert (2010) reported AOAC method 991.1 but it is likely the method was 999.14, which is the PetrifilmTM Escherichia coli /Coliform Count PlateTM method.

Prevalence and Concentration of Salmonella and Filth in Spices | 4
FDA Draft Risk Profile | 56
Table 4.11. Frequency and prevalence of generic Escherichia coli contamination in spice lots in some ASTA member companies to which a pathogen reduction treatment had been applied, August 1, 2007-July 31, 2009
Spice N # Positivea Escherichia coli Lot Prevalence
(%)a
95% Confidence Intervalb
All Spicesb 25604 213 0.83 0.72-0.95 Spices subjected to different processes
Raw/Whole spicesc 11119 30 0.27 0.18-0.39 Ground Spicesc 9291 170 1.83 1.57-2.12 Whole Black Pepperc 3742 18 0.48 0.28-0.76 Ground Black Pepperc 3966 138 3.48 2.93-4.10 Spice treated with Ethylene Oxide 11601 4 0.03 0.01-0.09 Spice treated with Steam 12086 208 1.72 1.50-1.97 Spice treated with Irradiation 345 0 0.0 0.0-0.9 Spice treated with PPO 303 1 0.3 0.01-2 Spice treated with unspecified pathogen reduction processd 1270 0 0.0 0.0-0.0.2
a We presume both methods examined 50 g of sample (AOAC method 966.23, referenced in methods 991.13 and 966.24). b 95% exact confidence limit (Clopper and Pearson, 1934). b Test data for one lot was excluded because of ambiguity as to whether the lot had undergone a pathogen reduction treatment before testing. c Test data on lots for which raw/whole/ground status could not be determined were excluded in this analysis. d Test data on lots for which a unique pathogen reduction process was not specified were grouped into this category.
4.1.4.2 FREQUENCY OF REPORTABLE FOOD REGISTRY ENTRIES ASSOCIATED WITH SALMONELLA
–CONTAMINATED SPICES AND SEASONINGS.
The Reportable Food Registry was established by Section 1005 of the Food and Drug Administration Amendments Act of 2007 (Pub. L. 110-85), which amended the FD&C Act by creating a new section 417 of the FD&C Act, Reportable Food Registry [21 U.S.C. 350f.] (U.S.C. 2007) The FDA Reportable Food Registry tracks patterns of adulteration of food in the United States by requiring industry (responsible parties) (FDA, 2010b) to submit reportable food (FDA, 2010c) reports when “there is reasonable probability that the use of, or exposure to, such article of food will cause serious adverse health consequences or death to humans or animals” (FDA, 2010c) and accepting voluntary reports from federal, state and local public health officials. More details about the program are provided in Section 8.1.3.4. Within the “Spices and Seasonings” category, described in the RFR Commodity Definitions document (FDA, 2012e), Salmonella contamination led all other hazards reported in the first three years of the program. This category includes spices identified at 21 CFR 182.10 (FDA 2013f), and also lists examples of products such as whole and ground spices, rooibos, sesame seeds, poppy seeds, caraway, anise, fenugreek seeds, meat coatings and rubs, seafood seasonings, dried herbs, and dried ginger (FDA, 2012e.) The number of primary entries, or the initial reports submitted by industry (responsible party) (FDA, 2010b) about a reportable food (FDA, 2010c) to FDA, reported for Salmonella in “Spices and Seasonings” was 16, 23, and 5 for years 1 (September 8-2009-September 7, 2010), 2 (September 8, 2010 – September 7, 2011), and 3 (September 8, 2011 – September 7, 2012), respectively. The frequency of primary entries for Salmonella in “Spices and Seasonings” was the largest among all 28 food categories in Year 1, second largest in Year 2 and tied for fourth largest (with two other RFR food commodities) in Year 3. However, it is difficult to interpret frequency values and relative rankings without knowledge of the total number of products/lots tested of each food commodity type.

Prevalence and Concentration of Salmonella and Filth in Spices | 4
FDA Draft Risk Profile | 57
4.1.5 RETAIL/END USER
We were unable to identify any reports characterizing Salmonella prevalence or concentration in spices at retail (food service, grocery store, restaurants, or in the home) in the United States. Information from the FDA targeted sampling assignment in 2010 established that shipments of imported spice offered for entry to the United States and packaged for retail may be contaminated and may comprise a significant percentage of the contaminated shipments (~ 20% for imported capsicum and sesame seed shipments sampled during the Aug-Dec 2010 study period; Van Doren et al., 2013c). Surveillance studies at retail have been conducted in a number of different countries, Tables 4.1 and 4.2. Observed prevalence values ranged from 0% (with non-zero upper limits) to 10% with varying confidence limits listed in Table 4.1. Salmonella has been found in a wide variety of spices and spice blends at retail (listed in Table 4.1). As mentioned previously, most of the studies examined small samples of spice, which limit the ability of the screening test to detect Salmonella at low concentrations. Determinations of Salmonella concentrations in spices found at retail are listed in Table 4.2, with most arising from outbreak investigations. The largest concentration of Salmonella reported in a spice/spice blend was 11 MPN/g (Lehmacher et al., 1995), sampled from the food manufacturer’s spice supply for the food implicated in the salmonellosis outbreak. A surveillance study from retail samples of black pepper and red pepper (capsicum) in Japan found mean concentrations of Salmonella of 0.086 MPN/g (86 MPN per 1000 g; Hara-Kudo et al., 2006; see Table 4.2 for details of calculation). Another surveillance study in the United Kingdom reported a range of Salmonella concentrations in sesame seeds and mixtures of seeds of <0.1-0.2 MPN/g (<10-20 MPN per 100 g; Willis et al., 2009).
4.1.6 FREQUENCY OF FOOD RECALLS IN THE UNITED STATES ASSOCIATED WITH SALMONELLA–CONTAMINATED SPICES
Recalls of food products can provide insights into the prevalence of contamination in foods at retail but can also involve spice/spiced-foods collected at other stages of the farm-to-table continuum, e.g., during spice processing or food manufacturing. In the United States, recalls are typically initiated when analysis has identified that a food does not meet regulatory requirements, e.g., the product is contaminated or is mislabeled, or when a spice/food has been linked to human illness, such as an outbreak. Class I recalls involve “a situation in which there is a reasonable probability that the use of or exposure to a violative product will cause serious adverse health consequences or death” whereas Class 2 recalls involve “a situation in which use of or exposure to a violative product may cause temporary or medically reversible adverse health consequences or where the probability of serious adverse health consequences is remote” (FDA, 2013c). FDA further distinguishes recall events as either primary or secondary. Primary recall events are recalls initiated by the firm in which the triggering violation was found or that caused the violation whereas secondary recalls arise from firms that are recipients of the violative products for use as an ingredient in a final product. From 1969-2003, FDA identified 20 primary recalls of spices, all of which were because of Salmonella contamination (Vij et al., 2006). The one other recall noted in the report, associated with Listeria monocytogenes in bay leaves, was later determined to be a recall for fresh bay leaves, rather than dried bay leaves (Hogan, 2011). Most of the recalls (15/20) took place in the final four years of the study, 2001-2003. The large increase in recalls associated with Salmonella-contaminated spices in the latter four years of the study was attributed primarily to an increase in surveillance of Florida spice companies following a contamination finding in 2001 (Vij et al., 2006). None of the recalls were linked to outbreaks, despite the fact that some of the spice recalled had been marketed for some period of time (1-18 months; Vij et al., 2006).
Prevalence and Concentration of Salmonella and Filth in Spices | 4
FDA Draft Risk Profile | 58
More recently, FDA has reviewed primary recall events associated with contaminated spices during the two year period January 1, 2008-December 31, 2009 (that were classified by FDA by March 23, 2010). Eight primary recall events involving one hundred and sixteen different products were initiated because of the presence/potential presence of Salmonella (Ma, 2013). The eight spice-associated recalls represented 2% of all Class I and II primary recall events and 26% of the Class I and II primary recall events associated with Salmonella contamination during that time period (Ma, 2013). Products recalled in one spice-associated event were also implicated in or related to the Salmonella Rissen outbreak (described in Chapter 2) attributed to consumption of contaminated white pepper (Ma, 2013). Root causes for the spice recalls were determined by a panel of seven FDA scientists from an analysis of the data and information provided by industry and FDA. Lack of supplier control was identified as a contributing factor in each of the eight primary recall events associated with Salmonella contamination of spices. In addition, insufficient/inadequate sanitation controls, environmental monitoring and training were also identified as root causes for the recalls associated with the white pepper outbreak (Ma, 2013). The scope of spice recalls is not easily captured by the number of events or products recalled. For example, the single recall event in the United States involving ready-to-eat salami products related to the Salmonella Montevideo/Senftenberg outbreak associated with contaminated black and red pepper resulted in 234,686 pounds of salami products being recovered from the marketplace (USDA/FSIS, 2010). In the Salmonella Wandsworth and Typhimurium outbreak associated with a contaminated broccoli powder ingredient in a snack puff food, recalls focused on trying to capture some of the ~1.3 million bags of the snack food that had been distributed in the United States and Canada (Hogan, 2010).
4.1.7 INTERNATIONAL REPORTS OF FOOD SAFETY HAZARDS ASSOCIATED WITH SALMONELLA–CONTAMINATED SPICES - RASFF
The European Commission Rapid Alert System for Food and Feed (RASFF) notifies member states of the “existence of a serious direct or indirect risk to human health deriving from food or feed, this information is immediately notified to the Commission under the RASFF” (EC/DG SANCO, 2012a). During the years 2001-2011, 44.8% of RASFF notifications on selected biological hazards (including Salmonella, Escherichia coli, Bacillus spp., Campylobacter spp., Listeria monocytogenes, Shigella spp., Staphylococcus aureus, Clostridium botulinum, Hepatitis A, norovirus, and Caliciviruses) in food of non-animal origin were from the category “Herbs and Spices.” Eighty percent of the “Herbs and Spices” RASFF notifications during this time period were associated with Salmonella (Altieri and Robinson, 2013; EC/DG SANCO, 2012b). Products in the “Herbs and Spices” category may include dry or fresh products.
4.2 FILTH
Methods of analysis used to determine filth adulteration of spice vary with filth element and spice type and form (e.g., ground or whole). All methods of analysis used by FDA are described in the Macroanalytical Procedures Handbook (FDA, 1998a). To determine whether the concentration of filth is less than the DAL (for natural or unavoidable defects in foods), FDA typically examines six spice subsamples taken from different portions of the spice shipment/lot. For example, the DALs for ground black pepper include specifications for insect fragment parts (≥475 insect fragments per 50-g spice) and rodent hairs (≥2 rodent hairs per 50-g spice). To determine whether a shipment of ground black pepper is adulterated with filth, FDA collects six 50-g samples and examines each subsample for insect fragment and rodent hairs. The shipment would be adulterated if the average concentration of either of the filth elements was not smaller than the DAL.

Prevalence and Concentration of Salmonella and Filth in Spices | 4
FDA Draft Risk Profile | 59
4.2.1. FILTH ADULTERATION PREVALENCE OF SPICE: FROM FARM TO TABLE OVERVIEW
Little experimental data have been reported on the prevalence or concentration of filth in spices throughout the farm-to-table continuum. FDA regularly samples imported foods including spices, for filth and these data were analyzed to provide a measure of the extent of filth contamination of imported spices at the point of import.
4.2.2. PRIMARY PRODUCTION
We were unable to identify any reports characterizing filth contamination in/on spice source plants pre-harvest, filth adulteration of spices, or concentrations of filth elements in spices at primary production sites. Because spices are derived from parts of plants and are often dried in open air environments, the presence of twigs, dirt and field insect parts are not unexpected (ASTA, 2011). These types of filth are termed “natural or unavoidable defects” by FDA and are acceptable when found in spices at concentrations below the DALs.
4.2.3. DISTRIBUTION AND STORAGE
Surveillance data on the prevalence of filth adulteration of spices during distribution and storage is limited to evaluations of these quantities at the point of import; we were not able to identify any surveillance studies of the prevalence of filth adulteration of spice located in storage facilities or at other points of the distribution chain. However, inspections of spice processing/packing facilities and food manufacturing facilities provide some information about the potential for adulteration of spice/food in the storage areas of the facilities. Inspections are discussed in Section 8.1.3.1. 4.2.3.1 FILTH ADULTERATION OF SHIPMENTS OF IMPORTED SPICE OFFERED FOR ENTRY TO THE
UNITED STATES
Data reported in this section are derived from two studies of FDA sampling data (1) review of results from the annual sampling program for the years FY2007-FY2009 and (2) review of sampling results from a targeted sampling assignment in 2010 (August-December) that focused on examining imported shipments of capsicum and sesame seed offered for entry to the United States for potential filth adulteration. Selection of shipments of imported spice/other food for examination under FDA’s annual field work plan is based on a number of factors including the inherent risk of the product, general surveillance activities described in the FDA work plan, FDA work performance goals and/or congressional work performance goals. All data examined in the FY2007-FY2009 study presented below were drawn from “surveillance sampling activities”, as described above, as opposed to compliance activities. All shipments of imported capsicum or sesame seed were eligible for sampling for the 2010 targeted study. A total of 299 shipments of capsicums and 233 shipments of sesame seeds were sampled at the point of import into the United States between August and December 2010. The shipments sampled constituted approximately 10 or 20 percent of all shipments of imported capsicum or imported sesame seed shipments, respectively, offered for entry to the United States.

Prevalence and Concentration of Salmonella and Filth in Spices | 4
FDA Draft Risk Profile | 60
Observed filth adulteration in shipments of imported spice offered for entry to the United States Summary results for prevalence of filth adulteration (defined in Section 3.2) in imported shipments of spices offered for entry to the United States during FY2007-FY2009 are presented in Table 4.12. The overall prevalence for filth adulteration of imported spice shipments during that time period was 12% (95% CI 10-15%). This value is 1.8 times (RR 95% CI 1.4-2.2) the value found for all other shipments of imported FDA-regulated foods sampled during this time period. Table 4.12. Prevalence of filth adulteration in shipments of imported spice or other FDA-regulated foods offered for entry to the United States, FY2007-FY2009
Spice/Food # Positive N Filth Shipment Prevalence (%)
95% Confidence Intervala
All Imported Spicesb 82 665 12 9.9-15
All other Imported FDA-regulated Foodsb 585 8350 7.00 6.47-7.57
Spices Subject to different processesc
Ground/cracked Spice 28 257 11 7.4-15
Whole Spice 24 165 15 9.5-21
Specific Spices
Capsicumd 21 115 18 12-27
Pepper, Black 1 54 2 0-10
Sesame Seed 7 71 10 4-19
Spices/Spices and Seasonings, NECe 28 181 15 10-22
All other spices 25 244 10 6.7-15 a 95% exact confidence limit (Clopper and Pearson, 1934). b All shipments of imported FDA-regulated spices or other imported foods that were sampled during the study period.
c Categorizations derived from product code and description. When description was insufficient to categorize, the sample was not included. Note that analytical methods used to determine filth in ground/cracked spices differs from those used to determine filth in whole spices. See text for details.
d Capsicum includes paprika as well as hot and other sweet dried capsicum peppers. e Shipments of spices “not elsewhere classified” (NEC) in the product code are assigned to “Spices, NEC”, “Spices and Seasonings, NEC”, or
“Mixed Spices and Seasonings, NEC.” Our data indicate that the prevalence rates for imported shipments of ground/cracked spice do not differ statistically from that of whole spice (p>0.05). When comparing filth adulteration prevalence values for shipments of different types of spice, we find that the prevalence for shipments of imported black pepper was smaller than that for shipments of imported capsicum, “spices/spices and seasonings, NEC”, or the category “all other spices” (Marascuilo procedure) among those sampled during FY2007-FY2009. Results from the 2010 sampling assignment targeting imported shipments of sesame seeds and capsicums found essentially the same filth adulteration prevalence for capsicum (18% 95% CI 14-24%) but a much smaller filth adulteration prevalence for shipments of sesame seed (0.5%, 95% CI 0.0-2.5%) than was observed for the period FY2007-FY2009. More data are needed to determine whether the smaller prevalence value reflects a sustained reduction in the prevalence of filth in imported sesame seed shipments. The types of filth adulteration found in sampled shipments of imported spices offered for import during the three year study period are presented in Table 3.4. The most prevalent types of filth elements were insect fragments, whole/equivalent insects, and animal hair. As mentioned in Chapter 3, almost all of the insects found in these spice samples are stored product pests with some test portions analyzed containing four or more species of pests in a single test portion. The presence of the specific insects found indicates poor handling, storage, or cleaning of the spices. One of the species found, Monomorium pharaonis (Pharaoh ant),

Prevalence and Concentration of Salmonella and Filth in Spices | 4
FDA Draft Risk Profile | 61
has been identified as a vector of food borne pathogens (Olsen et al., 2001). Another, Acarus siro (grain mite), has been associated with allergic reactions in people handling products containing this mite (Olsen, 1998b). A review of the FDA sampling database for imported spice shipments offered for U.S. entry FY2007-FY2009 showed that hair was detected in 253 (38% of sampled) shipments of imported spice (Table 4.13), although not all of these shipments were determined to be adulterated by filth. Of the hair found, 38% was identified to be from rodents. As discussed in Chapter 3, the presence of rodent hair without a hair root in spices generally is an indication that the spice had been contaminated with rodent feces. All hairs found in food are indicative of insanitary conditions and therefore failures in the application of Good Agricultural Practices (GAPs) and Table 4.13. Hairs found in shipments of imported spice offered for entry to the United States, FY2007-FY2009
FY 07-09 Hair Summary # Test Portions # Shipments
Human hair 47 35 Bat 1 1 Cat 32 19 Cow 1 1 Dog 1 1 Mammalian 23 11 Mouse/Rat 244 85 Other 19 10 Rabbit 3 3 Rat 1 1 Rodent 15 11 Non-striated 13 7 Sheep 1 1 Striated 37 18 Unknown 129 49 All Hairs 567 253 Current Good Manufacturing Practices (CGMPs). For example, human hair in spice could arise when workers handling the spice fail to use hair nets while cat/dog hair could arise if the spice processing/packing/storing facility employs these animals for rodent control. In addition, direct evidence of animal fecal and/or insect fecal contamination was found in a small number of the samples. Foreign substances found in spices ranged from twigs and sticks to staples, stones, and various fibers (Table 3.4). Most of these materials can be classified as hard and/or sharp objects; e.g. sticks, stones, staples; which are physical hazards in foods (Olsen, 1998a) and are classified as action Category 1 analytes (indicators of a potential food safety hazard) according to the 1999 revised filth strategy, and violate section 402(a)(1) of the FD&C Act. Others, such as fibers or rubber bands, are action category 2 (detectable and objectionable to the consumer), potentially violating section 402(a)(4) of the FD&C Act.
4.2.4. SECONDARY PROCESSING AND MULTI-COMPONENT FOOD MANUFACTURING
We were unable to identify any reports characterizing the prevalence or concentrations of filth adulteration in spice found in processing, packing or food manufacturing facilities. Spice manufacturers regularly apply physical cleaning techniques to remove filth elements from raw spice during secondary processing. However, inspections of spice processing/packing facilities and food manufacturing facilities provide information about

Prevalence and Concentration of Salmonella and Filth in Spices | 4
FDA Draft Risk Profile | 62
the facility environment and the potential for adulteration of the spice/food within that environment. Inspections are discussed in Section 8.1.3.1. Review of FDA inspection data for a group of 59 domestic spice firms inspected as part of a special assignment to support this risk profile revealed that the presence of pests was among the most common findings reported.
4.2.5. RETAIL/END USER
We were unable to identify any reports characterizing the prevalence or concentrations of filth in spice at retail other than the surveys FDA conducted in the 1980s (Gecan et al., 1983; Gecan et al., 1986) which were used to set the DALs for the spices listed in Table 3.3. FDA generally set DALs to values that would reflect significant deviation from the best practices of industry and agriculture at that time.
4.3 PREVALENCE OF BOTH SALMONELLA AND FILTH ADULTERATION OF SPICES
In 1960, Kenton Harris wrote in Food and Drug Technical Bulletin No. 1:
“Often the line of demarcation between a harmful and a filthy food is exceedingly narrow. Many of the sources of filth in food products are potential sources of disease organisms. It is well known that rodents are vectors of several diseases transmissible to man, including typhus, plague, infectious jaundice, and Salmonella infection. Flies and roaches may harbor pathogenic bacteria and transmit infection to foods. Rodents, flies, and other insects closely associated with filth and insanitary conditions are capable of mechanically transferring pathogenic and spoilage organisms from such filth directly to food products. Therefore, certain forms of filth contamination of food carry implications of danger to health although the demonstration of specific agents of disease may be difficult or impossible”
By 2001, the body of scientific evidence demonstrating a relationship between some types of filth and specific agents of disease had grown significantly, as described in detail in FDA’s 2001 review of the scientific literature (Olsen et al., 2001). Insects, rodents and other animals possessing the following five attributes: “synanthropy, endophily, communicative behavior, attraction to filth and to human food, and harborage of pathogens in the natural (wild) populations” are recognized as having the potential to spread pathogens to human food (Olsen et al., 2001 and references therein). As a consequence, it is possible that the presence of filth and pathogens in spices could be correlated, at least at some points along the farm-to-table continuum. In 1989 FDA performed a limited study comparing the microflora recovered from samples of spice and fecal pellets found in spice from shipments of spice offered for entry to the United States and reported no correlation (Satchell et al., 1989). Interpretation of these data with regard to the correlation between filth and spice contamination with pathogens is limited because the results were based on a very small data set. In the 1989 study, 1-4 fecal pellets from each of nine shipments were examined for microflora and compared with microbiological test results on two 375 g samples from each shipment. Escherichia coli (generic) was found in two pellets but neither Salmonella nor Escherichia coli was found in spice samples from the nine shipments (Satchell et al., 1989). In order to address whether adulteration of spice by filth and Salmonella are correlated at the point of entry to the United States, we analyzed FDA sampling data for shipments of imported spices and food offered for entry during the years FY2000-FY2009 (except FY2002 for which there were incomplete data). A total of 883 shipments of imported spice were examined for both Salmonella and filth during this time period. Results of FDA tests are presented in Table 4.14. Evaluation of the Fisher exact p-value indicates that the correlation between Salmonella and filth contamination of imported spices at the point of import is not significant (p>0.05) for the sampled shipments examined. In contrast, correlation between Salmonella and filth

Prevalence and Concentration of Salmonella and Filth in Spices | 4
FDA Draft Risk Profile | 63
contamination in other imported FDA-regulated food shipments examined for both contaminants during this same time period (4557 shipments) was found to be highly significant (p<0.001), as shown in Table 4.15. Table 4.14. Examination of relationship between presence of filth and Salmonella adulteration of shipments of imported spice offered for entry, FY2000-FY2009 (except) FY2002
Filth # Positive for
Salmonella # Negative for
Salmonella Fisher Exact
p-Valuea # Positive for
Filth 13 100 na
# Negative for Filth 59 711 na
Fisher Exact p-Valuea na na 0.195
a Fisher exact p-value (SAS, 2012). “na” indicates measure is not applicable for the cell. Table 4.15. Examination of relationship between presence of filth and Salmonella adulteration of shipments of imported foods offered for entry, FY2000-FY2009 (except) FY2002
Filth # Positive for
Salmonella # Negative for
Salmonella Fisher Exact
p-Valuea # Positive for
Filth 25 234 na
# Negative for Filth 151 4147 na
Fisher Exact p-Valuea na na <0.001
a Fisher exact p-value (SAS, 2012). “na” indicates measure is not applicable for the cell. The absence of a correlation for shipments of imported spices offered for entry to the United States may result from a lack of statistical power (data for a small number of shipments are compared) or may signify that spices or the spice supply chain practices before import are characteristically different (on average) with regard to contamination with Salmonella and filth from those of other imported FDA-regulated products (among those sampled). It is common for spice producers and/or processors to physically clean raw spices to remove visible filth; this often takes place at primary production, while additional cleaning can take place during secondary processing (see Chapter 6). Pathogen reduction treatments are also commonly applied to some spices. Such treatments are performed in the secondary processing phase of the spice farm-to-table continuum, which may take place before or after import. The combination of these practices may remove any correlation between the presence of Salmonella and filth in shipments of imported spice at the point of entry to the United States, if any existed initially. More research is needed to understand how the prevalence of filth and Salmonella adulteration of spices changes along the supply chain from farm to the consumer table.

FDA Draft Risk Profile | 64
5. CHARACTERIZATION OF CONTAMINANTS
The goal of this section is to highlight the characteristics of Salmonella and filth adulteration that impact their potential risk to public health when found in spices. The sections below are not meant to reproduce or comprehensively review the vast literature on Salmonella or filth but rather provide general/representative references for key statements. Data on the survival of Salmonella in spices and the potential for growth of Salmonella in wet spices were very limited. In order to begin to address this data gap, FDA scientists undertook a series of experiments to evaluate these properties in ground black pepper. A full description of the experiments and results can be found in Keller et al. (2013). In sections 5.1.2 and 5.1.3, we present key results and conclusions and compare our results with related reports in the literature.
5.1 SALMONELLA
5.1.1 GENERAL CHARACTERISTICS OF SALMONELLA
There are two species of Salmonella: S. enterica and S. bongori (WHO, 2007). Salmonella enterica is further divided into six subspecies, each with many serovars: enterica (I), salamae (II), arizonae (IIIa), diarizonae (IIIb), houtenae (IV), and indica (VI) (WHO, 2007). As shown in Table 3.2, all of the Salmonella strains isolated from spices in the United States have been Salmonella enterica and have included strains from five of the six S. enterica subspecies. While the primary habitat for Salmonella is considered to be the intestinal tract of vertebrates such as birds, animals, rodents, reptiles, and humans (FDA, 2012d) most variants can survive for extended periods in non-host environments. For example, it has been shown that Salmonella can survive in soil (Garcia et al., 2010; Bech et al., 2010), water (Ceballos et al., 2003; Skariyachan et al., 2012; Micallef et al., 2012), plants (Franz and van Bruggen, 2008; Barak et al., 2011; Gu et al., 2013), manure and soil amended with manure (Ongeng et al., 2011; Bech et al., 2010; Semenov et al., 2009; Islam et al., 2004; Garcia et al., 2010), on equipment/surfaces (Mattick et al., 2003; Castelijn et al., 2013), and in low moisture foods (Podolak et al., 2010; Ristori et al., 2007; Beuchat and Scouten, 2002; Komitopoulou and Penaloza, 2009; Lehmacher et al., 1995; Uesugi et al., 2006; Keller et al., 2013; FDA, 2012d). Indeed, a key characteristic of Salmonella related to spice contamination is its ability to resist dry, desiccation conditions for extended periods (Beuchat and Scouten, 2002; Hiramatsu et al., 2005; Du et al. 2010; Beuchat and Mann, 2010; Podolak et al., 2010; Kimber et al., 2012; Blessington et al., 2012). Salmonella has been found in and on insects, which can transport the bacteria from one location to another (Crumrine et al., 1971; Holt et al., 2007; Wang et al., 2011; Hoelzer et al., 2011; Pava-Ripoll et al., 2012). Beyond survival, most variants of Salmonella can grow in a variety of non-host environments, given sufficient water, nutrients, and other appropriate environmental conditions (Combase Consortium, 2012; Harris et al., 2003; Brandl, 2006; Danyluk et al., 2008; Franz and van Bruggen, 2008; Du et al., 2009a; Beuchat and Mann, 2010; Keller et al., 2013). This adaptability enables Salmonella to cycle between animal host and environment, thereby extending the lifetime of the bacteria/bacterial colony and “ensuring its passage to the next host” (Winfield and Groisman, 2003; Foster and Spector, 1995; Podolak et al., 2010). A direct consequence of Salmonella’s ability to survive in non-host environments is that it is widely dispersed in nature and that when Salmonella-contaminated material (animate or inanimate) comes in contact with the

Characterization of Contaminants | 5
FDA Draft Risk Profile | 65
spice source plant or spice before human consumption it may be a potential source of viable bacterial contamination.
5.1.2 ANTIMICROBIAL PROPERTIES OF SOME SPICES
Essential oils of some spices possess antimicrobial properties which can inhibit the growth of bacteria including Salmonella, Bacillus cereus, Staphylococcus aureus, and Escherichia coli under some conditions (Al-Delaimy and Ali, 1970; Farbood et al., 1976; Shelef et al., 1980; Shelef, 1983; Shelef, et al., 1984; Aktug and Karapinar, 1986; Karapinar and Aktug, 1987; Zaika, 1988; Billing and Sherman, 1998; Smith-Palmer et al., 1998; Arora and Kaur, 1999; Hammer et al., 1999; Dorman and Deans, 2000; Ceylan and Fung, 2004; Burt, 2004; Du et al., 2009a; Du et al., 2009b; Tajkarimi et al., 2010; Weerakkody et al., 2011). For example, Al-Delaimy and Ali (1970) reported that 1% v/v garlic extract inhibited growth of Escherichia coli and Salmonella Typhi while Smith-Palmer et al. (1998) reported that essential oils of bay, cinnamon, clove and thyme inhibited growth of Salmonella Enteritidis at a concentration of 0.075%. Many studies have demonstrated that the strength of the inhibitory effect depends on the essential oil, its concentration, and the pathogen (including strain), among other factors (Al-Delaimy and Ali, 1970; Farbood et al., 1976; Shelef et al., 1980; Shelef, 1983; Shelef et al., 1984; Aktug and Karapinar, 1986; Karapinar and Aktug, 1987; Zaika, 1988; Billing and Sherman, 1998; Smith-Palmer et al., 1998; Arora and Kaur, 1999; Hammer et al., 1999; Dorman and Deans, 2000; Ceylan and Fung, 2004; Burt, 2004; Tajkarimi et al., 2010; Weerakkody et al., 2011). For example, Shelef et al. (1980) reported that Salmonella Typhimurium needed 10 times more sage for inhibition in broth than B. cereus. Karapinar and Aktug (1987) reported that eugenol, which is the key antimicrobial compound in cloves, had a smaller minimum inhibitory concentration for Salmonella Typhimurium than thymol or anethole, essential oils in thyme and anise seed, respectively. Spices containing essential oils with strong inhibitory effects towards Salmonella may limit the growth of the pathogen in some foods if the concentration of the spice/essential oil is sufficient and other conditions are appropriate. What is not known is the extent to which the presence of antimicrobial essential oils in some spices impact survivability of Salmonella in low moisture foods in general or the spice itself. The relatively large Salmonella prevalence found by FDA for shipments of oregano and allspice offered for import to the United States during FY2007-FY2009 demonstrates that the antimicrobial activity against Salmonella is not sufficient to eliminate Salmonella contamination from shipments of these types of spices (as discussed in Section 4.1.3.1).
5.1.3 SURVIVABILITY IN SPICES
It is well established that salmonellae survive long periods in low moisture foods and dry environments (Beuchat and Scouten, 2002; Hiramatsu et al., 2005; Du et al. 2010; Beuchat and Mann, 2010; Podolak et al., 2010; Kimber et al., 2012; Blessington et al., 2012). Lehmacher et al. (1995), analyzing samples of paprika, demonstrated that Salmonella can survive for at least 8 months in samples of that spice but the specific conditions under which the spice was stored and how these impacted survival were not recorded. FDA undertook a series of experiments to characterize how survival of Salmonella in a spice depends on storage conditions (Keller et al., 2013). Samples of ground black pepper were inoculated with a cocktail of Salmonella strains, held at 35 or 25°C, and stored under either high relative humidity (RH, 97%) or under low RH (typically ≤ 40%). Results for these experiments are presented in Figures 5.1-5.4.

Characterization of Contaminants | 5
FDA Draft Risk Profile | 66
Figure 5.1. Survival of Salmonella at 25°C and high (97%) RH. Mean and standard deviation of Salmonella population (▲); black pepper water aw, (∆). Error bars represent the standard deviation calculated from three replicate samples; absence of detection was assigned a value of zero. Limit of detection (LOD) for the analysis was 1.69 log CFU.
Figure 5.3. Survival of Salmonella at 25°C and ambient (≤40) RH. Mean and standard deviation of Salmonella population (▲); black pepper water aw, (∆). Error bars represent the standard deviation calculated from three replicate samples; absence of detection was assigned a value of zero. LOD for the analysis was 1.69 log CFU.
Figure 5.2. Survival of Salmonella at 35°C and high (97%) RH. Mean and standard deviation of Salmonella population (▲); black pepper water aw, (∆). Error bars represent the standard deviation calculated from three replicate samples; absence of detection was assigned a value of zero. LOD for the analysis was 1.69 log CFU.
Figure 5.4. Survival of Salmonella at 35°C and ambient (≤40) RH. Mean and standard deviation of Salmonella population (▲); black pepper water aw, (∆). Error bars represent the standard deviation calculated from three replicate samples; absence of detection was assigned a value of zero. LOD for the analysis was 1.69 log CFU.
Under high humidity conditions, a rapid decline in the population of Salmonella was observed (Figures 5.1 and 5.2) and was faster at 35oC than at 25oC. At 35oC, the surviving Salmonella population fell below detection limits (1.69 log CFU/g) after 60 days, while at 25oC, Salmonella decreased below this point after 100 days of
0.00
1.00
2.00
3.00
4.00
5.00
6.00
7.00
8.00
9.00
0 20 40 60 80 100 120
Time (day)
log
cfu/
g
0
0.1
0.2
0.3
0.4
0.5
0.6
0.7
0.8
0.9
1
water activity
0.00
1.00
2.00
3.00
4.00
5.00
6.00
7.00
8.00
9.00
0 50 100 150 200 250 300 350 400
Time (day)
log(
cfu/
g)
0.0
0.1
0.2
0.3
0.4
0.5
0.6
0.7
0.8
0.9
1.0
water activity
0.00
1.00
2.00
3.00
4.00
5.00
6.00
7.00
8.00
9.00
0 10 20 30 40 50 60 70 80
Time (day)
Log(
cfu/
g)
0.0
0.1
0.2
0.3
0.4
0.5
0.6
0.7
0.8
0.9
1.0
water activity
0.00
1.00
2.00
3.00
4.00
5.00
6.00
7.00
8.00
9.00
0 50 100 150 200 250 300
Time (day)
Log(
cfu/
g)
0.0
0.1
0.2
0.3
0.4
0.5
0.6
0.7
0.8
0.9
1.0
water activity

Characterization of Contaminants | 5
FDA Draft Risk Profile | 67
storage. In contrast, at low RH, population reduction rates were much smaller, with Salmonella survival exceeding 280 days at 35oC and 365 days at 25oC (the length of the experiments), as illustrated in Figures 5.3 and 5.4. Figures 5.1-5.4 also illustrate how the humidity of the environment affects the water activity (aw) of the exposed black pepper and suggests that the Salmonella population reduction rate is related to the water activity of the black pepper. Beuchat and Scouten (2002), investigating Salmonella population reduction rates in alfalfa seeds, also found that Salmonella population reduction rates decreased with decreasing water activity or temperature. Ristori et al. (2007), examining Salmonella Rubislaw in black pepper, also found Salmonella population reduction rates increased with storage temperature but did not find statistically different population reduction rates for aw in the range 0.663-0.937. The absence of a significant aw dependence for the population reduction rate in their experiments may be related to the short time scale of the experiment (15 days) and the limited aw range examined (Ristori et al., 2007). Similarly slow population reduction rates have been found for Salmonella on almonds, pistachios, or walnut kernels held at 23-24°C, after initial drying following addition of a wet inoculum (Kimber et al., 2012; Blessington et al., 2012). Although the humidity of the storage environment may vary from location to location and in some locations, may not be well controlled, it may not often reach the high levels examined in the FDA study that resulted in reduced survival of Salmonella. Storage conditions meeting spice industry standards (ASTA, 2011; ESA, 2011) will result in spice with relatively low water activity, a condition that can result in long-term survival of Salmonella, if present. The mechanism by which Salmonella is able to survive desiccation so efficiently is an active area of research. Some studies have pointed to that Salmonella morphological changes such as the formation of filamentous cells and multicellular morphology (rdar) during desiccation are critical for its survival (White et al., 2008; Mattick et al., 2000), while other studies have identified that the o-antigen capsule determined by extracellular polysaccharides is critical for Salmonella persistence in dry environments (Garmi et al., 2008; Gibson et al., 2006; Finn et al., 2012). Transcription analysis at genomic level suggests the involvement of fatty acids metabolism and osmotic compatible solutes in Salmonella desiccation stress response (Li et al., 2012). The relative importance of these and other factors in facilitating the survival of Salmonella in low moisture foods has yet to be determined. Resistance to heat, irradiation, and disinfectants. Salmonellae are desiccated/dehydrated when in low moisture foods such as spices and desiccation/ dehydration of some strains of Salmonella has been shown to increase the organism’s tolerance to heat, UV irradiation, and disinfectants (Doyle and Mazzotta, 2000; Hiramatsu et al., 2005; Podolak et al., 2010; Gruzdev et al., 2011; Keller et al., 2012; Harris et al., 2012) as compared with the non-desiccated organism. For example, Gruzdev et al. (2011) found that application of 100oC for 1 hour to desiccated Salmonella enterica serovar Typhimurium was insufficient to eliminate all viable bacteria in the sample. Other studies have shown that heat and irradiation tolerance are related to water activity of the food/sample (Barrile and Cone, 1970; Goepfert et al., 1970; Jeong et al., 2012). The extent of tolerance can also be dependent on serotype and food matrix (Gruzdev et al., 2011; Nascimento et al., 2012) and decimal reductions during thermal pathogen reduction treatments can exhibit non-linear behavior where the rate of decline decreases with increasing time (Beuchat and Mann, 2012; Abd et al., 2012; Blessington et al., 2012). Gruzdev et al. (2011) found that rehydration of previously desiccated Salmonella may not fully restore susceptibility to heat. These observations indicate that application of pathogen reduction and disinfection methods developed for foods other than spices may not be as effective as anticipated when applied to spices.
5.1.4 POTENTIAL FOR GROWTH IN MOISTENED SPICES AND SPICE-CONTAINING FOODS
The threshold water activity for growth of Salmonella is reported to be 0.94 (ICMSF, 1996) which is much higher than the water activity recommended for storage of spices by the spice industry (≤0.75, ASTA, 2011; 0.65, ESA, 2011). Therefore, Salmonella will not grow in spice when maintained at recommended water

Characterization of Contaminants | 5
FDA Draft Risk Profile | 68
activities. However, we wanted to determine whether Salmonella could grow in spice when water is added, i.e., are there sufficient nutrients in spice to support growth when wet that could potentially lead to increased concentrations of Salmonella in spice or create Salmonella niches in the spice supply chain environment that could facilitate cross-contamination? Whole black pepper could be exposed to moisture during the drying process, if not protected from rain, or during storage, if the packing material is not waterproof. Ground black pepper, either in the production line or in the spice /food manufacturing environment, could become wet during processing/packing as a result of wet cleaning or poor facility design/maintenance. Ground black pepper could also become wet during storage if the material in which it is packaged or stored is not waterproof and the environment in which it is stored is not designed and maintained properly (e.g., holes in the roof, condensation, or high humidity). In addition, ground black pepper could become wet during food preparation in a home or restaurant, e.g., when exposed to steam or humid air. To minimize the occurrence of these possibilities, Codex Alimentarius (Codex) has developed guidance for spice production, processing and use (Codex Alimentarius, 1995), the U.S. has developed the Current Good Manufacturing Practices (FDA, 2012a) and the spice and food industries have developed guidance for processing and food manufacturing facilities handling low moisture foods (ASTA, 2011; ESA, 2011; GMA, 2009). FDA scientists designed experiments to determine whether Salmonella can grow in moist/wet black pepper at temperatures typical of spice processing, storage and use (excluding cooking) and if so, whether growth rates are comparable to those in optimized media (Keller et al., 2013). The water activity threshold for growth in ground black pepper at 35oC was determined to be 0.979 ± 0.003 (Keller et al., 2013) which is higher than the threshold (0.94) reported for Salmonella in other food products (ICMSF, 1996). The difference between the threshold for Salmonella growth in ground black pepper and the threshold reported in other foods may be related to the presence of antimicrobial compounds in ground black pepper but also could be related to other differences in the black pepper growth environment as compared with an optimized growth environment. Salmonella generation times in ground black pepper under permissive water activity conditions were short, similar to maximum growth rates recorded in optimal growth media (ICMSF, 1996). Therefore, growth of Salmonella could represent a substantial risk to the food industry should the pepper become wet, that is, when industry standards for spice water activity are exceeded. These experiments demonstrated that ground black pepper at water activities near the threshold for growth of Salmonella may not be noticeably wet, as shown in Figure 5.5. Small, local areas of high water activity may be able to develop if condensate or other small drops of water are allowed to contaminate stored black pepper or black pepper dust that may accumulate in the spice processing/packaging or food manufacturing environments. These local areas may also develop from the condensation of moisture from insect respiration (Williams et al., 2004). Such small localized areas may not be obvious during storage and manufacture but could result in a significant risk of Salmonella growth in contaminated black pepper products or in the creation of environmental niches. However, generation and lag times increased when the water activity of the ground black pepper was lowered below the optimal value (Keller et al., 2013). This means that in the case of an accidental addition of water to ground black pepper, growth may be limited if the time for evaporation is shorter than the lag time for growth initiation. Spice-containing foods can exceed the threshold water activity value for growth and provide nutrients and an environment that support growth (Combase Consortium, 2012). However, not all moist foods will support growth due to intrinsic characteristics of the food such as pH and salt content. For example, Fedoruk (2011) estimated the risk of salmonellosis from consumption of dairy-based snack food dips made from contaminated spice and found that the acidity of the food limited growth.

Characterization of Contaminants | 5
FDA Draft Risk Profile | 69
Figure 5.5. Appearance of ground black pepper at different water activities (aw).
5.1.5 CHARACTERISTICS OF THE NON-TYPHOIDAL SALMONELLOSIS
Salmonella Dose-Response While there is no dose-response model specifically derived from outbreak investigations or challenge studies of Salmonella in spices or low moisture foods, the WHO/FAO developed a dose-response model for Salmonella in 2002 based on 20 outbreaks associated with food (WHO/FAO, 2002). Figure 5.6 illustrates the WHO/FAO beta-Poisson model and the insert shows predictions for low dose, illustrating a nearly linear dose-response relationship predicted for doses up to ~20 CFU. Low dose exposures are expected from consumption of contaminated spices based on the concentrations of Salmonella reported in spices (Section 4.1.1 and Table 4.2) and the typical serving size for spice per eating occasion (Section 7.2.2). This beta-Poisson model predicts that a dose of approximately 4 CFU (95% CI 3-5 CFU) would infect 1% of the exposed population (ID1) while a dose of approximately 63 CFU (95% CI 44-90 CFU) would infect 10% of the exposed population (ID10). Although data used to develop the dose-response model did not include spices, the ID1 predicted by the WHO model is consistent with the rough estimate made by Lehmacher et al. (1995) of 4-45 MPN, based on data from the 1995 salmonellosis outbreak attributed to consumption of contaminated paprika in paprika-powdered potato chips. Low doses of Salmonella from consumption of contaminated spices would be anticipated from the concentration of Salmonella found in contaminated spices (Table 4.2) and the typical amounts of spice consumed in a single eating occasion (Section 7.2.2).

Characterization of Contaminants | 5
FDA Draft Risk Profile | 70
Figure 5.6. WHO/FAO dose-response model for Salmonella. Solid line is expected value; dashed lines bracket 95% confidence limits, derived from WHO/FAO, 2002. Inserted graph is an expansion of the main graph in the dose range 0-60 CFU. Teunis et al. (2010), analyzing an expanded data set from that used by WHO/FAO and using more complex modeling strategies that included a two-level dose-response model, predicts the ID1 for illness to be 0.395 CFU (95% CI: 0.01-89.7 CFU). The study examined whether the dose-response relationship differed by serotype or susceptibility (defined as less than 12 years of age or older than 65 years of age) and reported no statistically significant differences in models for different serotypes or susceptibility categories among those considered.5 Bollaerts et al. (2008), also using a two-level dose-response model, re-examined the dataset used by WHO and found differences in dose-response models for different Salmonella serotype-food matrix combinations. Spices were not among the foods in the data set but an outbreak involving one low moisture food (cheddar cheese) was included. The models developed by Bollaerts et al. (2008) were not able to separate the effects of serotype and food matrix. The dose-response models of Bollaerts et al. (2008) predict larger probabilities of illness for susceptible populations (>60 years of age) for certain ranges of dose. For the serotype-food matrices with the steepest dose-response relationships, susceptible individuals are predicted to have a greater probability of illness at low dose than non-susceptible individuals. For the serotype-food matrices with less steep dose-response relationships, differences in susceptible and non-susceptible populations are 5 Teunis et al. (2010) used his model to estimate the number of people exposed in the outbreak attributed to consumption of contaminated paprika-powdered potato chips. However, the estimated attack rate taken from Lehmacher et al. (1995) quoted in Teunis et al. (2010) was incorrect.

Characterization of Contaminants | 5
FDA Draft Risk Profile | 71
predicted for high doses (Bollaerts et al., 2008). For all other doses, susceptible and non-susceptible populations have similar responses. None of the three dose-response models address the severity of illness or health outcome and whether these differ with age. Primary Disease and Sequelae The onset of symptoms of salmonellosis, a gastrointestinal disease, typically occurs 12-72 hours after infection and typically lasts 4-7 days, although times outside the general ranges have been reported (see for example, that, 2003 (reporting on Guthrie, 1992)). Symptoms often include diarrhea, fever and abdominal pain (CDC, 2013b). Antibiotic resistant strains of Salmonella can cause complications in patients (Lynch and Tauxe, 2009). Death may occur when the infection spreads beyond the intestines to other parts of the body. Infants, elderly, and immuno-compromised individuals are most likely to have severe symptoms (CDC, 2013b). In addition to these factors, some data suggest that the severity of illness may also depend on serotype (Jones et al., 2008). Overall estimates of hospitalization and mortality rates among infected individuals are 2% and 0.03% , respectively, based primarily on 2000-2008 public health data (value includes correction for underreporting; Scallan et al., 2011) and are shown in Table 5.1. Table 5.1. Estimated percentage of salmonellosis cases associated with different health endpoints and typical duration of illness.
Health Endpoint Fraction of Casesa Typical Duration Gastroenteritis: unconfirmed 0.966 4-7 days Gastroenteritis: culture-confirmed 0.034 11 daysc Gastroenteritis: Hospitalization 0.019 16 daysc Mortality in general population 0.0003 n/a Reactive Arthritis b 0.5-≥7 yearsd
a Data from Scallan et al. (2011b) unless otherwise noted. Hospitalization and mortality fractions include the correction for underreporting. Sum of unconfirmed and culture-confirmed cases of gastroenteritis percentages is 1. Percentages for individuals who were hospitalized, died, or later acquired reactive arthritis are relative to the full set of salmonellosis cases. b Value not well established. See text for details. c Data from Kemmeren et al. (2006) based on data collected in the Netherlands; duration of culture-confirmed illness equated with illness associated with a visit to a medical doctor. d Data from Curry et al. (2010) for reactive arthritis regardless of etiology. See text for details. A breakdown of hospitalization and mortality rates by age from CDC’s FoodNet Surveillance Report for 2011 (CDC, 2012b) is illustrated in Figure 5.7. These data suggest that hospitalization rates generally increase with age, with largest rates for individuals who are ≥80 years of age. However, infants (<1 year of age) have an increased risk of hospitalization relative to older children. Fatality rates also increased with age for older adults beginning at ages >40 years old (CDC, 2012b). Reactive arthritis can develop several weeks after initial illness (Locht et al., 1993; Dworkin et al., 2001; Hannu et al., 2002; Townes et al., 2008) in some cases, however the incidence rate is not well established (Townes, 2010; Townes et al., 2008; Kemmeren et al., 2006). Curry et al. (2010), examining reactive arthritis cases among U.S. military personnel, found that reactive arthritis symptoms can last for years; 35.5% of cases (Reiter’s disease or post-dysenteric arthropathy) still had symptoms after two years and ~30% had symptoms after seven years. Inflammatory bowel disease (IBD) has been associated with salmonellosis (see for example, Helms et al., 2006; Gradel et al., 2009; Kemmeren et al., 2006) but there is disagreement in the literature as to whether a person’s relative risk for IBD is increased following infection with Salmonella (Jess et al., 2011; Mann and Saeed, 2012).

Characterization of Contaminants | 5
FDA Draft Risk Profile | 72
Figure 5.7. Age dependence of hospitalization and fatality rates for foodborne salmonellosis in the United States, 2010. Hospitalization rate (%) ( white bars) and Fatality Rate (%) ( black bars) as a function of age of the individual with Salmonella-caused illness. Data from FoodNet 2011 Surveillance Report (CDC, 2012b), based on 8273 total laboratory-confirmed salmonellosis infections.
5.2 FILTH
Filth can be broadly broken down into three categories, each of which has different health and regulatory impacts (Olsen et al., 2001). In the first category are adulterants that can be direct food safety hazards. This group would include hard and sharp objects that can cause physical injury to the consumer. This group also contains those insects that exhibit attributes for a contributing factor (synanthropy, endophily, communicative behavior, attraction to excrement and to human food, and ability to harbor pathogens in wild populations; Olsen et al., 2001), for the spread of food-borne pathogens when there is no effective control in place to eliminate or neutralize the hazard. For example house flies, Musca domestica, are attracted to filth and human food and readily move between them. They also travel between the outside and inside of homes and processing facilities and have a close association with people. Most importantly, they are vectors for human diseases and the disease organism can be found in the wild populations of the insect. Pava-Ripoll et al. (2012) found Salmonella spp. (6% of the flies tested), Cronobacter spp. (14%) and Listeria monocytogenes (3%) in wild populations of M. domestica. Rats and mice are attracted to excrement, to other pathogen reservoirs, and to human food. Wild populations harbor food-borne pathogens, especially disease causing strains of Escherichia coli, Salmonella, and Listeria. These diseases can be transmitted from rodent to rodent. Rodents have been implicated in at least nine documented outbreaks of salmonellosis in humans (Olsen et al., 2001). Rodents can also be vectors for plague, murine typhus, and Weil’s disease (Vazquez, 1977). Evidence of their presence in foods, e.g., rodent hairs and feces, is indicative of insanitary conditions, suggesting failures in the application of GAPs or CGMPs.

Characterization of Contaminants | 5
FDA Draft Risk Profile | 73
The second category includes those filth elements that are alive and/or are clearly detectable and objectionable to the consumer. This category would include live infestation of insects/mites in the food or adulteration with foreign matter associated with objectionable conditions or practices in production, storage, or distribution that are clearly visible to the consumer. The third category includes those filth elements that are natural or unavoidable filth and would include hair fragments, whole insects or insect fragments, mold filaments, etc. The same filth element could be classified in all three categories based on its size, life stage, life status (alive/dead), and whether the product has been subject to a microbial kill step (Olsen et al., 2001). FDA has analyzed spices that were adulterated by all three categories of filth elements at the same time.

Overview of Spice Farm-to-Table Continuum and Potential Sources of Contamination | 6
FDA Draft Risk Profile | 74
6. OVERVIEW OF SPICE FARM-TO-TABLE CONTINUUM AND POTENTIAL SOURCES OF PATHOGEN AND FILTH CONTAMINATION
An overview of the farm-to-finished product storage continuum for spices created by ASTA is shown in Figure 6.1. This comprehensive figure illustrates the basic processes involved in primary production and secondary processing of spices. Not all spice products pass through each of the processes, e.g., some spices are not subjected to a pathogen reduction treatment, some spices are not ground, and some spices are not transported by ship because they are grown domestically. ASTA has included in the figure some of the key preventive practices that may be used during these phases to support the food safety of spices such as Good Agricultural Practices (GAPs), Good Manufacturing Practices (GMPs), moisture control (of dried product), process validation, warehouse sanitation, container inspection, and a Hazard Analysis Critical Control Point system. The diagram also notes product cleanliness specifications such as the DALs and the ASTA Cleanliness Specifications.
Figure 6.1. Typical stages in spice farm-to-finished product continuum for spices including transport and processing options and control points. Figure developed by ASTA for “Clean, Safe Spices: Guidance from the American Spice Trade Association” ( Figure 1) published in 2011 by ASTA. Reprinted with permission.

Overview of Spice Farm-to-Table Continuum and Potential Sources of Contamination | 6
FDA Draft Risk Profile | 75
The supply chain from finished spice product-to-consumer can be relatively simple or very complicated, as illustrated by Figure 6.2. Spice manufacturers may sell/transfer their spice products wholesale to a seasoning manufacturer, food manufacturer, food wholesaler, institutional food service, or restaurant, each of which will further handle and possibly also process the spice. Spice manufacturers may also package their own spice for retail sale, selling directly to grocers, or retail food establishments where consumers may purchase them.
Figure 6.2. Possible pathways for spice from spice manufacturer to consumer.
6.1 PRIMARY PRODUCTION
Spices are a large, diverse group of plants, some of which have been domesticated, cultivated, and used since the times of the pharaohs to enhance the flavor of foods or as drugs. It is impossible to describe in this report the wide variety of agricultural practices involved for each of the spices. Instead, we provide a brief overview of spices, typical growing practices, and potential sources of pathogen or filth contamination during primary production. Spice and lifecycle diversity Any part of a particular plant can be used as a spice. Table A3 in Appendix A provides a list of over 80 different plants that are used as spices and the part of the plant used or sold in commerce. For this report, they have been grouped into broad categories of bark, flowers, fruit/seeds, leaf, or roots. These terms are not used in their narrow botanical definitions but in the colloquial use of the term. For example, the flower group

Overview of Spice Farm-to-Table Continuum and Potential Sources of Contamination | 6
FDA Draft Risk Profile | 76
contains whole dried flowers such as calendula (Calendula officinalis) or just part of the flower such as the stamen of saffron Crocus sativus (saffron); or the dried flower bud such as cloves, Syzygium aromaticum. Similarly, the root group includes rhizomes such as ginger (Zingiber officinale); bulbs such as onion (Allium cepa) or garlic (Allium sativum); or true roots such as horseradish (Armoracia lapathifolia). The part of the plant used has a great impact on how it is harvested, dried, processed, and the kinds of pests that may affect it. Likewise, the life cycle of the plant has a great influence on its processing as well. Some plants are annuals, coriander (Coriandrum sativum); others are perennials, nutmeg/mace (Myristica fragrans), while others are long lived annuals or perennials that are grown as annuals, chili peppers (Capsicum annuum, C. frutescens). The growth pattern of the plant influences the ease of harvest and exposure to potential pathogens. Some spices grow on vines, e.g., black pepper (Piper nigrum), others are leafy shrubs, e.g., oregano (Lippia spp.), while others are the fruits of a tall tree, e.g., nutmeg or mace (Myristica fragrans). In some cases, the species of the plant that sold in commerce may not be known. For example, spices sold as “oregano” may be any of over 200 species of herbs, shrubs, or small trees of the family Verbenaceae, genus, Lippia. “Oregano” may also be of the family Labiatae, Origanum vulgare but the same species may also be named “marjoram.” FDA regulations at 21 CFR 182.10 (FDA, 2012f) provide a list of “Spices and other natural seasonings and flavorings” by common and botanical name that are considered to be “Generally Recognized as Safe” (GRAS) substances. To add to the confusion regarding precise identification of source plant materials, there have been significant taxonomic changes since the last revision of 21 CFR 182.10 (FDA, 2012f). Growing practices As discussed in more detail in Chapter 7, many types of spices grow in tropical or semi-tropical environments. A few are temperate crops (garlic, onion, mustard, horseradish). The size of the farm and the agricultural techniques used to grow spices varies with the particular spice and growing region. For example, many spice farms in India are comprised of an acre or less and large farms typically contain less than 100 acres. In contrast, in the United States spice-producing farms are typically larger, where small farms are typically comprised of tens of acres and large farms are typically comprised of hundreds of acres. Of course, only a few types of spices can be easily grown on farms in the United States (see Chapter 7 for a discussion of spice production). Spices can be grown in monoculture (chili peppers, garlic), intercropped with other species (black pepper grown with nutmeg/mace, rubber, cocoa, etc.), wild-crafted (collected in the wild) or semi-wild-crafted (oregano/marjoram). Many spices are produced on very small farms where farm animals are used to plow, irrigation water is taken from nearby surface water sources, fertilization is achieved with manure/soil-amended manure, and crops are harvested by hand. Spice source plants on these farms are on mats, cement slabs, or on raised platforms in the sun, but may in some cases be left to dry directly on the ground. For some spices (e.g., capsicum in India or dehydrated garlic in the United States) a larger spice company may contract with growers and supply them with seed, fertilizers, pesticides, and technical expertise on agricultural and food safety growing and harvesting practices. Spice farms in the United States producing dehydrated onion and garlic are generally owned by or contracted with a single spice company that dictates/controls growing and harvest practices and may even provide their own proprietary seed. Use of automated equipment to plant, grow and harvest the spice source plant crops, and temperature/moisture controlled ovens to dehydrate source plants is more common on large farms. Spices are typically cleaned to remove foreign matter and extraneous materials at the primary production site but may also undergo additional cleaning at one or more points along the supply chain. The cleaning process can range from hand sorting to remove sticks, stones, or other extraneous materials to the use of simple winnowing, brushing, or sieving machines to remove the extraneous materials. The technology for cleaning
Overview of Spice Farm-to-Table Continuum and Potential Sources of Contamination | 6
FDA Draft Risk Profile | 77
spices typically involves simple milling and sieving. Metal detectors are commonly employed during primary processing to remove extraneous metallic material that may have inadvertently been added to the spice during harvest or processing (e.g., a staple). Potential sources of pathogens or filth in spices during production A variety of animals including birds, animals, rodents, reptiles, insects, and humans may introduce Salmonella or filth into the spice production environment. Once present in the environment, Salmonella may remain viable for long periods and may possibly even grow in the soil, irrigation water, manure or soil-amended manure (Chapter 5 and references therein). Spice source plants may become contaminated with Salmonella or other pathogens when contaminated animals or environmental materials come in contact with them. During the traceback investigation for one spice-related outbreak, the importing company declared that manure fertilizer used during production was the likely contamination source (Koch et al., 2005; Chapter 2). In addition to fertilizer source, irrigation water quality, application method (overhead, flooding, or drip), and timing, as well as animal access to the crop are likely to be critical parameters in determining whether the spice source plant or (dry) spice could become contaminated. In a review of risk factors for microbial contamination of fruits and vegetables, Park et al. (2012) identified contaminated irrigation water and soil as among the most critical and the prevention and control of contamination in irrigation water and soil as the most effective targets for pre-harvest risk management. The drying phase for spices is another critical point where filth and pathogen contamination may occur, particularly for spices that are dried in the open environment on mats or directly on the ground for extended periods (1-7 days). During drying, the spice may be exposed to possible rodent, bird, flies, and field pests. If the spices are not dried quickly enough or adequately, mold growth may take place. Some strategies for drying spice source plant material can reduce the risk of contamination during this phase, for example, use of raised platforms with simple tarp roofs will reduce the risk of contamination of spices by bird feces as compared with drying on mats on the ground without a roof. Cross-contamination from equipment to spice source plants or spices may take place if equipment used to plant, harvest. dry or store the spice source plants becomes contaminated and is not adequately cleaned. Human transfer of pathogens or filth is possible when harvest or other aspects of the production process are primarily manual and personal hygiene is insufficient. Filth is not a major issue during the pre-cultivation step because the spice has not developed. As the plants get older and the economically important parts start to develop, the risk of contamination by filth such as insects and animals increases (Table 6.1). Cross-contamination from equipment or field workers can also be an issue during primary production. Contamination of the spice of interest with other parts of the dried source plant may occur if appropriate cleaning/harvesting methods are not applied. The ranking in Table 6.1 was derived by FDA from site visits, knowledge of source plants and pests, and data on filth adulteration of spice. The extent to which the identified potential sources of contamination contribute to contamination of spice depends on the specific production practices employed.

Overview of Spice Farm-to-Table Continuum and Potential Sources of Contamination | 6
FDA Draft Risk Profile | 78
Table 6.1. Evaluation of risks for filth contamination at different stages during the production of spices
Production steps Filth1 Pre-cultivation - Field Cultivation + Harvest ++ Intermediate storage +++ Transportation (+) Processing (cleaning/cutting/drying/packaging) + Final product (package/stored)3 - to ++
1 Explanation of symbols: - usually no risk, (+) no to low risk, + low to medium risk, ++high risk, +++ very high risk. 3. The risk depends on the packaging of the spice and how it is stored.
6.2 DISTRIBUTION AND STORAGE
The distribution system can be very complex and as a result, storage may occur at many different points. Some crops are harvested, processed, and sold relatively quickly because their quality starts to decrease immediately upon picking (for example, capsicum). Other crops, if left whole, have a long shelf life. For example, whole black pepper can be held in storage for 5-7 years before it is sold. FDA personnel learned during their visits to India that because black pepper is a readily sold cash crop, small farmers may keep the whole (dried) spice on site for years, to serve as an emergency fund for unexpected events. Producers may sell to a local buyer or directly to a spice processor/packer. In India, black pepper is often sold to a local buyer, sometimes in lots as small as one kilogram. The buyer consolidates small lots from tens to hundreds of farms to create a 50-100 kilogram lot, which is then sold to a regional buyer. The regional buyer collects spice into a much larger lot to sell on the NCDEX (National Commodity and Derivatives Exchange Ltd., Mumbai; 1 metric tonne needed) or directly to a spice processor/packer. Larger farms may produce sufficient volumes of spice to avoid some of the aggregation steps (that may increase the risk for contamination of the spice) and the ensuing delay to market associated with it. Some spice manufacturers who contract groups of farmers for production of spices may coordinate and control aggregation of spices from contractors. Spice processing may take place before and/or after export. For example, the Spices Board of India has created “spice parks” where producers can bring their spices to undergo filth and pathogen reduction treatments as well as microbiological testing to ensure compliance with U.S. standards (Spices Board India, 2013; see discussion of the Indian EIC certificate program in Chapter 8 for more details on processing of black pepper). Individual shipments of imported spice offered for import to the United States often contain large amounts of spice, e.g., thousands or tens of thousands of kilograms (Table C1; Van Doren et al., 2013c). After arrival, the lot may be processed, and/or re-packaged and distributed multiple times before being used in food preparation. Potential sources of pathogens or filth in spices during distribution and storage At each stage of the often complex and lengthy spice distribution process, spice is stored for some period. This characteristic of the spice farm-to-table continuum makes proper packaging and storage a critical issue for preventing contamination. When improperly packaged or stored, the spice may become contaminated through contact with animals or contaminated soil, water, or equipment, or may become wet, which can facilitate the growth of pathogens such as Salmonella and/or mold. Re-use of storage bags/boxes may enhance the potential for contamination of spice, particularly if the bag is in direct contact with the spice.

Overview of Spice Farm-to-Table Continuum and Potential Sources of Contamination | 6
FDA Draft Risk Profile | 79
FDA observed problems with storage conditions during some of its site visits and inspections. Some facilities had gaps in walls or around doors, open unscreened windows, holes in walls, ceilings, or roofs. These facility features provide opportunities for insects, rodents, birds, and water to enter the facility. FDA analysis of filth adulteration of spices in shipments of imported spice offered for entry to the United States during the three- year period FY2007-FY2009 found that most of the insect adulterants were stored product pests, indicative of poor handling, storage, and cleaning of the spices. Transportation can also be a source of contamination if trucks and cargo holds of ships are not maintained, cleaned or sanitized, and spice packaging allows the spice itself to come in contact with contaminated surfaces. Adulteration has been documented for other commodities in transit. The extent to which the identified potential sources of contamination contribute to contamination of spice depends on the specific distribution and storage practices employed.
6.3 SECONDARY PROCESSING AND MULTI-COMPONENT FOOD MANUFACTURING
As with the other stages of the spice supply, the practices involved in processing, packing and food manufacture can vary tremendously. Spice secondary processing typically includes additional cleaning steps to remove element of filth, application of a pathogen reduction treatment, and for some spices, grinding, cracking and/or blending procedures. Processing practices can vary tremendously among facilities and firms. For example, some spice processors/packers may pack finished spice product manually while other use a completely automated system. Smaller firms tend to use less automation and may use common pieces of equipment or lines for different spices or processing activities. Combinations of practices in a single firm has also been observed. Based on conversations with ASTA, we know that a majority of spices in U.S. commerce are used by food manufacturers as ingredients in the production of multi-component foods. These secondary manufacturers range in size from very small firms to multi-national corporations. Some spice is also sold to foodservices and restaurants (or restaurant chains) as well as to retail outlets for consumers, as shown in Figure 6.2. Manufacturing processes for multi-component foods can be as complicated as the myriad of foods currently available on the U.S. market. However, three basic scenarios illustrate the spectrum of possibilities with regard to the application of a pathogen reduction step: (1) a manufacturing process that does not include any pathogen reduction step (e.g., some dry spice blends); (2) a manufacturing process that includes a pathogen reduction step after the spice ingredient has been added to the food (e.g., canning of low acid foods); (3) a manufacturing process that includes a pathogen reduction step before addition of the spice ingredient(s) to the food (e.g., spice coatings on deli meats/cheeses, snack food coatings, garnish). In the case of (1) and (2), manufacturers typically use spice that has been already subjected to a pathogen reduction step (e.g., by the spice processor). Potential sources of pathogens or filth in spices during secondary processing and multi-component food manufacturing In a recent review published in the Journal of Food Protection, Podolak et al. (2010) identified five factors contributing to contamination by Salmonella in low-moisture food manufacturing: (1) contamination associated with poor sanitation practices; (2) contamination associated with poor facility and equipment design and maintenance; (3) contamination associated with lack of GMPs; (4) contamination associated with poor ingredient control and handling; and (5) contamination associated with poor pest control. The review provided many examples from foodborne outbreaks attributed to these types of system failures.
Overview of Spice Farm-to-Table Continuum and Potential Sources of Contamination | 6
FDA Draft Risk Profile | 80
Cleaning and sanitation is particularly challenging in facilities processing low moisture foods because the presence of water, used to clean equipment, floors and walls, may facilitate growth of Salmonella or other pathogens, once present in the facility environment, which could lead to sustained opportunities for cross-contamination through the creation of Salmonella niches. For this reason, spice processors and food manufactures of low moisture foods generally apply dry cleaning and sanitation methods, particular in the “Primary Salmonella Control Area (PSCA),” the post-pathogen reduction treatment area in the facility (Chen et al., 2009b; GMA, 2009). In some instances, wet cleaning is used, e.g., after grinding dehydrated garlic and preparing to grind cinnamon with the same grinder. If the equipment cannot be disassembled, it is cleaned in place. FDA personnel observed excess water on floors and near spice grinding/mixing equipment during site visits to both domestic and foreign spice processors. The potential for Salmonella to actively grow under these specific conditions and create niches in the processing environment from which cross-contamination may occur cannot be ruled out without further study. Dry cleaning and sanitation methods for food contact surfaces may not remove all spice particles or eliminate all Salmonella. As a result, use of common equipment for processing different spices or foods, such as a common grinder or common transfer line, can lead to cross-contamination of previously uncontaminated spice with contaminated spice. During a visit to one facility, FDA personnel observed that the same piping was used to transfer raw and pathogen reduction treated spice to the finished product area and the processing worker was unaware that the system allowed for cross-contamination of treated spice with untreated spice. For spices, grinding/crushing/cracking of whole spices creates a lot of spice dust that, if not contained, may lead to cross-contamination in a processing facility. For example, widespread spice and Salmonella contamination of the grinding room was found and cross-contamination was suspected as a contributing cause of the 2009 Salmonella Rissen outbreak associated with ground white pepper. Salmonella was also found in the environment of 10% of domestic spice manufacturing/packing/re-packing facilities inspected in 2010 (Aug-Dec). When air, personnel and material flow is not adequately controlled, “raw” spice that may be contaminated with Salmonella may contaminate spice in the PSCA (after it has undergone a pathogen reduction treatment) (see examples in Podolak et al., 2010 and GMA, 2009). As noted above, FDA has learned that some spice does not undergo a pathogen reduction treatment during the secondary processing phase. If contaminated spice does not undergo such a treatment or kill step before consumption, consumers may become ill. In many cases, spice processors sell untreated spice to a food manufacturer who will apply a lethality step to the spice before allowing it to reach the consumer. Ineffective or inefficient pathogen reduction treatments may allow some Salmonella to survive. Pathogen reduction treatments that have not been validated or for which the process parameters are not monitored and verified, have the potential for insufficient treatment. Spice processors as well as seasoning and food manufacturers that purchase spice that has not been produced, transported, distributed, or stored using appropriate preventive controls may have a higher risk of purchasing contaminated spice. FDA inspections of domestic spice facilities found that pests were the most often cited CGMP violation. Surprisingly, most of the facilities inspected for which information was available, did have established pest control programs. Pests can transfer Salmonella or other pathogens from one location to the spice. Poor facility design and lack of control of movement of people and material in areas where finished product is located can enhance opportunities for contamination of the environment or cross-contamination to the product (see for example, Podolak et al., 2010 and Beuchat et al., 2013). The extent to which the identified potential sources of contamination contribute to contamination of spice depends on the specific spice processing and/or multi-component food manufacturing practices employed.

Overview of Spice Farm-to-Table Continuum and Potential Sources of Contamination | 6
FDA Draft Risk Profile | 81
6.4 RETAIL/END USER
Retailers (institutional foodservices, restaurants, and retail food stores) may source their spices from a diversity of company types including importers, warehouses, re-packers, secondary processers (grinders/blenders) and wholesalers. Depending on the retail facility type, spice may be stored in a large warehouse, small storage room or directly in the kitchen area and/or customer access areas. Consumers purchasing spice for home use may obtain their spice products in small pre-packaged retail containers or from bulk bins via direct purchase from retail stores, markets, internet venders, etc., or from home gardening (limited by climate). Storage in consumers’ homes can be in the kitchen, pantry or elsewhere, in the original retail packaging or transferred into other containers (e.g., spice rack specific containers). When adding spice to foods, it is not uncommon for food preparers to shake the spice out of its container directly into the food or cooking pot rather than using a utensil to do so. Potential sources of pathogens or filth in spices in the retail or home environment The greatest concern for spice at the retail/home setting is the potential for growth of Salmonella in foods to which contaminated spice has been added when food is not maintained at an appropriate temperature. It is suspected that growth contributed to the illness rates observed in several of the spice-related outbreaks, such as the outbreaks associated with spice-containing tea (Chapter 2). It is not known whether the practice of shaking a spice container over a pot during cooking can add sufficient moisture to the container to allow growth of Salmonella. Keller et al. (2013) found that initiation of Salmonella growth in contaminated ground black pepper at permissive water activities and room temperature generally includes a long lag-time. In such a case, evaporation of added moisture may reduce the water activity of the spice below the threshold for growth before growth begins. (Keller et al., 2013). Cross-contamination may also take place, if the spice is allowed to come in contact with contaminated surfaces in the food preparation area such as the surfaces of common utensils used for spices and other foods. Contamination of spice by insects or rodent feces/hairs may take place if the spice is kept in open containers for extended periods and insects and rodents can enter the facility. These pests, if allowed access to the spice, can introduce pathogens into the spice. The extent to which the identified potential sources of contamination contribute to contamination of spice depends on the specific distribution and storage practices employed.

FDA Draft Risk Profile | 82
7. SPICE PRODUCTION AND CONSUMPTION
7.1 U.S. SPICE SUPPLY
7.1.1 U.S. PRODUCTION
Only five spices are produced in the United States in large quantities: dehydrated onion, dehydrated garlic, capsicum, mustard seed, and sesame seed (USDA/ERS, 2012a-c; ASGA, 2012). Dry weight production values are available from the USDA Economic Research Service and are shown for 2010 in Table 7.1. The value for garlic in Table 7.1 includes production for both the dehydrated and fresh markets (converted to dry weight); separate values are not available (USDA/ERS, 2012b). As of 2010, imports of four out of five of these spices exceeded U.S. production (USDA/ERS, 2012a-c). Table 7.1. U.S. production of spices in 2010: Dehydrated onion, dehydrated (and fresh) garlic, capsicum, mustard seed, and sesame seed.
Spice U.S. Production (million lbs., dry weight)
Dehydrated Oniona 104.3
Dehydrated and Fresh Garlicb 138.4 Capsicumc 93.0 Mustard Seedc 41.9 Sesame Seedd >22
a Dehydrated weight, estimated by dividing fresh weight by factor of 9. Data and conversion factor from USDA/ERS (2012a) b Dehydrated weight for combined dehydrated and fresh garlic supply, estimated by dividing fresh weight by factor of 2.7 Data and
conversion factor from USDA/ERS (2012b). c Data from USDA/ERS (2012c). d Data from ASGA (2012) which reported “over 11,000 tons.” Domestic production of dehydrated onions is much larger than import, and has been for at least the past 30 years, Figure 7.1. As of 2010, 90% of the total U.S. supply was produced domestically (USDA/ERS, 2012a). Production far exceeds U.S. needs for the food supply; approximately half of U.S. production is exported (USDA/ERS, 2012a). Although small in a relative sense, dehydrated onion imports have grown over the last decade in both absolute and relative terms (USDA/ERS, 2012a). Domestic production of garlic (dehydrated and fresh) accounted for all of the U.S. supply until 1969 and then ~85% of the U.S. supply until 1997, Figure 7.2. After 1997, the relative contribution of domestically produced garlic began to decrease annually, until 2006. Comparing absolute production and import values for the period after 1997, one finds that the observed change arose from an acceleration of garlic imports and a relatively stagnant, then decreasing, domestic production (USDA/ERS, 2012b). Since 2006, imports have surpassed domestic production, but only slightly. A change in U.S. import restrictions issued in 2011 may expand garlic imports even further by allowing importation from the European Union and several other countries (39 countries in all) (USDA/APHIS, 2011).

Spice Production and Consumption | 7
FDA Draft Risk Profile | 83
Figure 7.1. Relative contributions of domestic and imported dehydrated onion to the total annual U.S. supply, 1970 to 2010. Total annual supply values used to calculate relative contributions only include new crop and imports; beginning stocks and loss of domestic product during processing were excluded. Data derived from USDA/ERS 2012a.
Figure 7.2. Relative contributions of domestic and imported garlic to the total annual U.S. supply, 1960 to 2010. Data includes California production only (the major producing state) and combines dehydrated and fresh garlic. Data derived from USDA/ERS (2012b). The relative contributions of domestic production and importation of capsicum to the total U.S. spice supply have varied over the years, Figure 7.3, while the total supply has increased more than 750%, from 41.5 million pounds in 1966 to 320.8 million pounds in 2010 (peak supply was 382.9 million pounds in 2006; USDA/ERS, 2012c). The increase in the relative contribution of domestic capsicum production to the supply from 1966 to 1980, Figure 7.3, is a reflection of increased domestic production; imports were approximately constant during that period (USDA/ERS, 2012c). After 1980, both domestic and importation supplies

Spice Production and Consumption | 7
FDA Draft Risk Profile | 84
increased through 1992 but after 1992, domestic production generally decreased while imports continued to increase in volume (USDA/ERS, 2012c). The contribution of imported capsicum to the total supply has exceeded domestic production since 1998. In 2010, domestic production of capsicums constituted 20% of the total capsicum supply (USDA/ERS, 2012c).
Figure 7.3. Relative contributions of domestic and imported capsicum (including paprika) to the total annual U.S. supply, 1966 to 2010. Data includes California production and New Mexico production (beginning 1976). Data derived from USDA/ERS (2012c). The U.S. supply of mustard seed is also primarily derived from imports, Figure 7.4. From 1966 to 2010, imports have contributed more than 60% of the total U.S. supply (except for 2002, when U.S. production was exceptionally large; USDA/ERS 2012c). In 2010, 20% of the mustard seed supply was produced domestically (USDA/ERS, 2012c). Production of domestic sesame seeds has recently increased from approximately 5 million pounds per year to over 22 million pounds in 2009 and 2010 (ASGA, 2012). As a proportion of the supply, the domestic production in 2010 represents at least 21% of the total supply (USDA/ERS 2012c; ASGA, 2012). Part of this growth in production can be attributed to the development of non-dehiscent varieties, which allow drying in the field and mechanical harvest techniques to be used (ASGA, 2012). Several other types of spice source plants can grow effectively in the United States, e.g., basil, oregano and thyme, and are even wild harvested (see for example, Oregon’s Wild Harvest, 2012) but production of the (dried) spices is small.

Spice Production and Consumption | 7
FDA Draft Risk Profile | 85
Figure 7.4. Relative contributions of domestic and imported mustard seed to the total annual U.S. supply, 1966 to 2010. Domestic mustard seed production weights used to calculate relative contribution is determined from the previous year’s production minus product used as seed. Data derived from USDA/ERS (2012c).
7.1.2 U.S. IMPORTS
The United States is the single largest export market for spices (International Trade Center UNCTAD/WTO, 2006), importing more than 1.1 billion pounds of spices in 2009 (USDA/ERS 2010, 2011a). Import data for individual spices are provided by the USDA Economic Research Service (USDA/ERS, 2010) and data for 2009 is provided in Table 7.2. The relative contributions to total imports are calculated for each spice with the caveat that garlic has been excluded (because the relative proportions of imports intended for the dehydrated market is not available). While five spices (capsicum, mustard seed, black and white pepper (tabulated together), and ginger root) accounted for one half of the 2009 imports by weight, a much larger number of spices and spice blends account for the other half. Indeed, the USDA Economic Research Service found in its 2007 report that “the share of traditional spices, such as peppers, cinnamon, and vanilla declined [between 1998 and 2007] as the U.S. palate increasingly sought diverse tastes and increased its demand for such products as nutmeg, saffron, fennel and turmeric” (Brooks et al., 2009). Spices are primarily produced in developing countries (International Trade Centre UNCTAD/WTO, 2006). However, data from the USDA Foreign Agricultural Service (FAS) on U.S. imports of spices show that spice imports to the United States came from over 140 countries (USDA/FAS, 2011). Table 7.3, derived from FAS tables, identifies the top 20 countries for 2010 U.S. spice import, based on value; dehydrated onion and garlic are not included in these figures. The table also provides a comparison of imports from the same countries one decade earlier. Comparing 2010 with 2000, we see that total spice imports increased by nearly 60% by value over this time period, with imports valued at more than 1 billion dollars in 2010. The relative contribution to spice imports from different countries has also changed with time.
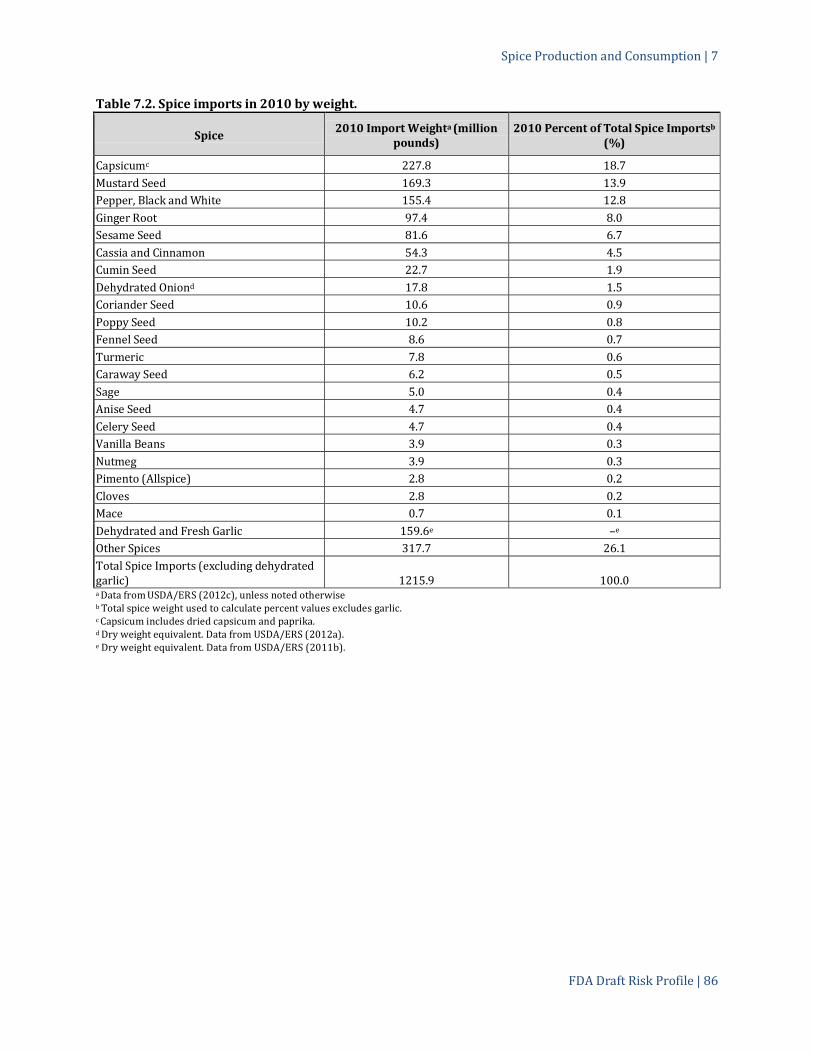
Spice Production and Consumption | 7
FDA Draft Risk Profile | 86
Table 7.2. Spice imports in 2010 by weight.
Spice 2010 Import Weighta (million pounds)
2010 Percent of Total Spice Importsb (%)
Capsicumc 227.8 18.7 Mustard Seed 169.3 13.9 Pepper, Black and White 155.4 12.8 Ginger Root 97.4 8.0 Sesame Seed 81.6 6.7 Cassia and Cinnamon 54.3 4.5 Cumin Seed 22.7 1.9 Dehydrated Oniond 17.8 1.5 Coriander Seed 10.6 0.9 Poppy Seed 10.2 0.8 Fennel Seed 8.6 0.7 Turmeric 7.8 0.6 Caraway Seed 6.2 0.5 Sage 5.0 0.4 Anise Seed 4.7 0.4 Celery Seed 4.7 0.4 Vanilla Beans 3.9 0.3 Nutmeg 3.9 0.3 Pimento (Allspice) 2.8 0.2 Cloves 2.8 0.2 Mace 0.7 0.1 Dehydrated and Fresh Garlic 159.6e –e Other Spices 317.7 26.1 Total Spice Imports (excluding dehydrated garlic) 1215.9 100.0 a Data from USDA/ERS (2012c), unless noted otherwise b Total spice weight used to calculate percent values excludes garlic. c Capsicum includes dried capsicum and paprika. d Dry weight equivalent. Data from USDA/ERS (2012a). e Dry weight equivalent. Data from USDA/ERS (2011b).

Spice Production and Consumption | 7
FDA Draft Risk Profile | 87
Table 7.3. Spice imports by value, 2000-2010.
Country 2000 Import Value1 (million $)
2010 Import Value1 (million $)
2010 Percent of All Imports
Change in Percentage of All Imports, 2000-
2010 India 101.9 161.8 16.1 -0.1 Indonesia 132.4 146.2 14.6 -6.5 China 26.9 109 10.9 6.6 Canada 30.2 70.9 7.1 2.3 Mexico 42 64.3 6.4 -0.3 Vietnam 18.6 64.3 6.4 3.4 Peru 1.5 49.5 4.9 4.7 Spain 17.7 42 4.2 1.4 Brazil 40.7 39.9 4 -2.5 Madagascar 30.6 28.3 2.8 -2.0 Guatemala 20 23.7 2.4 -0.8 Turkey 18.4 20.4 2 -0.9 Egypt 7.3 19.2 1.9 0.7 Germany 3.9 15.6 1.6 0.9 Sri Lanka 7.4 15.4 1.5 0.3 Israel 10.4 12.6 1.3 -0.4
France 5.9 10.4 1 0.1 Colombia 0.5 10.3 1 1.0 Syria 7.5 8.1 0.8 -0.4 Pakistan 1.8 7.2 0.7 0.4 Other Countries 102.4 83.3 8.3 -8.0 World Total 627.9 1002.4 100 - 1 Data from USDA/FAS (2011). China’s share increased by 6.6 percentage points from 2000 to 2010 while that of Indonesia decreased by nearly that amount. Smaller gains in import share during this period were observed for Peru, Vietnam, and Canada, in decreasing order of gain. In 2010, India, Indonesia and China together provided nearly 42% of imported spices (excluding dehydrated onion and garlic). Ten countries supplied 77% of spice imports by value in 2010 (excluding dehydrated onion and garlic). It is also noteworthy that some countries, for example, Germany, that are not major spice producers, are major exporters of spice to the United States. These countries import spice from developing countries and may process, blend, or re-package it before exporting it to the United States. In 2007, crushed black pepper imports from Germany were valued at $8 million (Brooks et al., 2009). The relative contributions from each country to U.S. supplies of individual spices have been reviewed by the USDA Economic Research Service for 1980-1994 (Buzzanell et al., 1995) and 1998-2007 (Brooks et al., 2009). In 2007, capsicums were primarily imported from China, Mexico, Peru and India whereas black pepper was imported from Brazil, Vietnam and India (Brooks, et al., 2009). Mustard seed is primarily imported from Canada (Buzzanell et al., 1995) while ginger is primarily imported from China (Brooks et al., 2009). More than 70% of vanilla imports in 2007 were from Madagascar with smaller contributions from Uganda, Indonesia, India and Papua New Guinea. Cumin seeds are imported from a number of countries including India, Syria, Turkey, China and Pakistan while cinnamon is imported from Indonesia, Sri Lanka, Vietnam, Brazil and China. The country-spice import matrix for the United States continues to evolve. Appendix B lists the main spice-producing countries and their absolute and relative contributions to world-wide production for 2010. Review of the tables included in Appendix B (from FAO 2013a-b) demonstrate the wide diversity of production countries and illustrates the potential for future growth and evolution of the U.S. import market.

Spice Production and Consumption | 7
FDA Draft Risk Profile | 88
7.2 SPICE CONSUMPTION IN THE UNITED STATES
7.2.1 CONSUMER POPULATION
A large fraction of the U.S. population consumes spices. Based on a retail study of household use in July 2009, an estimated 86% of households in the United States use fresh or dried herbs, spices, or seasoning blends (Mintel International Group, 2009). A similarly large fraction, 78%, of households report using herbs, spices and seasoning blends beyond salt and pepper (Mintel International Group, 2009). Small differences in household use by gender, age, ethnicity/race, and household income are reported. Among the survey participants (aged 18-65+ years), a slightly larger percentage of women (84%), people in the age range 25-34 (82%), Hispanic households, and households with annual incomes in the range $100K-149K (84%) report using herbs, spices and seasoning blends other than salt and pepper (Mintel International Group, 2009). These estimates do not include the additional percentage of the population that may only consume spices in foods prepared or seasoned outside the home, e.g., by food manufacturers, food services, restaurants or other prepared food suppliers. Indeed, a majority of the spice supply is sold wholesale and most is ultimately incorporated into prepared foods (Buzzanell et al., 1995).
7.2.2 CONSUMPTION MASS AND FREQUENCY
An estimate of annual per capita spice consumption in the United States is provided by the USDA Economic Research Service. This estimate is based on annual food availability data and the U.S. population. From 1966 to 2010, per capita consumption of spices other than dehydrated onion and garlic, increased nearly 300%, with an average rate of increase of 0.5 lbs./decade (USDA/ERS, 2012c), Figure 7.5. Per capita consumption of garlic, dry and fresh, has also increased dramatically with a rate of increase of ~0.3 lbs./decade (dry weight equivalent rate), between 1970 and 2010 (USDA/ERS, 2012b). In contrast, per capita consumption of dehydrated onion, as estimated from the total net supply, has been approximately constant since 1970 (USDA/ERS, 2012a). In 2010, annual per capita consumption of spices excluding dehydrated onion and garlic was approximately 3.47 lbs. (1575 g) and including dehydrated onion was approximately 3.64 lbs. (1653 g; USDA/ERS, 2012c). Assuming spices are consumed in three meals per day, the per capita spice consumption is estimated to be 1.4 g per eating occasion.

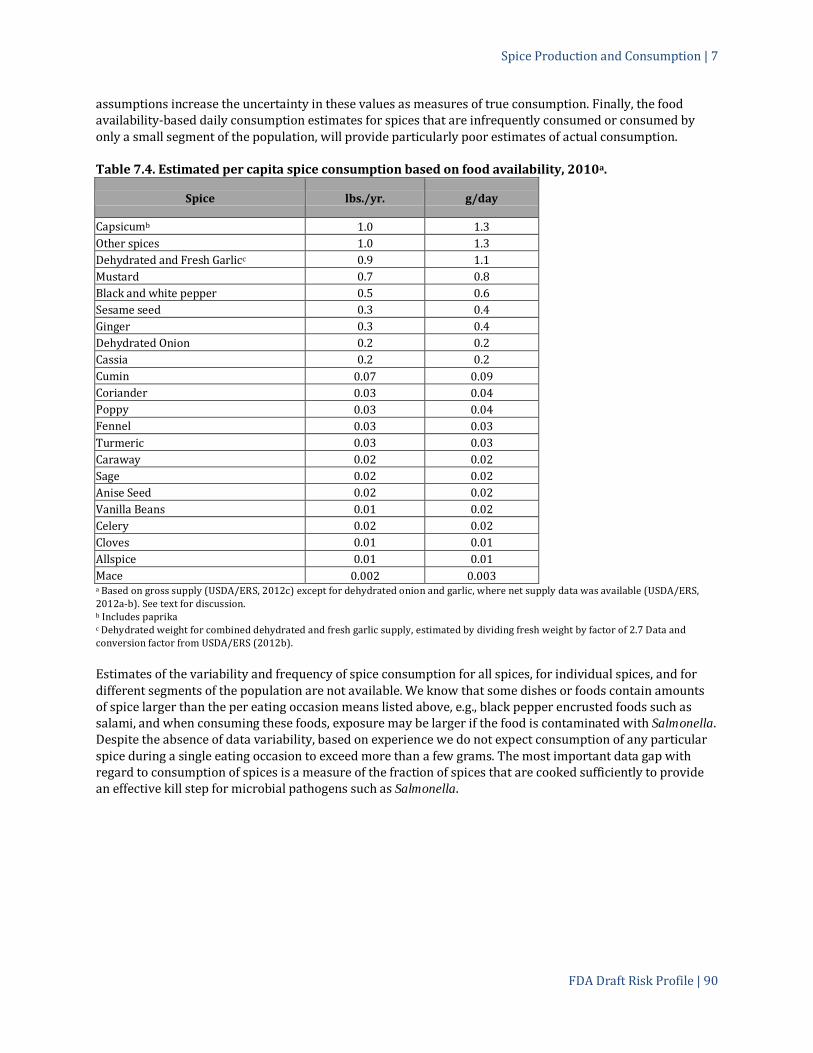


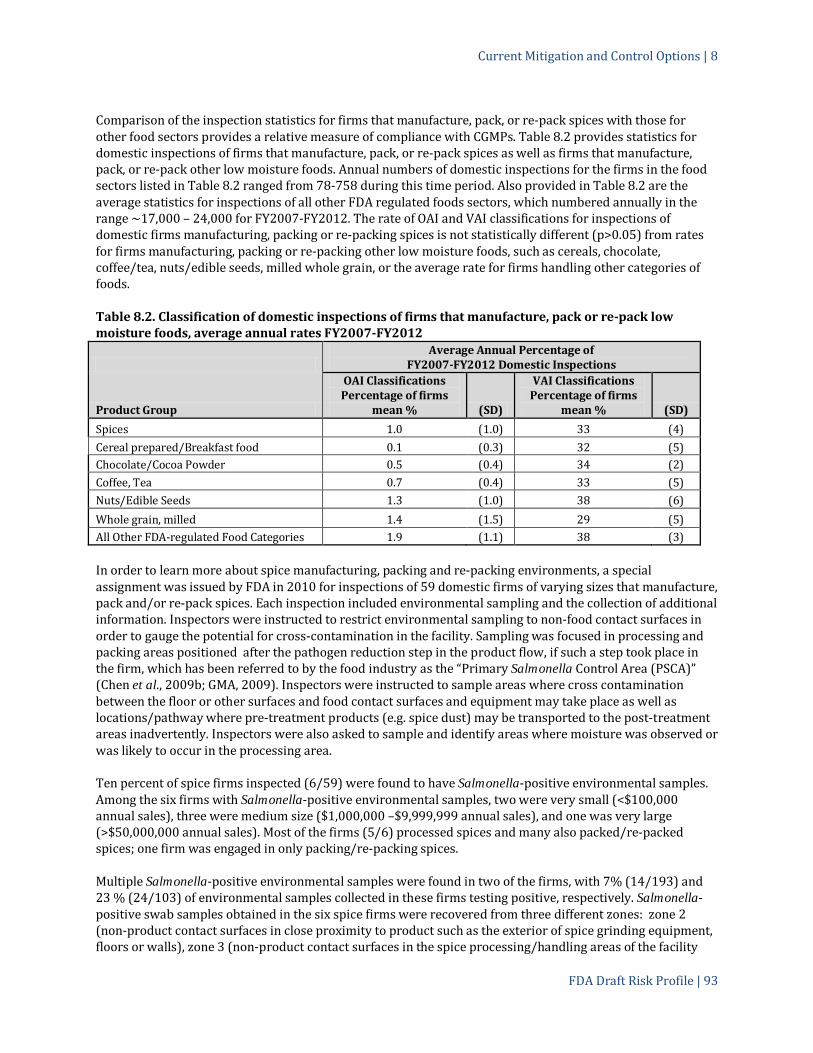

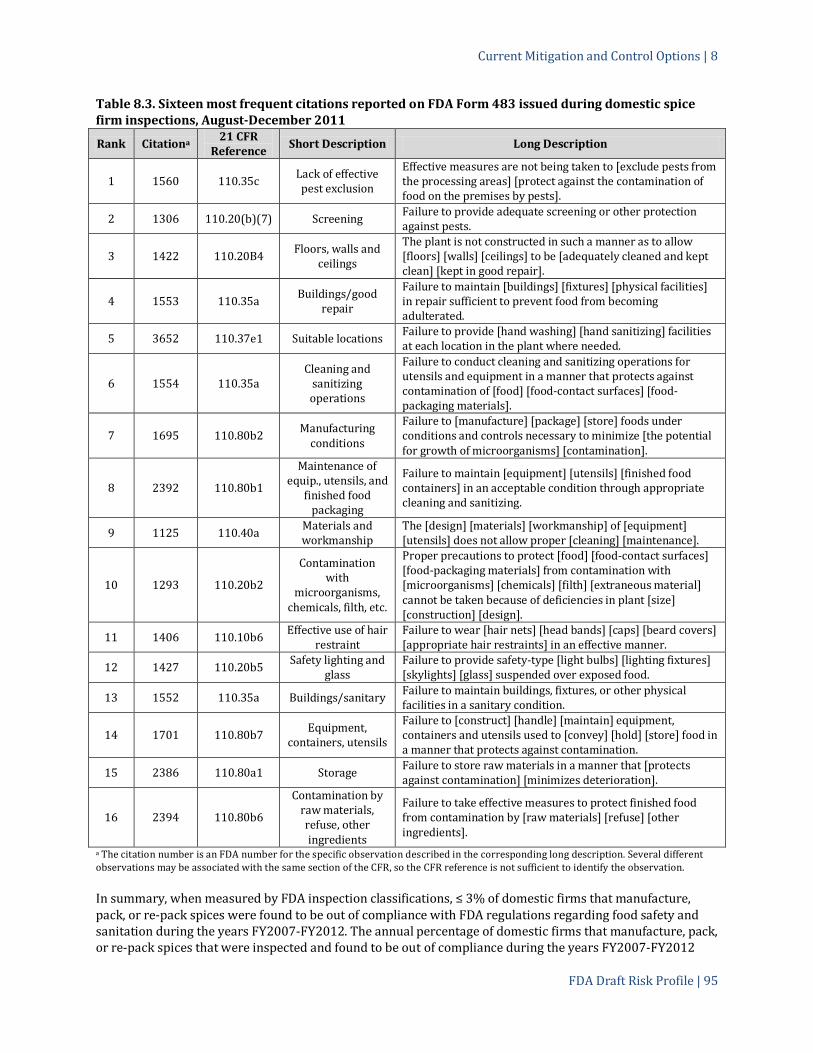


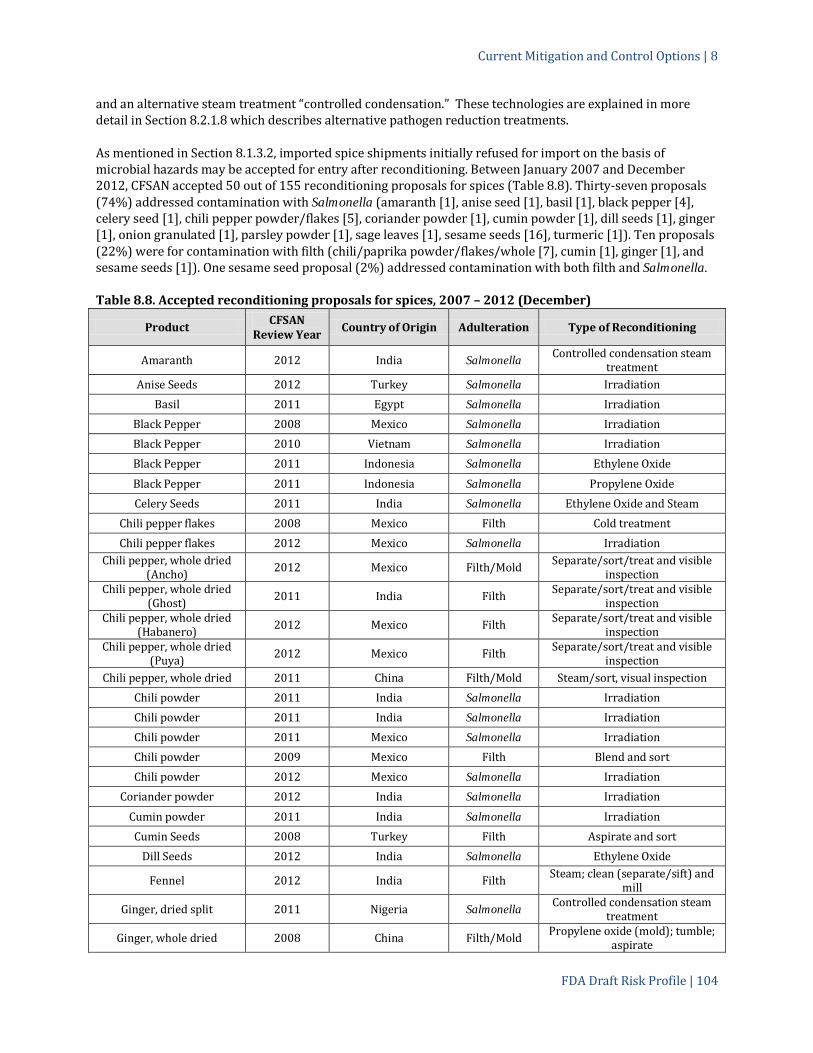
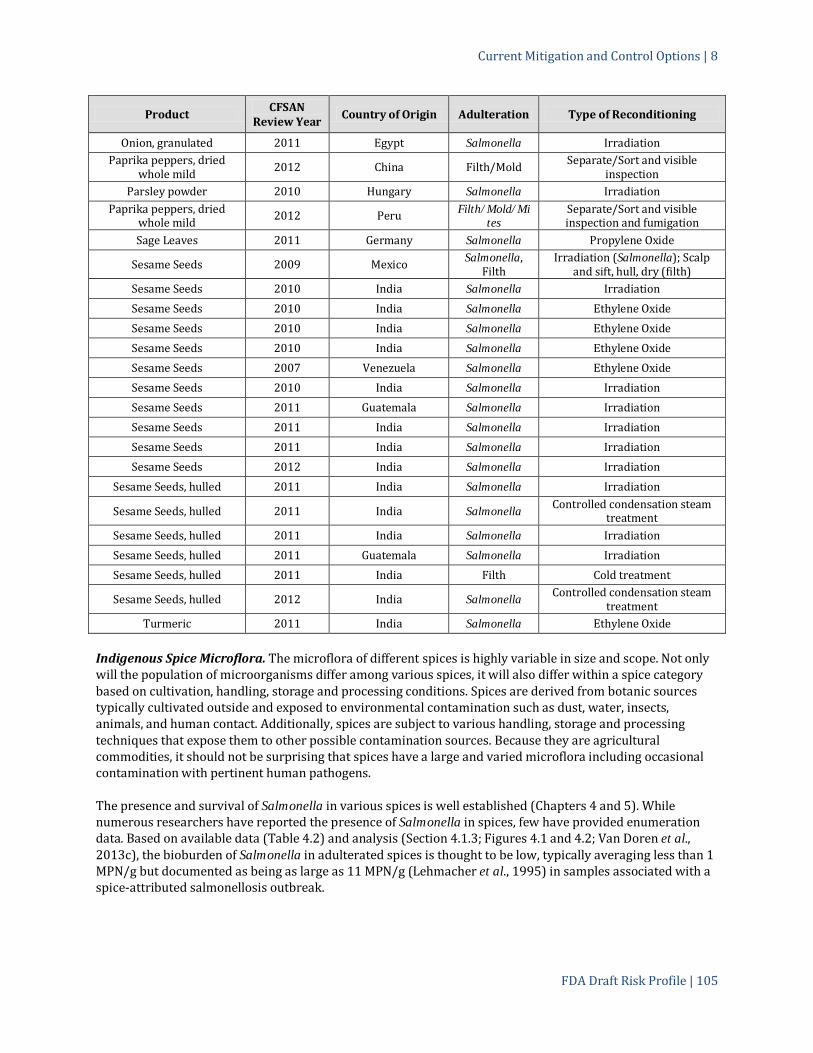


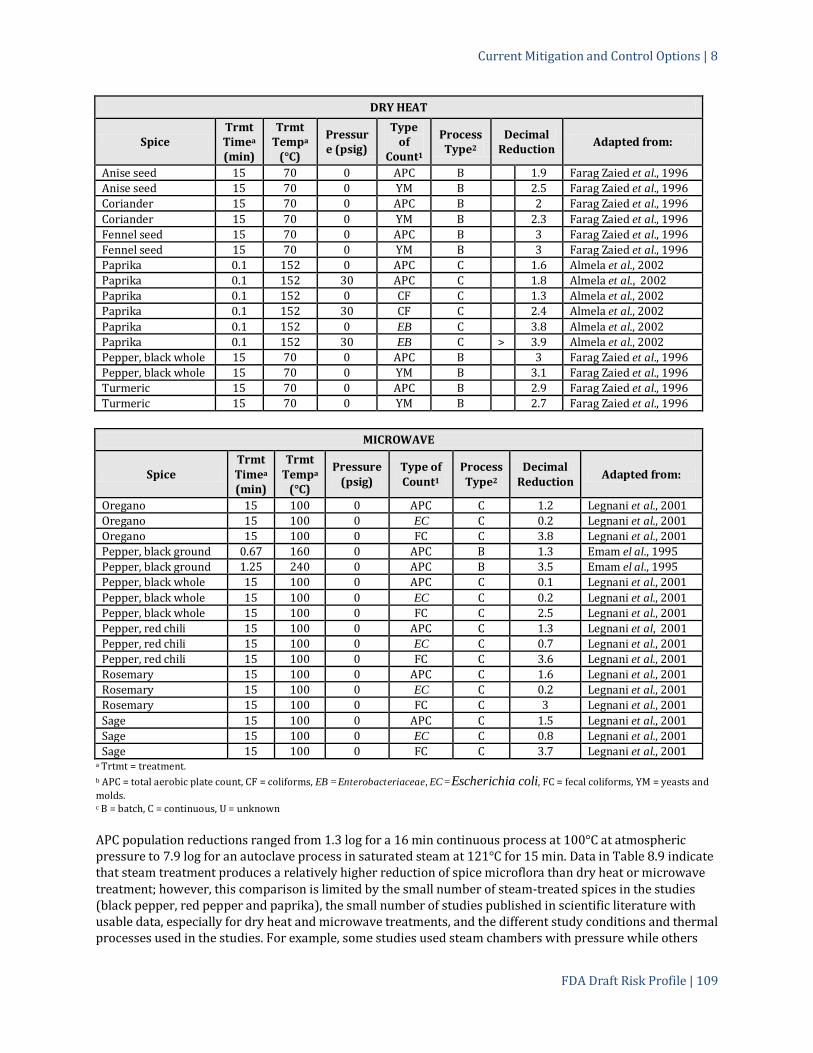


Current Mitigation and Control Options | 8
FDA Draft Risk Profile | 125
Aromatic Plants is not based on currently available data and information but is being revised. We are unaware of any systematic studies that have measured changes in the prevalence of microbial or filth contamination in spices as a result of applications of these guidance documents or any surveys that measure the extent to which these practices have been adapted by the food industry in general or the spice industry in particular.

FDA Draft Risk Profile | 126
9. GENERAL CONCLUSIONS AND POTENTIAL FUTURE MITIGATION AND CONTROL OPTIONS
9.1 GENERAL CONCLUSIONS
A wide diversity of pathogens have been found in spices including Salmonella, Bacillus spp. (including B. cereus), Clostridium perfringens, Cronobacter spp., Shigella, and Staphylococcus aureus. Human illness outbreaks attributed to consumption of pathogen-contaminated spice have most commonly been associated with Salmonella or Bacillus spp. contamination. Ten of fourteen (71%) spice-associated outbreaks identified worldwide during the period 1973-2010 and 87% of the documented human illnesses in the outbreaks attributed to consumption of contaminated spices were caused by serotypes of Salmonella. Salmonella was the only pathogen associated with reported spice-associated outbreaks, food recalls, and Reportable Food Registry reports in the United States, for the review periods covered in this report. The absence of spice-associated Bacillus spp. outbreaks or food recalls reported in the United States is somewhat surprising, particularly in light of reports of Bacillus spp. outbreaks associated with consumption of contaminated spice in the European Union during the 1973-2010 review period covered in this report, and additional Bacillus spp. outbreaks (4) reported in the European Union in 2011 (EFSA, 2013). The apparent differences in the types of outbreaks attributed to contaminated spice and most commonly reported in the United States and the European Union or other regions/countries may arise in part from differences in awareness, surveillance (including test methodology), regulations, clinical diagnoses of suspected foodborne illnesses, and reporting requirement for different kinds of illnesses. Differences in diet, food preparation, and food storage practices may also contribute to the observed differences in types of reported outbreaks. Evidence described in this report demonstrates the potential for introduction of Salmonella into/on spice during primary production, distribution and storage, secondary processing and food manufacturing, and at retail. Salmonella can survive in the natural environment (outside of an animal host) for extended periods and may persist in production environments for years. During primary production, contact between the spice source plant during growth, harvest, or drying and Salmonella-contaminated materials in the environment, including soil, water, insects, animals, or animal feces, has the potential to contaminate the spice. Once in/on the spice, Salmonella can continue to survive for long periods. Most spices consumed in the United States are imported. The overall prevalence of Salmonella-contaminated shipments of imported spice offered for entry to the United States was 6.6% (750 g sample size; 95% CI 5.7-7.6%) for FY2007-FY2009. This value is 1.9 times (95% CI 1.6-2.3) the prevalence found for other shipments of FDA-regulated foods examined during the same period. Salmonella was found in shipments of many different types of spices, in a variety of forms (whole, cracked, ground or blended) and from many different countries. As a result, we conclude that the presence of Salmonella is a general problem in the spice supply chain rather than a problem of a specific type/form of spice or source country. A few differences in prevalence rates with spice type, form, or country were significant and these should be explored further to better understand the increased/decreased contamination rate. Salmonella concentrations ranging from 0.0007 to 11 MPN/g-spice (7 MPN per 10,000 g to 11 MPN per g) have been reported. Observations and models developed from an FDA 2010 study of shipments of imported capsicum (299 shipments) or sesame seed (233 shipments) offered for entry to the United States predict wide variability in the mean concentration of contamination among contaminated shipments of these types of spices and that many contaminated shipments contain very low concentrations of Salmonella. Estimated prevalence values based on sampling results are likely to be underestimates. Sampling plan design, particularly selections of an appropriate sample size and validated method of analysis, are critical to ensure efficient surveillance.
General Conclusions and Potential Future Mitigation and Control Options | 9
FDA Draft Risk Profile | 127
Salmonella has also been found in the environment of spice/food facilities, including spice/food facilities associated with two of the three spice-associated outbreaks identified in the United States. Cross-contamination from the spice/food manufacturing environment to the spice product was suspected to have been a contributing factor in both of these outbreaks. An FDA surveillance study involving environmental sampling in 59 spice manufacturers/packing/re-packing facilities in the United States during 2010 found 10% of the facilities contained Salmonella in the environment. In that study, Salmonella was found on non-product contact surfaces in close proximity to product such as the exterior of spice grinding equipment, floors or walls. The relatively large prevalence of Salmonella-positive facility environments observed in the survey indicates that Salmonella presence in spice manufacturers/packing/re-packing facilities is not uncommon. Experiments have shown that Salmonella can grow quickly in some spices when moistened/wet (in the absence of other nutrients) which means that environmental niches may be created in facilities where Salmonella is present in the environment and moisture is not controlled (e.g., where wet cleaning is used). Site visits and conversations with the spice industry revealed that not all spices sold by spice manufacturers have been treated with a pathogen reduction step. Food manufacturers and food preparers who purchase spice may subsequently apply a pathogen reduction step that would limit the potential for the spice, if initially contaminated, to cause illness. However, investigations of spice-associated outbreaks revealed that in at least three of the outbreaks, the consumed spice had not undergone a pathogen reduction treatment before reaching the consumer. Addition of spices to foods after cooking is not uncommon in the United States (e.g., addition of capsicum or Italian seasoning to a pizza and black pepper to salads, steaks, and other foods). Once present in a moist food, pathogens from spice ingredients may grow if appropriate time/temperature conditions are not maintained. Growth of the pathogen in the food was suspected to have contributed to the numbers of illnesses in some of the outbreaks. Many of the spice-associated outbreaks during 1973-2010 were associated with consumption of low-moisture foods, including outbreaks leading to large numbers of illnesses. Large numbers of Salmonella illnesses can occur from consumption of spices when the exposed population is large, even when the concentration of Salmonella in the spice is small. This was the case for the1993 outbreak associated with consumption of contaminated paprika-powdered potato chips. A single contaminated shipment/lot of spice can contain millions to tens of millions of servings. A diversity of filth adulteration has been found in spices offered for import to the United States that includes insects, excrement, hair, and other materials. Filth shipment prevalence during FY2007-FY2009 was 12% (95% CI 10-15%) which was 1.8 times (RR 95% CI 1.4-2.2) the value found for all other imported shipments of FDA-regulated foods sampled during this time period. Filth was found in shipments of many different types of spices, in a variety of forms (whole, cracked, ground or blended) and from many different countries. As a result, we conclude that the presence of filth is a general problem in the spice supply chain rather than a problem of a specific type/form of spice or source country. However, shipments of imported black pepper during FY2007-FY2009 and sesame seeds during FY2010 had significantly smaller violation rates than many other types of spice. The most prevalent types of filth were storage product insects/insect parts and animal hair (especially rodent). These types of filth are indicative of insanitary conditions and failures in the application of CGMPS. Current mitigation and control options to prevent or control adulteration of spice by pathogens and filth include GAPs, CGMPS, inspections of and environmental sampling in spice manufacturing/packing facilities, product sampling, refusals and reconditioning, import alerts (with or without green lists and country agreements), recalls, application of pathogen reduction treatments, and guidance from FDA, other U.S. federal agencies, international agencies and industry trade organizations. Many of the current enforcement and regulatory strategies are effective but, with modification, could have greater impact on compliance. One example is Import Alert 28-02 for Indian Black Pepper, which includes an agreement that leverages in-country regulatory authority to improve the food safety of shipments of the imported spice offered for entry

General Conclusions and Potential Future Mitigation and Control Options | 9
FDA Draft Risk Profile | 128
to the United States. This combination of incentives appears to be effective in reducing the prevalence of Salmonella or filth contamination in shipments of Indian black pepper offered for entry to the United States. Expansion of this type of mechanism to other spices and/or to other countries should lead to further improvements. The FDA Food Safety Modernization Act provides important new tools to mitigate and control contamination and post treatment cross contamination of spices with Salmonella, including authority to mandate recalls and increase in the frequency of foreign and domestic inspections. Prevention standards and import safety mandates required by FSMA are included in the potential future mitigation and control options, because they were still in development when this report was written. Failures identified in the farm-to-table food safety system potentially leading to adulteration of consumed spice generally arose from poor/inconsistent application of appropriate preventive controls, such as failing to limit animal access to the source plant during harvest and drying phases, failing to limit insect and rodent access to spice during storage, and failing to subject all spice to an effective pathogen reduction treatment (or other lethality step). On the basis of our research, we concluded that the knowledge and technology is available to significantly reduce the risk of illness from consumption of contaminated spices in the United States. Capacity building through the creation of partnerships with stakeholders can facilitate improvements in spice safety and reduce the risk of illness from consumption of pathogen-contaminated spices. Specifically, enhanced communication between FDA and the spice industry and within the spice and food manufacturing industry itself, combined with training across the spice supply chain are needed to ensure understanding of appropriate preventive controls and how to implement and maintain them.
9.2 POTENTIAL FUTURE MITIGATION AND CONTROL OPTIONS
We developed the following list of potential future mitigations and control options for consideration based on a review and analysis of the scientific data and information available about the prevalence, concentration and public health risk of pathogen (primarily Salmonella) and filth adulteration of spices and our assessment of the efficacy of current mitigation and control options. The list includes mitigation and control options that FDA, the spice industry, government agencies, food manufacturers/preparers, and the consumers may consider to reduce the prevalence and concentration of Salmonella, other pathogens, and filth in spices and to reduce the public health burden resulting from consumption of contaminated spices or foods containing contaminated spices. Mitigation and control options identified include capacity building, guidance, enforcement and regulatory strategies, communication, education, and training. Research needed to explore additional potential mitigations is described in Chapter 10. For each mitigation and control option, we briefly describe the observation/data that motivated it, provide a brief description of the option, identify expected benefits/effectiveness, and provide additional comments about implementation (practicality), as needed. Mitigation and control options are organized by the stage in the farm-to-table continuum in which it would be implemented or the part of the continuum that would be most highly impacted. More data are needed to rank the relative importance of the different kinds of system failures identified in the report and the potential impact of the proposed mitigation and control options.
9.2.1 PRIMARY PRODUCTION
Update and produce industry and government guidance documents to reflect current knowledge and practices and improve utility of these documents by creating flexible communication platforms. Poor/inconsistent application of industry and government guidance was identified as one of the contributing factors leading to spice contamination with pathogens and filth. Some of the guidance documents for spice production, storage, distribution, processing, and use described in Chapter 8 do not describe the most up-to-date science-based principles for preventing/limiting contamination during on-farm production and post-production processes of spices (e.g., the Codex Code of Hygienic Practices for Spices and Dried Aromatic
General Conclusions and Potential Future Mitigation and Control Options | 9
FDA Draft Risk Profile | 129
Herbs.) The proposed rule “Standards for the Growing, Harvesting, Packing, and Holding of Produce for Human Consumption” (78 Federal Register 3504, January 16, 2013) (FDA, 2013e), which would implement section 105 of FSMA, provides information on mitigation in connection with pre-harvest commodities. It may be applicable to certain types of spice source plant production and could be relevant to updated guidance documents. Each guidance document should be reviewed and updated, as necessary. To improve the utility of these documents, tools should be developed to allow individuals/organizations to create customized extracts/compilations of the guidance(s) to review, share, discuss, and educate with particular groups. For example, one could create a single extract that collects all the sections of Codex documents that are relevant to the primary production of spices from the numerous relevant Codex food hygiene guidance documents. Some of this work is underway (e.g., development of a proposed revision of the Codex Code of Hygienic Practices for Spices and Dried Aromatic Herbs; FDA, 2012f). Alternatively, an alliance of stakeholders could work together to harmonize standards for the industry, as has been done in the produce industry (United Fresh, 2013). Creation of flexible and comprehensive resources, such as the examples described above, would require resources to complete, but may improve adoption by clarifying recommendations. Enhance education and training for spice primary producers. Poor/inconsistent application of industry and government guidance was identified as one of the causes of spice contamination with pathogens and filth. While a number of guidance documents have been developed and have been reviewed in Chapter 8, some may not be accessible to all primary producers for a variety of reasons, e.g., not available, culturally insensitive, too general, wrong language, or uses the written word. New/revised versions of these documents could be developed to address limitations, perhaps building off of the novel GAPs tools developed by WHO (2013b) and the National GAPs Program at Cornell University (2013). Further improvements in application of guidance may be realized if practical examples are provided, either as part of the guidance or in another document/media format. For example, possible strategies for implementing guidance for primary production could address issues specific to different spices, growing practices/environments, and different available resources. Best practices for training and education resulting from these efforts should be shared as they could be used to enhance the efficacy of other training/education initiates. Development of these new educational tools will require resources and would likely benefit from a collaboration that includes primary spice producers, secondary spice processors, experts in GAPs, and experts in communication. Members of the spice industry have invested much time and effort to understand local regulations, practices, and traditions in different spice producing regions and this information should inform education and training development. Collaborative initiatives in place that might consider taking part in this work include the industry-academia-government Preventive Controls Alliance (FDA, 2013f) or the Joint Institute for Food Safety and Nutrition (JIFSAN)-country specific food safety training partnership (JIFSAN, 2013). The development of a Collaborative Training Centre for Food Safety and Supply Chain Management in Spices and Botanical Ingredients in India is already in progress. The partners in this initiative are the Confederation of India Industry Food Agriculture Centre of Excellence (CII-FACE), Spices Board India, and JIFSAN (Food Agriculture Centre of Excellence, 2013.) FDA participated in the initial “train the trainer” programs by training individuals from the CII-FACE, Spices Board India, Indian government officials, and industry representatives who will support the new initiative.
9.2.2 DISTRIBUTION AND STORAGE
FDA work with governments of spice producing countries to enhance food safety oversight by developing and formalizing programs such as the Indian EIC certificate program. FDA audits of the Indian EIC certificate program suggest that the program is effective in reducing the incidence of contamination in imported Indian black pepper, although some discrepancies in its application were found, as described in Chapter 8. Therefore, it is anticipated that reductions in the prevalence of pathogens and filth in imported spice shipments offered for import to the United States may be realized by expanding (and improving) the current program to include other spices imported from India and developing similar programs with other countries that are major sources of spice in the United States. The relatively large Salmonella-shipment

General Conclusions and Potential Future Mitigation and Control Options | 9
FDA Draft Risk Profile | 130
prevalence for shipments of Indian spices other than black pepper found in the FDA study of FY2007-FY2009 import surveillance data, argues for expansion of the program. The current program provides market advantage to black pepper industry participants because shipments to the United States are no longer subject to DWPE at the border. In the future, the preventive controls, foreign supplier verification program, and voluntary qualified imported program provisions of FSMA (sections 103, 301, and 302 of FSMA) would provide additional incentives and may impact the nature and structure of food safety oversight programs developed. The imported food certification provision of FSMA (section 303 of FSMA) provides FDA with the authority to require a certificate of compliance for imported foods.
Strengthen the capacity of regulatory systems in spice source countries. Many major spice source countries are developing nations with developing food safety systems. Improvements in countries’ food safety systems can significantly improve the quality of spices consumed in the country as well as exports. One strategy employed by India is the creation of “spice parks” where producers and aggregators may bring spice to be cleaned, treated and tested. Capacity-building was one of the major recommendations made by the Institute of Medicine of the National Academies in its report “Ensuring Safe Foods and Medical Products through stronger regulatory systems abroad,” (IOM, 2012) and is an area of emphasis in FSMA. FDA has developed a comprehensive International Food Safety Capacity-Building Plan (FDA, 2013q; discussed in Section 8.1.3.7) to engage both government and industry leaders in food source countries to improve the quality of food produced and exported. As one part of these capacity building efforts, FDA has begun to set up new and expand established international posts in a range of countries and regions including China, India and Latin America.
Improve storage practices for spices. The prevalence of stored product pests in spices observed in shipments of imported spices offered for entry to the United States during FY2007-FY2009 indicates that insanitary storage conditions are not uncommon. Efficient improvement of storage practices would involve a systematic review of the practices employed and prevalence of stored-product pests in spices across the farm-to-table continuum (or other indicators of poor storage practices) to identify the stages and type of practices that contribute the most to the presence of stored-product pests in spices (see research Chapter 10). FDA to improve Import Alert communication. Nearly three quarters (71%) of the firms listed on the generalized Import Alert 99-19 for Salmonella contamination of imported foods were cited for violations in one or more spices. One option is to consider creating a commodity specific import alert for Salmonella and/or filth in spices to enable industry to more easily identify firms on detention and to facilitate tracking and trending analyses. This will communicate to all stakeholders that these specific contaminants may be found in spices. It is not known whether this option would significantly reduce the prevalence of Salmonella or filth in imported shipments of spice because shipments from importers on either the current or proposed import alert would be subject to DWPE. Improvements might be realized if this modification more clearly communicated to the food industry the magnitude of the problem and thereby triggered new efforts to prevent contamination of spice. In addition, FSMA includes import food safety mandates that may lead to reductions in the prevalence of pathogen contamination or filth adulteration in shipments of imported spice in the future, e.g., the preventive controls rule for human food (section 103 of FSMA), the foreign supplier verification program (section 301 of FSMA), the prior notice provision (section 304 of FSMA, final rule issued), and possibly also the imported food certification provision (section 303 of FSMA). Final rules and their implementation may determine the extent to which these mechanisms reduce the prevalence of pathogen or filth adulteration in shipments of imported spices.

General Conclusions and Potential Future Mitigation and Control Options | 9
FDA Draft Risk Profile | 131
9.2.3 PRIMARY AND SECONDARY PROCESSING
FDA, industry and academic experts work together to develop regulations, and potentially guidance, for the spice industry (manufacturers, processors including treatment facilities, packers and holders of spice) on developing food safety plans that include preventive controls. Poor/inconsistent application of appropriate preventive controls was identified as one of the contributing factors leading to contamination of spice with Salmonella or filth. Section 103 of FSMA “Hazard analysis and risk-based preventive controls” requires food facilities to evaluate hazards that could affect food safety, identify and implement preventive controls to prevent hazards, monitor controls and maintain monitoring records, and conduct verification activities. FDA issued the proposed rule “Current Good Manufacturing Practice and Hazard Analysis and Risk-Based Preventive Controls for Human Food” (78 Federal Register 3646, January 16, 2013) that would, when finalized, implement section 103 of FSMA. The proposed rule proposes to require facilities to conduct a hazard analysis, identify hazards reasonably likely to occur, and establish preventive controls for such hazards. There are also proposed requirements for a food safety plan, monitoring and corrective actions for preventive controls, validation of preventive controls, and records. In addition the proposed rule “Foreign Supplier Verification Programs for Importers of Food for Humans and Animals” (78 Federal Register 45730, July 29, 2013) (FDA, 2013t) proposes to require that importers verify that the foods they import are produced using processes and procedures that ensure the same level of safety as food produced in the United States. Guidance could also be developed to support the FSMA rulemakings. Guidance may be specific for spices or included in preventive controls guidance for low-moisture foods and should address environmental sampling. Such guidance would improve awareness of hazards and effective preventive controls. Guidance would be science-based and built off of science-based industry guidance and best practices. Implementation of the guidance by the spice industry may be improved if the guidance is accompanied by outreach following its initial publication. For example, ASTA has been actively engaging the spice industry in webinars about their guidance and presented a webinar on environmental sampling to interested parties in April 2013 (ASTA, 2013). Enhance education and training for primary and secondary spice processors. Poor/inconsistent application of appropriate preventive controls was identified as one of the contributing factors leading to contamination of spice with Salmonella or filth. This option is analogous to that described for primary producers in 9.2.1. A number of guidance documents and reports have been developed by the spice and food industries on preventive controls for primary and secondary processing of spices and low moisture foods (see Section 8.2.2). However, observations and conversations between some spice processors and members of the risk profile development team engaged in educational or inspectional visits revealed lack of awareness or understanding of some provisions in industry spice processing guidance documents. Education and training efforts could include development and application of new strategies to make the information in the documents accessible to all primary and secondary spice processors. Development of practical tools or examples for implementing the guidance for spice processors may also expand implementation of preventive controls. For example, providing floor plans for hygienic design for operations of differing sizes and available resources, ideas on how to adapt facilities and equipment to improve food safety (e.g., sanitary equipment design), and identification of the best approaches for appropriate cleaning and sanitation of spice processing facilities and equipment may be helpful. Already in progress is the development of a Collaborative Training Centre for Food Safety and Supply Chain Management in Spices and Botanical Ingredients in India, described in 9.2.1 (Food Agriculture Centre of Excellence, 2013). FDA develops guidance for industry on the criteria recommended for validation of spice pathogen reduction treatment processes. A significant percentage of reconditioning proposals are rejected by FDA each year and it is suspected that some pathogen reduction treatments applied to spices may not be efficient in reducing the microbial population (evidence that spice shipments/lots that had been subjected to a pathogen reduction treatment were contaminated, although this could have arisen from post-process
General Conclusions and Potential Future Mitigation and Control Options | 9
FDA Draft Risk Profile | 132
contamination). FDA, possibly in collaboration with appropriate professional societies, could establish best practices and develop guidance for testing and verifying the process and protocols used to treat spices to reduce microbial loads. Such guidance would clarify FDA expectations for validation studies and is also likely to help industry improve their treatment processes to deliver consistent effective pathogen reduction treatments and thereby reduce the incidence of contamination across the entire U.S. spice supply. Implementation of the guidance by the spice/processing industry may be improved if the guidance is accompanied by outreach following its initial publication.
Increase (or mandate) application of validated pathogen reduction treatments for reduction of Salmonella to all spices intended for human consumption in the United States at an appropriate point before or after packaging. Our research revealed that some raw spice reaches the consumer. The spice and food manufacturing industries could develop new strategies to increase the application of validated pathogen reduction treatments to spice. As mentioned previously, the proposed rule “Current Good Manufacturing Practice and Hazard Analysis and Risk-Based Preventive Controls for Human Food” (78 Federal Register 3646; January 16, 2013) (FDA, 2013s) proposes to require validation of food safety preventive controls as part of verification. Such a requirement in a final rule would increase the application of validated pathogen reduction treatment of spices for reduction of Salmonella. Because research discussed in this document has revealed that pathogen reduction treatments have not been applied to all spices reaching the consumer, success of such initiatives would likely decrease consumer exposure to potential life threatening microbial diseases. FDA and spice industry increase inspections of foreign and domestic spice warehouses, spice processing, and spice pathogen reduction treatment facilities that include environmental sampling and assess compliance with CGMPS. Our review of spice facility inspections demonstrated that review of hazard analysis and preventive controls during inspections can identify potential problems before contamination occurs. In addition, appropriate and regular environmental sampling within a facility provides an additional assessment of the facility environment, one that is not necessarily captured by an observational inspection alone. In the event of a Salmonella-positive environmental sample, additional sampling in the facility can help to characterize the spatial extent and possibly the source of contamination. Serotyping Salmonella-positive environmental samples can determine whether the organism has been found previously in the facility. This information can also help with identifying and eliminating the contamination source. Such an initiative could also involve training for inspectors on hazards and preventive controls for spices (or low moisture foods) and how to conduct preventive control inspections. Such training would improve awareness of hazards and preventive controls among inspectors. FDA is currently implementing an increase in frequency of foreign and domestic food facility inspections, as required by FSMA. As mentioned above, ASTA presented a webinar on environmental sampling in April 2013, which may encourage adoption and improved application of this food safety tool. The proposed rule “Accreditation of Third-Party Auditors/Certification Bodies to Conduct Food Safety Audits and to Issue Certifications” (78 Federal Register 45781, July 29, 2013) (FDA, 2013u), which, when finalized would implement section 307 of FSMA, would increase the capacity for regulatory and consultative audits of spice warehouses, processing and pathogen reduction facilities, once implemented.
9.2.4 RETAIL/END USER
FDA work with CDC and states to develop methods to facilitate collection of spice consumption and purchase information from individual cases and restaurant sub-clusters during outbreak investigations. Attribution of foodborne illnesses to foods, particularly minor ingredients such as spices, is difficult and is often not accomplished during routine outbreak investigations. This information would improve our ability to characterize the public health risk associated with consumption of spices. New tools/methods could be developed for use by state and local partners that will promote rapid collection of key information for traceback investigations. These tools should consider the potential role of ingredients such as spices in food

General Conclusions and Potential Future Mitigation and Control Options | 9
FDA Draft Risk Profile | 133
contamination and could include improved patient/food preparer questionnaires/interviews that would include question(s) about use and consumption of spices and seasonings in the outbreak investigation. The team should also explore methods of using adjunct data sources (e.g., shopper loyalty cards or photo menu cards of dishes consumed at restaurants) to aid investigations. These new strategies will enhance the flow of product information to public health and regulatory agencies during traceback investigations, thereby expediting identification of any common food source. Development and implementation of new tools and methods for outbreak investigations could be facilitated through collaboration between the FDA Coordinated Outbreak Response and Evaluation Network (CORE) and the CDC outbreak and response team. Increase efforts and improve strategies to identify the root cause of ingredient contamination including whether growth in the food or environment contributed to the outbreak. As revealed by the analysis of spice-associated outbreaks presented in this report, root cause of contamination was rarely identified in spice-associated outbreaks. This information is critical for reducing the burden of illness associated with consumption of contaminated spices because it identifies failure(s) in the food safety system. Once failures have been identified, they can be addressed, thereby improving/strengthening the food safety system. As illustrated by the extensive research efforts that went into trying to reveal the location/root cause of contamination in the Salmonella Montevideo outbreak attributed to consumption of black or red pepper-coated salami products, finding the root cause can be extremely difficult, particularly for such a complex supply chain as is typical for spices. Increased efforts could include increased sampling of products and environment at different points in the traceback diagram with serotype determined and NGS analyses or other appropriate subtyping analysis performed. FDA’s CORE would likely lead the development of new strategies to better obtain root cause information. Public health agency scientists involved in outbreak investigations enumerate pathogens in samples of food and ingredients in the food-chain that have been identified as having strains identical to the outbreak strain. Enumeration of pathogens such as Salmonella is rarely pursued during outbreak investigations but this information can provide data to indicate the relative role of CGMP and supply-chain failures in the outbreak (e.g., a high concentration of Salmonella in a spice could be indicative of conditions that supported growth of the microorganism). Enumeration of the implicated food in an outbreak will also provide a measure of the actual “dose” consumed, which can be used to estimate the size of the exposed population or to explore the impact of food/patient properties on the probability for illness. This information is critical for application of quantitative risk assessment efforts and can be used to characterize the public health burden associated with pathogen contaminated spice as well as the impact of different mitigation and control options on that burden. Enumeration data gathered during outbreak events could be added to the data resources available for FDA’s risk ranking tool iRisk, which is a publicly available rapid risk assessment and risk ranking tool developed by FDA. Develop new strategies to identify related illnesses attributed to spices or other low-moisture/long shelf-life foods. Retail packages of spices and other low moisture or shelf-stable products have the potential of being used by a large number of consumers over very long periods (years). As a result related illnesses may be spread out in time and space. Serotype/PFGE data are very helpful in identifying related illnesses, particularly when clustered in time. When serotypes are rare, related illnesses may be able to be linked across time and space. However, when common serotypes are involved, sequencing information, such as afforded by Next Generation Sequencing, are likely needed to link these illnesses across time and space. NIH/NCBI's Sequence Read Archive (SRA) is currently being developed to collect these data (NCBI, 2013). The data deposited in the SRA will be available for public download without geographic and/or political restrictions. The SRA is part of the international partnership of archives (INDSC) at NIH/NCBI, the European Bioinformatics Institute, and the DNA Database of Japan. Data submitted to any of these 3 sites will be shared among them. These new tools will enable researchers to identify more outbreaks, which would lead to a better characterization of the public health risk associated with consumption of spices. The data collected may also provide information such as the regional origin of the pathogen causing illness, which can significantly aid in the determining of root cause/system failures.
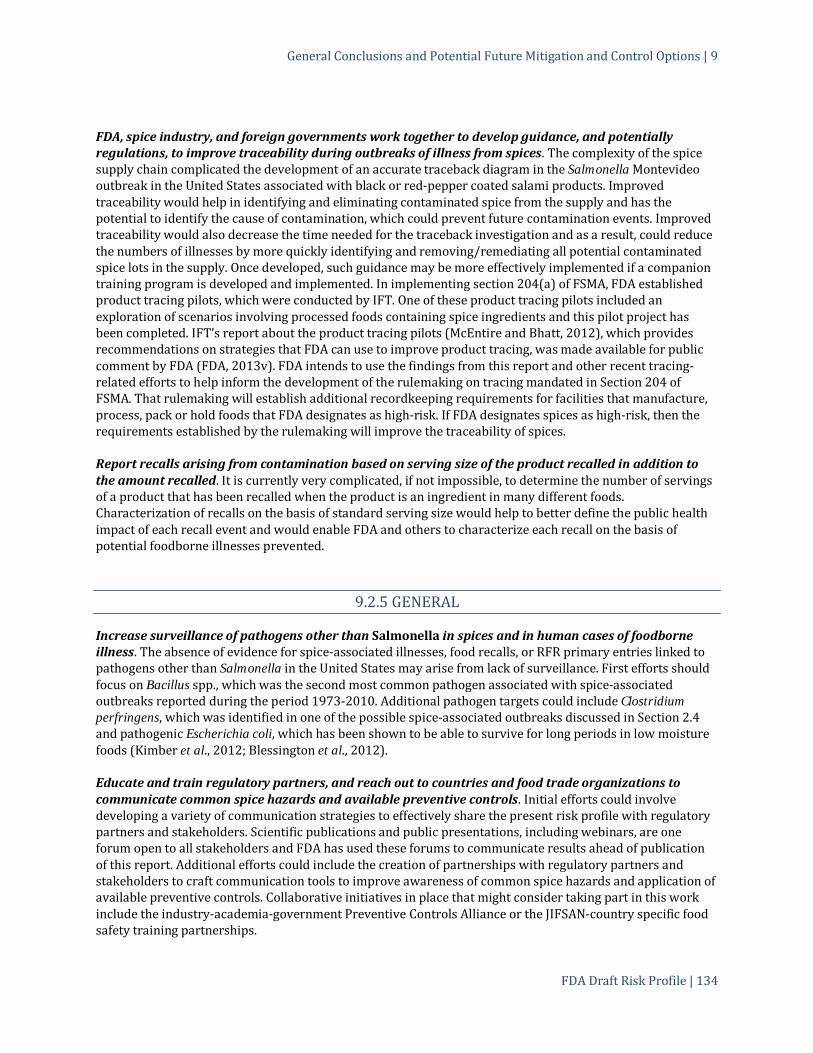
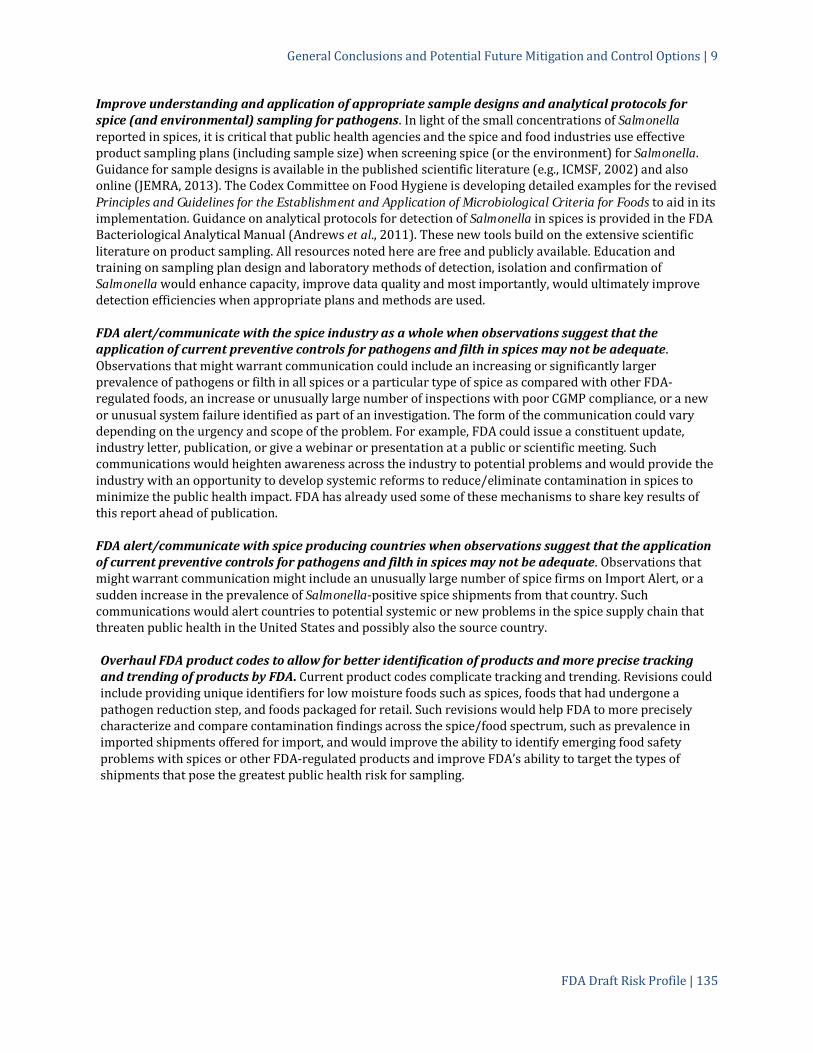

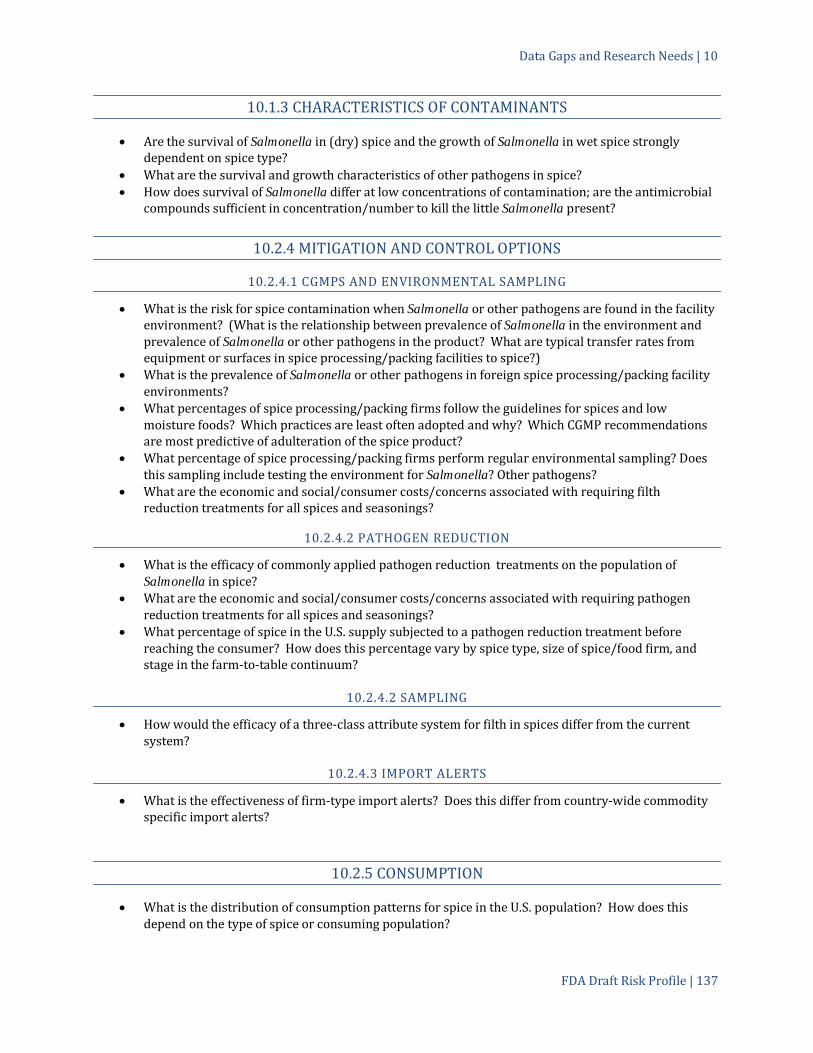

Data Gaps and Research Needs | 10
FDA Draft Risk Profile | 138
• What is the relative frequency of consuming uncooked spice among the various U.S. populations? Are there spices that are more frequently consumed raw or added to foods near the end of cooking? Are there cuisines or specific foods in which raw/lightly cooked spice is generally included?
10.2 RESEARCH NEEDS
10.2.1 FOODBORNE OUTBREAKS
Research novel methods/strategies to efficiently identify the contaminated ingredient in foodborne illness outbreaks. Such methods would improve foodborne illness attribution. Research novel methods/strategies to efficiently identify the root cause in a foodborne outbreak involving spices. Such methods would identify failures in the spice food safety system, which would enable the spice industry to improve these systems. Research novel methods/strategies to efficiently traceback spice ingredients to their original source. Traceback for spices can be very complicated because of the multiple sources, suppliers, processors, packers, food manufacturers and retail establishments that may be involved. Novel strategies are needed to more quickly understand the complex web of relationships.
10.2.2 PREVALENCE AND CONCENTRATION OF PATHOGENS AND FILTH IN SPICES
Determine the distribution and concentration of Salmonella in spices at critical points in the farm-to-table continuum. Much data are needed to determine the relative importance of contamination at different stages of the spice supply chain, including studies of spices at production, before undergoing a pathogen reduction treatment, and at U.S. retail. Interpretation of analyzed data would be enhanced if the data collected would distinguish pathogen reduction treated spices and spices that had not undergone a pathogen reduction treatment as well as spice type. Determine the prevalence and concentration of pathogens other than Salmonella in spices at critical points in the farm-to-table continuum. A wide diversity of pathogens have been identified in spices outside the United States including Bacillus spp. which have been reported to have caused human illness from consumption of contaminated spice. Research should include pathogens detected in spices as well as pathogenic Escherichia coli strains (e.g., O104) which have been identified in sprouts of seeds commonly used as spices. Surveillance data are especially needed at the point of import, in spice/food processing facilities, and at retail in the United States.
Determine the prevalence of different kinds of filth at critical points in the farm-to-table continuum. The prevalence of stored product pests in spices observed in shipments of imported spices offered for entry to the United States during FY2007-FY2009 indicates that insanitary storage conditions are not uncommon. A systematic review of the practices employed and prevalence of stored-product pests in spices across the farm-to-table continuum (or other indicators or poor storage practices) would be able to identify the stages and type of practices that contribute the most to the presence of stored-product pests in spices. Similarly, prevalence data on other types of filth along the farm-to-table continuum may reveal additional weaknesses in the food safety system. Determine the prevalence of filth at retail in the United States. These data would reveal whether spice contamination with filth has improved since the establishment of DALs.

Data Gaps and Research Needs | 10
FDA Draft Risk Profile | 139
Determine the relationship between prevalence and concentration of Salmonella in the spice processing environment and Salmonella in spices. These data would better characterize the potential role of cross-contamination from the spice-processing environment to the spice in facilities where Salmonella is present, and could include quantitative measures of transfer (e.g., coefficients). Determine the percentage of firms that receive pathogen reduction treated spice or that treat spice to eliminate pathogens and the percentage of firms that perform regular environmental sampling for Salmonella. These data would provide information about extent of application of these preventive controls in the spice industry.
10.2.3 CHARACTERISTICS OF CONTAMINANTS
Determine how survival of Salmonella in dry spice and growth of Salmonella in wet/moist spice varies with spice type. This research extends the research initiated by FDA on black pepper and would provide a more comprehensive understanding of survival and potential for growth in spices.
Determine whether Salmonella survival in spice is strongly dependent on the initial numbers/concentration introduced. Contamination concentrations detected in “naturally” contaminated samples are small compared with the concentrations used in survival and growth studies. Data are needed to determine whether at low concentrations of contamination, other factors, such antimicrobial compounds present in the spice, lead to different survival rates.
Determine survival and potential for growth of other pathogens in spices. Research should include pathogens detected in spices as well as pathogenic Escherichia coli strains (e.g., O104) which have been identified in sprouts of seeds commonly used as spices.
10.2.4 MITIGATION AND CONTROL OPTIONS
Identify and characterize appropriate surrogate microorganisms that can produce similar inactivation results as Salmonella for specific technologies in specific spices. Optimal surrogates should be nonpathogenic, have inactivation kinetics that can predict reductions in Salmonella populations, be stable and exhibit consistent growth characteristics, easy to prepare in high-density populations, easy to enumerate and differentiate from other microflora, and have injury susceptibility similar to Salmonella. Measure the relative efficacy of Salmonella reduction processes commonly used on spices and validate mitigation treatments. The study should include evaluation of the impact of spice form (whole/cracked/ground), equipment design, and critical parameters on the efficacy of Salmonella reduction using a variety of treatment processes commonly used on spices. This effort should also address surrogate selection, inoculum preparation, and detection/enumeration of desiccation-stressed salmonellae in spices. Data from such a study would provide critical information to FDA and the spice industry. Develop new and improved methods of dry cleaning and sanitation that are effective in reducing the prevalence and concentration of Salmonella (and other microbial pathogens). The research should include efficacy and validation studies. Determine the economic and social/consumer costs/concerns associated with requiring pathogen reduction treatments for all spices and seasonings. The research should include a survey that assesses consumer acceptance of spices treated with the most commonly applied pathogen reduction treatment technologies and study to determine the economic impact of a mandate.

Data Gaps and Research Needs | 10
FDA Draft Risk Profile | 140
Determine the economic and social/consumer costs/concerns associated with requiring all spices receive treatment to remove filth. This research would be needed before a new regulation could be developed. The research should include a survey to assess consumer tolerance of natural and unavoidable defects in food. Develop a rapid accurate method to measure mold in spices. Analysis for mold, especially in ground spices, is time consuming and complex. Development of a rapid method for detection of mold in spices would allow more samples to be analyzed more accurately and would lead to a better characterization of the prevalence of mold in spices across the supply chain. Develop a rapid method for screening and/or quantifying filth in spices. Current methods are labor intensive and time consuming, thereby limit the annual capacity for filth sampling by FDA, the spice and food industries. Development of a rapid analytical method would increase capacity for filth analysis. Optimize methods for detection and enumeration of Salmonella (and other pathogens) in spices. Detection of pathogens such as Salmonella in spices is challenging for a number of reasons including the desiccated state of bacteria and the presence of antimicrobial compounds in some spices. Contamination concentration is needed to determine probability of illness, efficacy of pathogen reduction treatments, magnitude of growth, and other factors that can help determine root cause in outbreak/contamination investigations yet is rarely collected. Current methods are slow and labor intensive. Rapid reliable analytical methods for both detection and enumeration would improve capacity for government agencies and the spice/food industry to collect these data.
Determine the impact of a three-class attribute system for the evaluation of filth in foods on the quality and food safety of foods. Such a system would eliminate marginally compliant foods from the food supply and thereby improve the quality and food safety of foods. A three-class system increases the ability to detect food lots that have widespread but low concentrations of filth. Determine metrics and develop plans to assess the efficacy of mitigation and control options including guidance. Better measures of the public health impact of different mitigation and control options will lead to a better characterization of the relative reduction in public health risk afforded by different types of options and will ultimately lead to the development of more effective options.
10.2.5 CONSUMPTION
Determine the fraction and type of spices consumed that had never received a pathogen reduction step (including cooking). These data should distinguish among spice type, cuisine, type of use, and food preparation setting (e.g., food manufacturers, institution, restaurant, or home). This information will help to characterize the public health risk posed by contaminated spices and help to identify the most likely populations to consume contaminated spices. Further characterization could be realized if the fraction and type of spices consumed as “partially cooked” spice (spice added to foods near the end of cooking where the heat treatment may be inefficient) could be estimated. Determine the distribution and variability of spice consumption servings among general and susceptible U.S. populations. This information cannot be accurately determined with NHANES data. Such data are needed to quantitative characterize the public health risk associated with spice consumption and would be most useful if it included additional data about high consumers and susceptible populations.
Conduct research to determine the fraction and type of spices eaten raw. Research should assess the fraction of spices consumed in the United States that never undergo a pathogen reduction treatment (including cooking), preferably by type of spice.

Data Gaps and Research Needs | 10
FDA Draft Risk Profile | 141
10.2.6 GENERAL
Develop a quantitative risk assessment to estimate the risk of illness from consumption of spices and determine the relative effectiveness of potential control options to minimize the risk of illness from consumption of spices. The risk assessment would have to address differences among spices or groups of spices. Comparison of the impact of different potential mitigation and control options on predicted risk of illness estimates (e.g., risk of illness per spice serving or annual per capita risk of illness) will provide information for all stakeholders to make appropriate risk management decisions. However, much of the data that would be needed for a fully quantitative model is lacking. FAO is currently engaged in evaluating the risk posed by consumption of spices (FDA, 2012f).

FDA Draft Risk Profile | 142
11. REFERENCES
Abd, S.J., K.L. McCarthy, and L.J. Harris. 2012. Impact of storage time and temperature on thermal inactivation of Salmonella Enteritidis PT 30 on oil-roasted almonds. J. Food Sci. 77(1):M42-M47. Abou Donia, M.A. 2008. Microbiological quality and aflatoxinogenesis of Egyptian spices and medicinal plants. Global Vet. 2(4):175-181. Aguilera, M.O., P.V. Stagnitta, B. Micalizzi, and A.M.S. de Guzman. 2005. Prevalence and characterization of Clostridium perfringens from spices in Argentina. Anaerobe 11:327-334. Ahene, R.E., G.T. Odamtten, and E. Owusu. 2011. Fungal and bacterial contaminants of six spices and spice products in Ghana. Afr. J. Envi. Sci. Tech. 5(9):633-640. Aksu, H., K. Bostan and O. Ergun. 2000. Presence of Bacillus cereus in packaged some spices and herbs old in Istanbul. Pakistan J Biol. Sci. 3(5):710-712. Aktug, S.E., and M. Karapinar. 1986. Sensitivity of some common food-poisoning bacteria to thyme, mint and bay leaves. Int. J. Food Microbiol. 3(6):349-354. Alam, M.K, N. Choudhury, N.A. Chowdhury and Q.M. Youssouf. 1992. Decontamination of spices by gamma radiation. Letter Appl. Microbiol. 14:199-202. Al-Delaimy, K.S., and S.H. Ali. 1970. Antibacterial action of vegetable extracts on the growth of pathogenic bacteria. J. Sci. Food Agric. 21(2):110-112. Allard, M.W., Y. Luo, E. Strain, C. Li, C.E. Keys, I. Son, R. Stones, S.M. Musser, and E.W. Brown. 2012. High resolution clustering of Salmonella enterica serovar Montevideo strains using a next-generation sequencing approach. BMC Genomics, 13:32. Almela, L., J.M. Nieto-Sandoval, and J.A. Fernandez Lopez. 2002. Microbial inactivation of paprika by a high-temperature short-x time treatment. Influence on color properties. J. Agric. Food Chem. 50:1435-1440. Altieri, A. and T. Robinson. 2013. RASFF notifications on selected biological hazards (2001-2011): Summary statistics. Personal Communication. Available from FDA upon request. American Dehydrated Onion and Garlic Association (ADOGA). 2005. Official Standard and Methods, 14th edition, April 2005. American Sesame Growers Association (ASGA). 2012. U.S. Grown Sesame: Some Quick Facts About Sesame. Available at: http://www.sesamegrowers.org/quick%20facts.htm. Accessed 25 Jan. 2013. American Spice Trade Association (ASTA). 2013. Environmental Monitoring Program Workshop for the Spice Industry, April 3, 2013. Available at: http://www.eurofinsus.com/downloads/asta_emp_agenda.pdf. Accessed 26 Jun. 2013. American Spice Trade Association (ASTA). 2012. Spice list. Available at: http://www.astaspice.org/i4a/pages/index.cfm?pageid=3723. Accessed 21 Jan. 2013.
References | 11
FDA Draft Risk Profile | 143
American Spice Trade Association (ASTA). 2011. Clean, safe spices: Guidance from the American Spice Trade Association. The American Spice Trade Association, Washington, D.C. Available at: http://www.astaspice.org/i4a/pages/index.cfm?pageid=4200. Accessed 16 Jan. 2013. American Spice Trade Association (ASTA). 2010. Attachment IV – “ASTA Data Request Consolidation (Aggregated) Report – [American Spice Trade Association (ASTA)(McDermott Will & Henry)-Comment]re: FDA-2-1—N-0195-0014. Available at: http://docketwrench.sunlightfoundation.com/#document/FDA-2010-N-0195-0018. Accessed July 2013. American Spice Trade Association (ASTA). 2008. Clean spices- A guidebook for shippers of products to the U.S. spice trade. Available at: http://docketwrench.sunlightfoundation.com/#document/FDA-2010-N-0195-0017. Accessed July 2013. American Spice Trade Association (ASTA). 2006. HACCP guide for spices and seasonings. Available at: http://astaspice.org/i4a/pages/index.cfm?pageID=3359. Accessed 8 Oct. 2010. Andersson, Y., B. de Jong, , L. Hellström, U. Stamer, and R. Wollin., J. Giesecke. 2001. Salmonella Typhimurium outbreak in Sweden from contaminated jars of helva (or halva). Eurosurveill. 5(29):pii=1715. Available at: http://www.eurosurveillance.org/ViewArticle.aspx?ArticleId=1715. Accessed 15 Oct. 2010. Andrews, W.H., and T.S. Hammack. 2003. U.S. Food and Drug Administration, Bacteriological Analytical Manual: Food Sampling/Preparation of Sample Homogenate. Available at: http://www.fda.gov/Food/FoodScienceResearch/LaboratoryMethods/ucm063335.htm. Accessed 5 Jun. 2013. Andrews, W.H., A. Jacobson, and T.S. Hammack. 2011. U.S. Food and Drug Administration, Bacteriological Analytical Manual: Chapter 5: Salmonella. Available at: http://www.fda.gov/Food/FoodScienceResearch/LaboratoryMethods/ucm070149.htm. Accessed 3 Jun. 2013. Antai, S.P. 1998. Study of the Bacillus flora of Nigerian spices. Int. J. Food Microbiol. 6(3): 259-261. AOAC International. 2005a. Official Methods of Analysis, AOAC 966.23. “Microbiological Methods.” Available at: http://www.eoma.aoac.org/methods/info.asp?ID=46660. Accessed 3 Jul. 2013. AOAC International. 2005b. Official Methods of Analysis, AOAC 966.24. “Coliform Group and Escherichia coli in Tree Nut Meats.” Available at: http://www.eoma.aoac.org/methods/info.asp?ID=46677. Accessed 3 Jul. 2013. AOAC International. 2005c. Official Methods of Analysis, AOAC 991.14. “Coliform and Escherichia coli Counts in Foods.” Available at: http://www.eoma.aoac.org/methods/info.asp?ID=46949. Accessed 3 Jul. 2013. AOAC International. 2005d. Official Methods of Analysis, AOAC 978.24. “Salmonella spp. in Foods.” Available at: http://www.eoma.aoac.org/methods/info.asp?ID=47663. Accessed 3 Jul. 2013. AOAC International. 2005e. Official Methods of Analysis, AOAC 991.13. “Salmonella, Escherichia coli, and other Enterobacteriaceae in foods.” Available at: http://www.eoma.aoac.org/methods/info.asp?ID=47697. Accessed 3 Jul. 2013. AOAC International. 2007a. Official Methods of Analysis, AOAC 2001.07. “Salmonella in Selected Foods.” Available at: http://www.eoma.aoac.org/methods/info.asp?ID=48241. Accessed 3 Jul. 2013.

References | 11
FDA Draft Risk Profile | 144
AOAC International. 2007b. Official Methods of Analysis, AOAC 2001.08. “Salmonella in Selected Foods.” Available at: http://www.eoma.aoac.org/methods/info.asp?ID=48258. Accessed 3 Jul. 2013. AOAC International. 2007c. Official Methods of Analysis, AOAC 2001.09. “Salmonella in Selected Foods.” Available at: http://www.eoma.aoac.org/methods/info.asp?ID=48275. Accessed 3 Jul. 2013. AOAC International. 2007d. Official Methods of Analysis, AOAC 2004.03. “Salmonella in Foods.” Available at: http://www.eoma.aoac.org/methods/info.asp?ID=5860. Accessed 3 Jul. 2013. Arias-Echandi, M.L., D. Utzinger-Villiger, and R. Monge-Rojas. 1997. Microbiological quality of some powder spices of common use in Costa Rica. Revista de Biología Tropical. 45(1B): 692-694. Arora, D.S, and J. Kaur. 1999. Antimicrobial activity of spices. Int. J. Antimicrob. Agents. 12(3):257-262. ASTM International. 2010. Standard guide for irradiation of dried spices, herbs, and vegetable seasonings to control pathogens and other microorganisms. Available at: http://www.astm.org/Standards/F1885.htm. Accessed 11 Oct. 2010. Banerjee, M., and P.K. Sarkar. 2003. Microbiological quality of some retail spices in India. Food Res. Int. 36:469-474. Barak, J.D. and L.C. Kramer, and L.-Y. Hao. 2011. Colonization of tomato plants by Salmonella enterica is cultivar dependent, and type 1 trichomes are preferred colonization sites. Appl. Environ. Microbiol. 77: 498-504. Barrile, J.C. and J.F. Cone. 1970. Effect of added moisture on the heat resistance of Salmonella Anatum in milk chocolate. Appl. Micro. 19(1):177-178. Bassett, J., T. Jackson, K. Jewell, I. Jongenburger, and M. Zwietering. 2010. Impact of Microbial Distributions on Food Safety. ILSI Europe Report Series. Ed. K. Yates. Coordinator P.R. Jasti. ILSI Europe. Available at: http://www.foodprotection.org/events/european-symposia/11Ede/Bassett.pdf. Accessed 12 Dec. 2011. Baumgartner, A., M. Grand, M. Liniger, and C. Iversen. 2009. Detection and frequency of Cronobacter spp. (Enterobacter sakazakii) in different categories of ready-to-eat foods other than infant formula. Int. J. Food Microbiol. 136: 189-192. Bech, T.B., K. Johnsen, A. Dalsgaard, M. Laegdsmand, O.H. Jacobsen, and C.S. Jacobsen. 2010. Transport and distribution of Salmonella enterica serovar Typhimurium in loamy and sandy soil monoliths with applied liquid manure. Appl. Environ. Microbiol. 76: 710-714. Beki, I, and Z. Ulukanli. 2008. Enumeration of microorganisms and detection of some pathogens in commonly used spices sold openly from retail stores in Kars. G.U. J. Sci. 21(3):79-85. Beuchat, L.R., E. Komitopoulou, H. Beckers, R.P. Betts, F. Bourdichon, S. Fanning, H.M. Joosten, and B.H. Ter Kuile. 2013. Low-water activity foods: Increased concern as vehicles of foodborne pathogens. J. Food Prot. 76(1): 150-172. Beuchat, L.R., and D.A. Mann. 2010. Survival and growth of Salmonella in high-moisture pecan nutmeats, in-shell pecans, inedible nut components, and orchard soil. J. Food Protect. 73: 1975-1985.

References | 11
FDA Draft Risk Profile | 145
Beuchat, L.R. and A.J. Scouten. 2002. Combined effects of water activity, temperature 463 and chemical treatments on the survival of Salmonella and Escherichia coli 464 O157:H7 on alfalfa seeds. J. Appl. Microbiol. 92:382-395. Billing, J. and P.W. Sherman. 1998. Antimicrobial functions of spices: why some like it hot. Quarterly Review of Biology 73:3-49. Blessington, T., E.J. Mitcham, and L.J. Harris. 2012. Survival of Salmonella enterica, Escherichia coli O157:H7, and Listeria monocytogenes on inoculated walnut kernels during storage. J. Food Protect. 75:245-254. Blodgett, R. 2010. Bacteriological Analytical Manual Appendix 2: Most Probable Number from Serial Dilutions. Available from: http://www.fda.gov/Food/FoodScienceResearch/LaboratoryMethods/ucm109656.htm. Accessed 13 Jun. 2013. Bollaerts, K., M. Aerts, C. Faes, K. Grijspeerdt, J. Desulf, and K. Minitiens. 2008. Human salmonellosis: estimation of dose-illness from outbreak data. Risk Analysis. 28(2): 427-440. Brandl, M.T. 2006. Fitness of human enteric pathogens on plants and implications for food safety. Annu. Rev. Phytopathol. 44: 367-92. Brockmann, S.O., I. Piechotowski, and P. Kimmig. 2004. Salmonella in Sesame Seed Products. J. Food Protect. 67(1): 178-180. Brockmann S. 2001. International outbreak of Salmonella Typhimurium DT104 due to contaminated sesame seed products–update from Germany (Baden-Wurttemberg). Euro Surveill. 5(33):pii=1699. Available at: http://www.eurosurveillance.org/ViewArticle.aspx?ArticleId=1699. Accessed 5 Oct. 2010. Brooks, N., A. Regmi, and A. Jerardo. 2009. U.S. Food import patterns, 1998-2007. Available at: http://www.ers.usda.gov/Publications/FAU/2009/08Aug/FAU125/. Accessed 17 Nov. 2010. Brown, J.C., and X. Jiang. 2008. Research note: Prevalence of antibiotic-resistant bacteria in herbal products. J. Food Prot. 71(7):1486-1490. Burt, S. 2004. Essential oils: their antibacterial properties and potential applications in foods – a review. Int. J. Food Microbiol. 94: 223-253. Butz, P., O. Heinisch, and B. Tauscher. 1994. Hydrostatic high pressure applied to food sterilization III: Application to spices and spice mixtures. High Pressure Res. 12:239-243. Buzzanell, P.J., R. Dull, and F. Gray. 1995. The spice market in the United States - Recent developments and prospects. Agri. Info. Bull No. (AIB709) 60. Available at: http://www.ers.usda.gov/Publications/AIB709/. Accessed 11 Oct. 2010. California Department of Public Health, Food and Drug Branch, Emergency Response Unit (CDPH/FDB/ERU). 2010. Investigation of Union International Food Company Salmonella Rissen Outbreak Associated with White Pepper. Available at: http://www.cdph.ca.gov/pubsforms/Documents/fdbEIRUFIC2009.pdf. Accessed 11 Oct. 2012. Calvo, L., and E. Torres. 2010. Microbial inactivation of paprika using high-pressure CO2. J. Supercritical Fluids 52(1):134-141

References | 11
FDA Draft Risk Profile | 146
Cameron, G. 1998. Need to consider Bacillus subtilis as a cause of food poisoning, in Surveillance and Control Notes. New Zealand Pub. Health Rep 5(2): 11. Castelijn, G.A.A., J.-A. Parabirsing, M.H. Zwietering, R. Moezelaar, T. Abee. 2013. Surface behavior of S. Typhimurium, S. Derby, S. Brandenburg and S. Infantis. Vet. Med. 161: 305-314. Ceballos, B.S., N.E. Soares, M.R. Moraes, R.M. Catao, A. Konig, 2003. Microbiological aspects of an urban river used for unrestricted irrigation in the semi-arid region of north-east Brazil. Water Sci. Technol. 47(3): 51-7. Centers for Disease Control and Prevention (CDC). 2013a. Surveillance for foodborne disease outbreaks – United States, 2009-2010. MMWR. 62(03):41-47. Centers for Disease Control and Prevention (CDC). 2013b. Salmonella. Available from: http://www.cdc.gov/Salmonella/general/index.html. Accessed 3 Jul. 2013. Centers for Disease Control and Prevention (CDC). 2012a. Outbreak response team: foodborne disease outbreak surveillance. Available from: http://www.cdc.gov/outbreaknet/surveillance_data.html. Accessed 3 Jan. 2012. Centers for Disease Control and Prevention (CDC). 2012b. Foodborne Diseases Active Surveillance Network (FoodNet). Available from: http://www.cdc.gov/foodnet/data/reports.html. Accessed 3 May. 2013. Centers for Disease Control and Prevention (CDC). 2011. Vital signs: incidence and trends of infection with pathogens transmitted commonly through food--foodborne diseases active surveillance network, 10 U.S. sites, 1996-2010. MMWR. 60(22):749-755. Centers for Disease Control and Prevention (CDC). 2010. Salmonella Montevideo infections associated with salami products made with contaminated imported black and red pepper — United States, July 2009–April 2010. MMWR 59(50):1647-1650. Ceylan, E., and D. Y. C. Fung. 2004. Antimicrobial Activity of Spices. J. Rapid Meth. Autom. Microbiol. 12(1): 1-55. Chalker, R.B., and M.J. Blaser. 1988. A review of human salmonellosis. III. Magnitude of Salmonella infection in the United States. Rev. Infect. Dis. 10:111-124. Chen, Y., V. Scott, N.,T. A. Freier, J. Kuehm, M. Moorman, J. Meyer, T. Morille-Hinds, L. Post, L. Smoot, S. Hood, J. Shebuski, J. Banks. 2009a. Control of Salmonella in low-moisture foods II: Hygiene practices to minimize Salmonella contamination and growth. Food Prot. Trends. July 2009: 435-445. Chen, Y., V. Scott, N., T. A. Freier, J. Kuehm, M. Moorman, J. Meyer, T. Morille-Hinds, L. Post, L. Smoot, S. Hood, J. Shebuski, J. Banks. 2009b. Control of Salmonella in low-moisture foods III: Process validation and environmental monitoring. Food Prot. Trends, August, 2009. P. 493-508. Clopper, C.J., and E.S. Pearson, 1934. The use of confidence or fiducial limits illustrated in the case of the binomial. Biometrika 26:404-413. Codex Alimentarius. Codex Alimentarius Commission (CAC). 2013. International Food Standards. Available at: http://www.codexalimentarius.org/standards/list-of-standards/en/?no_cache=1. Accessed 20 Jun. 2013. Codex Alimentarius. Codex Alimentarius Commission (CAC). 2010. Code of Hygienic Practice for Fresh Fruits and Vegetables. CAC/RCP 53-2003. Available at: http://www.codexalimentarius.org/standards/list-of-

References | 11
FDA Draft Risk Profile | 147
standards/en/?provide=standards&orderField=fullReference&sort=asc&num1=CAC/RCP. Accessed 2 Jul. 2013. Codex Alimentarius. Codex Alimentarius Commission (CAC). 2008. Guidelines for the validation of food safety control measures. CAC/GL 69-2008. Available at: http://www.codexalimentarius.org/standards/list-of-standards/en/?provide=standards&orderField=fullReference&sort=asc&num1=CAC/GL. Accessed 4 Jun. 2013. Codex Alimentarius. Codex Alimentarius Commission (CAC). 2007. Suggested elements to include in a microbial risk profile (Annex I) In: Principles and guidelines for the conduct of microbial risk management (MRM). CAC/GL-63–2007. p.10-11. Available at: http://www.codexalimentarius.org/standards/list-of-standards/en/?provide=standards&orderField=fullReference&sort=asc&num1=CAC/GL. Accessed 7 Jun. 2013. Codex Alimentarius. Codex Alimentarius Commission (CAC). 2003. General Principles of Food Hygiene. CAC/RCP 1-1969. Available at: http://www.codexalimentarius.org/standards/list-of-standards/en/?provide=standards&orderField=fullReference&sort=asc&num1=CAC/RCP. Accessed 5 Jun. 2013. Codex Alimentarius. Codex Alimentarius Commission (CAC). 1995. International Food Standards: Code of hygienic practice for 479 spices and dried aromatic plants. CAC/RCP 42-1995. Available at: http://www.codexalimentarius.org/standards/list-of-standards/en/?provide=standards&orderField=fullReference&sort=asc&num1=CAC/RCP. Accessed 5 Jun. 2013. Codex Alimentarius. Codex Alimentarius Commission (CAC). 1991. Guide for the Microbiological Quality of Spices and Herbs Used in Processed Meat and Poultry Products. CAC/GL 14-1991. Available at: http://www.codexalimentarius.org/standards/list-of-standards/en/?provide=standards&orderField=fullReference&sort=asc&num1=CAC/GL. Accessed 1 Jul. 2013. Combase Consortium. 2012. Combase: DMFit web edition. 482. Available at: http://modelling.combase.cc/membership/ComBaseLogin.aspx?ReturnUrl=%2fD483%20MFit.aspx. Accessed 21 Aug. 2012. Cosano, I., C. Pintado, O. Acevedo, J.L. Novella, G.L. Alonso, M. Carmona, C. de la Rosa, and R. Roger. 2009. Microbiological quality of saffron from the main producer countries. J. Food Protect. 72(10): 2217-2220. Crumrine, M.H., V.D. Foltz, and J.O. Harris. 1971. Transmission of Salmonella Montevideo in wheat by stored product insects. Appl. Microbiol. 22: 578-580. Cui, S., B. Ge, J. Zheng, and J. Meng. 2005. Prevalence and antimicrobial resistance of Campylobacter spp. and Salmonella serovars in organic chicken from Maryland Retail Stores. Appl. Env. Micro. 71(7): 4108-4111. Curry, J.A., M.S. Riddle, R.P. Gormley, D.R. Tribble, and C.K. Porter. 2010. The epidemiology of infectious gastroenteritis related arthritis in U.S. military personnel: a case-control study. BMC Infect. Dis. 10: 266. Danyluk, M. D., M. Nozawa-Inoue, K. R. Hristova, K. M. Scow, B. D. Lampinen, and L. J. Harris. 2008. Survival and growth of Salmonella Enteritidis PT 30 in almond orchard soils. J. Appl. Microbiol. 104:1391-1399. Delmas, G. 2013. Information about the Bacillus cereus outbreak in France in 2007 including the fact that Bacillus cereus was isolated from the spice blend. Personal communication. Available from FDA upon request.

References | 11
FDA Draft Risk Profile | 148
den Bakker, H.C., A.I. Morena Switt, C.A. Cummings, K. Hoelzer, L. Degoricija, L.D. Rodriguez-Rivera, E.M. Wright, R. Fang, M. Davis, T. Root, D. Schoonmaker-Bopp, K.A. Musser, E. Villamil, H. Waechter, L. Kornstein, M.R. Furtado, and M. Wiedman. 2011. A whole genome SNP based approach to trace and identify outbreaks linked to a common Salmonella enterica subsp. enterica servovar Montevideo Pulsed Field Gel Electrophoresis type. Appl. Environ. Microbiol. 77(24):8648-8655. Department of Health, State Government of Victoria, Australia (DOH/Victoria/AU). 2010. Report on a survey of spices for the presence of pathogens - 2007. Available at: http://www.health.vic.gov.au/archive/archive2011/foodsafety/archive/microbiological.htm. Accessed 29 May 2012. DiNovi, M., and A. Edwards. 2013. U.S. Food and Drug Administration. Spice consumption estimates. Personal communication. Available from FDA upon request. Dorman, H.J., and S.G. Deans. 2000. Antimicrobial agents from plants: antibacterial activity of plant volatile oils. J. Appl. Microbiol. 88(2):308-316. Doyle, M.E., and A.S Mazzotta. 2000. Review of studies on the thermal resistance of salmonellae. J. Food Prot. 63(6):779-795. Du, W.-X, M.D. Danyluk, and L.J. Harris. 2010. Efficacy of aqueous and alcohol-based quaternary ammonium sanitizers for reducing Salmonella in dusts generated in almond hulling and shelling facilities. J. Food Sci. 75:M7-M13. Du, W.-X., C.W. Olsen, R.J. Avena-Bustillos, T.H. McHugh, C.E. Levin, and M. Friedman. 2009a. Effects of allspice, cinnamon, and clove bud essential oils in edible apple films on physical properties and antimicrobial activities. J. Food Sci. 74(7): M372-M378. Du, W.-X., C.W. Olsen, R.J. Avena-Bustillos, T.H. McHugh, C.E. Levin, R. Mandrell, and M. Friedman. 2009b. Antibacterial effects of allspice, garlic, and oregano essential oils in tomato films determined by overlay and vapor-phase methods. J. Food Sci. 74(7): M390-M397. DuVernoy, T. 2012. U.S. Food and Drug Administration. Information about the Salmonella Montevideo and Salmonella Senftenberg outbreak in the United States during 2009-2010. Personal communication. Available from FDA upon request. Dworkin M.S., P.C. Shoemaker, M.J. Goldoft, and J.M. Kobayashi. 2001. Reactive Arthritis and Reiter's Syndrome Following an Outbreak of Gastroenteritis Caused by Salmonella Enteritidis. CLIN. INFECT. DIS. 33:1010-1014. Emam, O.A., S.A. Farag, and N.H. Aziz. 1995. Comparative effects of gamma and microwave irradiation on the quality of black pepper. Z. Lebensm. Unters. Forsch 201:557-561. Emer, Z. M.Y. Akbas, and M. Ozdemir. 2008. Bactericidal activity of ozone against Escherichia coli in whole and ground black peppers. J. Food Prot. 71(5):914-917. Entomological Society of America (ESA). 2010. Common names of insects and related organisms database. Available at: http://www.entsoc.org/pubs/common_names. Accessed 20 Jun. 2013. Environmental Protection Agency (EPA). 2012a. What we eat in America –Food Commodity Intake Database, 2003-2006 (WWEIA-FCID 2003-2006). Available at: http://fcid.foodrisk.org/. Accessed 5 Sep. 2012.

References | 11
FDA Draft Risk Profile | 149
Environmental Protection Agency (EPA). 2012b. Federal Insecticide, Fungicide, and Rodenticide Act (FIFRA). Available at: http://www.epa.gov/oecaagct/lfra.html#Summary%20of%20the%20Federal%20Insecticide,%20Fungicide,%20and%20Rodenticide%20Act . Accessed 22 Feb. 2013. Environmental Protection Agency (EPA). 2012c. CFR – Code of Federal Regulations. Title 40 Section 180.151 Ethylene oxide; tolerances for residues. Available at: http://www.gpo.gov/fdsys/pkg/CFR-2012-title40-vol25/pdf/CFR-2012-title40-vol25-part180.pdf. Accessed 10 Jun. 2013. Eruteya, O.C., and S.A. Odunfa. 2009. Antimicrobial properties of three spices used in the preparation of suya condiment against organisms isolated from formulated samples and individual ingredients. Afr. J. Biotech. 8(10):2316-2320. European Commission Directorate General for Health and Consumers (EC/DG SANCO). 2012a. Rapid Alert System for Food and Feed (RASFF): RASFF legal basis. Available at: http://ec.europa.eu/food/food/rapidalert/rasff_legal_basis_en.htm. Accessed 3 Jun. 2013. European Commission Directorate General for Health and Consumers. (EC/ DG SANCO). 2012b. RASFF Portal. Available at: https://webgate.ec.europa.eu/rasff-window/portal/. Accessed 23 May 2012. European Food Safety Authority (EFSA). 2013. EFSA Panel on Biological Hazards (BIOHAZ) Panel; Scientific Opinion on the risk posed by pathogens in food of non-animal origin. Part 1 (outbreak data analysis and risk ranking of food/pathogen combinations). EFSA Journal 2013;11(1):3025. [138 pp.] doi:10.2903/j.efsa.2013.3025. Available at: http://www.efsa.europa.eu/de/efsajournal/pub/3025.htm. Accessed 15 Jan. 2013. European Food Safety Authority (EFSA). 2012. The European Union summary report on trends and sources of zoonoses, zoonotic agents and food-borne outbreaks in 2010. EFSA Journal 10(3): 2597-3038. Available at: http://www.efsa.europa.eu/en/efsajournal/all.htm. Accessed 1 Feb. 2013. European Food Safety Authority (EFSA). 2011a. The European Union summary report on trends and sources of zoonoses, zoonotic agents and food-borne outbreaks in 2009. EFSA Journal 9(3): 2090-2467. Available at: http://www.efsa.europa.eu/en/efsajournal/all.htm. Accessed 1 Feb. 2013. European Food Safety Authority (EFSA). 2011b. EFSA Zoonosis Monitoring: Denmark: Trends and sources of zoonoses and zoonotic agents in humans, foodstuffs, animals and feeding stuffs in 2010. Available at: http://www.efsa.europa.eu/en/scdocs/doc/zoocountryreport10dk.pdf/. Accessed 1 Feb. 2013. European Food Safety Authority (EFSA). 2011c. Scientific Opinion on the risk posed by Shiga Toxin-producing E. coli (STEC) and other pathogenic bacteria in seeds and sprouted seeds. EFSA Journal 2011;9(11):2424. Available at http://www.efsa.europa.eu/en/efsajournal/doc/2424.pdf. Accessed 29 Dec. 2011. European Food Safety Authority (EFSA). 2011d. Scientific Report of EFSA: Shiga Toxin-producing E. coli (STEC) O104:h4 2011 outbreaks in Europe: Taking Stock. EFSA Journal 2011;9(10):2390. Available at: http://www.efsa.europa.eu/en/efsajournal/pub/2390.htm. Accessed 28 Dec. 2011. European Food Safety Authority (EFSA). 2011e. Slovenia: Trends and sources of zoonoses and zoonotic agents in humans, foodstuffs, animals and feeding stuffs in 2010. Available at: http://www.efsa.europa.eu/en/home/doc/Report_2004_Slovenia_edited.pdf. Accessed 5 Jun. 2013.

References | 11
FDA Draft Risk Profile | 150
European Food Safety Authority (EFSA). 2010a. Community Summary Reports: Trends and sources of zoonoses and zoonotic agents and food-borne outbreaks in 2008. EFSA Journal; 2010 8(1):1496-1905. Available at: http://www.efsa.europa.eu/en/efsajournal/pub/1496.htm. Accessed 2 Feb. 2013. European Food Safety Authority (EFSA). 2010b. Netherlands: Trends and sources of zoonoses and zoonotic agents in humans, foodstuffs, animals and feeding stuffs in 2009. Available at: http://www.efsa.europa.eu/en/scdocs/doc/zoocountryreport09nl.pdf. Accessed 7 Feb. 2013. European Food Safety Authority (EFSA). 2009a. Community Summary Report: Food-borne outbreaks in the European Union in 2007. EFSA Journal (2009), 271. Available at: http://www.efsa.europa.eu/en/efsajournal/pub/271r.htm. Accessed 5 Jun. 2013. European Food Safety Authority (EFSA). 2009b. Community Summary Reports: Trends and sources of zoonoses and zoonotic agents and food-borne outbreaks in 2007. Available at: http://www.efsa.europa.eu/en/efsajournal/pub/223r.htm. Accessed 5 Jun. 2013. European Food Safety Authority (EFSA). 2007a. Community Summary Reports: Trends and sources of zoonoses and zoonotic agents, antimicrobial resistance and foodborne outbreaks in 2006. Available at: http://www.efsa.europa.eu/en/efsajournal/pub/130r.htm. Accessed 14 Feb. 2013. European Food Safety Authority (EFSA). 2007b. Slovenia: Trends and sources of zoonoses and zoonotic agents in humans, foodstuffs, animals and feeding stuffs in 2006. Available at: http://www.efsa.europa.eu/en/scdocs/doc/Report_2006_Slovenia.pdf. Accessed 7 Feb. 2013. European Food Safety Authority (EFSA). 2006a. Community Summary Reports: Trends and sources of zoonoses and zoonotic agents and food-borne outbreaks in 2005. Available at: http://www.efsa.europa.eu/en/efsajournal/pub/94r.htm. Accessed 7 Feb. 2013. European Food Safety Authority (EFSA). 2006b. Slovenia: Trends and sources of zoonoses and zoonotic agents in humans, foodstuffs, animals and feeding stuffs in 2005. Available at: http://www.efsa.europa.eu/en/scdocs/doc/zoon_report_2005_Slovenia_en.pdf. Accessed 7 Feb. 2013. European Spice Association (ESA). 2011. European spice association quality minima document. Available at: http://www.esa-spices.org/index-esa.html/publications-esa. Accessed 8 Feb. 2013. Ewing, W.H. 1986. Antigenic Schema for Salmonella. In Edwards and Ewing’s Identification of Enterobacteriaceae, 4th ed. Elsevier, New York. pp. 247-318. Farag, S.E., N.H. Aziz, and E.S. Attia. 1995. Effect of irradiation on the microbiological status and flavouring materials of selected spices. Z. Lebensm. Unters. Forsch. 201(3):283-288. Farag Zaied, S.E.A., N.H. Aziz, and A.M. Ali. 1996. Comparing effects of washing, thermal treatments and gamma irradiation on quality of spices. Nahrung. 40(1):32-36. Farbood, M.I., J.H. MacNeil, and K. Ostovar. 1976. Effect of rosemary spice extractive on growth of microorganisms in meats. J. Milk Food Technol. 39(10):657-679. Farkas, J., and E. Andrássy. 1984. Comparative investigation of some effects of gamma radiation and ethylene oxide on aerobic bacterial spores in black pepper. Microbial Associations and Interactions in Food July 12–15, 1983: Proceedings of IUMS-ICFMH 12th International Symposium, Budapest, Hungary, Akadémiai Kiadó, Budapest. pp. 393-399.
References | 11
FDA Draft Risk Profile | 151
Fedoruk, A. 2011. Development of a quantitative microbial risk assessment model for foodborne pathogens in herbs and spices. Canadian Theses. Library and Archives Canada. Ottawa. p. 36. Fine, F. and P. Gervais. 2004. Efficiency of pulsed UV light for microbial decontamination of food powders. J. Food Prot. 67(4):787-792. Finn, S., K. Handler, O. Condell, A. Colgan, S. Cooney, P. McClure, A. Amezquita, J.C.D. Hinton, and S. Fanning. 2013. ProP is required for the survival of desiccated Salmonella enterica serovar Typhimurium cells on a stainless steel surface. Appl. Environ. Microbiol. 79(14):4376-4384. Fisher, I., Y. Andersson, B. de Jong, K. O’Grady, and J. Powling. 2001. International outbreak of Salmonella Typhimurium DT104–update from Enter-net. Eurosurveill. 5(32): pii=1705. Available at: http://www.eurosurveillance.org/ViewArticle.aspx?PublicationType=W&Volume=5&Issue=32&OrderNumber=1. Accessed 11 Oct. 2010. Food Agriculture Centre of Excellence. 2013. Spices Board and CII-Face join hands with JIFSAN, USA to strength Supply Chain of Spices and Botanical Ingredients. Available from: http://face-cii.in/spices-board-and-cii-face-join-hands-jifsan-usa-strengthen-supply. Accessed 5 Jul. 2013. Food and Agriculture Organization of the United Nations (FAO). 2013a. FAO GAP Principles. Available at: http://www.fao.org/prods/GAP/home/principles_en.htm. Accessed 25 Feb. 2013. Food and Agriculture Organization of the United Nations (FAO). 2013b. FAOSTAT. Available at: http://faostat3.fao.org/home/index.html. Accessed 2 Jul. 2013. Food and Drug Administration (FDA). 2013a. FDA Foods and Veterinary Medicine Program. The Reportable Food Registry: Targeting Inspection Resources and Identifying Patterns of Adulteration. Third Annual Report: September 8, 2011 – September 7, 2012. Available at: http://www.fda.gov/Food/ComplianceEnforcement/RFR/ucm200958.htm. Accessed 5 Jun. 2013. Food and Drug Administration (FDA). 2013b. Real Progress in Food Code Adoptions. Available at: http://www.fda.gov/Food/GuidanceRegulation/RetailFoodProtection/FederalStateCooperativePrograms/ucm108156.htm. Accessed 5 Jun. 2013. Food and Drug Administration (FDA). 2013c. Letter. Recalls, Market Withdrawals, and Safety Alerts: Background and Definitions. Available at: http://www.fda.gov/Safety/Recalls/ucm165546.htm. Accessed 5 Jun. 2013. Food and Drug Administration (FDA). 2013d. Reportable Food Registry. Available at: www.fda.gov/ReportableFoodRegistry. Accessed 5 Jun. 2013. Food and Drug Administration (FDA). 2013e. FSMA Proposed Rule for Produce Safety Standards for the Growing, Harvesting, Packing, and Holding of Produce for Human Consumption. Available at: http://www.fda.gov/Food/GuidanceRegulation/FSMA/ucm334114.htm. Accessed 10 Jun. 2013. Food and Drug Administration (FDA). 2013f. Food Safety Modernization Act (FSMA): Food Safety Preventive Controls Alliance (FSPCA). Available at: http://www.fda.gov/Food/GuidanceRegulation/FSMA/ucm284406.htm. Accessed 10 Jun. 2013. Food and Drug Administration (FDA). 2013g. Defect Levels Handbook. The Food Defect Action Levels. Available at:

References | 11
FDA Draft Risk Profile | 152
http://www.fda.gov/Food/GuidanceRegulation/GuidanceDocumentsRegulatoryInformation/SanitationTransportation/ucm056174.htm. Accessed 5 Jun. 2013. Food and Drug Administration (FDA). 2013h. Import Alerts by Number. Available at: http://www.accessdata.fda.gov/cms_ia/ialist.html. Accessed 3 Jun. 2013. Food and Drug Administration (FDA). 2013i. Import Alert 99-19. Available at: http://www.accessdata.fda.gov/cms_ia/importalert_263.html. Accessed 3 Jun. 2013. Food and Drug Administration (FDA). 2013j. Import Alert 28-02. Available at: http://www.accessdata.fda.gov/cms_ia/importalert_90.html. Accessed 3 Jun. 2013. Food and Drug Administration (FDA). 2013k. Import Alert 24-11. Available at: http://www.accessdata.fda.gov/cms_ia/importalert_76.html. Accessed 17 Jun. 2013. Food and Drug Administration (FDA). 2013l. Recalls, Market Withdrawals, and Safety Alerts. Available at: http://www.fda.gov/Safety/Recalls/default.htm. Accessed 2 Jul. 2013. Food and Drug Administration (FDA). 2013m. FDA Food Code. Available from: http://www.fda.gov/Food/GuidanceRegulation/RetailFoodProtection/FoodCode/default.htm. Accessed 27 May 2013. Food and Drug Administration (FDA). 2013n. FDA Food Code 2009: Chapter 1 - Purpose & Definitions. http://www.fda.gov/Food/GuidanceRegulation/RetailFoodProtection/FoodCode/ucm186464.htm. Accessed 27 May 2013.
Food and Drug Administration (FDA). 2013o. FDA Food Safety Modernization Act (FSMA). Available from: http://www.fda.gov/Food/GuidanceRegulation/FSMA/default.htm. Accessed 5 Jul. 2013.
Food and Drug Administration (FDA). 2013p. Public Health Services Act. Available from: http://www.fda.gov/RegulatoryInformation/Legislation/ucm148717.htm. Accessed 21 Jul. 2013.
Food and Drug Administration (FDA). 2013q. International Capacity Building. Available from: http://www.fda.gov/Food/GuidanceRegulation/FSMA/ucm301708.htm#law_sections. Accessed 24 Jul. 2013.
Food and Drug Administration (FDA). 2013r. CFR – Code of Federal Regulations Title 21, Part 1, Subpart I– Prior notice of Imported Food, Section 1.276 What definitions apply to this subpart? Available from: http://www.accessdata.fda.gov/scripts/cdrh/cfdocs/cfcfr/CFRSearch.cfm?fr=1.276. Accessed 22 Aug. 2013.
Food and Drug Administration (FDA). 2013s. FSMA Proposed Rule for Preventive Controls for Human Food: Current Good Manufacturing Practice and Hazard Analysis and Risk-Based Preventive Controls for Human Food. Available at: http://www.fda.gov/Food/GuidanceRegulation/FSMA/ucm334115.htm. Accessed 20 Sept. 2013.
Food and Drug Administration (FDA). 2013t. FSMA Proposed Rule for Foreign Supplier Verification Programs (FSVP) for Importers of Food for Humans and Animals. Available at: http://www.fda.gov/Food/GuidanceRegulation/FSMA/ucm361902.htm. Accessed 20 Sept. 2013.
Food and Drug Administration (FDA). 2013u. FSMA Proposed Rule on Accreditation of Third-Party Auditors. Available at: http://www.fda.gov/Food/GuidanceRegulation/FSMA/ucm361903.htm. Accessed 20 Sept. 2013.

References | 11
FDA Draft Risk Profile | 153
Food and Drug Administration (FDA). 2013v. Product Tracing. Available at: http://www.fda.gov/Food/GuidanceRegulation/FSMA/ucm270851.htm. Accessed 25 Sept. 2013.
Food and Drug Administration (FDA). 2012a. FDA Foods Program. The Reportable Food Registry: A New Approach to Targeting Inspection Resources and Identifying Patterns of Adulteration. First Annual Report: September 8, 2009-September 7, 2010. Available at: http://www.fda.gov/downloads/Food/ComplianceEnforcement/UCM291297.pdf. Accessed 3 Jun. 2013.
Food and Drug Administration (FDA). 2012b. FDA Foods and Veterinary Medicine Program. The Reportable Food Registry: Targeting Inspection Resources and Identifying Patterns of Adulteration. Second Annual Report: September 8, 2010 – September 7, 2011. Available at: http://www.fda.gov/downloads/Food/ComplianceEnforcement/UCM301013.pdf. Accessed 10 Jun. 2013. Food and Drug Administration (FDA). 2012c. National Antimicrobial Resistance Monitoring System-Enteric Bacteria (NARMS): Retail Meat Annual Report, 2010. Department of Health and Human Services. Rockville, MD. Available at: http://www.fda.gov/AnimalVeterinary/SafetyHealth/AntimicrobialResistance/NationalAntimicrobialResistanceMonitoringSystem/ucm059103.htm. Accessed 21 May 2012. Food and Drug Administration (FDA). 2012d. Appendix 3: Factors that affect microbial growth in Bad Bug Book 2nd Edition: Foodborne Pathogen Microorganism and Natural Toxins Handbook. K.A. Lampel, S. Al-Khaldi, and S.M. Cahill, Ed. Available at: http://www.fda.gov/downloads/Food/FoodborneIllnessContaminants/UCM297627.pdf. Accessed 3 Jun. 2013. Food and Drug Administration (FDA). 2012e. Reportable Food Summary Report RFR Commodities Definitions. Available at: http://www.fda.gov/downloads/Food/ComplianceEnforcement/UCM211534.pdf. Accessed 10 Jun. 2013. Food and Drug Administration (FDA). 2012f. CFR – Code of Federal Regulations Title 21, Section 182.10 Spices and other natural seasonings and flavorings. Available at: http://www.accessdata.fda.gov/scripts/cdrh/cfdocs/cfCFR/CFRSearch.cfm?fr=182.10. Accessed 4 Jun. 2013. Food and Drug Administration (FDA). 2012g. CFR – Code of Federal Regulations Title 21, Part 184 Direct food substances affirmed as generally recognized as safe. Available at: http://www.accessdata.fda.gov/scripts/cdrh/cfdocs/cfCFR/CFRSearch.cfm?CFRPart=184&showFR=1. Accessed 5 Jun. 2013. Food and Drug Administration (FDA). 2012h. CFR – Code of Federal Regulations Title 21, Section 110.110 Natural or unavoidable defects in food for human use that present ho health hazard. Available at: http://www.accessdata.fda.gov/scripts/cdrh/cfdocs/cfCFR/CFRSearch.cfm?fr=110.110. Accessed 13 Jun. 2013. Food and Drug Administration (FDA). 2012i. CFR – Code of Federal Regulations Title 21, Part 110 Current good manufacturing practice in manufacturing, packing, or holding human food. Available at: http://www.accessdata.fda.gov/scripts/cdrh/cfdocs/cfCFR/CFRSearch.cfm?CFRPart=110&showFR=1. Accessed 17 Jun. 2013. Food and Drug Administration (FDA). 2012j. Product Code Builder. Available at: http://www.accessdata.fda.gov/SCRIPTS/ORA/PCB/PCB.HTM. Accessed 2 Jul. 2013.

References | 11
FDA Draft Risk Profile | 154
Food and Drug Administration (FDA). 2012k. CFR – Code of Federal Regulations Title 21, Section 179.26(b)(5) Ionizing radiation for the treatment of food. Available at: http://www.accessdata.fda.gov/scripts/cdrh/cfdocs/cfCFR/CFRSearch.cfm?fr=179.26. Accessed 6 Jun. 2013. Food and Drug Administration (FDA). 2012l. CFR – Code of Federal Regulations Title 21, Part 179 Irradiation in the production, processing and handling of food. Available at: http://www.accessdata.fda.gov/scripts/cdrh/cfdocs/cfCFR/CFRSearch.cfm?CFRPart=179&showFR=1. Accessed 7 Jun. 2013. Food and Drug Administration (FDA). 2012m. CFR – Code of Federal Regulations Title 21, Section 179.45 Packaging materials for use during the irradiation of prepackaged foods. Available at: http://www.accessdata.fda.gov/scripts/cdrh/cfdocs/cfCFR/CFRSearch.cfm?fr=179.45. Accessed 5 Jun. 2013. Food and Drug Administration (FDA). 2012n. CFR – Code of Federal Regulations Title 21, Section 179.26c Ionizing radiation for the treatment of food. Available at: http://www.accessdata.fda.gov/scripts/cdrh/cfdocs/cfCFR/CFRSearch.cfm?fr=179.26. Accessed 7 Jun. 2013. Food and Drug Administration (FDA). 2012o. CFR – Code of Federal Regulations Title 21, Section 120 Hazard analysis and critical control point (HACCP) systems. Available at: http://www.accessdata.fda.gov/scripts/cdrh/cfdocs/cfCFR/CFRSearch.cfm?CFRPart=120&showFR=1. Accessed 4 Jun. 2013. Food and Drug Administration (FDA). 2012p. CFR – Code of Federal Regulations Title 21, Section 101.22 Foods; labeling of spices, flavorings, colorings and chemical preservatives. Available at: http://www.accessdata.fda.gov/scripts/cdrh/cfdocs/cfCFR/CFRSearch.cfm?fr=101.22. Accessed 10 Jun. 2013. Food and Drug Administration (FDA). 2012q. CFR – Code of Federal Regulations Title 21, Section 101.4h Food; designation of ingredients. Available at: http://www.accessdata.fda.gov/scripts/cdrh/cfdocs/cfcfr/CFRSearch.cfm?fr=101.4. Accessed 5 Jun. 2013. Food and Drug Administration (FDA). 2011a. Food Safety Modernization Act (FSMA). Full Text of the Law. Available at: http://www.fda.gov/Food/GuidanceRegulation/FSMA/ucm247548.htm. Accessed 2 Jul. 2013. Food and Drug Administration (FDA). 2011b. Guidance for Industry, Process Validation: General Principles and Practices. In: U.S. Department of Health and Human Services, (Ed.): Washington, DC. Available at: http://www.fda.gov/downloads/Drugs/.../Guidances/UCM070336.pdf. Accessed 3 Jun. 2013. Food and Drug Administration (FDA). 2010a. Defect levels handbook the food defect action levels: Levels of natural or unavoidable defects in foods that present no health hazards for humans. Available at: http://www.fda.gov/Food/GuidanceRegulation/GuidanceDocumentsRegulatoryInformation/SanitationTransportation/ucm056174.htm. Accessed 25 May 2013. Food and Drug Administration (FDA). 2010b. Draft Guidance for Industry: Questions and Answers Regarding the Reportable Food Registry (Edition 2). Responsible Party. Available at: http://www.fda.gov/Food/GuidanceRegulation/GuidanceDocumentsRegulatoryInformation/RFR/ucm212793.htm#res. Accessed 3 Jun. 2013. Food and Drug Administration (FDA). 2010c. Draft Guidance for Industry: Questions and Answers Regarding the Reportable Food Registry (Edition 2). Reportable Food. Available at: http://www.fda.gov/Food/GuidanceRegulation/GuidanceDocumentsRegulatoryInformation/RFR/ucm212793.htm#repo. Accessed 17 Jun. 2013.

References | 11
FDA Draft Risk Profile | 155
Food and Drug Administration (FDA). 2010d. FDA Trend analysis report on the occurrence of foodborne illness risk factors in selected institutional foodservice, restaurant, and retail food store facility types (1998-2008). Available at: http://www.fda.gov/Food/GuidanceRegulation/RetailFoodProtection/FoodborneIllnessRiskFactorReduction/ucm223293.htm. Accessed 6 Jun. 2013. Food and Drug Administration (FDA). 2010e. Federal Register Notice FDA-2010-N-0195-001: Risk Profile: Pathogens and filth in spices: Request for comments and for scientific data and information. Available from: http://www.regulations.gov/#!documentDetail;D=FDA-2010-N-0195-0001. Accessed 21 Jul. 2013. Food and Drug Administration (FDA). 2009a. Union International Food Co. is further expanding the recall of Lian how brand and uncle Chen brand retail and institutional products. Available at: http://www.fda.gov/Safety/Recalls/ArchiveRecalls/2009/ucm135361.htm. Accessed 11 Oct. 2010. Food and Drug Administration (FDA). 2009b. Import alert 28-03. Detention without physical examination of sesame seeds from Mexico and surveillance of sesame seeds from other countries. Available at: http://fdswa090.fda.gov/vts/imports_publish/private/importalert_91.html. Accessed 5 Nov. 2010. Food and Drug Administration (FDA). 2009c. Import Alert 28-04. Detention without physical examination of black and white pepper from Brazil. Available at: http://fdswa090.fda.gov/vts/imports_publish/private/importalert_92.html. Accessed 5 Nov. 2010. Food and Drug Administration (FDA). 2009d. FDA alerts the public to Uncle Chen and Lian how brand fry spice product recall, April 2, 2009. Available at: http://www.fda.gov/NewsEvents/Newsroom/PressAnnouncements/2009/ucm149555.htm. Accessed 5 Nov. 2010. Food and Drug Administration (FDA). 2009e. Bad bug book. Available at: http://www.fda.gov/Food/FoodborneIllnessContaminants/CausesOfIllnessBadBugBook/ucm296005.htm. Accessed 15 Jun. 2012. Food and Drug Administration (FDA). 2009f. Playing it safe with eggs. Available at: http://www.fda.gov/Food/ResourcesForYou/Consumers/ucm077342.htm. Accessed 2 Feb. 2011. Food and Drug Administration (FDA). 2000. Kinetics of Microbial Inactivation for Alternative Food Processing Technologies. Available at: http://www.fda.gov/Food/FoodScienceResearch/SafePracticesforFoodProcesses/ucm100158.htm Accessed 5 Jun. 2013. Food and Drug Administration (FDA). 1998a. Macroanalytical Procedures Handbook. Available from: http://www.fda.gov/Food/FoodScienceResearch/LaboratoryMethods/ucm2006953.htm. Accessed 5 Jun. 2013. Food and Drug Administration (FDA). 1998b. Guidance for industry: Guide to minimize microbial food safety hazards for fresh fruits and vegetables. Available at: http://www.fda.gov/Food/GuidanceRegulation/GuidanceDocumentsRegulatoryInformation/ProducePlantProducts/ucm064574.htm. Accessed 5 Jun. 2013. Food Safety Authority of Ireland (FSAI). 2005. 3rd Trimester National Microbiological Survey 2004 (04NS3) of the European Commission Coordinated Progamme for the Official Control of foodstuffs for 2004:

References | 11
FDA Draft Risk Profile | 156
Bacteriological and toxicological safety of dried herbs and spices. Available at: http://www.fsai.ie/content.aspx?id=10718&terms=spices. Accessed 10 Jun. 2013. Food Standards Australia New Zealand (FSANZ). 2001. Guidelines for the microbiological examination of ready-to-eat foods. Canberra, ACT. Available at: http://www.foodstandards.gov.au/publications/pages/guidelinesformicrobi1306.aspx. Accessed 3 Jun. 2013. Foster, J.W. and M.P. Spector. 1995. How Salmonella survive against the odds. Ann Rev. Microbiol. 49:145-174. Fowles, J., J. Mitchell, and H. McGrath. 2001. Assessment of cancer risk from ethylene oxide residues in spices imported into New Zealand. Food Chem. Toxicol. 39:1055-1062. Franco, S.L., J.L. Gimenez, F.M. Sanchez, and F. Romojaro. 1986. Effectiveness of ethylene oxide and gamma irradiation on the microbiological population of three types of paprika. J. Food Sci. 51: 1571-1572. Franz, E., and A.H.C. van Bruggen. 2008. Ecology of E. coli O157 and Salmonella enterica in the primary vegetable production chain. Crit. Rev. Microbiol. 34:143-161. Garcia, R., J. Baelum, L. Fredslund, P. Santorum, and C.S. Jacobsen. 2010. Influence of temperature and predation on survival of Salmonella enterica serovar Typhimurium and expression of invA in soil and manure-amended soil. Appl. Environ. Microbiol. 76: 5-25-5031. Garcia, S., F. Iracheta, F. Galvan, and N. Heredia. 2001. Microbiological survey of retail herbs and spices from Mexican markets. J. Food Prot. 64(1):99-103. Garcia-Gonzalez, L., A. Geeraerd, S. Spilimbergo, K. Elst, L. Van Ginneken, J. Debevere, J. Van Impe, and F. Devlieghere. 2007. High pressure carbon dioxide inactivation of microorganisms in foods: The past, the present and the future. Intl J. Food Microbiol. 117:1–28. Garmiri P., K.E. Coles, T.J. Humphrey, and T.A. Cogan. 2008. Role of outer membrane lipopolysaccharides in the protection of Salmonella enterica serovar Typhimurium from desiccation damage. FEMS Microbiol. Lett. 281(2):155–159. Gecan, J.S., R. Bandler, L.E. Glaze, J.C. Atkinson. 1983. Microanalytical quality of ground and unground oregano, ground cinnamon, and ground nutmeg. J. Food Protect. 46(5):387-390. Gecan, J.S., R. Bandler, L.E. Glaze, J.C. Atkinson. 1986. Microanalytical quality of ground and unground marjoram, sage and thyme, ground allspice, black pepper and paprika. J. Food Protect. 49(3):216-221. Gibson D.L., A.P. White, S.D. Snyder, S. Martin, C. Heiss, P. Azadi, M. Surette, and W.W. Kay. 2006. Salmonella produces an O-antigen capsule regulated by AgfD and important for environmental persistence. J. Bacteriol. 188(2):7722–7730. Gieraltowski, L., E. Julian, J. Pringle, K. MacDonald, D. Quilliam, N. Marsden-Haug, L. Saathoff-Huber, D. Von Stein, B. Kissler, M. Parish, D. Elder, V. Howard-King, J. Besser, S. Sodha, A. Loharikar, S. Dalton, I. Williams, and C.B. Behravesh. 2012. Nationwide outbreak of Salmonella Montevideo infections associated with contaminated imported black and red pepper: Warehouse membership cards provide critical clues to identify the source. Epidem Inf. 1(1):1-9. Gilbert, G.L. V.M. Gambill, D.R. Spiner, R.K. Hoffman, and C.R. Phillips. 1964. Effect of moisture on ethylene oxide sterilization. Appl. Microbiol. 12(6):496-503.

References | 11
FDA Draft Risk Profile | 157
Global Harmonization Task Force (GHTF). 2004. Final Document: Quality Management Systems – Process Validation Guidance. SG3/N99 -10:2004 (Edition 2). Available at: http://www.imdrf.org/docs/ghtf/final/sg3/technical-docs/ghtf-sg3-n99-10-2004-qms-process-guidance-04010.pdf. Accessed 28 May 2013. Goepfert, J.M., I.K. Iskander, and C.H. Amundson. 1970. Relation of the heat resistance of salmonellae to the water activity of the environment. Appl. Microbiol. 19:429-433. Gonzales-Barron , U., M. Kerr, J.J. Sheridan, and F. Butler. 2010. Count data distributions and their zero-modified equivalents as a framework for modeling microbial data with a relatively high occurrence of zero counts. Int. J. Microbiol. 136:268-277. Gradel, K.O., H.L. Neilsen, H.C. Schønheyder, T. Ejlertsen, B. Kristensen, and H. Nielsen. 2009. Increased short- and long-term risk of inflammatory bowel disease after Salmonella and Campylobacter gastroenteritis. Gastroenterology. 137: 495-501. Grecz, N., R. Al-Harithy, and R. Jaw. 1986. Radiation sterilization of spices for hospital food services and patient care. J. Food Safety. 7(4):241-255. Grocery Manufacturers Association (GMA). 2009. Control of Salmonella in low-moisture foods. Available at: http://www.gmaonline.org/downloads/technical-guidance-and-tools/SalmonellaControlGuidance.pdf. Accessed 3 Jun. 2013. Gruzdev, N., R. Pinto, and S. Sela. 2011. Effect of desiccation on tolerance of Salmonella enterica to multiple stresses. Appl. Environ. Microbiol. 77(5): 1667-1673. Guérin, P., O. Alvseike, T. Stavnes, P. Aavitsland. 2001. International outbreak of Salmonella Typhimurium DT104–update from Norway. Eurosurveill. 5(33):pii=1701. Available at: http://www.eurosurveillance.org/ViewArticle.aspx?ArticleId=1701. Accessed 13 Aug. 2010. Guerrant, R.L., T. Van Gilder, T.S. Steiner, N.M. Thielman, L. Slutsker, R.V. Tauxe, T. Hennessy, P.M. Griffin, H. DuPont, R.B.Sack, P. Tarr, M. Neill, I. Nachamkin, L.B. Reller, M.T. Osterholm, M.L. Bennish, and L.K. Pickering. 2001. IDSA Guidelines: Practice guidelines for the management of infectious diarrhea. Clin. Infect. Dis. 32:331-350. Guo, C., R.M. Hoekstra, C.M. Schroeder, S.M. Pires, K.L. Ong, E. Hartnett, A. Naugle, J. Harman, P. Bennett, P. Cieslak, E. Scallan, B. Rose, K.G. Holt, B. Kissler, E. Mbandi, R. Roodsari, F.J. Angulo, and D. Cole. 2011. Application of Bayesian techniques to model the burden of human salmonellosis attributable to U.S. food commodities at the point of processing: Adaptation of the Danish model. Foodborne Pathog. Dis. 8(4): 509-516. Gustavsen, S., and O. Breen. 1984. Investigation of an Outbreak of Salmonella oranienburg Infections in Norway, Caused by Contaminated Black Pepper. Am. J Epidemiol. 119(5):806-812. Hajmeer, M. and C. Myers. 2011. Outbreak of Salmonella Rissen Associated with Ground White Pepper – The Environmental Investigation. International Association for Food Protection 2010 Annual Conference; Anaheim, CA. Available at: http://www.cdph.ca.gov/programs/DFDRS/Documents/QSS_Presentation_SRissen_and_%20white%20pepper_010611.pdf. Accessed 28 Feb. 2013.
References | 11
FDA Draft Risk Profile | 158
Hammer, K.A., C.F. Carson, and T.V. Riley. 1999. Antimicrobial activity of essential oils and other plant extracts. J. Appl. Micro. 86(6):985-990. Hampikyan, H., E. Bingol, H. Colak, and A. Aydin. 2009. The evaluation of microbiological profile of some spices used in Turkish meat industry. J. Food. Agri. Env. 7(3-4): 111-115. Hanes, D. 2003. Nontyphoid Salmonella, Chapter 9. In, M. D. Miliotis and J. W. Bier (Eds.) International Handbook of Foodborne Pathogens. Marcel Dekker, Inc., New York, Pp. 137-149. Hannu T., L. Mattila, A. Siitonen, and M. Leirisalo-Repo. 2002. Reactive arthritis following an outbreak of Salmonella Typhimurium phage type 193 infection. ANN. RHEUM. DIS. 61:264-266. Hara-Kudo, Y., K. Ohtsuka, Y. Onoue, Y. Otomo, I. Furukawa, A. Yamaji, Y. Segawa, and K, Takatori. 2006. Salmonella prevalence and total microbial and spore populations in spices imported to Japan. J. Food Prot. 69(10):2519-2523. Hardin, M. 2012. Food process validations. In: Microbiological Research and Development for the Food Industry (P. Taormina, ed.). CRC Press (Taylor & Francis Group), Boca Raton, FL. pp. 45-82. Harris, K.L. 1960. Product control and sanitation in Microscopic-analytical methods in food and drug control, food and drug technical bulletin No. 1, U.S. Department of Health, Education, and Welfare, FDA. p. 9 Harris, L.J., A.R. Uesugi, S.J. Abd, and K.L. McCarthy. 2012. Survival of Salmonella Enteritidis PT30 on inoculated almond kernels in hot water treatments. Food Res. Int. 45(2):1093–1098. Harris, L.J., J.N. Farber, L.R. Beuchat, M.E. Parish, T.V. Suslow, E.H. Garrett, and F.F. Busta. 2003. Outbreaks associated with fresh produce: incidence, growth, and survival of pathogens in fresh and fresh-cut produce. Comp. Rev. Food. Sci. Food Safety 2 (supplement): 78-141. Hayashi, T., Y. Takahashi, and S. Todoriki. 1998. Sterilization of foods with low-energy electrons (“soft-electrons”). Radiat. Phys. Chem. 52:73-76. Health Protection Agency (HPA). 2011. Electronic Foodborne and non-Foodborne Gastrointestinal Outbreak Surveillance System (eFOSS) NB: The database is dynamic and, as such, is subject to change. K:\GSURV\DataRequests\eFOSS_Foodborne Outbreaks linked with spices (Jane Van Doren, FDA, 24-05-11) Helms, M., J. Simonsen, and K. Molbak. 2006. Foodborne bacterial infection and hospitalization: a registry-based study. Clin Infect. Dis. 42(4): 498-506.
Higa, J. 2012. California Department of Public Health. Clarification of hospitalization statistics for Salmonella Rissen outbreak. Personal Communication. Available from FDA upon request. Higa, J. 2011. Outbreak of Salmonella Rissen Associated with Ground White Pepper: The Epi Investigation. Jan 6, 2011 Union International Investigation Meeting Presentation, Quarterly Scientific Seminar, California Department of Public Health. Available at: http://www.cdph.ca.gov/programs/DFDRS/Documents/QSS_Presentation_SRissen_and_%20white%20pepper_010611.pdf. Accessed 8 Dec. 2011. Hiramatsu, R., Matsumoto, M., Sakae, K., and Miyazaki, Y. 2005. Ability of Shiga toxin-producing Escherichia coli and Salmonella spp. to survive in a desiccation model system and in dry foods. Appl. Environ. Microbiol. 71:6657-6663.

References | 11
FDA Draft Risk Profile | 159
Hoelzer, K., A.I.M. Switt, M. Wiedman. 2011. Animal contact as a source of human non-typhoidal salmonellosis. Vet. Res. 42: 34. Hogan, E. 2010. U.S. Food and Drug Administration. Estimate of the amount of food in distribution that was, associated with the Salmonella Wandsworth outbreak. Personal communication. Available from FDA upon request. Hogan, E. 2011. U.S. Food and Drug Administration. Bay leaf recall. Listeria monocytogenes recall was associated with fresh bay leaves. Personal communication. Available from FDA upon request. Holt, P. S., C. J. Geden, R. W. Moore, and R. K. Gast. 2007. Isolation of Salmonella enterica serovar Enteritidis from houseflies (Musca domestica) found in rooms containing Salmonella serovar Enteritidis challenged hens. Appl. Environ. Microbiol. 73:6030–6035. Hussien, J., C. Teshale, and J. Mohammed. 2011. Assessment of the antimicrobial effects of some Ethiopian aromatic spice and herb hydrosols. Int. J. Pharm. 7(5): 635-640. Ilic, S., P. Duric, and E. Gergo. 2010. Salmonella Senftenberg Infections and Fennel Seed Tea, Serbia. Emerg. Infect. Dis. 16(5):893-895. Inami, G.B., S.M.C. Lee, R.W. Hogue, and R.A. Brenden. 2001. Two processing methods for the isolation of Salmonella from naturally contaminated alfalfa seeds. JFP. 64(8): 1240-1243. Indu, M.N., A.A.M. Hatha, C. Abirosh, U. Harsha, and G. Vivekanandan. 2006. Antimicrobial activity of some of the South-Indian spices against serotypes of Escherichia coli, Salmonella, Listeria monocytogenes and Aeromonas hydrophila. Braz J. Micriobiol. 37(2):153-158. Institute of Medicine of the National Academies (IOM). 2012. Ensuring Safe Foods and medical Products through stronger regulatory systems abroad. The National Academies Press. Washington, D.C. Available at: http://www.iom.edu/Reports/2012/Ensuring-Safe-Foods-and-Medical-Products-Through-Stronger-Regulatory-Systems-Abroad.aspx. Accessed 10 Jan. 2013. International Commission on Microbiological Specifications for Foods (ICMSF). 2002. Concepts of Probability and Principles of Sampling. In Microorganisms in Foods 7: Microbiological Testing in Food Safety Management. Springer Science and Business Media, LLC. New York. pp. 113-121. International Commission on Microbiological Specifications for Foods (ICMSF). 1996. Salmonellae. In Microorganisms in Foods 5: Characteristics of Microbial Pathogens. Blackie Academic & Professional, London. pp. 217-264. International Organisation of Spice Trade Associations (IOSTA). 2008. General guidelines for good agricultural practices spices. Available at: http://astaspice.org/files/public/IOSTA_GAP_Final.pdf. Accessed. 14 Feb. 2013. International Trade Centre UNCTAD/WTO. 2006. World Markets in the Spice Trade - 2000-2004. Geneva, Switzerland. Available at: http://www.indiaenvironmentportal.org.in/files/5.spices_report_web.pdf. Accessed 3 Jun. 2013. Islam, M., J. Morgan, M.P. Doyle, S.C. Phatak, P. Millner, and X. Jiang. 2004. Persistence of Salmonella enterica serovar Typhimurium on lettuce and parsley and in soils on which they were grown in fields treated with contaminated manure composts or irrigation water. Foodborne Pathogens Dis. 1:27-35.

References | 11
FDA Draft Risk Profile | 160
Iversen, C. and S. Forsythe. 2004. Isolation of Enterobacter sakazakii and other Enterobacteriaceae from powdered infant formula milk and related products. Food Microbiol. 21: 771-777. Jaradat, Z.W., Q.O. Ababneh, I.M. Saadoun, N.A. Samara, and A.M. Rashdan. 2009. Isolation of Cronobacter spp. (formerly Enterobacter sakazakii) from infant food, herbs and environmental samples and the subsequent identification and confirmation of the isolates using biochemical, chromatographic assays, PCR and 16S rRNA sequencing. BMC Microbiol. 9:225. Jarvis, B., C. Wilrich, and P.-T. Wilrich. 2010. Reconsideration of the deviation of Most Probable Numbers, their standard deviations, confidence bounds and rarity values. J. Appl. Microbiol. 109:1660-1667. Jeong, S., B.P. Marks, E.T. Ryser, J. B. Harte. 2012. The effect of X-ray irradiation on Salmonella inactivation and sensory quality of almonds and walnuts as a function of water activity. Int. J. Food Microbiol. 153: 365-371. Jess, T., J. Simonsen, N.M. Neilsen, K.T. Jørgensen, P. Bager, S. Ethelberg, and M. Frisch. 2011. Enteric Salmonella or Campylobacter infections and the risk of inflammatory bowel diseases. Gut. 60(3): 318-324. Joint FAO/WHO Expert Meetings on Microbiological Risk Assessment (JEMRA). 2013. Microbiological Sampling Plan Analysis Tool. Available at: http://www.fstools.org/sampling/. Accessed 1 Jul. 2013. Joint Institute for Food Safety and Applied Nutrition (JIFSAN). 2013. International Training. Available at: http://international.jifsan.umd.edu/catalogue/. Accessed 16 Aug. 2013. Jones, T.F., L.A. Ingram, P.R. Cieslak, D.J. Vugia, M.Tobin-D’Angelo, S. Hurd, C. Medus, A. Cronquist, and F.J. Angulo. 2008. Salmonellosis outcomes differ substantially by serotype. J. Infect. Dis. 198: 109-114. Jongenburger, I., J. Bassett, T. Jackson, M.H. Zwietering, and K. Jewell. 2012. Impact of microbial distributions on food safety I: Factors influencing microbial distributions and modeling aspects. Food Control. 26:601-609. Kahraman, T., and G. Ozmen. 2009. Quality of selected spices and herbs consumed in Turkey. Archiv für Lebensmittelhygiene 60(6):185-191. Karapinar, M., and S.E. Aktug. 1987. Inhibition of foodborne pathogens by thymol, eugenol, menthol and anethole. Int. J. Food Microbiol. 4(2):161-166. Kaplan, E.L., and P. Meier. 1958. Nonparametric estimation from incomplete observations. J. Am. Statist. Assoc. 53: 457-481. Kaul, M., and N. Taneja. 1989. A note on the microbial quality of selected spices. J. Food Sci. Tech. 26(3): 169-170. Keith, W.D., L.J. Harris, L. Hudson, and M.W. Griffiths.1997. Pulsed electric fields as a processing alternative for microbial reduction in spice. Food Res. Internat. 30:185-191. Keller, S.E., J.M. Van Doren, E.M. Grasso, L.A. Halik. 2013. Growth and survival of Salmonella in ground black pepper (Piper nigrum). Food Microbiol. 34(1):182-188. Keller, S. E., Grasso, E. M., Halik, L. A., Fleischman, G. J., Chirtel, S. J., & Grove, S. F. (2012). Effect of growth on the thermal resistance and survival of Salmonella Tennessee and Oranienburg in peanut butter, measured by a new thin-layer thermal death time device. Journal of Food Protection, 75(6), 1125–1130. doi:10.4315/0362-028X.JFP-11-477.

References | 11
FDA Draft Risk Profile | 161
Kemmeren, J.M., M.-J.J. Mangen, Y.T.H.P. van Duynhoven, and A.H. Havelaar. 2006. Priority setting of foodborne pathogens: Disease burden and costs of selected eneteric pathogens, RIVM Report 330080001/2006. Available at: http://rivm.openrepository.com/rivm/bitstream/10029/7316/1/330080001.pdf. Accessed 5 Nov. 2010. Kimber, M. A., H. Kaur, L. Wang, M.D. Danyluk, and L.J. Harris. 2012. Survival of Salmonella, Escherichia coli O157:H7, and Listeria monocytogenes on inoculated almonds and pistachios stored at –19, 4, and 24°C. J. Food Protect. 75:1394–1403. Kispéter, J., K. Bajusz-Kabok, M. Fekete, G. Szabo, E. Fodor, and T. Pali. 2003. Changes induced in spice paprika powder by treatment with ionizing radiation and saturated steam. Rad. Phys. Chem. 68:893-900. Kiss, I., and J. Farkas. 1988. Irradiation as a method for decontamination of spices. Food Rev. Internat. 4(1):77-92. Kneifel, W., and E. Berger. 1994. Microbiological criteria of random samples of spices and herbs retailed on the Austrian market. J. Food Prot. 57(10):893-901. Koch, J., A. Schrauder, K. Alpers, D. Weber, C. Frank, R. Prager, W. Rabsch, S. Broll, F. Feil, P. Roggentin, J. Bockemuhl, H. Tschape, A. Ammon, and K. Stark. 2005. Salmonella Agona outbreak from contaminated aniseed, Germany. Emerg. Infect. Dis. 11(7):1124-1127. Koco, Inc. 2008. Nut pasteurization and roasting. Brochure. Koco Food Tech/Barth, Hunt Valley, MD. Komitopoulou, E., and W. Penaloza. 2009. Fate of Salmonella in dry confectionery raw materials. J. Appl. Microbiol. 106:1892-1900. Kovács-Domján. 1988. Microbiological investigations of paprika and pepper with special regard to spore formers including B. cereus. Acta Alimentaria. 17: 257-64. Kudaka, J., K. Itokazu, K. Taira, A. Iwai, M. Kondo, T. Susa, and M. Iwanaga. 2006. Characterization of Salmonella Isolated in Okinawa, Japan. Jpn. J. Infect. Dis. 59:15-19. Laidley, R., S. Handzel, D. Severs, and R. Butler. 1974. Salmonella Weltevreden outbreak associated with contaminated pepper. Epidemiol. Bull. 18(4):62. Legnani, P.P., E. Leoni, F. Righi, and L.A. Zarabini. 2001. Effect of microwave heating and gamma irradiation on microbiological quality of spices and herbs. Ital. J. Food Sci. 3(13):337-345. Lehmacher, A., J. Bockemuhl, and S. Aleksic. 1995. Nationwide outbreak of human salmonellosis in Germany due to contaminated paprika-powdered potato chips. Epidemiol. Infect. 115:501-511. Leistritz, W. 1997. Methods of bacterial reduction in spices. In: Spices: Flavor chemistry and antioxidant properties. ACS Symposium Series 660. Eds. Risch S. and Ho, C-T. American Chemical Society, Washington DC. Ley, F.J., B.M. Freeman, and B.C. Hobbs. 1963. The use of gamma radiation for the elimination of salmonellae from various foods. J. Hyg. 61:515-529. Li, H., A. Bhaskara, C. Megalis, and M.L. Tortorello. 2012. Transcriptomic analysis of Salmonella desiccation resistance. Foodborne Pathog. Dis. 9(12):1143-1151.

References | 11
FDA Draft Risk Profile | 162
Lienau, E.K., E. Strain, C. Wanag, J. Zheng, A.R. Ottensen, C.E. Keys, T.S. Hammack, S.M. Musser, E.W. Brown, M.W. Allard, G. Cao, J. Meng, R. Stones. 2011. Identification of a salmonellosis outbreak by means of molecular sequencing. N. Engl. J. Med. 10:981-982. Little, C.L. 2012. Health Protection Agency, United Kingdom. Sample size examined in Sagoo et al., 2009 study was 27 g. Additional information provided on outbreaks reported in Little et al. (2003) and other outbreaks associated with spice reported to HPA. Personal Communication. Available from FDA upon request. Little, C. 2001. International outbreak of Salmonella Typhimurium DT104–update from the United Kingdom. Euro Surveill. 5(33):pii=1700. Available at: http://www.eurosurveillance.org/ViewArticle.aspx?ArticleId=1700. Accessed 10 Oct. 2010. Little, C.L., R. Omotoye, and R.T. Mitchell. 2003. The microbiological quality of ready-to-eat foods with added spices. Int. J Environ. Health Res. 13(1):31-42. Locht H., E. Kihlstrom, and F. Lindstrom. 1993. Reactive arthritis after Salmonella among medical doctors - study of an outbreak. J. Rheum. 20:845-848. Logan, N. 2011. Bacillus and relatives in foodborne illness. J. Appl. Microbiol. 112:417-29. Lynch, M.F., and R.V. Tauxe. 2009. Salmonellosis: Nontyphoidal. In Bacterial Infections of Humans. Springer Science and Business Media. New York. pp. 677-696. Ma, Y. 2013. United States Food and Drug Administration. Review of primary recall events during 2008-2009 associated with Salmonella in spices and seasonings. Personal communication. Available from FDA upon request. Mann, E.A., and S.A. Saeed. 2012. Gastrointestinal infection as a trigger for inflammatory bowel disease. Curr. Opin. Gastroenterol. 28(1): 24-29. Mattick, K., K. Durham, G. Domingue, F. Jørgensen, M. Sen, D.W. Schaffner, T. Humphrey. 2003. The survival of foodborne pathogens during domestic washing-up and subsequent transfer onto washing-up sponges, kitchen surfaces, and food. Int. J. Food Microbiol. 85: 213-226. Mattick, K.L., F. Jorgensen, J.D. Legan, M.B. Cole, J. Porter, H.M. Lappin-Scott, and T.J. Humphrey. 2000. Survival and Filamentation of Salmonella enterica serovar Enteritidis PT4 and Salmonella enterica serovar Typhimurium DT204 at low water activity. Appl. Environ. Microbiol. 66(4):1274-1279. McEntire, J., and T. Bhatt. 2012. Pilot Projects for Improving Product Tracing along the Food Supply System – Final Report. Institute of Food Technologists (for FDA). Available from: http://www.ift.org/knowledge-center/focus-areas/food-safety-and defense/~/media/Knowledge%20Center/Focus%20Areas/Traceability/IFT_FDA_ProductTracingPilotsFinalReport.pdf. Accessed 5 Jul. 2013. McGuffin, M., J. Kartesz, A. Leung, and A. Tucker. 2000. Herbs of Commerce, 2nd Edition. American Herbal Products Association. Silver Spring, MD. Mead, P.S., L. Slutsker, V. Dietz, L.F. McCaig, J.S. Bresee, C. Shapiro, P.M. Griggin, and R.V. Tauxe. 1999. Food-related illness and death in the United States. Emerg. Infect. Dis. 5(5):607-625 Micallef, S.A., R.E. Rosenberg Goldstein, A. George, L. Kleinfelter, M.S. Boyer, C.R. McLaughlin, A. Estrin, L. Ewing, J. Jean-Gilles Beaubrun, D.E. Hanes, M.H. Kothary, B.D. Tall, J.H. Razeq, S.W. Joseph, and A.R. Sapkota.

References | 11
FDA Draft Risk Profile | 163
2012. Occurrence and antibiotic resistance of multiple Salmonella serotypes recovered from water, sediment, and soil on mid-Atlantic tomato farms. Env. Res. 114: 31-39. Michael, G.T., and C.R. Stumbo. 1970. Ethylene Oxide Sterilization of Salmonella Senftenberg and Escherichia Coli: Death kinetics and mode of action. J. Food Sci. 35:631-634. Millet, P. and M. Staff. 1999. Spices, high-risk foods and public health: a Salmonella outbreak on Sydney Harbour. NSW Public Health Bull. 10(1-2):1-3. Mintel International Group Ltd. 2009. Seasonings, October 2009. Available at: http://academic.mintel.com/sinatra/oxygen/display/id=393456. Accessed 10 Oct. 2010. Moreira, P.L., T.B. Lourencao, J.P.A.N. Pinto, and V.L.M. Rall. 2009. Microbiological quality of spices marketed in the city of Botucatu, Sao Paulo, Brazil. J. Food Prot. 72(2):421-424. Munasiri, M.A., M.N. Parte, A.S. Ghanekar, A. Sharma, S.R. Padwal-Desai, and G.B. Nadkarni. 1987. Sterilization of ground prepacked Indian spices by gamma irradiation. J. Food Sci. 52(3):823-825. Myers, C., and J. Higa. 2011. Participant Questions; Answers from Carol Myers and Jeffrey Higa. Jan 6, 2011 Union International Investigation Meeting Presentation, Quarterly Scientific Seminar, California Department of Public Health. Available at: http://www.cdph.ca.gov/programs/DFDRS/Documents/Q_and%20A_Quarterly_%20Seminar_Union010611.pdf. Accessed 8 Dec. 2011. Narayanan, C.S., M.M. Sree Kumar, and B. Sankarikutty. 2000. Industrial processing and products of black pepper. In: Black pepper: Piper nigrum. Edited by P.N. Ravindran. Taylor & Francis, Amsterdam, Netherlands. p.367-379. Nascimento, M.S., D.M. Brum, P.O. Pena, M.I. Berto, and P. Efraim. 2012. Inactivation of Salmonella during cocoa roasting and chocolate conching. Int. J. Food Microbiol. 159(3): 225-229. National Advisory Committee on Microbiological Criteria for Foods (NACMCF). 2010. Parameters for determining inoculated pack/challenge study protocols. J. Food Prot. 73(1):140-202. National Center for Biotechnology (NCBI). 2013. SRA. Available at: http://www.ncbi.nlm.nih.gov/sra. Accessed 25 May 2013. National GAPs Program. 2013. The Good Agricultural Practices Network for Education and Training (GAPsNET). Available at: http://www.gaps.cornell.edu/index.html. Accessed 25 May 2013. Neetoo, H. and H. Chen. 2011. Individual and combined application of dry heat with high hydrostatic pressure to inactivate Salmonella and Escherichia coli O157:H7 on alfalfa seeds. Food Microbiol. 28(1):119-127. Nieto-Sandoval, J.M., L. Almela, J.A. Fernandez-Lopez, and J.A. Munoz. 2000. Effect of electron beam irradiation on color and microbial bioburden of red paprika. J. Food Prot. 63(5):633-637. Olsen, A.R. 1998a. Regulatory action criteria for filth and other extraneous materials I: Review of hard or sharp foreign objects as physical hazards in food. Regul. Toxicol. Pharmacol. 28(3):181–189. Olsen, A.R. 1998b. Regulatory action criteria for filth and other extraneous materials: II. allergenic mites: An emerging food safety issue Regul. Toxicol. Pharmacol. 28:190-198

References | 11
FDA Draft Risk Profile | 164
Olsen, A.R., J.S. Gecan, G.C. Ziobro, and J.R. Bryce. 2001 Regulatory action criteria for filth and other extraneous materials: V. Strategy for evaluating hazardous and nonhazardous filth. Regul. Toxicol. Pharmacol. 33:363-392. Ongeng, D., C. Muyanja, A.H. Geeraerd, D. Springael, and J. Ryckeboer. 2011. Survival of Escherichia coli O157:H7and Salmonella enterica serovar Typhimurium in manure and manure-amended soil under tropical conditions in Sub-Saharan Africa. J. Appl. Microbiol. 110: 1007-1022. Oregon’s Wild Harvest. 2012. Oregon’s Wild Harvest Seriously Organic: Organic Herbs. Available at: http://www.oregonswildharvest.com/. Accessed 21 Sep. 2012. Otofuji, T., H. Tokiwa, and K. Takahashi. 1987. A food-poisoning incident caused by Clostridium botulinum toxin A in Japan. Epidem. Inf. 99:167-172. Pafumi, J. 1986. Assessment of the microbiological quality of spices and herbs. J. Food Prot. 49(12):988-963. Parisi, A. and W. Young. 1991. Sterilization with ethylene oxide and other gases. In: Disinfection, sterilization, and preservation 4th ed. Ch. 33, pp. 580-595. Ed. S.S. Block. Lea & Febiger, Malvern, PA, USA. Park, S., B. Szonyi, R. Gautam, K. Nightingale, J. Anciso, and R. Ivanek. 2012. Risk factors for microbial contamination of fruits and vegetables at the pre-harvest level: A systematic review. J. Food Protect. 75(11):2055-2081. Pava-Ripoll, M., R.E. Goeriz Pearson, A.K. Miller, and G. Ziobro. 2012. Prevalence and relative risk of Cronobacter spp., Salmonella spp., and Listeria monocytogenes associated with the body surfaces and guts of individual filth flies. Appl. Environ. Microbiol. 78(22) 7891-7902. Perren, R. 2008. Almond pasteurization. The Manufacturing Confectioner 88(4):77-84. Pflug, I.J., and R. G. Holcomb. 1991. Principles of the thermal destruction of microorganisms in Disinfection, Sterilization and Preservation, 4th Ed. S.S. Block, Ed. Lea & Febiger. Philadelphia. pp. 85-198. Podolak, R., E. Enache, W. Stone, D.G. Black, and P.H. Elliott. 2010. Sources and risk factors for contamination, survival, persistence, and heat resistance of Salmonella in low-moisture foods. J. Food Prot. 73(10):1919-1936. Portnoy B.L., J.M. Goepfert, and S.M. Harmon. 1976. An outbreak of Bacillus cereus food poisoning resulting from contaminated vegetable sprouts. Am J. Epidemiol 103:589-594. Proctor, B., Goldblith, S. and H. Fram. 1950. Effect of supervoltage cathode rays on bacterial flora of spices and other dry food materials. J. Food Sci. 15(6):490-493. R Development Core Team. 2008. R: a language and environment for statistical computing. Available from: http://www.R-project.org. Accessed 20 Mar. 2012. Rabsch, W., R. Prager, J. Koch, K. Start, P. Roggentin, J. Bockemuhl, G. Beckmann, R. Stark, W. Siegl, A. Ammon, and H. Tschape. 2005. Molecular epidemiology of Salmonella enterica serovar Agona: Characterization of a diffuse outbreak caused by aniseed-fennel-caraway infusion. Epidemiol. Infect. 133(5):837-844. Rajkowski, K., G. Boyd, and D. Thayer. 2003. Irradiation d-values for Escherichia coli O157:H7 and Salmonella sp. on inoculated broccoli seeds and effects of irradiation on broccoli sprout keeping quality and seed viability. J. Food Prot. 66(5):760-766.

References | 11
FDA Draft Risk Profile | 165
Rico, C.W., G.R. Kim, J.J. Ahn, H.K. Kim, M. Furuta, and J.H. Kwon. 2010. The comparative effect of steaming and irradiation on the physicochemical and microbiological properties of dried red pepper (Capsicum annum L.). Food Chem. 119:1012-1016. Ristori, C.A., M.A. dos Santos Pereira, and D.S. Gelli. 2007. Behavior of Salmonella Rubislaw on ground black pepper (Piper nigrum L.). Food Cont. 18:268-272. Robert, A., C. Fenton, and A. Sertkaya. 2009. Cost effectiveness of practices intended to prevent tomato related foodborne illness; a report submitted to the U.S. Department of Health and Human Services, Food and Drug Administration, Center for Food Safety and Applied Nutrition. Eastern Research Group. Rodriguez-Avial, I., C. Rodriguez-Avial, O. López, J.J. Picazo. 2005. Trends in nalidixic acid resistance in nontyphoidal Salmonella isolated from 1999 to 2002: Decreased susceptibility to 6 fluoroquinolones. Diag. Micro. Infect. Dis. 52:261-264. Rodriguez-Romo, L.A., N.L. Heredia, R.G. Labbe, and J. S. Garcia-Alvarado. 1998. Detection of enterotoxigenic Clostridium perfringens in spices used in Mexico by dot blotting using a DNA probe. J. Food Prot. 61(2):201-204. Ruckert, E.M. 2010. American Spice Trade Association (ASTA) (McDermott Will & Emery” – Comment, Federal Register Docket: FDA-2010-N-0195, Document: FDA-2010-N-0195-0014. Available at: http://www.regulations.gov/#!documentDetail;D=FDA-2010-N-0195-0014. Accessed 26 Aug. 2011. Sádecká, J. 2010. Influence of two sterilisation ways, gamma-irradiation and heat treatment, on the volatiles of black pepper (Piper nigrum L.). Czech, J. Food Sci. 28(1):44-52. Sagoo, S.K., C.L. Little, M. Greenwood, V. Mithani, K.A. Grant, J. McLauchlin, E. de Pinna, and E.J. Threlfall. 2009. Assessment of the microbiological safety of dried spices and herbs from production and retail premises in the United Kingdom. Food Micriobiol. 26:39-43. SAS Institute Inc. 2012. Base SAS 9.2 Procedures Guide: Statistical Procedures, Third Edition. Cary, NC: SAS Institute Inc. pp. 135-6. Available at: http://support.sas.com/documentation/cdl/en/procstat/63104/PDF/default/procstat.pdf. Accessed 29 Mar. 2013. Sasaki, Y., A. Ikeda, K. Ishikawa, M. Murakami, M. Kusukawa, T. Asai, and Y. Yamada. 2012. Prevalence of and antimicrobial susceptibility of Salmonella in Japanese broiler flocks. Epidemiol. Infect. 140:2074-2081. Satchell, F.B., V.R Bruce, G. Allen, W.H. Andrews, and H.R. Gerber. 1989. Microbiological survey of selected imported spices and associated fecal pellet specimens. J. Assoc. Off. Anal. Chem. 72(4):632-637. Scallan, E., R.M. Hoekstra, F.J. Angulo, R.V. Tauxe, M.-A. Widdowson, S.L. Roy, J.L. Jones, and P.M. Griffin. 2011. Foodborne illness acquired in the United States – Major pathogens. Emerg. Infect. Dis. 17(1):7-15. Schaffner, D.W., R. L. Buchanan, S. Calhoun, M.D. Danyluk, L.J. Harris, D. Djordjevic, R. C. Whiting, B. Kottapalli, and M. Wiedmann. 2013. Issues to consider when setting intervention targets with limited data for low-moisture food commodities: A peanut case study. J. Food Prot. 76(2):360-369. Scott, V, N., Y. Chen, T. A. Freier, J. Kuehm, M. Moorman, J. Meyer, T. Morille-Hinds, L. Post, L. Smoot, S. Hood, J. Shebuski, J. Banks. 2009. Control of Salmonella in low-moisture foods I: Minimizing entry of Salmonella into a processing facility. Food Prot. Trends. June 2009: 342-354.
References | 11
FDA Draft Risk Profile | 166
Scott, V. 2005. How does industry validate elements of HACCP plans? Food Control 16(6):497-503. Seasoning and Spice Association (SSA). 2012. Culinary Herbs and Spices. Available at: http://www.seasoningandspice.org.uk/ssa/background_culinary-herbs-spices.aspx. Accessed 18 Dec. 2012. Semenov, A.V., L. van Overbeek, A.H.C. van Bruggen. 2009. Percolation and survival of Escherichia coli O157:H7and Salmonella enterica serovar Typhimurium in soil amended with contaminated dairy manure and slurry. Appl. Environ. Microbiol. 75: 3206-3215. Shamsuddeen, U. 2009. Microbiological quality of spice used in the production of Kilishi a traditionally dried and grilled meat product. Bajopas. 2(2): 66-69. Sharma, A., A.S. Ghanekar, S.R. Padwal-Desai, and G.B. Nadkarni. 1984. Microbiological status and antifungal properties of irradiated spices. J. Agric. Food Chem. 32:1061-1063. Shelef, L. A. 1983. Antimicrobial effects of spices. J. Food Safety. 6 29-44. Shelef, L.A., E.K. Jyothi, and M.A. Bulgarelli. 1984. Growth of enteropathogenic and spoilage bacteria in sage-containing broth and foods. J. Food Sci. 49(3):737-740,809. Shelef, L.A., O.A. Naglik, and D.W. Bogen. 1980. Sensitivity of some common food-borne bacteria to the spices sage, rosemary, and allspice. J. Food Sci. 45(4):1042-1044. Shigemura, R., D.L. Gerdes, and W.R. Hall. 1991.Effect of gamma processing on prepackaged black and white pepper (piper nigrum L.). Lebensmittel Wissenschaft Tech. 24(2):135-138. Silberstein, O., W. Galetto, and W. Henzi. 1979. Irradiation of onion powder: Effect on microbiology. J. Food Sci. 44(4):975-976. Singh, B.R., P. Singh, S. Agrawal, U. Teotia, A. Verma, S. Sharma, M. Chandra, N. Babu, and R. Kant Agarwal, 2007. Prevalence of multidrug resistant Salmonella in coriander, mint, carrot, and radish in Bareilly and Kanpur, northern India. Foodborne Pathog. Dis. 4(2):233-234. Singh, L., M.S. Mohan, S.R. Padwal Desai, R. Sankaran, and T.R. Sharma. 1988. The use of gamma irradiation for improving microbiological qualities of spices. J. of Food Sci Tech. 25(6):357-360. Sjöberg, A.M., M. Manninen, S. Pinnioja, E. Honkanen, and K. Latva-Kala. 1991. Irradiation of spices and its detection. Food Rev. Int. 7(2):233-253. Skapska, S., B. Windyga, E. Kostrzewa, Z. Jendrzejezak, K. Karlowski, M. Fonberg-Broczek, H. Sciezyńska, A. Grochowska, K. Górecka, S. Porowski, A. Morawski, J. Arabas, and S. Szczepek. 2003. Effect of ultra-high pressure under argon and temperature on the volatiles and piperine content and microbiological quality of black pepper (Piper Nigrum L.). In: Advances in high pressure bioscience and biotechnology II, Ed. Winter, R., Springer Verlag, Berlin. Skariyachan, S., P. Lokesh, R. Rao, A.U. Kumar, K.S. Vasist, R. Narayanappa. 2012. A pilot study on water pollution and characterization of multidrug-resistant superbugs from Byramangala talk, Ramanagara district, Karnataka, India. Environ. Monit. Assess. 1-13. Smith-Palmer, A., J. Stewart, and L.Fyfe. 1998. Antimicrobial properties of plant essential oils and essences against five important foodborne pathogens. Lett. Appl. Microbiol. 26(2):118-122.
References | 11
FDA Draft Risk Profile | 167
Soedarman, H., H. Stegeman, J. Farkas, D.A.A. Mossel. 1984. Decontamination of black pepper by gamma radiation. In: Kiss I, Deak T, Incze K (eds.) Microbial associations and interactions in food. Akademiai Kiado, Budapest, p. 401 Sotir, M.J., G. Ewald, A.C. Kimura, J.I. Higa, A. Sheth, S. Troppy, S. Meyer, R.M. Hoekstra, J. Austin, J. Archer, M. Spayne, E.R. Daly, and P.M. Griffin. 2009. Outbreak of Salmonella Wandsworth and Typhimurium infections in infants and toddlers traced to a commercial vegetable-coated snack food. Pediatr. Infect. Dis. J. 28(12):1041-1046. Spices Board India, Ministry of Commerce and Industry, Government of India. 2013. Spices Park. Available from: http://www.indianspices.com/html/spices_board_spark.htm. Accessed 5 Jul. 2013. Stankovic, N., L. Comic, and B. Kocic. 2006. Microbiological correctness of spices on sale in health food stores and supermarkets in Nis. Acta Fac. Med. Naiss. 23(2): 79-84. Stewart, D.S., K.F. Reineke, J.M. Ulaszek, and M.L. Tortorello. 2001. Growth of Salmonella during Sprouting of Alfalfa Seeds Associated with Salmonellosis Outbreaks. J. Food Prot. 64 (5): 618-622. Taormina, P.J. 2012. Food product validations. In: Microbiological Research and Development for the Food Industry (P. Taormina, ed.). CRC Press (Taylor & Francis Group), Boca Raton, FL. pp. 83-108. Tajkarimi, M.M., S.A. Ibrahim, and D.O. Cliver. 2010. Antimicrobial herb and spice compounds in food. Food Control. 21(9):1199-1218. Teunis, P.F.M., F. Kasuga, A. Fazil, I.D. Ogden, O. Rotariu, and N.J.C. Strachen. 2010. Dose–response modeling of Salmonella using outbreak data. Int. J. Food Microbiol. 144(2):243-249. Thayer, D.W, K.T. Rajkowski, G.B. Boyd, P.H. Cooke, and D.S. Soroka. 2003. Inactivation of Escherichia coli O157:H7 and Salmonella by gamma irradiation of alfalfa seed intended for production of food sprouts. J. Food Prot. 66(2):175–181. Thielman, N.M., and R.L. Guerrant. 2004. Acute Infectious Diarrhea. N. Engl. J. Med. 350:38-47. Threlfall, E.J., M. Day, E. de Pinna, A. Charlett, K.L. Goodyear. 2006. Assessment of factors contributing to changes in the incidence of antimicrobial drug resistance in Salmonella enterica serotypes Enteritidis and Typhimurium from humans in England and Wales in 2000, 2002, and 2004. Int. J. Antimicrobial Agents. 28:389-395. Townes, J.M., A.A. Deodhar, E.S. Laine, K. Smith, H.E. Krug, A. Barkhuizen, M.E. Thompson, P.R. Cieslak, and J. Sobel. 2008. Reactive arthritis following culture-confirmed infections with bacterial enteric pathogens in Minnesota and Oregon: a population-based study. Ann. Theum. Dis. 67(12): 1689-96. Turcovský, I., K. Kiniková, H. Drahovská, and E. Kaclíková. 2011. Biochemical and molecular characterization of Cronobacter spp. (formally Enterobacter sakazakii) isolated from foods. Antoin van Leeuwenhoek. 99:257-269. Uesugi, A.R., M.D. Danyluk, and L.J. Harris. 2006. Survival of Salmonella Enteritidis phage type 30 on inoculated almonds stored at -20, 4, 23 and 35°C. J. Food Prot. 69:1851-1857. Ulukanli, Z., and E. Karadag. 2010. Bacteriological and fungal evaluation of some aromatic and taste giving herbs from Igdir region in eastern Anatolia of Turkey. Afr. J. Micro. Res. 4(22): 2397-2401.

References | 11
FDA Draft Risk Profile | 168
Unicomb, L.E., G. Simmons, T. Merritt, J. Gregory, C. Nicol, P. Jelfs, M. Kirk, A. Tan, R. Thomson, J. Adamopoulos, C.L. Little, A. Currie, and C.B. Dalton. 2005. Sesame seed products contaminated with Salmonella: three outbreaks associated with tahini. Epidemiol. Infect. 133(6):1065-1072. United Fresh. 2013. Produce GAPs Harmonization Initiative. Available at: http://www.unitedfresh.org/newsviews/gap_harmonization. Accessed 28 Feb. 2013. United States Code (U.S.C.). 2007. Food Drug and Cosmetic Act: 21 U.S.C. 350F- Reportable Food Registry. Available at: http://www.gpo.gov/fdsys/pkg/USCODE-2010-title21/pdf/USCODE-2010-title21-chap9-subchapIV-sec350f.pdf. Accessed 3 Jun. 2013. U.S. Department of Agriculture (USDA). 2012. Report of the U.S. Delegate, 44th Session, Codex Committee on Food Hygiene (CCFH), November 12-16, 2012, New Orleans, LA. Available at: http://www.fsis.usda.gov/wps/portal/fsis/topics/international-affairs/us-codex-alimentarius/recent-delegation-reports/delegate-report-44rd-session-ccfh. Accessed 10 Jun. 2013. U.S. Department of Agriculture/Agricultural Marketing Service (USDA/ARS). 2013. Produce GAPs Harmonized Food Safety Standards. Available at: http://www.ams.usda.gov/AMSv1.0/HarmonizedGAP. Accessed 25 Feb. 2013. U.S. Department of Agriculture/Animal and Plant Health Inspection Service (USDA/APHIS). 2011. Federal Register. 76 (144) July 27, 2011, pp. 44890-44891. Notice of decision to authorize the importation of garlic from the European Union and other countries. Available at: http://www.gpo.gov/fdsys/pkg/FR-2011-07-27/html/2011-19036.htm. Accessed 28 Jul. 2011. U.S. Department of Agriculture/Economic Research Service (USDA/ERS). 2012a. Data Sets, Food Availability Spreadsheets, “Vegetables (Legumes)” spreadsheet, “Dehydrating Onions: Supply and Disappearance” worksheet, Available at: http://www.ers.usda.gov/data-products/food-availability-(per-capita)-data-system.aspx. Accessed 4 Oct. 2012. U.S. Department of Agriculture/Economic Research Service (USDA/ERS). 2012b. Data Sets, Food Availability Spreadsheets, “Vegetables (fresh)” Spreadsheet, “Fresh Garlic – Supply and disappearance” worksheet. Available at: http://www.ers.usda.gov/data-products/food-availability-(per-capita)-data-system.aspx. Accessed 4 Oct. 2012. U.S. Department of Agriculture/Economic Research Service (USDA/ERS). 2012c. Data Sets, Food Availability Spreadsheets, “Coffee, tea, cocoa and spices” spreadsheet, “Spices: Supply and Disappearance” worksheet. Available at: http://www.ers.usda.gov/data-products/food-availability-(per-capita)-data-system.aspx. Accessed 4 Oct. 2012. U.S. Department of Agriculture/Food Safety Inspection Service (USDA/FSIS). 2012. Serotyping of salmonellae from meat and poultry products: Quarterly reports. Available at: http://www.fsis.usda.gov/wps/portal/fsis/topics/data-collection-and-reports/microbiology/quarterly-reports-salmonella-serotypes/serotyping-quarterly. Accessed 4 Aug. 2013. U.S. Department of Agriculture/Food Safety Inspection Service (USDA/FSIS). 2010. Recall Case Archive: 006-2010, Italian Sausage Products (Salmonella). Available at:

References | 11
FDA Draft Risk Profile | 169
http://www.fsis.usda.gov/wps/portal/fsis/topics/recalls-and-public-health-alerts/recall-case-archive/recall-case-archive-2010. Accessed 3 Jul. 2013. U.S. Department of Agriculture/Foreign Agricultural Service (USDA/FAS). 2011. Global Agricultural Trade System Online (GATS), GATS Home. Available at: http://www.fas.usda.gov/gats/default.aspx. Accessed 22 Oct. 2011. U.S. Pharmacopeia (USP). 2011. General Chapter 1211 – Sterilization and sterility assurance of compendial articles, USP33–NF28 Reissue second supplement (2010), U.S. Pharmacopeia Convention, Rockville, MD, p. R-1105. Vajdi, M. and R.R. Pereira. 1973. Comparative effects of ethylene oxide and γ-gamma irradiation and microwave treatment on selected species. J. Food Sci. 38(5) 893-895. Van Calenberg, S., G. Vanhaelewyn, O. Van Cleemput, F. Callens, W. Mondelaers, W. and A. Huyghebaert. 1998. Comparison of the effect of x-ray and electron beam irradiation on some selected spices. Lebensm.-Wiss. u.-Technol. 31:252-258. Van Doren, J.M., D. Kleinmeier, T. S. Hammack, and A. Westerman. 2013a. Prevalence, Serotype Diversity, and Antimicrobial Resistance of Salmonella in Imported Shipments of Spice offered for entry to the United States, FY2007-FY2009. Food Microbiol. 34:239-251. Van Doren, J.M., K.P. Neil, M. Parish, L. Gieraltowski, L.H. Gould, K.L. Gombas. 2013b. Foodborne Illness Outbreaks from Microbial Contaminants in Spices, 1973-2010. Food Microbiol. 36:456-464. Van Doren, J.M., R.J. Blodgett, R. Pouillot, A. Westerman, D. Kleinmeier, G.C. Ziobro, Y. Ma, T. Hammack, V. Gill, M. Muckenfuss, and L. Fabbri. 2013c. Prevalence, Level and Distribution of Salmonella in Imported Capsicum and Sesame Seed Spices offered for entry to the United States.: Observations and Modeling Results. Food Microbiol. 36: 149-160. Van Doren, J. 2011. FDA-memorandum of telephone conversation, Federal register docket: FDA-2010-N-0195, Document: FDA-2010-N-0195-0020. Available at: http://www.regulations.gov/#!documentDetail;D=FDA-2010-N-0195-0020. Accessed 26 Aug. 2011. Van Looveren, M., M.L. Chasseur-Libotte, C. Godard, C. Lammens, M. Wijdooghe, L. Peeters, H. Goossens. 2001. Antimicrobial susceptibility of nontyphoidal Salmonella isolated from humans in Belgium. Acta. Clin. Belg. 56(3):180-186. Vazquez, A. 1977. Chapter 9. Vertebrate pests: Birds, bat, rodents in: Training manual for analytical entomology in the food industry. J. Richard Gorham (ed.), FDA Technical Bulletin No. 2, Association of Official Analytical Chemists, Washington, DC Vij, V., E. Ailes, C. Wolyniak, F.J. Angulo, and K.C. Klontz. 2006. Recalls of spices due to bacterial contamination monitored by the U.S. Food and Drug Administration: The predominance of salmonellae. J. Food Prot. 69:233-237. Voetsch, A.C., T.J. Van Gilder, F.J. Angulo, M.M. Farley, S. Shallow, R. Marcus, P.R. Cieslak, V.C. Deneen, and R.V. Tauxe. 2004. FoodNet estimate of the burden of illness caused by nontyphoidal Salmonella infections in the United States. Clin. Infect. Dis. 38(Suppl. 3):S127-134. Waje, C.K., H.K. Kim, K.S. Kim, S. Todoriki, and J.H. Kwon. 2008. Physicochemical and Microbiological Qualities of Steamed and Irradiated Ground Black Pepper (Piper nigrum L.). J. Agric. Food Chem. 56:4592-4596.
References | 11
FDA Draft Risk Profile | 170
Wang, Y.C., Y.C. Chang, H.L. Chuang, C.C. Chiu, K.S. Yeh, C.C. Chang, S.L. Hsuan, W.H. Lin, and T.H. Chen. 2011. Transmission of Salmonella between swine farms by the housefly (Musca domestica). J. Food Prot. 74(6): 1012-1016. Weerakkody, N.S., N. Caffin, G.A. Dykes, and M.S. Turner. 2011. Effect of antimicrobial spice and herb extract combinations on Listeria monocytogenes, Staphylococcus aureus, and spoilage microflora growth on cooked ready-to-eat vacuum-packaged shrimp. J. Food Prot. 74(7):1119-1125. White, A.P., D.L. Gibson, G.A. Grassl, W.W. Kay, B.B. Finlay, B.A. Vallance, and M.G. Surette. 2008. Aggregation via the red, dry and rough morphotype is not a virulence adaption in Salmonella enterica serovar Typhimurium. Infect. Immun. 76(3):1048-1058. Williams, J.H., T.D. Phillips, P.E. Jolly, J.K. Stiles, C.M. Jolly, and D. Aggarwal. 2004. Human aflatoxicosis in developing countries: a review of toxicology, exposure, potential health consequences, and interventions. Am J. Clin. Nutr. 80(5) 1106-1122. Willis, C., C.L. Little, S. Sagoo, E. de Pinna, J. Threlfall. 2009. Assessment of the microbiological safety of edible dried seeds from retail premises in the United Kingdom with a focus on Salmonella spp. Food. Micro. 26: 847-852. Willis, C. 2013. The seeds for which enumeration was performed in Willis et al. (2009) included four samples of sesame seeds and 2 samples of mixed seeds (containing sesame, pumpkin, sunflower, linseed, hemp). The sample size for Salmonella screening was 25 g and for enumeration was 100 g. Personal communication. Available from FDA upon request. Winfield, M.D., and E.A. Groisman. 2003. Role of nonhost environments in the lifestyles of Salmonella and Escherichia coli. Appl. Environ. Microbiol. 69(7): 3687-3694. Witkowska, A.M., D.K. Hickey, M. Alonso-Gomez, M.G. Wilkinson. 2011. The microbiological quality of commercial herb and spice preparations used in the formulation of a chicken supreme ready meal and microbial survival following a simulated industrial heating process. Food Control. 22(3): 616-625. World Health Organization (WHO). 2013. Prevention of foodborne disease: Five keys to safer food. Available from: http://www.who.int/foodsafety/consumer/5keys/en/. Accessed 24 Jun. 2013. World Health Organization (WHO). 2012. Five keys to growing safer fruits and vegetables: promoting health by decreasing microbial contamination. Available from: http://www.who.int/foodsafety/consumer/5keys_growing_safer/en/index.html. Accessed 24 Jun. 2013. World Health Organization (WHO). 2007. Antigenic Formulae of the Salmonella Serovars, 9th edition, Patrick A.D. Grimont & François-Xavier Weill editors. Institut. Pasteur, 28 rue du Dr. Roux, 75724 Paris Cedex 15, France. World Health Organization (WHO). 2006. Five keys to safer food manual. Available from: http://www.who.int/foodsafety/publications/consumer/manual_keys.pdf. Accessed 24 Jun. 2013. World Health Organization (WHO). 2003. WHO Guidelines on Good Agricultural and Collection Practices (GACP) for Medicinal Plants. Available at: http://apps.who.int/medicinedocs/en/d/Js4928e/. Accessed 10 May 2011. World Health Organization (WHO). 1974. Salmonella surveillance: Salmonella Weltevreden outbreak associated with contaminated pepper. Wkly. Epidemiol. Rec. 42:351-352.

References | 11
FDA Draft Risk Profile | 171
World Health Organization/Food and Agriculture Organization of the United Nations (WHO/FAO). 2002. Risk assessments of Salmonella in eggs and broiler chickens. Microbiological Risk Assessment Series 2, 2002. World Health Organization/Global Foodborne Infections Network (WHO/GFN). 2012. GFN Country Databank: Data Summaries, Summary of all serotypes. Available at: http://thor.dfvf.dk/portal/page?_pageid=53,42311&_dad=portal&_schema=PORTAL. Accessed 14 Aug. 2012. Yang, B., D. Qu, X. Zhang, J. Shen, S. Cui, Y. Shi, M. Xi, M. Sheng, S. Zhi, J.Meng. 2010. Prevalence and characterization of Salmonella serovars in retail meats of marketplace in Shaanxi, China. Int. J. Food Microbiol. 141: 63-72. Yesair, J., and O.B. Williams. 1942. Spice contamination and its control. J. Food Sci. 7(2):118-126. Zaika, L. L. 1988. Spices and herbs: Their antimicrobial activity and its determination. J. Food Safety. 9:97-118. Zhao, S. 2008. Chapter 6: Antimicrobial-resistant food-borne pathogens in imported foods: Microbiological Issues and Challenges. M.P. Doyle and M. C. Erickson, Ed. ASM Press, Washington, D.C., pp. 159-185. Zhao, S., P.F. McDermott, S. Friedman, S. Qaiyumi, J. Abbott, C. Kiessling, S. Ayers, R. Singh, S. Hubert, J. Sofos, and D.G. White. 2006. Characterization of Antimicrobial-Resistant Salmonella Isolated from Imported Foods. J. Food Prot. 69(3):500-507. Zhao, S., A.R. Datta, S. Ayers, S. Friedman, R.D. Walker, and D.G. White. 2003. Antimicrobial-resistant Salmonella serovars isolated from imported foods. Int. J. Food Microbiol. 84: 87-92. Zhao, J. and P. Cranston. 1995. Microbial decontamination of black pepper by ozone and the effect of the treatment on volatile oil constituents of the spice. J. Sci. Food Agric. 68:11-18. Zweifel, C. and R. Stephan. 2012. Spices and herbs as source of Salmonella-related foodborne diseases. Food Res. Int. Int. 45(2): 765-769.
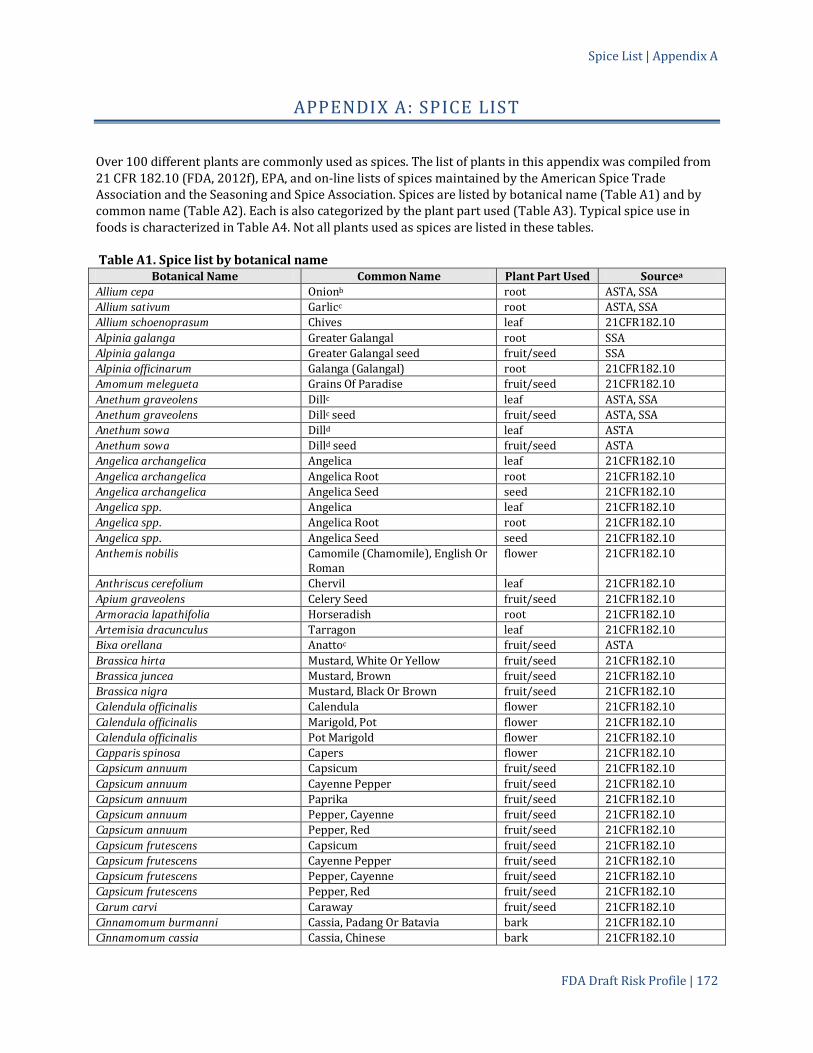
Spice List | Appendix A
FDA Draft Risk Profile | 172
APPENDIX A: SPICE LIST
Over 100 different plants are commonly used as spices. The list of plants in this appendix was compiled from 21 CFR 182.10 (FDA, 2012f), EPA, and on-line lists of spices maintained by the American Spice Trade Association and the Seasoning and Spice Association. Spices are listed by botanical name (Table A1) and by common name (Table A2). Each is also categorized by the plant part used (Table A3). Typical spice use in foods is characterized in Table A4. Not all plants used as spices are listed in these tables. Table A1. Spice list by botanical name
Botanical Name Common Name Plant Part Used Sourcea
Allium cepa Onionb root ASTA, SSA Allium sativum Garlicc root ASTA, SSA Allium schoenoprasum Chives leaf 21CFR182.10 Alpinia galanga Greater Galangal root SSA Alpinia galanga Greater Galangal seed fruit/seed SSA Alpinia officinarum Galanga (Galangal) root 21CFR182.10 Amomum melegueta Grains Of Paradise fruit/seed 21CFR182.10 Anethum graveolens Dillc leaf ASTA, SSA Anethum graveolens Dillc seed fruit/seed ASTA, SSA Anethum sowa Dilld leaf ASTA Anethum sowa Dilld seed fruit/seed ASTA Angelica archangelica Angelica leaf 21CFR182.10 Angelica archangelica Angelica Root root 21CFR182.10 Angelica archangelica Angelica Seed seed 21CFR182.10 Angelica spp. Angelica leaf 21CFR182.10 Angelica spp. Angelica Root root 21CFR182.10 Angelica spp. Angelica Seed seed 21CFR182.10 Anthemis nobilis Camomile (Chamomile), English Or
Roman flower 21CFR182.10
Anthriscus cerefolium Chervil leaf 21CFR182.10 Apium graveolens Celery Seed fruit/seed 21CFR182.10 Armoracia lapathifolia Horseradish root 21CFR182.10 Artemisia dracunculus Tarragon leaf 21CFR182.10 Bixa orellana Anattoc fruit/seed ASTA Brassica hirta Mustard, White Or Yellow fruit/seed 21CFR182.10 Brassica juncea Mustard, Brown fruit/seed 21CFR182.10 Brassica nigra Mustard, Black Or Brown fruit/seed 21CFR182.10 Calendula officinalis Calendula flower 21CFR182.10 Calendula officinalis Marigold, Pot flower 21CFR182.10 Calendula officinalis Pot Marigold flower 21CFR182.10 Capparis spinosa Capers flower 21CFR182.10 Capsicum annuum Capsicum fruit/seed 21CFR182.10 Capsicum annuum Cayenne Pepper fruit/seed 21CFR182.10 Capsicum annuum Paprika fruit/seed 21CFR182.10 Capsicum annuum Pepper, Cayenne fruit/seed 21CFR182.10 Capsicum annuum Pepper, Red fruit/seed 21CFR182.10 Capsicum frutescens Capsicum fruit/seed 21CFR182.10 Capsicum frutescens Cayenne Pepper fruit/seed 21CFR182.10 Capsicum frutescens Pepper, Cayenne fruit/seed 21CFR182.10 Capsicum frutescens Pepper, Red fruit/seed 21CFR182.10 Carum carvi Caraway fruit/seed 21CFR182.10 Cinnamomum burmanni Cassia, Padang Or Batavia bark 21CFR182.10 Cinnamomum cassia Cassia, Chinese bark 21CFR182.10

Spice List | Appendix A
FDA Draft Risk Profile | 173
Botanical Name Common Name Plant Part Used Sourcea
Cinnamomum cassia Cinnamon, Chinese bark 21CFR182.10 Cinnamomum loureirii Cassia, Saigon bark 21CFR182.10 Cinnamomum loureirii Cinnamon, Saigon bark 21CFR182.10 Cinnamomum zeylanicum Cinnamon, Ceylon bark 21CFR182.10 Citrus hystrix Kaffir Limed leaf SSA Citrus hystrix Kaffir Limed fruit/seed SSA Coriandrum sativum Coriander fruit/seed 21CFR182.10 Coriandrum sativum Coriander leaf 21CFR182.10 Crocus sativus Saffron flower 21CFR182.10 Cuminum cyminum Cumin (Cummin) fruit/seed 21CFR182.10 Curcuma longa Turmeric root 21CFR182.10 Curcuma zedoaria Zedoary root 21CFR182.10 Cymbopogon citratus Lemon Grassc leaf SSA Elettaria cardamomum Cardamom (Cardamon) fruit/seed 21CFR182.10 Foeniculum vulgare Fennel, Common fruit/seed 21CFR182.10 Foeniculum vulgare var. duice Fennel, Sweet (Finocchio, Florence
Fennel) fruit/seed 21CFR182.10
Galipea officinalis Angostura (Cusparia Bark) bark 21CFR182.10 Hibiscus abelmoschus Ambrette Seed fruit/seed 21CFR182.10 Hyssopus officinalis Hyssop leaf 21CFR182.10 Illicium verum Anise, Star fruit/seed 21CFR182.10 Illicium verum Star Anise fruit/seed 21CFR182.10 Juniperus communis Juniperc fruit/seed ASTA, SSA Laurus nobilis Bay leaf 21CFR182.10 Lavandula officinalis Lavender flower 21CFR182.10 Lippia spp. Oregano Oreganum, Mexican
Oregano, Mexican Sage, Origan) leaf 21CFR182.10
Majorana hortensis Marjoram, Sweet leaf 21CFR182.10 Majorana onites Marjoram, Pot leaf 21CFR182.10 Majorana onites Pot Marjoram leaf 21CFR182.10 Marrubium vulgare Horehound (Hoarhound) leaf 21CFR182.10 Matricaria chamomilla Camomile (Chamomile), German
Or Hungarian flower 21CFR182.10
Medicago sativa Alfalfa Herb And Seed leaf 21CFR182.10 Medicago sativa Alfalfa Herb And Seed seed 21CFR182.10 Melissa officinalis Balm (Lemon Balm) leaf 21CFR182.10 Mentha piperita Peppermint leaf 21CFR182.10 Mentha spicata Spearmint leaf 21CFR182.10 Myristica fragrans Mace fruit/seed 21CFR182.10 Myristica fragrans Nutmeg fruit/seed 21CFR182.10 Nigella sativa Caraway, Black (Black Cumin) fruit/seed 21CFR182.10 Nigella sativa Cumin, Black (Black Caraway) fruit/seed 21CFR182.10 Ocimum basilicum Basil, Sweet leaf 21CFR182.10 Ocimum minimum Basil, Bush leaf 21CFR182.10 Origanum vulgare Oreganoc leaf ASTA, SSA Papayer somniferum Poppy Seed fruit/seed 21CFR182.10 Pelargonium spp. Geranium leaf 21CFR182.10 Petroselinum crispum Parsley leaf 21CFR182.10 Pimenta officinalis Allspice fruit/seed 21CFR182.10 Pimpinella anisum Anise fruit/seed 21CFR182.10 Piper nigrum Pepper, Black fruit/seed 21CFR182.10 Piper nigrum Pepper, White fruit/seed 21CFR182.10 Rosmarinus officinalis Rosemary leaf 21CFR182.10 Salvia officinalis Sage leaf 21CFR182.10 Salvia sclarea Clary (Clary Sage) leaf 21CFR182.10

Spice List | Appendix A
FDA Draft Risk Profile | 174
Botanical Name Common Name Plant Part Used Sourcea
Salvia triloba Sage, Greek leaf 21CFR182.10 Sambucus canadensis Elder Flowers flower 21CFR182.10 Satureia hortensis (Satureja). Savory, Summer leaf 21CFR182.10 Satureia montana (Satureja). Savory, Winter leaf 21CFR182.10 Schinus terebinthifolia Pink Pepperc fruit/seed ASTA, SSA Sesamum indicum Sesame fruit/seed 21CFR182.10 Syzygium aromaticum Clovesc flower ASTA, SSA Thymus serpyllume Thyme, Wild Or Creeping leaf 21CFR182.10 Thymus vulgarise Thyme leaf 21CFR182.10 Tilia spp. Linden Flowers flower 21CFR182.10 Trifolium spp. Clover leaf 21CFR182.10 Trigonella foenum-graecum Fenugreek fruit/seed 21CFR182.10 Vanilla planifolia Vanilla fruit/seed 21CFR182.10 Vanilla tahitensis Vanilla fruit/seed 21CFR182.10 Zanthoxylum piperitum Sichuan Pepperb fruit/seed SSA Zingiber officinale Ginger root 21CFR182.10 a Plants listed as spices in commerce as cited by 21CFR182.10 (FDA, 2012f), ASTA (2012), or SSA (2012). b Common name is from Herbs of Commerce (McGuffin et al., 2000). c Common name is from Herbs of Commerce (McGuffin et al., 2000) as per 21 CFR101.4(h) (FDA, 2012q) d Common name from source(s) noted. e ASTA (2012) includes the species Thymus satureioides (thyme) on their list of spices. There is no history of use as a food in either GRIN, World Spice Plants, or Mansfeld’s World Database of Agricultural and Horticultural Crops. It is a valid scientific name in the Missouri Botanical Garden Tropicos database as Thymus saturejoides Coss.

Spice List | Appendix A
FDA Draft Risk Profile | 175
Table A2. Spice list by common name
Common name Botanical name Plant Part Used Sourcea
Alfalfa Medicago sativa leaf 21CFR182.10 Alfalfa Medicago sativa seed 21CFR182.10 Allspice Pimenta officinalis fruit/seed 21CFR182.10 Ambrette Seed Hibiscus abelmoschus fruit/seed 21CFR182.10 Anattoc Bixa orellana fruit/seed ASTA Angelica Angelica archangelica leaf 21CFR182.10 Angelica Angelica spp. leaf 21CFR182.10 Angelica Angelica archangelica root 21CFR182.10 Angelica Angelica spp. root 21CFR182.10 Angelica Angelica archangelica seed 21CFR182.10 Angelica Angelica spp. seed 21CFR182.10 Angostura (Cusparia Bark) Galipea officinalis bark 21CFR182.10 Anise Pimpinella anisum fruit/seed 21CFR182.10 Anise, Star Illicium verum fruit/seed 21CFR182.10 Balm (Lemon Balm) Melissa officinalis leaf 21CFR182.10 Basil, Bush Ocimum minimum leaf 21CFR182.10 Basil, Sweet Ocimum basilicum leaf 21CFR182.10 Bay Laurus nobilis leaf 21CFR182.10 Calendula Calendula officinalis flower 21CFR182.10 Camomile (Chamomile), English Or Roman Anthemis nobilis flower 21CFR182.10
Camomile (Chamomile), German Or Hungarian Matricaria chamomilla flower 21CFR182.10
Capers Capparis spinosa flower 21CFR182.10 Capsicum Capsicum annuum fruit/seed 21CFR182.10 Capsicum Capsicum frutescens fruit/seed 21CFR182.10 Caraway Carum carvi fruit/seed 21CFR182.10 Caraway, Black (Black Cumin) Nigella sativa fruit/seed 21CFR182.10 Cardamom (Cardamon) Elettaria cardamomum fruit/seed 21CFR182.10 Cassia, Chinese Cinnamomum cassia bark 21CFR182.10 Cassia, Padang Or Batavia Cinnamomum burmanni bark 21CFR182.10 Cassia, Saigon Cinnamomum loureirii bark 21CFR182.10 Cayenne Pepper Capsicum annuum fruit/seed 21CFR182.10 Cayenne Pepper Capsicum frutescens fruit/seed 21CFR182.10 Celery Seed Apium graveolens fruit/seed 21CFR182.10 Chervil Anthriscus cerefolium leaf 21CFR182.10 Chives Allium schoenoprasum leaf 21CFR182.10 Cinnamon, Ceylon Cinnamomum zeylanicum bark 21CFR182.10 Cinnamon, Chinese Cinnamomum cassia bark 21CFR182.10 Cinnamon, Saigon Cinnamomum loureirii bark 21CFR182.10 Clary (Clary Sage) Salvia sclarea leaf 21CFR182.10 Clover Trifolium spp. leaf 21CFR182.10 Clovesc Syzygium aromaticum flower ASTA, SSA Coriander Coriandrum sativum leaf 21CFR182.10 Coriander Coriandrum sativum fruit/seed 21CFR182.10 Cumin (Cummin) Cuminum cyminum fruit/seed 21CFR182.10 Cumin, Black (Black Caraway) Nigella sativa fruit/seed 21CFR182.10 Dillc Anethum graveolens leaf ASTA, SSA Dillc Anethum graveolens fruit/seed ASTA, SSA Dilld Anethum sowa leaf ASTA, SSA Dilld Anethum sowa fruit/seed ASTA, SSA Elder Flowers Sambucus canadensis flower 21CFR182.10 Fennel, Common Foeniculum vulgare fruit/seed 21CFR182.10 Fennel, Sweet (Finocchio, Florence Fennel) Foeniculum vulgare var. duice fruit/seed 21CFR182.10
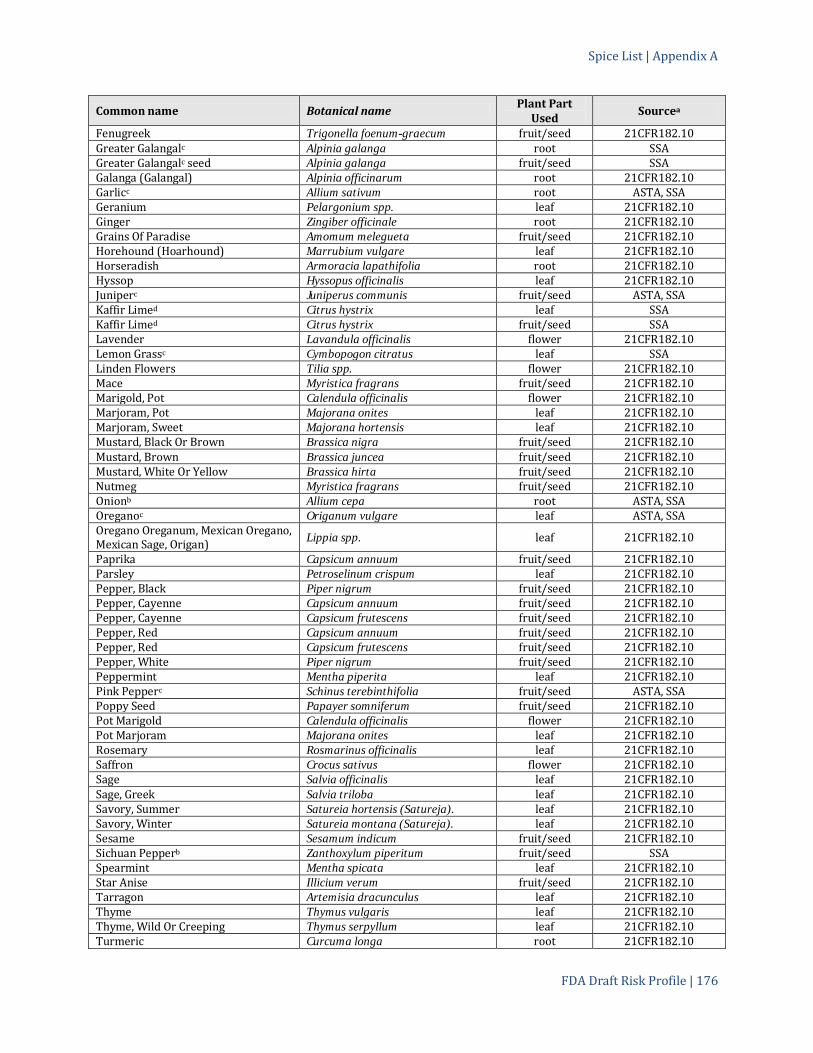
Spice List | Appendix A
FDA Draft Risk Profile | 176
Common name Botanical name Plant Part Used Sourcea
Fenugreek Trigonella foenum-graecum fruit/seed 21CFR182.10 Greater Galangalc Alpinia galanga root SSA Greater Galangalc seed Alpinia galanga fruit/seed SSA Galanga (Galangal) Alpinia officinarum root 21CFR182.10 Garlicc Allium sativum root ASTA, SSA Geranium Pelargonium spp. leaf 21CFR182.10 Ginger Zingiber officinale root 21CFR182.10 Grains Of Paradise Amomum melegueta fruit/seed 21CFR182.10 Horehound (Hoarhound) Marrubium vulgare leaf 21CFR182.10 Horseradish Armoracia lapathifolia root 21CFR182.10 Hyssop Hyssopus officinalis leaf 21CFR182.10 Juniperc Juniperus communis fruit/seed ASTA, SSA Kaffir Limed Citrus hystrix leaf SSA Kaffir Limed Citrus hystrix fruit/seed SSA Lavender Lavandula officinalis flower 21CFR182.10 Lemon Grassc Cymbopogon citratus leaf SSA Linden Flowers Tilia spp. flower 21CFR182.10 Mace Myristica fragrans fruit/seed 21CFR182.10 Marigold, Pot Calendula officinalis flower 21CFR182.10 Marjoram, Pot Majorana onites leaf 21CFR182.10 Marjoram, Sweet Majorana hortensis leaf 21CFR182.10 Mustard, Black Or Brown Brassica nigra fruit/seed 21CFR182.10 Mustard, Brown Brassica juncea fruit/seed 21CFR182.10 Mustard, White Or Yellow Brassica hirta fruit/seed 21CFR182.10 Nutmeg Myristica fragrans fruit/seed 21CFR182.10 Onionb Allium cepa root ASTA, SSA Oreganoc Origanum vulgare leaf ASTA, SSA Oregano Oreganum, Mexican Oregano, Mexican Sage, Origan) Lippia spp. leaf 21CFR182.10
Paprika Capsicum annuum fruit/seed 21CFR182.10 Parsley Petroselinum crispum leaf 21CFR182.10 Pepper, Black Piper nigrum fruit/seed 21CFR182.10 Pepper, Cayenne Capsicum annuum fruit/seed 21CFR182.10 Pepper, Cayenne Capsicum frutescens fruit/seed 21CFR182.10 Pepper, Red Capsicum annuum fruit/seed 21CFR182.10 Pepper, Red Capsicum frutescens fruit/seed 21CFR182.10 Pepper, White Piper nigrum fruit/seed 21CFR182.10 Peppermint Mentha piperita leaf 21CFR182.10 Pink Pepperc Schinus terebinthifolia fruit/seed ASTA, SSA Poppy Seed Papayer somniferum fruit/seed 21CFR182.10 Pot Marigold Calendula officinalis flower 21CFR182.10 Pot Marjoram Majorana onites leaf 21CFR182.10 Rosemary Rosmarinus officinalis leaf 21CFR182.10 Saffron Crocus sativus flower 21CFR182.10 Sage Salvia officinalis leaf 21CFR182.10 Sage, Greek Salvia triloba leaf 21CFR182.10 Savory, Summer Satureia hortensis (Satureja). leaf 21CFR182.10 Savory, Winter Satureia montana (Satureja). leaf 21CFR182.10 Sesame Sesamum indicum fruit/seed 21CFR182.10 Sichuan Pepperb Zanthoxylum piperitum fruit/seed SSA Spearmint Mentha spicata leaf 21CFR182.10 Star Anise Illicium verum fruit/seed 21CFR182.10 Tarragon Artemisia dracunculus leaf 21CFR182.10 Thyme Thymus vulgaris leaf 21CFR182.10 Thyme, Wild Or Creeping Thymus serpyllum leaf 21CFR182.10 Turmeric Curcuma longa root 21CFR182.10

Spice List | Appendix A
FDA Draft Risk Profile | 177
Common name Botanical name Plant Part Used Sourcea
Vanilla Vanilla planifolia fruit/seed 21CFR182.10 Vanilla Vanilla tahitensis fruit/seed 21CFR182.10 Zedoary Curcuma zedoaria root 21CFR182.10 a Plants listed as spices in commerce as cited by 21CFR182.10 (FDA, 2012f), ASTA (2012), or SSA (2012). b Common name is from Herbs of Commerce (McGuffin et al., 2000). c Common name is from Herbs of Commerce (McGuffin et al., 2000) as per 21 CFR101.4(h) (FDA, 2012q) d Common name from source(s) noted. e ASTA (2012) includes the species Thymus satureioides (thyme) on their list of spices. There is no history of use as a food in either GRIN, World Spice Plants, or Mansfeld’s World Database of Agricultural and Horticultural Crops. It is a valid scientific name in the Missouri Botanical Garden Tropicos database as Thymus saturejoides Coss.
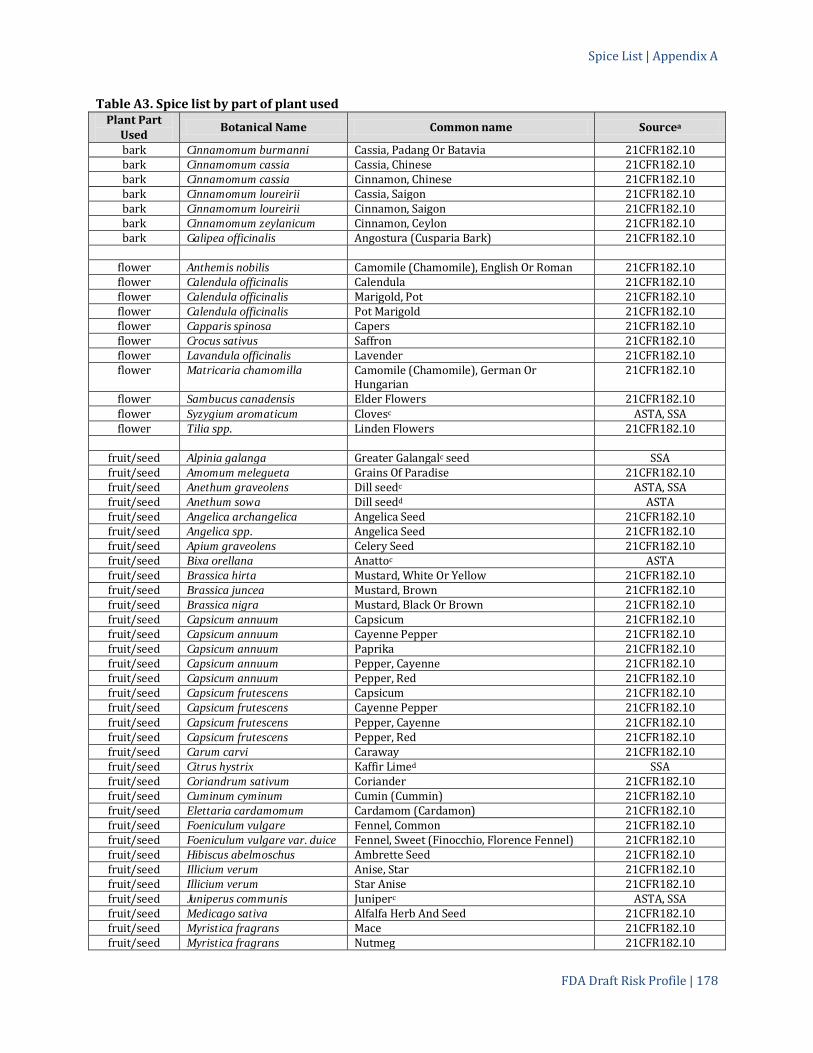
Spice List | Appendix A
FDA Draft Risk Profile | 178
Table A3. Spice list by part of plant used Plant Part
Used Botanical Name Common name Sourcea
bark Cinnamomum burmanni Cassia, Padang Or Batavia 21CFR182.10 bark Cinnamomum cassia Cassia, Chinese 21CFR182.10 bark Cinnamomum cassia Cinnamon, Chinese 21CFR182.10 bark Cinnamomum loureirii Cassia, Saigon 21CFR182.10 bark Cinnamomum loureirii Cinnamon, Saigon 21CFR182.10 bark Cinnamomum zeylanicum Cinnamon, Ceylon 21CFR182.10 bark Galipea officinalis Angostura (Cusparia Bark) 21CFR182.10
flower Anthemis nobilis Camomile (Chamomile), English Or Roman 21CFR182.10 flower Calendula officinalis Calendula 21CFR182.10 flower Calendula officinalis Marigold, Pot 21CFR182.10 flower Calendula officinalis Pot Marigold 21CFR182.10 flower Capparis spinosa Capers 21CFR182.10 flower Crocus sativus Saffron 21CFR182.10 flower Lavandula officinalis Lavender 21CFR182.10 flower Matricaria chamomilla Camomile (Chamomile), German Or
Hungarian 21CFR182.10
flower Sambucus canadensis Elder Flowers 21CFR182.10 flower Syzygium aromaticum Clovesc ASTA, SSA flower Tilia spp. Linden Flowers 21CFR182.10
fruit/seed Alpinia galanga Greater Galangalc seed SSA fruit/seed Amomum melegueta Grains Of Paradise 21CFR182.10 fruit/seed Anethum graveolens Dill seedc ASTA, SSA fruit/seed Anethum sowa Dill seedd ASTA fruit/seed Angelica archangelica Angelica Seed 21CFR182.10 fruit/seed Angelica spp. Angelica Seed 21CFR182.10 fruit/seed Apium graveolens Celery Seed 21CFR182.10 fruit/seed Bixa orellana Anattoc ASTA fruit/seed Brassica hirta Mustard, White Or Yellow 21CFR182.10 fruit/seed Brassica juncea Mustard, Brown 21CFR182.10 fruit/seed Brassica nigra Mustard, Black Or Brown 21CFR182.10 fruit/seed Capsicum annuum Capsicum 21CFR182.10 fruit/seed Capsicum annuum Cayenne Pepper 21CFR182.10 fruit/seed Capsicum annuum Paprika 21CFR182.10 fruit/seed Capsicum annuum Pepper, Cayenne 21CFR182.10 fruit/seed Capsicum annuum Pepper, Red 21CFR182.10 fruit/seed Capsicum frutescens Capsicum 21CFR182.10 fruit/seed Capsicum frutescens Cayenne Pepper 21CFR182.10 fruit/seed Capsicum frutescens Pepper, Cayenne 21CFR182.10 fruit/seed Capsicum frutescens Pepper, Red 21CFR182.10 fruit/seed Carum carvi Caraway 21CFR182.10 fruit/seed Citrus hystrix Kaffir Limed SSA fruit/seed Coriandrum sativum Coriander 21CFR182.10 fruit/seed Cuminum cyminum Cumin (Cummin) 21CFR182.10 fruit/seed Elettaria cardamomum Cardamom (Cardamon) 21CFR182.10 fruit/seed Foeniculum vulgare Fennel, Common 21CFR182.10 fruit/seed Foeniculum vulgare var. duice Fennel, Sweet (Finocchio, Florence Fennel) 21CFR182.10 fruit/seed Hibiscus abelmoschus Ambrette Seed 21CFR182.10 fruit/seed Illicium verum Anise, Star 21CFR182.10 fruit/seed Illicium verum Star Anise 21CFR182.10 fruit/seed Juniperus communis Juniperc ASTA, SSA fruit/seed Medicago sativa Alfalfa Herb And Seed 21CFR182.10 fruit/seed Myristica fragrans Mace 21CFR182.10 fruit/seed Myristica fragrans Nutmeg 21CFR182.10

Spice List | Appendix A
FDA Draft Risk Profile | 179
Plant Part Used Botanical Name Common name Sourcea
fruit/seed Nigella sativa Caraway, Black (Black Cumin) 21CFR182.10 fruit/seed Nigella sativa Cumin, Black (Black Caraway) 21CFR182.10 fruit/seed Papayer somniferum Poppy Seed 21CFR182.10 fruit/seed Pimpinella anisum Anise 21CFR182.10 fruit/seed Pimenta officinalis Allspice 21CFR182.10 fruit/seed Piper nigrum Pepper, Black 21CFR182.10 fruit/seed Piper nigrum Pepper, White 21CFR182.10 fruit/seed Schinus terebinthifolia Pink Pepperc ASTA, SSA fruit/seed Sesamum indicum Sesame 21CFR182.10 fruit/seed Trigonella foenum-graecum Fenugreek 21CFR182.10 fruit/seed Vanilla planifolia Vanilla 21CFR182.10 fruit/seed Vanilla tahitensis Vanilla 21CFR182.10 fruit/seed Zanthoxylum piperitum Sichuan Pepperb SSA
leaf Allium schoenoprasum Chives 21CFR182.10 leaf Anethum graveolens Dillc ASTA, SSA leaf Anethum sowa Dilld seed ASTA leaf Angelica archangelica Angelica 21CFR182.10 leaf Angelica spp. Angelica 21CFR182.10 leaf Anthriscus cerefolium Chervil 21CFR182.10 leaf Artemisia dracunculus Tarragon 21CFR182.10 leaf Citrus hystrix Kaffir Limed SSA leaf Coriandrum sativum Coriander 21CFR182.10 leaf Cymbopogon citratus Lemon Grassc SSA leaf Hyssopus officinalis Hyssop 21CFR182.10 leaf Laurus nobilis Bay 21CFR182.10 leaf Lippia spp. Oregano Oreganum, Mexican Oregano,
Mexican Sage, Origan) 21CFR182.10
leaf Majorana hortensis Marjoram, Sweet 21CFR182.10 leaf Majorana onites Marjoram, Pot 21CFR182.10 leaf Majorana onites Pot Marjoram 21CFR182.10 leaf Marrubium vulgare Horehound (Hoarhound) 21CFR182.10 leaf Medicago sativa Alfalfa Herb And Seed 21CFR182.10 leaf Melissa officinalis Balm (Lemon Balm) 21CFR182.10 leaf Mentha piperita Peppermint 21CFR182.10 leaf Mentha spicata Spearmint 21CFR182.10 leaf Ocimum basilicum Basil, Sweet 21CFR182.10 leaf Ocimum minimum Basil, Bush 21CFR182.10 leaf Origanum vulgare Oreganoc ASTA, SSA leaf Pelargonium spp. Geranium 21CFR182.10 leaf Petroselinum crispum Parsley 21CFR182.10 leaf Rosmarinus officinalis Rosemary 21CFR182.10 leaf Salvia officinalis Sage 21CFR182.10 leaf Salvia sclarea Clary (Clary Sage) 21CFR182.10 leaf Salvia triloba Sage, Greek 21CFR182.10 leaf Satureia hortensis (Satureja). Savory, Summer 21CFR182.10 leaf Satureia montana (Satureja). Savory, Winter 21CFR182.10 leaf Thymus serpyllum Thyme, Wild Or Creeping 21CFR182.10 leaf Thymus vulgaris Thyme 21CFR182.10 leaf Trifolium spp. Clover 21CFR182.10
root Allium cepa Onionb ASTA, SSA root Allium sativum Garlicc ASTA, SSA root Alpinia galanga Greater Galangalc SSA root Alpinia officinarum Galanga (Galangal) 21CFR182.10 root Angelica archangelica Angelica Root 21CFR182.10

Spice List | Appendix A
FDA Draft Risk Profile | 180
Plant Part Used Botanical Name Common name Sourcea
root Angelica spp. Angelica Root 21CFR182.10 root Armoracia lapathifolia Horseradish 21CFR182.10 root Curcuma longa Turmeric 21CFR182.10 root Curcuma zedoaria Zedoary 21CFR182.10 root Zingiber officinale Ginger 21CFR182.10
a Plants listed as spices in commerce as cited by 21CFR182.10 (FDA, 2012f), ASTA (2012), or SSA (2012). b Common name is from Herbs of Commerce (McGuffin et al., 2000). c Common name is from Herbs of Commerce (McGuffin et al., 2000) as per 21 CFR101.4(h) (FDA, 2012q) d Common name from source(s) noted. e ASTA (2012) includes the species Thymus satureioides (thyme) on their list of spices. There is no history of use as a food in either GRIN, World Spice Plants, or Mansfeld’s World Database of Agricultural and Horticultural Crops. It is a valid scientific name in the Missouri Botanical Garden Tropicos database as Thymus saturejoides Coss.

Spice List | Appendix A
FDA Draft Risk Profile | 181
Table A4. Common use of spice in foods Common use of spice in foods is characterized as raw, cooked or both. Spice use was assigned “raw” when dry spice is typically added to food without a microbial kill step. The term “cooked” was assigned when the cooking step is expected to provide an effective microbial kill step. The term “both” was assigned when both raw and cooked uses were identified or when the cooking step is not expected to always be sufficient to provide an effective kill step. Assignment of spice use is based on recipes and information on spice use available on the internet. More research is needed to distinguish use by cuisine or culture.
Common name Botanical name Plant Part Used
How used raw/cooked
Alfalfa Medicago sativa leaf raw Alfalfa Medicago sativa fruit/seed both Allspice Pimenta officinalis fruit cooked Ambrette Seed Hibiscus abelmoschus fruit/seed both Anattoc Bixa orellana fruit/seed both
Angelica Angelica archangelica leaf both Angelica Angelica spp. leaf both Angelica Angelica archangelica root cooked Angelica Angelica spp. root cooked Angelica Angelica archangelica seed cooked Angelica Angelica spp. seed cooked Angostura (Cusparia Bark) Galipea officinalis bark cooked Anise Pimpinella anisum fruit/seed both Anise, Star; Star Anise Illicium verum fruit/seed cooked Balm (Lemon Balm) Melissa officinalis leaf both Basil, Bush Ocimum minimum leaf both Basil, Sweet Ocimum basilicum leaf both Bay Laurus nobilis leaf cooked Calendula Calendula officinalis flower cooked Camomile (Chamomile), English Or Roman Anthemis nobilis flower both Camomile (Chamomile), German Or Hungarian Matricaria chamomilla flower both Capers Capparis spinosa flower both Capsicum Capsicum annuum fruit/seed both Capsicum Capsicum frutescens fruit/seed both Caraway Carum carvi fruit/seed both Caraway, Black (Black Cumin) Nigella sativa fruit/seed both Cardamom (Cardamon) Elettaria cardamomum fruit/seed both Cassia, Chinese Cinnamomum cassia bark both Cassia, Padang Or Batavia Cinnamomum burmanni bark both Cassia, Saigon Cinnamomum loureirii bark both Cayenne Pepper Capsicum annuum fruit/seed both Cayenne Pepper Capsicum frutescens fruit/seed both Celery Seed Apium graveolens fruit/seed both Chervil Anthriscus cerefolium leaf both Chives Allium schoenoprasum leaf both Cinnamon, Ceylon Cinnamomum zeylanicum bark both Cinnamon, Chinese Cinnamomum cassia bark both Cinnamon, Saigon Cinnamomum loureirii bark both Clary (Clary Sage) Salvia sclarea leaf cooked Clover Trifolium spp. leaf both Clovesc Syzygium aromaticum flower both Coriander Coriandrum sativum leaf both Coriander Coriandrum sativum fruit/seed both Cumin (Cummin) Cuminum cyminum fruit/seed both Cumin, Black (Black Caraway); Caraway, black (black cumin)
Nigella sativa fruit/seed both
Dill Anethum graveolens leaf both Elder Flowers Sambucus canadensis flower cooked

Spice List | Appendix A
FDA Draft Risk Profile | 182
Common name Botanical name Plant Part Used
How used raw/cooked
Fennel, Common Foeniculum vulgare fruit/seed cooked Fennel, Sweet (Finocchio, Florence Fennel) Foeniculum vulgare var.
duice fruit/seed cooked
Fenugreek Trigonella foenum-graecum
fruit/seed both
Greater Galangalc Alpinia galanga root both Galanga (Galangal) Alpinia officinarum root both Garlicc Allium sativum root both Geranium Pelargonium spp. leaf raw Ginger Zingiber officinale root both Grains Of Paradise Amomum melegueta fruit/seed both Horehound (Hoarhound) Marrubium vulgare leaf both Horseradish Armoracia lapathifolia root raw Hyssop Hyssopus officinalis leaf both Juniperc Juniperus communis fruit/seed cooked Kaffir Limed Citrus hystrix leaf cooked Kaffir Limed Citrus hystrix fruit/seed both Lavender Lavandula officinalis flower both Lemon Grassc Cymbopogon citratus leaf both Linden Flowers Tilia spp. flower both Mace Myristica fragrans fruit/seed both Marigold, Pot; Pot Marigold Calendula officinalis flower cooked Marjoram, Pot; Pot Marjoram Majorana onites leaf both Marjoram, Sweet Majorana hortensis leaf both Mustard, Black Or Brown Brassica nigra fruit/seed both Mustard, Brown Brassica juncea fruit/seed both Mustard, White Or Yellow Brassica hirta fruit/seed both Nutmeg Myristica fragrans fruit/seed both Onionb Allium cepa root both Oreganoc Origanum vulgare leaf both Oregano Oreganum, Mexican Oregano, Mexican Sage, Origan)
Lippia spp. leaf both
Paprika Capsicum annuum fruit/seed both Parsley Petroselinum crispum leaf both Pepper, Black Piper nigrum fruit/seed both Pepper, Cayenne Capsicum annuum fruit/seed both Pepper, Cayenne Capsicum frutescens fruit/seed both Pepper, Red Capsicum annuum fruit/seed both Pepper, Red Capsicum frutescens fruit/seed both Pepper, White Piper nigrum fruit/seed both Peppermint Mentha piperita leaf both Pink Pepperc Schinus terebinthifolia fruit/seed both Poppy Seed Papayer somniferum fruit/seed both Rosemary Rosmarinus officinalis leaf both Saffron Crocus sativus flower cooked Sage Salvia officinalis leaf both Sage, Greek Salvia triloba leaf both Savory, Summer Satureia hortensis
(Satureja). leaf cooked
Savory, Winter Satureia montana (Satureja).
leaf cooked
Sesame Sesamum indicum fruit/seed both Sichuan Pepperb Zanthoxylum piperitum fruit/seed both Spearmint Mentha spicata leaf both Tarragon Artemisia dracunculus leaf both Thyme Thymus vulgaris leaf both

Spice List | Appendix A
FDA Draft Risk Profile | 183
Common name Botanical name Plant Part Used
How used raw/cooked
Thyme, Wild Or Creeping Thymus serpyllum leaf both Turmeric Curcuma longa root cooked Vanilla Vanilla planifolia fruit/seed cooked Vanilla Vanilla tahitensis fruit/seed cooked Zedoary Curcuma zedoaria root cooked a Plants listed as spices in commerce as cited by 21CFR182.10 (FDA, 2012f), ASTA (2012), or SSA (2012). b Common name is from Herbs of Commerce (McGuffin et al., 2000). c Common name is from Herbs of Commerce (McGuffin et al., 2000) as per 21 CFR101.4(h) (FDA, 2012q) d Common name from source(s) noted. e ASTA (2012) includes the species Thymus satureioides (thyme) on their list of spices. There is no history of use as a food in either GRIN, World Spice Plants, or Mansfeld’s World Database of Agricultural and Horticultural Crops. It is a valid scientific name in the Missouri Botanical Garden Tropicos database as Thymus saturejoides Coss.

FDA Draft Risk Profile | 184
APPENDIX B: WORLDWIDE SPICE PRODUCTION
The worldwide spice production data for 2009 included in this appendix was obtained from the FAO FAOSTAT Production website (FAO, 2013b). The top 20 producers are listed for each spice and the spice descriptions, country production, percent of worldwide production and data source listed were obtained from this FAO source. Table B1. Worldwide Spice Production 2009
Spice Worldwide Production (Metric Tonnes)
Anise, badian, fennel, coriander 499,626 Chilies and peppers, dry 3,137,545 Cinnamon (canella) 155,400 Cloves 104,881 Garlic 22,282,060 Ginger 1,615,974 Mustard seed 683,918 Nutmeg, mace and cardamoms 77,641 Onions, dry 73,231,830 Pepper (Piper spp.) 451,220 Poppy seed 98,835 Sesame seed 3,976,968 Spices, nesa 1,588,807 Vanilla 9,815
a nes: not elsewhere specified Table B2. Anise, badian, fennel, coriander Include: anise (Pimpinella anisum); badian or star anise (Illicium verum); caraway (Carum carvi); coriander (Coriandrum sativum); cumin (Cuminum cyminum); fennel (Foeniculum vulgare); juniper berries (Juniperus communis). Seeds and berries from the various plants listed. They are normally used as spices, but also have industrial (e.g. in distilleries) and medicinal applications.
Country Metric Tonnes % of Worldwide Production Data Sourcea India 176,615 35.35 Im Mexico 50,000 10.01 F China 42,000 8.41 F Bulgaria 33,957 6.80 Im Iran (Islamic Republic of) 31,431 6.29 Im Syrian Arab Republic 30,829 6.17 Morocco 23,000 4.60 F Egypt 22,000 4.40 F Russian Federation 11,200 2.24 Tunisia 9,800 1.96 F Turkey 9,472 1.90 Afghanistan 8,904 1.78 Im Peru 7,194 1.44 F Canada 7,068 1.41 F Romania 7,063 1.41 Viet Nam 5,080 1.02 Im Ukraine 4,509 0.90 Im Australia 2,940 0.59 Hungary 2,906 0.58 Im Occupied Palestinian Territory 2,706 0.54 F
a FAO official data unless noted otherwise. Im: FAO data based on imputation methodology; F: FAO estimate.

Worldwide Spice Production | Appendix B
FDA Draft Risk Profile | 185
Table B3. Chillies and peppers, dry Red and cayenne pepper, paprika, chillies (Capsicum frutescens; C. annuum); allspice, Jamaica pepper (Pimenta officinalis). Uncrushed or unground fresh pimentos are considered to be vegetables.
Country Metric Tonnes % of Worldwide Production Data Sourcea India 1,300,000 43.155 F China 260,000 8.29 F Pakistan 186,700 5.95 Thailand 170,125 5.42 Peru 140,216 4.47 Im Ethiopia 118,514 3.78 Im Myanmar 116,000 3.70 F Viet Nam 112,937 3.60 Im Bangladesh 109,337 3.48 Ghana 93,641 2.98 F Mexico 50,988 1.63 Im Nigeria 50,000 1.59 F Egypt 45,600 1.45 F Romania 35,251 1.12 Im Democratic Republic of the Congo 32,000 1.02 F Benin 25,867 0.82 Bosnia and Herzegovina 20,429 0.65 Im Côte d'Ivoire 20,000 0.64 F Hungary 19,982 0.64 Morocco 18,265 0.58 Im
a FAO official data unless noted otherwise. Im: FAO data based on imputation methodology; F: FAO estimate/ Table B4. Cinnamon (canella) Ceylon cinnamon (Cinnamomum zeylanicum); Chinese, common cinnamon, cassia (C. cassia). The inner bark of young branches of certain trees of the Laurus family. Includes cinnamon- tree flowers, cinnamon fruit and cinnamon waste (chips), whether whole, crushed or ground.
Country Metric Tonnes % of worldwide Production Data Sourcea Indonesia 67,209 43.25 Im China 58,000 37.32 F Sri Lanka 14,600 9.40 Viet Nam 13,965 8.99 Im Madagascar 1,253 0.81 Im Timor-Leste 133 0.09 Im Sao Tome and Principe 70 0.05 F Seychelles 63 0.04 Dominica 52 0.03 Im Grenada 37 0.02 F Comoros 18 0.01 Im
a FAO official data unless noted otherwise. Im: FAO data based on imputation methodology; F: FAO estimate.

Worldwide Spice Production | Appendix B
FDA Draft Risk Profile | 186
Table B5. Cloves Eugenia caryophyllata; Caryophyllus aromaticus. The whole fruit of the clove tree, including the flowers picked before maturity and dried in the sun, and the stems of the clove flowers.
Country Metric Tonnes % of Worldwide Production Data Sourcea Indonesia 81,000 77.23 F Madagascar 7,594 7.24 Im United Republic of Tanzania 7,518 7.17 Im Sri Lanka 3,790 3.61 Comoros 2,658 2.53 Im Kenya 1,159 1.11 Im China 900 0.86 F Malaysia 249 0.24 Im Grenada 13 0.01 F
a FAO official data unless noted otherwise. Im: FAO data based on imputation methodology; F: FAO estimate. Table B6. Garlic Allium sativum. Numbers reflect fresh garlic production.
Country Metric Tonnes % of Worldwide Production Data Sourcea China 17,967,857 80.64 India 1,070,000 4.80 F Republic of Korea 380,000 1.71 F Russian Federation 227,270 1.02 Myanmar 200,000 0.90 F Ethiopia 179,658 0.81 * United States of America 178,760 0.80 Egypt 174,659 0.78 Bangladesh 154,831 0.69 Spain 154,000 0.69 Ukraine 150,100 0.67 Argentina 120,391 0.54 Im Turkey 105,363 0.47 Democratic People's Republic of Korea 101,347 0.45 Im Brazil 86,752 0.39 Thailand 71,433 0.32 Pakistan 67,204 0.30 Iran (Islamic Republic of) 64,002 0.29 Romania 63,245 0.28 Algeria 59,932 0.27
a FAO official data unless noted otherwise. Im: FAO data based on imputation methodology; F: FAO estimate

Worldwide Spice Production | Appendix B
FDA Draft Risk Profile | 187
Table B7. Ginger Zingiber officinale. Rhizome of a perennial herb. It also is used for making beverages. Includes fresh, provisionally preserved or dried, whereas ginger preserved in sugar or syrup is excluded.
Country Metric Tonnes % of Worldwide Production Data Sourcea India 380,100 23.52 China 331,393 20.51 F Indonesia 192,500 11.91 F Nepal 174,268 10.78 Im Thailand 170,125 10.53 Nigeria 152,106 9.41 Im Bangladesh 72,608 4.49 Japan 52,000 3.22 F Philippines 27,415 1.70 Cameroon 12,000 0.74 F Malaysia 11,200 0.69 Sri Lanka 10,780 0.67 Côte d'Ivoire 7,680 0.48 Im Ethiopia 6,834 0.42 Im Bhutan 3,766 0.23 Fiji 3,041 0.19 Republic of Korea 3,000 0.19 F Costa Rica 1,105 0.07 United States of America 816 0.05 F Mauritius 616 0.04
a FAO official data unless noted otherwise. Im: FAO data based on imputation methodology; F: FAO estimate. Table B8. Mustard Seed White mustard (Brassica alba; B. hirta; Sinapis alba); black mustard (Brassica nigra; Sinapis nigra). In addition to the oil extracted from them, white mustard seeds, may be processed into flour for food use. Black mustard seeds also yield oil and are processed into flour that is used mainly in pharmaceutical products.
Country Metric Tonnes % of Worldwide Production Data Sourcea Canada 208,300 30.46 Nepal 135,494 19.81 Myanmar 70,000 10.24 F Czech Republic 38,651 5.65 United States of America 22,391 3.27 Ukraine 118,200 17.28 Russian Federation 23,690 3.46 China 18,000 2.63 F Romania 10,633 1.55 France 9,500 1.39 Hungary 9,568 1.40 Germany 7,411 1.08 Im Slovakia 3,785 0.55 Ethiopia 2,924 0.43 Im Bhutan 1,741 0.25 Bulgaria 1,222 0.18 Im Sri Lanka 300 0.04 Kazakhstan 900 0.13 * Denmark 30 0.00 Im Mexico 16 0.00
a FAO official data unless noted otherwise. Im: FAO data based on imputation methodology; F: FAO estimate.

Worldwide Spice Production | Appendix B
FDA Draft Risk Profile | 188
Table B9. Nutmeg, mace and cardamoms Nutmeg, mace (Myristica fragrans); cluster cardamon (Elettaria cardamomum); other cardamons (Aframomum angustifolium; A. hambury; Amomun aromaticum; A. cardamomum); Malaguetta pepper, grains of paradise (Aframomum melegueta). Nutmeg is the inner brown kernel of the fruit of the nutmeg tree. Mace is the net-like membrane between the outer shell and the kernel. Cardamon seeds are enclosed in the capsule produced by perennial herbs of the Zingiberaceae family. Country Metric Tonnes % of Worldwide Production Data Sourcea Guatemala 23794 30.65% Im India 17000 21.90% F Nepal 9774 12.59% Im Bhutan 9082 11.70% Im Indonesia 8600 11.08% F Lao People's Democratic Republic 3982 5.13% Im Grenada 2395 3.08% Im United Republic of Tanzania 795 1.02% Im Malaysia 711 0.92% Im Sri Lanka 480 0.62% Honduras 285 0.37% Im Trinidad and Tobago 192 0.25% Im Saint Vincent and the Grenadines 172 0.22% Im Malawi 133 0.17% F Ethiopia 100 0.13% F Kenya 60 0.08% Im Togo 35 0.05% F Saint Lucia 30 0.04% F Madagascar 16 0.02% Im Dominica 5 0.01% F a FAO official data unless noted otherwise. Im: FAO data based on imputation methodology; F: FAO estimate. Table B10. Onions, dried Allium cepa. Includes onions at a mature stage, but not dehydrated onions.
Country Metric Tonnes % of Worldwide Production Data Sourcea China 21,046,969 28.74% F India 13,900,000 18.98% F United States of America 3,400,560 4.64% Turkey 1,849,580 2.53% Egypt 1,800,000 2.46% F Pakistan 1,704,100 2.33% Russian Federation 1,601,550 2.19% Iran (Islamic Republic of) 1,512,150 2.06% Brazil 1,511,850 2.06% Netherlands 1,269,000 1.73% Spain 1,263,400 1.73% Republic of Korea 1,200,000 1.64% F Mexico 1,195,820 1.63% Japan 1,154,000 1.58% Myanmar 1,050,000 1.43% F Algeria 980,160 1.34% Indonesia 952,638 1.30% Ukraine 875,600 1.20% Uzbekistan 795,000 1.09% * Bangladesh 735,140 1.00%
a FAO official data unless noted otherwise. F: FAO estimate; *: unofficial figure.
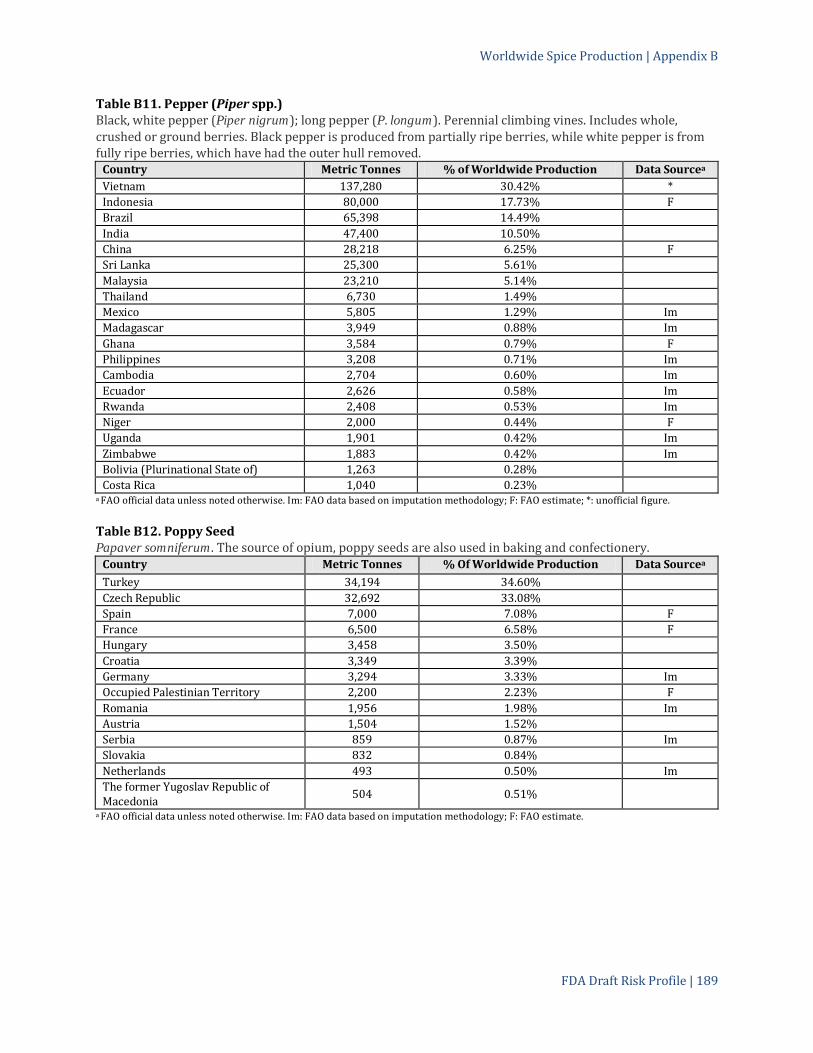
Worldwide Spice Production | Appendix B
FDA Draft Risk Profile | 189
Table B11. Pepper (Piper spp.) Black, white pepper (Piper nigrum); long pepper (P. longum). Perennial climbing vines. Includes whole, crushed or ground berries. Black pepper is produced from partially ripe berries, while white pepper is from fully ripe berries, which have had the outer hull removed.
Country Metric Tonnes % of Worldwide Production Data Sourcea Vietnam 137,280 30.42% * Indonesia 80,000 17.73% F Brazil 65,398 14.49% India 47,400 10.50% China 28,218 6.25% F Sri Lanka 25,300 5.61% Malaysia 23,210 5.14% Thailand 6,730 1.49% Mexico 5,805 1.29% Im Madagascar 3,949 0.88% Im Ghana 3,584 0.79% F Philippines 3,208 0.71% Im Cambodia 2,704 0.60% Im Ecuador 2,626 0.58% Im Rwanda 2,408 0.53% Im Niger 2,000 0.44% F Uganda 1,901 0.42% Im Zimbabwe 1,883 0.42% Im Bolivia (Plurinational State of) 1,263 0.28% Costa Rica 1,040 0.23%
a FAO official data unless noted otherwise. Im: FAO data based on imputation methodology; F: FAO estimate; *: unofficial figure. Table B12. Poppy Seed Papaver somniferum. The source of opium, poppy seeds are also used in baking and confectionery.
a FAO official data unless noted otherwise. Im: FAO data based on imputation methodology; F: FAO estimate.
Country Metric Tonnes % Of Worldwide Production Data Sourcea Turkey 34,194 34.60% Czech Republic 32,692 33.08% Spain 7,000 7.08% F France 6,500 6.58% F Hungary 3,458 3.50% Croatia 3,349 3.39% Germany 3,294 3.33% Im Occupied Palestinian Territory 2,200 2.23% F Romania 1,956 1.98% Im Austria 1,504 1.52% Serbia 859 0.87% Im Slovakia 832 0.84% Netherlands 493 0.50% Im The former Yugoslav Republic of Macedonia 504 0.51%

Worldwide Spice Production | Appendix B
FDA Draft Risk Profile | 190
Table B13. Spices, nes Including inter alia: bay leaves (Laurus nobilis); dill seed (Anethum graveolens); fenugreek seed (Trigonella foenum-graecum); saffron (Crocus sativus); thyme (Thymus vulgaris); turmeric (Curcuma longa). Other spices that are not identified separately because of their minor relevance at the international level. Because of their limited local importance, some countries report spices under this heading that are classified individually by FAO. This heading also includes curry powder and other mixtures of different spices. Country Metric Tonnes % of Worldwide Production Data Sourcea India 1,100,000 69.23% F Bangladesh 140,113 8.82% Turkey 87,028 5.48% Im China 85,987 5.41% F Pakistan 45,473 2.86% Im Colombia 19,760 1.24% Im Nepal 17,404 1.10% Im Iran (Islamic Republic of) 13,226 0.83% Im Burkina Faso 6,705 0.42% F Niger 5,100 0.32% F Nigeria 4,959 0.31% F Sri Lanka 4,817 0.30% Im Indonesia 4,481 0.28% Im Bhutan 4,158 0.26% Im Occupied Palestinian Territory 4,070 0.26% Im Thailand 3,283 0.21% Im Zambia 3,257 0.20% Im Spain 3,195 0.20% Im Georgia 3,100 0.20% * Morocco 3,000 0.19% F a FAO official data unless noted otherwise. Im: FAO data based on imputation methodology; F: FAO estimate; *: unofficial figure. Table B14. Sesame Seed Sesamum indicum. Valued for its oil, but also as a food, either raw or roasted, as well as in bakery products and o
Country Metric Tonnes % of Worldwide Production Data Sourcea Myanmar 867,520 21.81% India 657,000 16.52% China 622,905 15.66% Sudan 318,000 8.00% Ethiopia 260,534 6.55% * Uganda 178,000 4.48% Nigeria 110,000 2.77% * Niger 75,632 1.90% Paraguay 65,000 1.63% Somalia 64,445 1.62% Im Burkina Faso 56,252 1.41% Central African Republic 50,008 1.26% United Republic of Tanzania 48,000 1.21% * Thailand 46,039 1.16% Egypt 41,000 1.03% * Chad 35,000 0.88% * Pakistan 33,400 0.84% Bangladesh 32,306 0.81% Afghanistan 32,000 0.80% * Cambodia 31,000 0.78% F
ther food preparations.
a FAO official data unless noted otherwise. Im: FAO data based on imputation methodology; F: FAO estimate; *: unofficial figure.

Worldwide Spice Production | Appendix B
FDA Draft Risk Profile | 191
Table B15. Vanilla Vanilla planifolia; V. pompona. The fruit (or bean) of a climbing plant of the orchid family. Includes whole, crushed or ground.
Country Metric Tonnes % of Worldwide Production Data Sourcea Indonesia 4,362 44.44% Im Madagascar 2,830 28.83% Im China 1,382 14.08% Im Mexico 524 5.34% Tonga 263 2.68% Im Turkey 215 2.19% Im French Polynesia 74 0.75% Comoros 65 0.66% Im Uganda 48 0.49% Im Malawi 15 0.15% Im Kenya 12 0.12% Im Réunion 12 0.12% * Guadeloupe 8 0.08% F Zimbabwe 5 0.05% Im
a FAO official data unless noted otherwise. Im: FAO data based on imputation methodology; F: FAO estimate; *: unofficial figure.

FDA Draft Risk Profile | 192
APPENDIX C: FDA 2010 STUDY OF CONCENTRATIONS AND DISTRIBUTION OF SALMONELLA IN SHIPMENTS OF CAPISCUM AND
SESAME SEED OFFERED FOR ENTRY TO THE UNITED STATES.
The 2010 FDA study “Prevalence, level and distribution of Salmonella in shipments of imported capsicum and sesame seed spice offered for entry to the United States: Observations and modeling results” was originally published in Food Microbiology (Van Doren et al., 2013c). Below we provide information from the study most relevant to the results discussed in the present risk profile document. Material and Methods Sample Collection All imports of dried capsicum and sesame seeds were eligible for sampling during the study period. A total of 299 shipments of capsicums and 233 shipments of sesame seeds were sampled at the point of import into the United States between August and December 2010. The shipments sampled constituted approximately 10 or 20 percent of all shipments of imported capsicum or imported sesame seed shipments, respectively, offered for entry to the United States. Sixty subsamples, each comprised of approximately 160 grams, were collected randomly from each shipment. Typically, each sub-sample was collected from a different container or sack of spice in the shipment selected at random. Samples were sent to U.S. Food and Drug Administration (FDA) laboratories for analysis. Sample Preparation, Salmonella Screening, Isolation and Confirmation Composite samples were prepared by dividing the 60 subsamples into four groups of fifteen. Twenty-five gram analytical units of product from each of the fifteen subsamples were combined to form a 375 g composite sample (Andrews and Hammack, 2003). Each composite sample was screened for the presence of Salmonella using one of the following methods: AOAC’s Official Methods of Analysis (OMA): 2004.03, 2001.07, 2001.08, or 2001.09, which are available from AOAC International (2007a, 2007b, 2007c, 2007d). All methods are validated and have similar performance criteria. Salmonella was isolated from each of the composite samples testing positive using the procedures described in Chapter 5 of the FDA Bacteriological Analytical Manual (BAM) (Andrews et al., 2011; Jacobson, and Hammack, 2003). Presumptive-positive Salmonella isolates were confirmed with OMA methods 978.24 or 991.13 (available from AOAC International (2005d, 2005e). Salmonella isolates recovered from the spices were serotyped (Ewing, 1986). Salmonella Enumeration A dilution assay was undertaken for composite samples of spice that were found to contain Salmonella by the screening test. The serial dilution protocol involved a three tube analysis on each of four different dilutions of spice. Spice sampled for the dilution assay analysis were drawn from a composite (thoroughly mixed) sample created from equal proportions of the same set of 15 subsamples used in the corresponding Salmonella-positive screening test. Separate composite spice product portions of 100, 10, 1, and 0.1 g were each rehydrated at a 1:9 ratio with a tryptic soy broth pre-enrichment medium by swirling or soaking as instructed in the BAM method (Andrews et al., 2011; Jacobson, and Hammack, 2003). This procedure was repeated three times (for three tubes) for each of the four different dilutions (100, 10, 1, and 0.1 g). The enrichment tubes were kept at room temperature for 60 ± 5 min, pH adjusted to 6.8 ± 0.2, if necessary, and then incubated for 24 ± 2 h at 35 ± 2oC. Once incubation was complete, the BAM Salmonella culture method was followed (Andrews et al., 2011; Jacobson, and Hammack, 2003). The relative likelihood of each reported dilution assay pattern for a thoroughly mixed sample was evaluated on the basis of the rarity index (Blodgett, 2010a; Jarvis et al. 2010).

FDA 2010 Study of Concentrations & Distribution of Salmonella in Shipments Offered for Import | Appendix C
FDA Draft Risk Profile | 193
Most Probable Number (MPN) values and 95% confidence intervals for each of the four composite samples were determined from the five results, screening test plus the four dilutions using the excel spreadsheet provided in the BAM (Blodgett, 2010b), where the screening test was treated as another “dilution” for the MPN analysis. For a few shipments, the procedure described above was not followed. For samples in one shipment of capsicum and six shipments of sesame seeds, the dilution assay result patterns were not reported by the field labs but rather the presence/absence of Salmonella was reported for the enumeration experiment as a whole. In these cases, we interpret the experiments as providing a second screening test with total spice mass of 333.3 g. For samples from two other shipments of sesame seeds with confirmed positive Salmonella samples, enumeration experiments were not performed. MPN estimates and confidence intervals for the mean Salmonella concentration in a shipment were calculated taking into account the full set of screening test and dilution assay results. The assumption of Poisson-distributed contamination within shipments, which was used to estimate the shipment mean concentration of contamination and is part of some of the parametric models developed, was examined. We evaluated for each of the 4 composite sample results, a rarity index (Blodgett, 2010a). Specifically we evaluated the probability to obtain the pattern of results observed for one composite sample given the estimated mean shipment concentration divided by the probability to observe the most probable pattern of results in the composite sample given the estimated mean shipment concentration. This statistic has the advantage of being quantifiable for all of the outcomes obtained in this study including missing dilution assay results and binary dilution assay result outcomes. The second advantage is that this rarity index evaluates in one statistic the adequacy of the assumption of within shipment Poisson distribution and within dilution assay Poisson distribution. There is no a priori expectation that contamination concentrations in different composites from the same shipment should be the same/similar because the spice contained in different composites are from different locations in the shipment. If the local concentration in a given composite is far higher or lower than the value estimate at the shipment level, the probability to observe the given pattern will be low with regards to the most probable one, leading to a low rarity index. We use the recommendations of Jarvis et al (2010) for thresholds of probability: the pattern of results is likely to occur if its rarity index is ≥0.05; is expected to occur only rarely if the rarity index falls within the range 0.01< rarity index < 0.05; and is expected to occur extremely rarely if the rarity index is ≤ 0.01 Probabilistic Models Probabilistic models of imported spice shipment contamination were examined for their ability to describe the Salmonella sampling data. Features included in the models were selected for their ability to describe between- and within-shipment distributions of Salmonella in spices. Each model was fit to the capsicum and sesame seed data separately, and evaluated for its quality of fit. Mathematical descriptions of the models, development of the likelihood functions, and derivation of the maximum likelihood solutions, where applicable, are presented in the Supplementary Material. All information gathered in this study, including positive and negative test results of screening and enumeration experiments, was used in determining model parameter estimates. Maximum likelihood estimates of model parameters were determined from the analytical solutions or determined numerically using the R general-purpose optimization function “optim” (R Development Core Team, 2008). Standard errors for model parameters were derived from the Hessian matrix while confidence intervals for model predications were estimated using a parametric bootstrap procedure. Models are compared for quality of fit on the basis of the Akaike information criterion (AIC). Deviations of model predictions from observations are compared in a number of ways. Model between-shipment contamination distributions are compared with observations graphically. Model predicted prevalence for the sampling plan used in the present study is compared with the observed one. Observed data on the distribution of contamination within each shipment are compared with results predicted under a Poisson distribution assumption (see Section 2.2). Finally, model fits, as quantified by the AIC, are compared with that of an empirical model.

FDA 2010 Study of Concentrations & Distribution of Salmonella in Shipments Offered for Import | Appendix C
FDA Draft Risk Profile | 194
Model 1 Model 1 assumes (1) imported spice shipments offered for U.S. entry can be divided into two populations: uncontaminated shipments (zero probability of one or more bacterium in the shipment, designated “Population I”) and contaminated shipments (non-zero probability of one or more bacterium in the shipment, designated “Population II”) (2) contamination within Population II shipments is characterized by a Poisson distribution and (3) all contaminated spice shipments (Population II) have the same mean concentration of Salmonella. The explicit inclusion of a Salmonella-free population in this model and the additional models that follow is similar to the zero-inflated distributions used by others to describe microbial distributions in foods (see for example, Gonzales-Barron et al., 2010; Bassett et al., 2010; Jongenburger et al., 2012). Model 1 is characterized by two parameters, p and λ, which are the probability of being in Population II and the mean concentration of Salmonella in Population II shipments, respectively. Model 2 Model 2 assumes (1) imported spice shipments at U.S. entry can be divided into two populations, i.e., uncontaminated shipments (Population I) and contaminated shipments (Population II) as defined in Model 1 (2) contamination within Population II shipments is concentrated in isolated contamination clusters or “hot-spots” (probability of at least one bacterium in each hot spot is non-zero while the probability outside the hot spot is zero) (3) all hot spots have the same mean concentration of Salmonella and (4) the contamination within each hot spot is described by a Poisson distribution. This model is characterized by three parameters, p, h and λ, which are the probability of being in Population II, the probability that a sample taken from a shipment in Population II is from a hot spot, and the mean concentration of Salmonella in each hot spot, respectively. Models 3a-3d Models 3a-3d assume (1) imported spice shipments offered for U.S. entry can be divided into two populations, i.e., uncontaminated shipments (Population I) and contaminated shipments (Population II) as defined in Model 1 (2) contamination within Population II shipments is characterized by a Poisson distribution and (3) different shipments may have different mean concentrations, where the distribution of mean concentrations is defined by a gamma distribution (3a), lognormal distribution (3b), log-logistic distribution (3c), or Weibull distribution (3d). Models 3a, 3c, and 3d are characterized by three parameters, p, α, and β. p is the probability of being in Population II. In Models 3a, 3c, and 3d, α is the shape parameter and β is the scale parameter. In Model 3b, α is the mean of the natural logarithm of Salmonella concentration and β is the standard deviation of the natural logarithm of Salmonella concentration. Empirical Model Empirical models were developed for Salmonella contamination of imported capsicum and sesame seed shipments offered for entry to the United States. These models assume (1) imported spice shipments offered for U.S. entry can be divided into two populations, i.e., uncontaminated shipments (Population I) and contaminated shipments (Population II) as defined in Model 1 (2) contamination within Population II shipments is characterized by a Poisson distribution and (3) different shipments may have different mean concentrations, where the distribution of mean concentrations is defined empirically from the within-shipment contamination concentration estimated from the observations. The fraction of uncontaminated shipments in each model is given by the fraction of shipments for which all four screening tests (4 composites of 375 g) tested negative, i.e., the observed prevalence. The distribution of mean concentrations among contaminated shipments is drawn from the discrete set of 10 (capsicum) or 23 (sesame seed) contaminated shipment estimated mean concentrations. Thus, the empirical models are saturated models. The empirical model for capsicum shipments includes 11 parameters and the empirical model for sesame seed shipments contains 24 parameters.

FDA 2010 Study of Concentrations & Distribution of Salmonella in Shipments Offered for Import | Appendix C
FDA Draft Risk Profile | 195
Efficacy of Salmonella Sampling Plans in Reducing Risk Four sampling plans were evaluated for their ability to (1) identify Salmonella contaminated spice shipments offered for U.S. entry and (2) reduce Salmonella contamination in the imported spice supply, assuming identified shipments are reconditioned. Each sampling plan was applied to both the Model 1 and the best model identified among Models 3a-3d. In these analyses, we assumed the screening test has perfect sensitivity and specificity.

FDA 2010 Study of Concentrations & Distribution of Salmonella in Shipments Offered for Import | Appendix C
FDA Draft Risk Profile | 196
Description of Sampled Shipments and Model Results Table C1. Description of sampled and Salmonella-contaminated shipments offered for U.S. entry
Descriptor Capsicuma Sesame Seeda
Sampled (299 Shipments)
Contaminated (10 Shipments)
Sampled (233 Shipments)
Contaminated (23 Shipments)
Total Mass and Value for All Shipmentsb - $6.1 × 10⁶
7.5 × 10⁴ kg $1.6 × 10⁵
- $5.3 × 10⁶
3.5 × 10⁵ kg $7.1 × 10⁵
Mean Shipment Sizeb: Mass - 7.5 × 10³ kg - 1.5 × 10⁴ kg Median Shipment Sizeb: Mass - 4.8 × 10³ kg - 1.8 × 10⁴ kg Shipment Size Rangeb: Mass - 125 -2.5 × 10⁴ kg - 24 - 3.8 × 10⁴ kg Percentage of Shipments Retailc ≥15 20 ≥11 22 Percentage of Shipments Ground/Crackedd 46 80 NA NA Fraction (Percentage) of Shipments Known to have Undergone a Pathogen Reduction Treatmente
≥14/299 (≥4.7%)
0/7 (≤30%)
≥6/233 (≥3%)
0/14 (≤40%)
Fraction (Percentage) Fraction of Shipments with COA Neg. for Salmonellaf - 2/7
(≥20%) - 4/14 (≥17%)
Percentage of Imported Shipments Sampled ~10 - ~20 - Observed Prevalence [95% CI] of Salmonella-Contaminated Imported Spice Shipmentsg
3.3% [1.6-6.1%] NA 9.9%
[6.3-14%] NA
a Dash indicates the data were not available; NA indicates the descriptor is not applicable. b Mass and value determined from FDA sample collection report. c Retail defined as shipments packaged in bags/boxes containing ≤5 lbs (2.3 kg). d Percentages of ground/cracked and whole capsicum were determined by FDA product code and description. Information was available to assess form for 297 of the imported shipments e As determined by FDA product code and description for all imported shipments plus documents examined at import for contaminated shipments. Pathogen reduction treatment indications
included “commercially sterile”, “heat treated”, “irradiated”, and “steam” or “eto” treated. The numbers of shipments identified is likely an underestimate because industry is not required to supply this information except for the case of irradiated spice and FDA officials are not required to record this information in their collection report.
f COA means Certificate of Analysis. Documents provided at import for contaminated shipments were reviewed for COAs; information was available for 7 of the contaminated capsicum shipments and 14 of the contaminated sesame seed shipments.
g 95% CI, exact confidence limits for the observed/apparent prevalence determined with the sampling protocol employed in this study (Clopper and Pearson, 1934). Observed/apparent prevalence is a lower limit on the true prevalence.
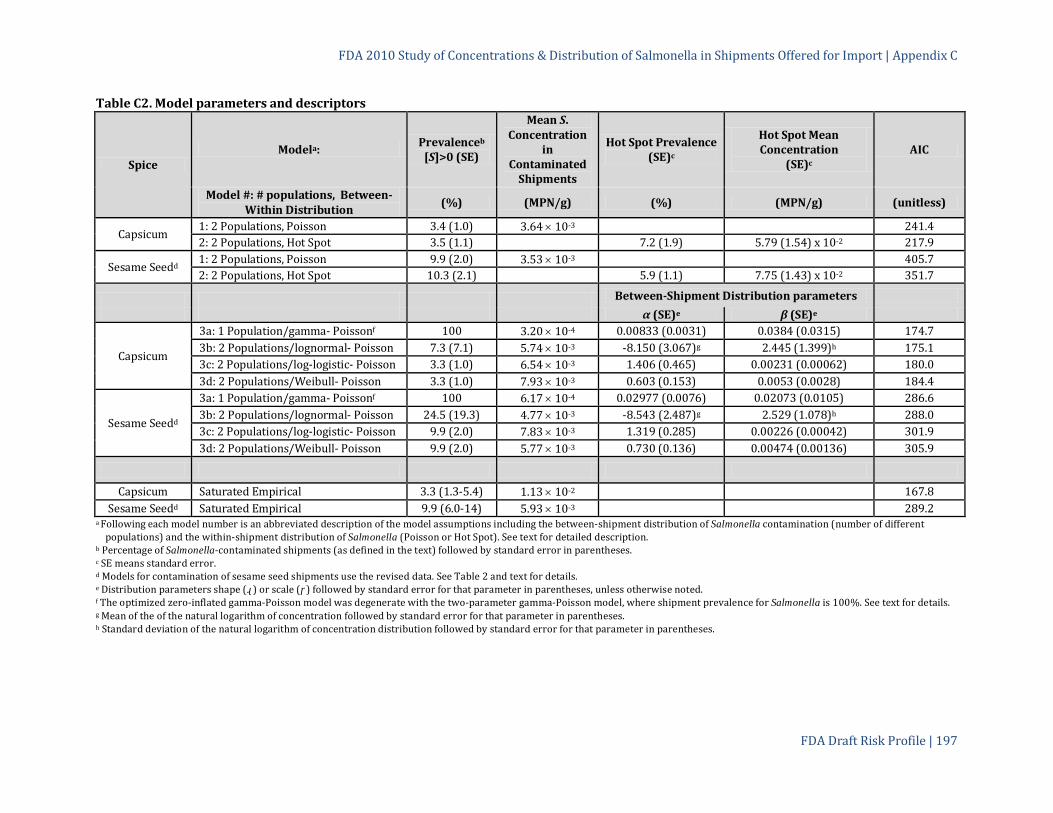
FDA 2010 Study of Concentrations & Distribution of Salmonella in Shipments Offered for Import | Appendix C
FDA Draft Risk Profile | 197
Table C2. Model parameters and descriptors
Spice Modela: Prevalenceb
[S]>0 (SE)
Mean S. Concentration
in Contaminated
Shipments
Hot Spot Prevalence (SE)c
Hot Spot Mean Concentration
(SE)c AIC
Model #: # populations, Between-Within Distribution (%) (MPN/g) (%) (MPN/g) (unitless)
Capsicum 1: 2 Populations, Poisson 3.4 (1.0) 3.64 × 10⁻³ 241.4 2: 2 Populations, Hot Spot 3.5 (1.1) 7.2 (1.9) 5.79 (1.54) x 10-2 217.9
Sesame Seedd 1: 2 Populations, Poisson 9.9 (2.0) 3.53 × 10⁻³ 405.7 2: 2 Populations, Hot Spot 10.3 (2.1) 5.9 (1.1) 7.75 (1.43) x 10-2 351.7
Between-Shipment Distribution parameters α (SE)e β (SE)e
Capsicum
3a: 1 Population/gamma- Poissonf 100 3.20 × 10⁻⁴ 0.00833 (0.0031) 0.0384 (0.0315) 174.7 3b: 2 Populations/lognormal- Poisson 7.3 (7.1) 5.74 × 10⁻³ -8.150 (3.067)g 2.445 (1.399)h 175.1 3c: 2 Populations/log-logistic- Poisson 3.3 (1.0) 6.54 × 10⁻³ 1.406 (0.465) 0.00231 (0.00062) 180.0 3d: 2 Populations/Weibull- Poisson 3.3 (1.0) 7.93 × 10⁻³ 0.603 (0.153) 0.0053 (0.0028) 184.4
Sesame Seedd
3a: 1 Population/gamma- Poissonf 100 6.17 × 10⁻⁴ 0.02977 (0.0076) 0.02073 (0.0105) 286.6 3b: 2 Populations/lognormal- Poisson 24.5 (19.3) 4.77 × 10⁻³ -8.543 (2.487)g 2.529 (1.078)h 288.0 3c: 2 Populations/log-logistic- Poisson 9.9 (2.0) 7.83 × 10⁻³ 1.319 (0.285) 0.00226 (0.00042) 301.9 3d: 2 Populations/Weibull- Poisson 9.9 (2.0) 5.77 × 10⁻³ 0.730 (0.136) 0.00474 (0.00136) 305.9
Capsicum Saturated Empirical 3.3 (1.3-5.4) 1.13 × 10⁻² 167.8 Sesame Seedd Saturated Empirical 9.9 (6.0-14) 5.93 × 10⁻³ 289.2
a Following each model number is an abbreviated description of the model assumptions including the between-shipment distribution of Salmonella contamination (number of different populations) and the within-shipment distribution of Salmonella (Poisson or Hot Spot). See text for detailed description.
b Percentage of Salmonella-contaminated shipments (as defined in the text) followed by standard error in parentheses. c SE means standard error. d Models for contamination of sesame seed shipments use the revised data. See Table 2 and text for details. e Distribution parameters shape (α) or scale (β) followed by standard error for that parameter in parentheses, unless otherwise noted. f The optimized zero-inflated gamma-Poisson model was degenerate with the two-parameter gamma-Poisson model, where shipment prevalence for Salmonella is 100%. See text for details. g Mean of the of the natural logarithm of concentration followed by standard error for that parameter in parentheses. h Standard deviation of the natural logarithm of concentration distribution followed by standard error for that parameter in parentheses.
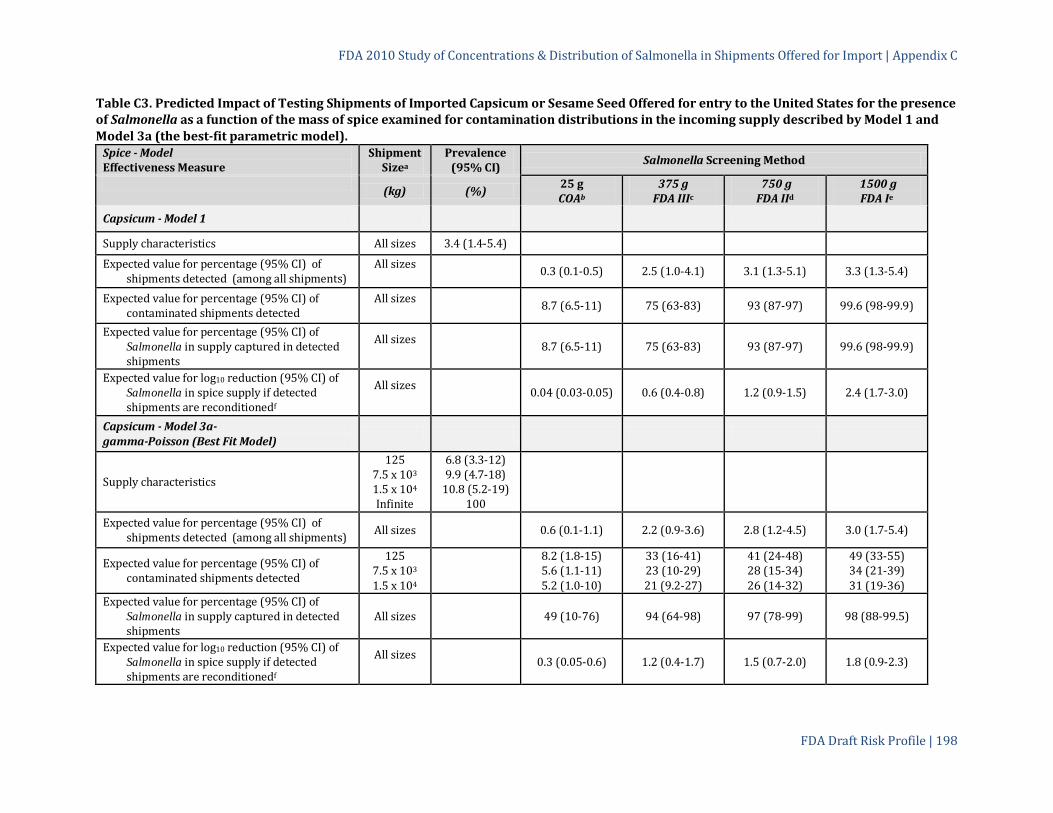
FDA 2010 Study of Concentrations & Distribution of Salmonella in Shipments Offered for Import | Appendix C
FDA Draft Risk Profile | 198
Table C3. Predicted Impact of Testing Shipments of Imported Capsicum or Sesame Seed Offered for entry to the United States for the presence of Salmonella as a function of the mass of spice examined for contamination distributions in the incoming supply described by Model 1 and Model 3a (the best-fit parametric model).
Spice - Model Effectiveness Measure
Shipment Sizea
Prevalence (95% CI) Salmonella Screening Method
(kg) (%) 25 g COAb
375 g FDA IIIc
750 g FDA IId
1500 g FDA Ie
Capsicum - Model 1
Supply characteristics All sizes 3.4 (1.4-5.4)
Expected value for percentage (95% CI) of shipments detected (among all shipments)
All sizes 0.3 (0.1-0.5) 2.5 (1.0-4.1) 3.1 (1.3-5.1) 3.3 (1.3-5.4)
Expected value for percentage (95% CI) of contaminated shipments detected
All sizes 8.7 (6.5-11) 75 (63-83) 93 (87-97) 99.6 (98-99.9)
Expected value for percentage (95% CI) of Salmonella in supply captured in detected shipments
All sizes 8.7 (6.5-11) 75 (63-83) 93 (87-97) 99.6 (98-99.9)
Expected value for log10 reduction (95% CI) of Salmonella in spice supply if detected shipments are reconditionedf
All sizes 0.04 (0.03-0.05) 0.6 (0.4-0.8) 1.2 (0.9-1.5) 2.4 (1.7-3.0)
Capsicum - Model 3a- gamma-Poisson (Best Fit Model)
Supply characteristics
125 7.5 x 10³ 1.5 x 10⁴
Infinite
6.8 (3.3-12) 9.9 (4.7-18)
10.8 (5.2-19) 100
Expected value for percentage (95% CI) of shipments detected (among all shipments) All sizes 0.6 (0.1-1.1) 2.2 (0.9-3.6) 2.8 (1.2-4.5) 3.0 (1.7-5.4)
Expected value for percentage (95% CI) of contaminated shipments detected
125 7.5 x 10³ 1.5 x 10⁴
8.2 (1.8-15) 5.6 (1.1-11) 5.2 (1.0-10)
33 (16-41) 23 (10-29) 21 (9.2-27)
41 (24-48) 28 (15-34) 26 (14-32)
49 (33-55) 34 (21-39) 31 (19-36)
Expected value for percentage (95% CI) of Salmonella in supply captured in detected shipments
All sizes 49 (10-76) 94 (64-98) 97 (78-99) 98 (88-99.5)
Expected value for log10 reduction (95% CI) of Salmonella in spice supply if detected shipments are reconditionedf
All sizes 0.3 (0.05-0.6) 1.2 (0.4-1.7) 1.5 (0.7-2.0) 1.8 (0.9-2.3)

FDA 2010 Study of Concentrations & Distribution of Salmonella in Shipments Offered for Import | Appendix C
FDA Draft Risk Profile | 199
Spice - Model Effectiveness Measure
Shipment Sizea
Prevalence (95% CI) Salmonella Screening Method
(kg) (%) 25 g COAb
375 g FDA IIIc
750 g FDA IId
1500 g FDA Ie
Capsicum- Empirical
Supply characteristics All sizes 3.3 (1.3-5.4)
Expected value for percentage (95% CI) of shipments detected (among all shipments) All sizes 0.5 (0.06-1.2) 1.9 (0.6-3.1) 2.4 (0.8-3.8) 2.9 (1.0-4.3)
Expected value for percentage (95% CI) of contaminated shipments detected
All sizes 14 (4.1-40) 56 (42-81) 72 (54-89) 85 (78-99)
Expected value for percentage (95% CI) of Salmonella in supply captured in detected shipments
All sizes 14 (4.1-40) 56 (42-81) 72 (54-89) 85 (78-99)
Expected value for log10 reduction (95% CI) of Salmonella in spice supply if detected shipments are reconditionedf
All sizes 0.07 (0.02-0.2) 0.4 (0.2-0.7) 0.6 (0.3-1.0) 0.8 (0.7-2.0)
Sesame Seed - Model 1
Supply characteristics All sizes 9.9 (6.5-13.8)
Expected value for percentage (95% CI) of shipments detected (among all shipments) All sizes 0.8 (0.5-1.2) 7.3 (4.5-10.3) 9.2 (5.8-13.0) 9.9 (6.4-13.7)
Expected value for percentage (95% CI) of contaminated shipments detected All sizes 8.4 (7.0-9.9) 73 (66-79) 93 (89-96) 99.5 (98.8-99.8)
Expected value for percentage (95% CI) of Salmonella in supply captured in detected shipments
All sizes 8.4 (7.0-9.9) 73 (66-79) 93 (89-96) 99.5 (98.8-99.8)
Expected value for log10 reduction (95% CI) of Salmonella in spice supply if detected
shipments are reconditionedf All sizes 0.04 (0.03-0.05) 0.6 (0.5-0.7) 1.2 (1.0-1.4) 2.3 (1.9-2.7)

FDA 2010 Study of Concentrations & Distribution of Salmonella in Shipments Offered for Import | Appendix C
FDA Draft Risk Profile | 200
Spice - Model Effectiveness Measure
Shipment Sizea
Prevalence (95% CI) Salmonella Screening Method
(kg) (%) 25 g COAb
375 g FDA IIIc
750 g FDA IId
1500 g FDA Ie
Sesame Seed - Model 3a - gamma-Poisson (Best Fit Model)
Supply characteristics
24 1.5 x 10⁴ 3.8 x 10⁴ Infinite
17 (11-24) 31 (20-45) 33 (21-47)
100
Expected value for percentage (95% CI) of shipments detected (among all shipments) All sizes 1.2 (0.6-2.0)
6.3 (3.8-8.7)
8.0 (5.0-11)
9.8 (6.0-14)
Expected value for percentage (95% CI) of contaminated shipments detected
24 1.5 x 10⁴ 3.8 x 10⁴
7.3 (3.6-12) 3.9 (1.8-6.8) 3.7 (1.7-6.4)
37 (28-44) 20 (14-25) 19 (13-23)
47 (38-53) 26 (19-30) 24 (18-28)
58 (50-29) 31 (25-35) 30 (34-33)
Expected value for percentage (95% CI) of Salmonella in supply captured in detected shipments
All sizes 35 (16-55) 89 (75-95) 94 (86-97) 97 (92-99)
Expected value for log10 reduction (95% CI) of Salmonella in spice supply if detected shipments are reconditionedf
All sizes
0.2 (0.08-0.3) 1.0 (0.6-1.3) 1.2 (0.9-1.5) 1.5 (1.1-2.0)
Sesame Seed - Empirical
Supply characteristics All sizes 9.9 (4.7-12)
Expected value for percentage (95% CI) of shipments detected (among all shipments) All sizes 1.2 (0.4-2.1) 5.4 (2.8-7.6) 6.9 (3.6-9.1) 8.3 (4.3-11)
Expected value for percentage (95% CI) of contaminated shipments detected All sizes 12 (6.6-24) 54 (48-75) 70 (64-86) 84 (81-95)
Expected value for percentage (95% CI) of Salmonella in supply captured in detected shipments
All sizes 12 (6.6-24) 54 (48-75) 70 (64-86) 84 (81-95)
Expected value for log10 reduction (95% CI) of Salmonella in spice supply if detected shipments are reconditionedf
All sizes
0.6 (0.03-0.1) 0.3 (0.3-0.6) 0.5 (0.4-0.9) 0.8 (0.7-1.3)
a Shipment sizes selected are the smallest, mean and largest contaminated shipment sizes observed in this study for each particular spice type. b Sample mass examined for Salmonella screening tests reported on industry Certificates of Analyses accompanying some of the spice shipments examined in this study. c Typical sample mass used for FDA Category III foods which are foods that would normally be subjected to a process lethal to Salmonella between the time of sampling and consumption
(Andrews and Hammack, 2003). d Typical sample mass used for FDA Category II foods which are foods that would not normally be subjected to a process lethal to Salmonella between the time of sampling and

FDA 2010 Study of Concentrations & Distribution of Salmonella in Shipments Offered for Import | Appendix C
FDA Draft Risk Profile | 201
consumption (Andrews and Hammack, 2003).
e Typical sample mass used for FDA Category I foods which are foods that would not normally be subjected to a process lethal to Salmonella between the time of sampling and consumption and are intended for consumption by the aged, the infirm, or infants (Andrews and Hammack, 2003).
f Assumes reconditioning eliminates all Salmonella from the shipment.