Draft Report for the City of Toledo Performance Audit of the Department...
164
Draft Report for the City of Toledo Performance Audit of the Department of Public Utilities December 2014
Transcript of Draft Report for the City of Toledo Performance Audit of the Department...

Draft Report for the
City of Toledo
Performance Audit of the
Department of Public Utilities
December 2014


Draft Report – For Review and Verification Purposes Only i
12/18/2014
Table of Contents
I. EXECUTIVE SUMMARY .......................................................................................................... 1
A. Summary of Recommendations ................................................................................................................... 2
Priority ............................................................................................................................................................. 2
B. Recommendations Listing ............................................................................................................................. 3
Chapter III – Performance Measurement............................................................................................. 3
Chapter IV – Administrative Services ................................................................................................... 3
Chapter V – Safety ................................................................................................................................... 5
Chapter VI – Operating Divisions ......................................................................................................... 6
Chapter VII – Organization and Human Resources ........................................................................... 6
II. STUDY BACKGROUND .......................................................................................................... 9
A. High-Level Evaluation Criteria – Utility of the Future ............................................................................ 9
B. Toledo Department of Public Utilities (DPU) ......................................................................................... 11
DPU Rates .................................................................................................................................................... 11
Staffing Levels .............................................................................................................................................. 12
C. Objectives and Scope ................................................................................................................................... 14
D. Review Standards ......................................................................................................................................... 18
E. Project Organization & Staffing ................................................................................................................. 18
F. Methodology Summary ................................................................................................................................ 18
Phase I: Initial Assessment and Roadmap .............................................................................................. 19
Phase II: Operational Review & Assessment ......................................................................................... 20
Phase III: Implementation Plan and Final Report Development........................................................ 20
G. Framework .................................................................................................................................................... 21
III. PERFORMANCE MEASUREMENT .................................................................................. 25
A. Organization Best Practices ........................................................................................................................ 25
l. Strategic Planning ..................................................................................................................................... 26
2. Long-Term Financial Planning .............................................................................................................. 26
3. Risk Management Planning .................................................................................................................... 26
4. Performance Measurement System ....................................................................................................... 27

ii Draft Report – For Review and Verification Purposes Only
12/18/2014
5. Optimized Asset Management Program .............................................................................................. 27
6. Customer Involvement Program .......................................................................................................... 28
7. Governing Body Transparency and Accountability ........................................................................... 28
8. Drought Response/Water Shortage Contingency Plan ..................................................................... 28
9. Source Water Protection Plan ................................................................................................................ 29
10. Succession Planning .............................................................................................................................. 29
11. Continuous Improvement Program ................................................................................................... 29
B. Findings and Conclusions ........................................................................................................................... 30
System Renewal and Replacement ............................................................................................................ 32
Return on Assets .......................................................................................................................................... 34
Cash Reserves ............................................................................................................................................... 34
Drinking Water Compliance ...................................................................................................................... 35
Distribution System Water Losses ............................................................................................................ 36
Water Distribution System Integrity: Leaks and Breaks ........................................................................ 36
Maintenance – Water................................................................................................................................... 38
Water Supply ................................................................................................................................................ 39
Sewer Overflow ............................................................................................................................................ 39
Collection System Integrity ........................................................................................................................ 40
Wastewater Treatment Effectiveness ....................................................................................................... 40
O&M Costs for Wastewater Services ....................................................................................................... 40
Maintenance – Wastewater ......................................................................................................................... 41
Service Complaints ...................................................................................................................................... 43
Water Service Disruptions .......................................................................................................................... 44
Wastewater Service Disruptions ................................................................................................................ 46
Residential Cost of Service ......................................................................................................................... 48
Billing Accuracy ........................................................................................................................................... 49
Service Affordability .................................................................................................................................... 49
C. Recommendations ........................................................................................................................................ 50
IV. ADMINISTRATIVE SERVICES ........................................................................................... 53
A. Background & Perspective ......................................................................................................................... 53
Organization ................................................................................................................................................. 53
Draft Report – For Review and Verification Purposes Only iii
12/18/2014
Goals & Objectives ...................................................................................................................................... 54
Administrative Services 2013 Highlights ............................................................................................ 54
Administrative Services 2014 Goals .................................................................................................... 56
Accounting & Financial Analysis ......................................................................................................... 57
Accounting & Float Pool ................................................................................................................. 57
Financial Analysis .............................................................................................................................. 58
DPU/SAP .......................................................................................................................................... 59
Utilities Administration .......................................................................................................................... 60
Customer Service .............................................................................................................................. 60
Billing & Records .............................................................................................................................. 61
Legal Technicians .............................................................................................................................. 62
Staffing Levels .............................................................................................................................................. 63
Systems .......................................................................................................................................................... 64
Financial Results ........................................................................................................................................... 65
B. Findings & Conclusions .............................................................................................................................. 66
Strategic Planning/Financial Planning ...................................................................................................... 66
Financial Planning .................................................................................................................................. 66
Budgeting ................................................................................................................................................. 68
Other Financial Management Practices, including SAP Issues ............................................................. 70
Performance Measurement System ........................................................................................................... 71
Financial Management ........................................................................................................................... 71
Customer Service .................................................................................................................................... 73
Customer Satisfaction .................................................................................................................................. 75
Customer Service Unit ........................................................................................................................... 75
Appeals Process ...................................................................................................................................... 80
Collections & Write-offs ....................................................................................................................... 81
Collections .......................................................................................................................................... 82
Write-offs ........................................................................................................................................... 82
Billing & Records .................................................................................................................................... 83
Legal Technicians ................................................................................................................................... 84
C. Recommendations ........................................................................................................................................ 84
Strategic Planning/Financial Planning ...................................................................................................... 84

iv Draft Report – For Review and Verification Purposes Only
12/18/2014
Other Financial Management Practices, including SAP Issues ............................................................. 85
Performance Measurement System ........................................................................................................... 86
Customer Satisfaction ................................................................................................................................. 86
Customer Service Unit ........................................................................................................................... 86
Appeals Process ...................................................................................................................................... 87
Collections & Write-Offs ...................................................................................................................... 87
Billing & Records ................................................................................................................................... 88
Legal Technicians ................................................................................................................................... 88
V. SAFETY .................................................................................................................................... 89
A. Background & Perspective ......................................................................................................................... 89
B. Findings & Conclusions .............................................................................................................................. 89
C. Recommendations ........................................................................................................................................ 99
VI. OPERATING DIVISIONS .................................................................................................. 103
A. Background & Perspective ....................................................................................................................... 103
Water Treatment ........................................................................................................................................ 103
Organization .......................................................................................................................................... 103
Water Treatment 2013 Highlights ..................................................................................................... 104
Water Treatment 2014 Goals ............................................................................................................. 105
Water Distribution ..................................................................................................................................... 105
Organization .......................................................................................................................................... 106
Sewer & Drainage Services ....................................................................................................................... 109
Organization .......................................................................................................................................... 109
2013 Highlights ..................................................................................................................................... 112
Water Reclamation..................................................................................................................................... 112
Organization .......................................................................................................................................... 112
Water Reclamation 2013 Highlights .................................................................................................. 113
Water Reclamation 2014 Goals .......................................................................................................... 113
B. Findings & Conclusions ............................................................................................................................ 114
C. Recommendations ...................................................................................................................................... 120

Draft Report – For Review and Verification Purposes Only v
12/18/2014
VII. ORGANIZATION AND HUMAN RESOURCES ............................................................ 125
A. Background & Perspective....................................................................................................................... 125
B. Findings & Conclusions ........................................................................................................................... 125
C. Recommendations ..................................................................................................................................... 137

vi Draft Report – For Review and Verification Purposes Only
12/18/2014
Table of Exhibits
I. EXECUTIVE SUMMARY .......................................................................................................... 1
II. STUDY BACKGROUND .......................................................................................................... 9
Exhibit II-1 2013 Residential Rates Comparison Based on 1,000 Cubic Feet per Month,
5/8” Meter as of December 31, 2012 ...................................................................... 12
Exhibit II-2 2013 Industrial Rates Based on 1 Million Cubic Feet per Month, 4” Meter as of
December 31, 2013 ..................................................................................................... 12
Exhibit II-3 Budgeted Staffing Levels as of December 31, 2013 .............................................. 13
Exhibit II-4 10 Year Changes in Staffing Levels as of December 31, 2013 ............................. 14
Exhibit II-5 Consultant Team Experience .................................................................................... 18
Exhibit II-6 Strategic and Functional Assessment of Business Process Framework .............. 22
III. PERFORMANCE MEASUREMENT .................................................................................. 25
Exhibit III-1 Schumaker & Company Organizational Best Practices Assessment as of
December 31, 2014 ..................................................................................................... 30
Exhibit III-2 AWWA Aggregate Data for the Organization Best Practices Indicator as of
December 31, 2012 ..................................................................................................... 31
Exhibit III-3 AWWA System Renewal and Replacement as of December 31, 2012 ............... 33
Exhibit III-4 AWWA Return on Assets Indicator as of December 31, 2012 ........................... 34
Exhibit III-5 AWWA Cash Reserve Indicator as of December 31, 2012 .................................. 34
Exhibit III-6 AWWA Drinking Water Compliance as of December 31, 2012 ......................... 35
Exhibit III-7 AWWA Distribution Water system Loss as of December 31, 2012 ................... 36
Exhibit III-8 AWWA Water System Integrity Indicators as of December 31, 2012 ................ 37
Exhibit III-9 AWWA Maintenance Water as of December 31, 2012 ......................................... 38
Exhibit III-10 AWWA Sewer Overflow Indicator as of December 31, 2012 ............................. 39
Exhibit III-11 AWWA Collection System Integrity Indicator as of December 31, 2012 .......... 40
Exhibit III-12 AWWA Wastewater Treatment Effectiveness as of December 31, 2012 .......... 40
Exhibit III-13 AWWA O&M Costs for Wastewater Services as of December 31, 2012 .......... 41
Exhibit III-14 AWWA Maintenance - Wastewater as of December 31, 2012............................. 42
Exhibit III-15 AWWA Service Complaints as of December 31, 2012 ......................................... 43
Exhibit III-16 AWWA Water Service Disruptions as of December 31, 2012 ............................. 44
Exhibit III-17 AWWA Restoration Time as of December 31, 2012 ............................................ 45
Exhibit III-18 AWWA Wastewater Service Disruptions as of December 31, 2012 ................... 46

Draft Report – For Review and Verification Purposes Only vii
12/18/2014
Exhibit III-19 AWWA Restoration Time as of December 31, 2012 ............................................ 47
Exhibit III-20 AWWA Residential Cost of Service as of December 31, 2012 ............................ 48
Exhibit III-21 AWWA Billing Accuracy as of December 31, 2012............................................... 49
Exhibit III-22 AWWA Service Affordability as of December 31, 2012 ....................................... 50
IV. ADMINISTRATIVE SERVICES ........................................................................................... 53
Exhibit IV-1 Administrative Services 2014 Organization............................................................. 54
Exhibit IV-2 Administrative Services Staffing Levels 2002 to 2013 ........................................... 63
Exhibit IV-3 Toledo Department of Public Utilities 2013 DPU Financial Results Statement
of Revenues, Expenses, and Changes in Fund Net Position Proprietary Funds
for the Year Ended December 31, 2013 (thousands) ............................................ 65
Exhibit IV-4 Financial Planning Process 2014 ............................................................................... 66
Exhibit IV-5 Flow of Utility Revenues 2014 .................................................................................. 67
Exhibit IV-6 Budget Development Schedule 2014 Budget Cycle ............................................... 69
Exhibit IV-7 Financial KPIs 2010 to 2014 ..................................................................................... 72
Exhibit IV-8 Customer Satisfaction KPIs 2010 to 2014 ............................................................... 74
Exhibit IV-9 Call Center Work Study by Day and Hour March 2014 ........................................ 77
Exhibit IV-10 Contact Service Queue Activity Report 2013 and 2014 YTD .............................. 78
Exhibit IV-11 Monthly Customer Service Unit Call Center Statistics 2013................................. 78
Exhibit IV-12 Monthly Call City Hall Statistics 2013 ...................................................................... 79
Exhibit IV-13 Late Fees 2009 to 2013 ............................................................................................... 81
Exhibit IV-14 12-Month Average Arrears February 2012 to December 2013 ............................ 82
V. SAFETY .................................................................................................................................... 89
Exhibit V-1 DPU Safety Organization 2014 ................................................................................. 89
Exhibit V-2 Occupational Injury and Illness Incidence Rate (Reportable Incidents per 100
Workers) 2012/2013 ................................................................................................... 90
Exhibit V-3 Occupational Injury and Illness Incidence Rate (Reportable Incidents per 100
Workers) 2011 – 2013 ................................................................................................. 91
Exhibit V-4 DART Rate (Day Away, Restricted or Transferred Cases per 100 Workers)
2012/2013 .................................................................................................................... 92
Exhibit V-5 Occupational Injury and Illness Severity Rate (Lost Workdays per 100 Workers)
2013 93
Exhibit V-6 Occupational Injury and Illness Severity Rate (Lost Workdays per 100 Workers)
2011 - 2013 ................................................................................................................... 94
Exhibit V-7 Occupational Injury and Illness Rate By Division (Reportable Incidents per 100

viii Draft Report – For Review and Verification Purposes Only
12/18/2014
Workers) 2013 ............................................................................................................ 95
Exhibit V-8 Occupational Injury and Illness Severity Rate by Division (Lost Workdays per
100 Workers) 2013 ...................................................................................................... 96
Exhibit V-9 Workers Compensations Medical Claims Cost 2011-2013 ................................... 98
Exhibit V-10 Workers’ Compensation Medical Claims Cost by Division 2011 – 2013 ........... 99
Exhibit V-11 Sample Safety Committee Scorecard Elements .................................................... 101
VI. OPERATING DIVISIONS .................................................................................................. 103
Exhibit VI-1 Water Treatment Organization as of December 31, 2012 .................................. 104
Exhibit VI-2 Water Distribution Organization as of June 30, 2014 ......................................... 106
Exhibit VI-3 Sewer & Drainage Services as of June 30, 2013 ................................................... 110
Exhibit VI-4 Water Reclamation Organization as of June 30, 2014 ......................................... 113
Exhibit VI-5 Status of Cityworks Implementation as of July 31, 2014 .................................... 115
Exhibit VI-6 Last Five Years Water Main Breaks Total 2009–2013 ......................................... 119
VII. ORGANIZATION AND HUMAN RESOURCES ............................................................ 125
Exhibit VII-1 MGD of Water Produced per Employee 2012/FY2014 & FY2015................. 126
Exhibit VII-2 MGD of Wastewater Processed per Employee 2012/FY2014 & FY2015 ...... 126
Exhibit VII-3 Customer Accounts per Employee 2012/FY2014 & FY2015 ........................... 126
Exhibit VII-4 Retirement Eligibility as of October, 2014 ............................................................ 127
Exhibit VII-5 Percent of Employees Eligible to Retire in Five Years or Less 2012/FY2014 127
Exhibit VII-6 AWWA/FDPU Operator Salaries Comparison 2013/FY2014 ......................... 128
Exhibit VII-7 AWWA/FDPU Management Salaries Comparison 2013/FY2014 .................. 129
Exhibit VII-8 Senior Management Structure as of November, 2014 ......................................... 132
Exhibit VII-9 DPU Overtime Costs 2010 to 2013 ....................................................................... 136
Exhibit VII-10 Sample Job Progression for Water Treatment Plant Operator .......................... 140
Exhibit VII-11 Streamlined Commissioner Organizational Structure .......................................... 142
Draft Report – For Review and Verification Purposes Only ix
12/18/2014
Table of Findings
I. EXECUTIVE SUMMARY .......................................................................................................... 1
II. STUDY BACKGROUND .......................................................................................................... 9
III. PERFORMANCE MEASUREMENT .................................................................................. 25
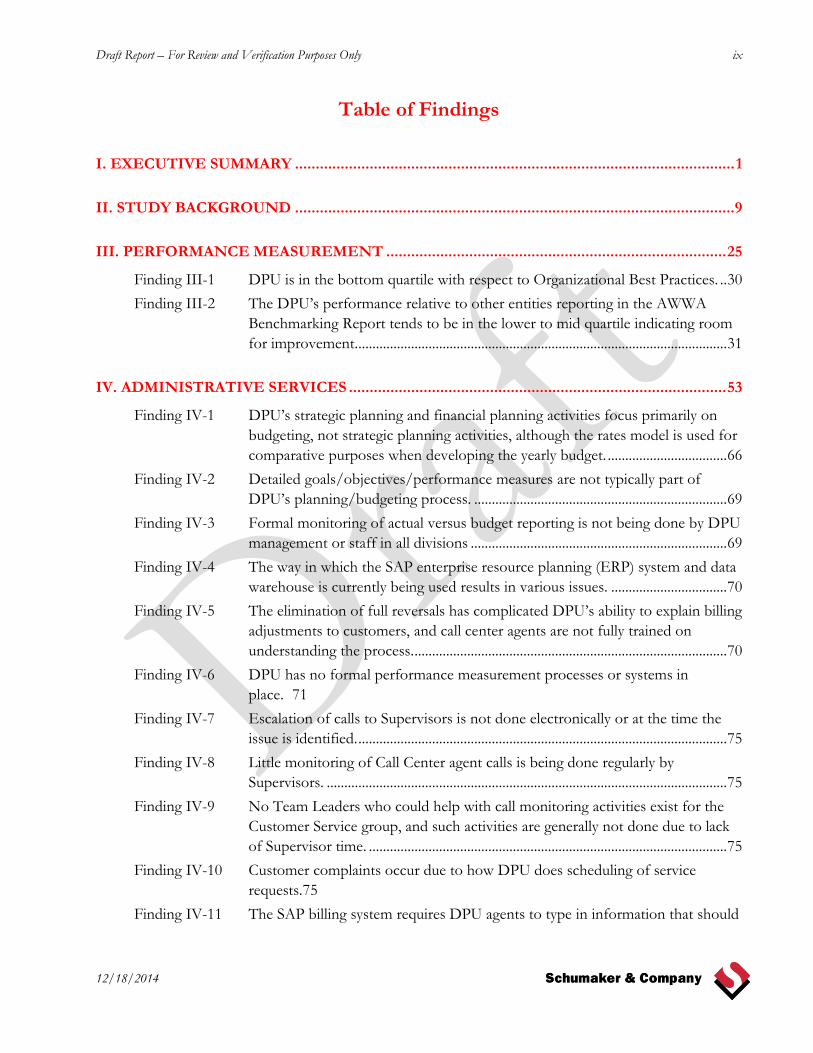
Finding III-1 DPU is in the bottom quartile with respect to Organizational Best Practices. .. 30
Finding III-2 The DPU’s performance relative to other entities reporting in the AWWA
Benchmarking Report tends to be in the lower to mid quartile indicating room
for improvement. ......................................................................................................... 31
IV. ADMINISTRATIVE SERVICES ........................................................................................... 53
Finding IV-1 DPU’s strategic planning and financial planning activities focus primarily on
budgeting, not strategic planning activities, although the rates model is used for
comparative purposes when developing the yearly budget. .................................. 66
Finding IV-2 Detailed goals/objectives/performance measures are not typically part of
DPU’s planning/budgeting process. ........................................................................ 69
Finding IV-3 Formal monitoring of actual versus budget reporting is not being done by DPU
management or staff in all divisions ......................................................................... 69
Finding IV-4 The way in which the SAP enterprise resource planning (ERP) system and data
warehouse is currently being used results in various issues. ................................. 70
Finding IV-5 The elimination of full reversals has complicated DPU’s ability to explain billing
adjustments to customers, and call center agents are not fully trained on
understanding the process. ......................................................................................... 70
Finding IV-6 DPU has no formal performance measurement processes or systems in
place. 71
Finding IV-7 Escalation of calls to Supervisors is not done electronically or at the time the
issue is identified. ......................................................................................................... 75
Finding IV-8 Little monitoring of Call Center agent calls is being done regularly by
Supervisors. .................................................................................................................. 75
Finding IV-9 No Team Leaders who could help with call monitoring activities exist for the
Customer Service group, and such activities are generally not done due to lack
of Supervisor time. ...................................................................................................... 75
Finding IV-10 Customer complaints occur due to how DPU does scheduling of service
requests.75
Finding IV-11 The SAP billing system requires DPU agents to type in information that should

x Draft Report – For Review and Verification Purposes Only
12/18/2014
be available in drop-downs. ....................................................................................... 76
Finding IV-12 The DPU Call Center and Billing groups do not have trainers to regularly
provide training to employees. .................................................................................. 76
Finding IV-13 The DPU’s Customer Service Unit Call Center performance statistics are
improving. .................................................................................................................... 77
Finding IV-14 Multiple call centers typically confuse customers, reduce staffing efficiency, and
increase costs................................................................................................................ 79
Finding IV-15 Appeals to the Adjustment Committee include only DPU management
employees and appear to be generally done without bias; however, the lack of
outside involvement on the committee may give the perception that this is not
true. 80
Finding IV-16 DPU’s collections and write-off processes are substantially different from those
used by other utility organizations. ........................................................................... 81
Finding IV-17 Although the Billing and Water Distribution Collections groups are now both
working to input work orders to SAP, the lack of using electronic workflow for
sending documents, coupled with these groups’ different locations, results in
inefficiencies in workflow activities. ......................................................................... 83
Finding IV-18 A large backlog of work order items has resulted in confusion to customers due
to the increased need for re-billing. .......................................................................... 83
Finding IV-19 No standard rules exist for re-billing. ....................................................................... 83
Finding IV-20 Each of the Legal Technicians reports directly to the Manager, as do other
groups, without having a Supervisor for their group. ............................................ 84
V. SAFETY .................................................................................................................................... 89
Finding V-1 DPU occupational injury rates exceed comparable industry benchmarks. ......... 89
Finding V-2 Safety performance varies by division. ..................................................................... 94
Finding V-3 Safety performance is not measured and communicated. ..................................... 96
Finding V-4 Safety accountability at the operational level is weak. ............................................ 96
Finding V-5 DPU operates with insufficient staffing of occupational health and safety
professionals................................................................................................................. 97
Finding V-6 Safety training and documentation is inadequate. .................................................. 97
Finding V-7 Workers’ compensation costs have declined over the last three years. ............... 98
Finding V-8 Sewer and Drainage has the highest workers’ compensation medical claims
cost. 98
VI. OPERATING DIVISIONS .................................................................................................. 103
Finding VI-1 There is no overall integrated strategic plan or strategic planning process. ..... 114
Draft Report – For Review and Verification Purposes Only xi
12/18/2014
Finding VI-2 Field and plant activities appear appropriate, although there are opportunities
for improvement in two areas in particular (discussed in subsequent
findings).114
Finding VI-3 Cityworks has been implemented to some level of success throughout
DPU. 114
Finding VI-4 Multiple organizations and narrow job definitions reduce deployment flexibility
and increase costs. .................................................................................................... 115
Finding VI-5 One area where DPU has excelled is with respect to its use of commercial
driver’s licenses (CDLs). .......................................................................................... 116
Finding VI-6 Crew sizes appear reasonable. ................................................................................ 116
Finding VI-7 Performance measures have not been developed based on installed systems. 117
Finding VI-8 The fleet mix appears reasonable, although there are some older vehicles. .... 117
Finding VI-9 Facilities appear well maintained and not crowded (except maybe Water
Treatment, which is in a state of construction). ................................................... 117
Finding VI-10 Property security is reasonable. .............................................................................. 117
Finding VI-11 There are good basic systems in place (GIS & Cityworks) that need to be
further developed for management of activities. ................................................. 118
Finding VI-12 The main replacement program has not yet achieved positive results. ............ 118
Finding VI-13 The sewer replacement program needs more emphasis. .................................... 119
VII. ORGANIZATION AND HUMAN RESOURCES ............................................................ 125
Finding VII-1 DPU staffing levels are average in terms of per-employee productivity
measures. .................................................................................................................... 125
Finding VII-2 DPU has an aging workforce. ................................................................................. 127
Finding VII-3 DPU does not have a workforce plan and employs limited recruitment and
retention strategies. .................................................................................................. 128
Finding VII-4 DPU operators pay rates are comparable, although somewhat lower, to
benchmark median pay rates. ................................................................................. 128
Finding VII-5 The DPU does not have a management succession plan. .................................. 129
Finding VII-6 DPU management salaries are below market. ...................................................... 129
Finding VII-7 DPU management has had frequent restructurings and significant turnover of
senior management that limit its ability to plan and execute performance
improvement initiatives. .......................................................................................... 130
Finding VII-8 DPU Commissioners have few direct reports and inconsistent reporting
structures.................................................................................................................... 131
Finding VII-9 The DPU use of supervisory titles and associated levels of authority are
inconsistent. ............................................................................................................... 132

xii Draft Report – For Review and Verification Purposes Only
12/18/2014
Finding VII-10 DPU’s aging workforce, lack of workforce and succession plans, high turnover,
and below market management compensation present a continuity risk for the
utility.133
Finding VII-11 DPU does little employee training. ......................................................................... 134
Finding VII-12 DPU has no formal training and certification records system. .......................... 134
Finding VII-13 DPU utilizes job classifications that limit employee development and
deployment flexibility. .............................................................................................. 134
Finding VII-14 The DPU provides limited incentive for operators to get advanced
licensing.135
Finding VII-15 The AFSCME Local 7 contract presents a significant opportunity to redesign
jobs to encourage professional development and deployment flexibility. ........ 135
Finding VII-16 DPU uses significant amounts of overtime to address chronic vacancies. ...... 135
Finding VII-17 DPU divides customer service between Utilities Administration and Water
Distribution. ............................................................................................................... 136
Draft Report – For Review and Verification Purposes Only xiii
12/18/2014
Table of Recommendations
I. EXECUTIVE SUMMARY .......................................................................................................... 1
II. STUDY BACKGROUND .......................................................................................................... 9
III. PERFORMANCE MEASUREMENT .................................................................................. 25
Recommendation III-1 Undertake steps to address all areas of the organization best practices
assessment. (Refer to Finding III-1.) ...................................................... 50
Recommendation III-2 Undertake steps to address all of the areas of bottom quartile
performance to move the DPU to a top quartile performer. (Refer to
Finding III-2.) ............................................................................................ 51
IV. ADMINISTRATIVE SERVICES ........................................................................................... 53
Recommendation IV-1 Improve the annual DPU budgeting process to formally incorporate
detailed goals/objectives/performance measures included as part of
the annual process. (Refer to Finding IV-1 and Finding IV-2.) ......... 84
Recommendation IV-2 Require all DPU operating divisions to formally monitor actual-to-
budget financial figures on a monthly basis and provide explanation
to management for any significant variance. (Refer to
Finding IV-3.) ............................................................................................ 84
Recommendation IV-3 Work with the City Finance and ICT Departments to expand DPU’s
SAP capabilities. (Refer to Finding IV-4 and Finding IV-11.) ........... 85
Recommendation IV-4 Establish standard rules for rebilling and provide formal training not
only to Accounting & Financial Analysis employees but also
Customer Service Unit employees who discuss bills with customers.
(Refer to Finding IV-5 and Finding IV-19.) .......................................... 85
Recommendation IV-5 Establish a formal performance measurement process for all DPU
divisions that supports the Utility’s strategic planning process. (Refer
to Finding IV-6.)........................................................................................ 86
Recommendation IV-6 Have agents contact Supervisors immediately when escalation of calls
is necessary. (Refer to Finding IV-7.) ..................................................... 86
Recommendation IV-7 Regularly monitor customer calls at least once per week for each
agent. (Refer to Finding IV-8 and Finding IV-9.) ................................ 86
Recommendation IV-8 Modify service request and implementation procedures to improve
customer interactions. (Refer to Finding IV-10.) ................................. 86
Recommendation IV-9 Assign at least one dedicated training staff to the Utilities
Administration group to provide regular training to Customer Service
xiv Draft Report – For Review and Verification Purposes Only
12/18/2014
Unit and Billing & Records employees. (Refer to Finding IV-12.).... 87
Recommendation IV-10 Integrate DPU billing and water emergency calls into one Customer
Service Unit. (Refer to Finding IV-14.) ................................................. 87
Recommendation IV-11 Incorporate into the Adjustment Committee at least one external
individual who is not part of the DPU service process. (Refer to
Finding IV-15.) .......................................................................................... 87
Recommendation IV-12 Perform a formal investigation and study focusing on determining
the costs and benefits of using collection agencies and collection law
firms. (Refer to Finding IV-16.) .............................................................. 87
Recommendation IV-13 Develop a formal write-off policy for the DPU organization. (Refer
to Finding IV-16.) ..................................................................................... 88
Recommendation IV-14 Combine the Billing & Records group and the Water Distribution
Collections group into one entity located at the Water Distribution
facility and improve electronic workflow between groups. (Refer to
Finding IV-17 and Finding IV-18.) ........................................................ 88
Recommendation IV-15 Assign a Supervisor who supervises the Legal Technicians and Clerk
currently located in the Utilities Administration group. (Refer to
Finding IV-20.) .......................................................................................... 88
V. SAFETY .................................................................................................................................... 89
Recommendation V-1 Analyze high-injury work processes and identify work method
changes to reduce associated occupational injuries. (Refer to
Finding V-1 Finding V-2, Finding V-3, and Finding V-8.) ................. 99
Recommendation V-2 Measure and report safety performance. (Refer to Finding V-3 and
Finding V-4.) .............................................................................................. 99
Recommendation V-3 Recognize and reward good performance. (Refer to
Finding V-4.) ............................................................................................ 100
Recommendation V-4 Strengthen safety accountability at every level of the organization.
(Refer to Finding V-4.) ........................................................................... 100
Recommendation V-5 Create a safety committee scorecard. (Refer to Finding V-3,
Finding V-4, Finding V-5, and Finding V-6.) ..................................... 101
Recommendation V-6 Implement a training management system. (Refer to
Finding V-6.) ............................................................................................ 101
Recommendation V-7 Hire a least one additional safety professional (Refer to Finding V-3,
Finding V-4, and Finding V-5 and Finding V-6.) ............................... 102
VI. OPERATING DIVISIONS .................................................................................................. 103
Recommendation VI-1 Initiate a formal annual strategic planning process. (Refer to

Draft Report – For Review and Verification Purposes Only xv
12/18/2014
Finding VI-1.) ......................................................................................... 120
Recommendation VI-2 Complete the implementation of Cityworks throughout DPU. (Refer
to Finding VI-3.)..................................................................................... 121
Recommendation VI-3 Create higher-level performance reporting tied to the Cityworks
software. (Refer to Finding VI-7.) ....................................................... 121
Recommendation VI-4 Investigate incorporation of risk into the main replacement program
and closely monitor the pipe breaks per mile to assure a decreasing
number of breaks based on the additional funding. (Refer to
Finding VI-12.) ....................................................................................... 123
VII. ORGANIZATION AND HUMAN RESOURCES ............................................................ 125
Recommendation VII-1 Develop a comprehensive workforce plan that addresses future
needs, including staffing and associated skill levels. (Refer to
Finding VII-1, Finding VII-2, and Finding VII-3.) ........................... 137
Recommendation VII-2 Develop a comprehensive management succession plan that that
addresses future needs and defines recruitment and retention
strategies, including compensation. (Refer to Finding VII-2,
Finding VII-5, Finding VII-6, Finding VII-7, Finding VII-8,
Finding VII-9, and Finding VII-10.) ................................................... 138
Recommendation VII-3 Combine jobs, where possible, and implement a
competency/certification based job-progression system to encourage
professional development, employee retention, deployment flexibility
and productivity. (Refer to Finding VII-1, Finding VII-2,
Finding VII-4, Finding VII-9, Finding VII-11, Finding VII-13,
Finding VII-14, Finding VII-15, and Finding VII-16.) .................... 138
Recommendation VII-4 Implement a formal employee training system and a learning
management system to deliver and document training. (Refer to
Finding VII-11, Finding VII-12, and Finding VII-14.) .................... 140
Recommendation VII-5 Consider reducing the number of Commissioners and streamlining
the management and supervisory structure. (Refer to Finding VII-1,
Finding VII-5, Finding VII-6, Finding VII-7, Finding VII-8, and
Finding VII-9) ......................................................................................... 141
Recommendation VII-6 Integrate customer service functions under Utilities Administration.
(Refer to Finding VII-17.) ..................................................................... 142

Draft Report – For Review and Verification Purposes Only 1
12/18/2014
I. Executive Summary
This chapter represents a summary of the results of the performance audit of the Toledo Department of
Public Utilities (DPU) completed by Schumaker & Company. It includes a synopsis of the objectives
and scope of our work, a functional evaluation summary, and several exhibits, for amplification
purposes, that encapsulate the recommendations and estimated benefits associated with these
improvement opportunities.
The remaining report chapters contain a discussion of our findings, conclusions, and recommendations
for each discrete area of review within the scope of the audit. They include:
Chapter I – Executive Summary
Chapter II – Study Background
Chapter III – Performance Measurement
Chapter IV – Utilities Administration
Chapter V – Safety
Chapter VI - Operating Divisions
Chapter VII – Organization and Human Resources
These chapters provide the detailed facts and analyses that support, and provide context for, the
recommendations we have made. The findings and recommendations contained in this audit report are
the findings and recommendations of the consultant only and are not necessarily agreed to by DPU or
City of Toledo.
During conduct of the review, our consultants allocated considerable time to interviewing DPU and City
of Toledo personnel, riding around with DPU field personnel, reviewing reports and documentation,
analyzing work flow processes, and assessing any changes being planned by DPU management. The
consultant team focused on identifying areas for improvement, rather than areas where operations
performed well. Although some recommendations were associated with areas that had been identified
prior to the review as improvement opportunities, we endeavored to formulate more detailed action
steps in our recommendations.
This review was performed in accordance with generally accepted auditing standards (GAAS), as
contained in the United States General Accounting Office’s “Standards for Audit of Government
Organizations, Programs, Activities, and Functions,” related to issues of management economy,
efficiency, and effectiveness as applicable to public utilities (“Yellow Book”), and in accordance with the
standards as defined in the RFP and set forth in the National Association of Regulatory Utility
Commissioners’ “Consultant Standards and Ethics for Performance of Management Analysis.”

2 Draft Report – For Review and Verification Purposes Only
12/18/2014
A. Summary of Recommendations
The audit produced ____ recommendations, which are contained in this report. A summary of the
number of priority items, and estimated benefits, is grouped by phase. Following is a brief explanation
of these categories of information.
Priority
To assist DPU management in developing implementation plans, each recommendation has been
assigned a priority of “high,” “medium,” or “low” according to the following criteria:
High – Designated recommendations are high priority because of their importance and urgency.
These represent significant benefit potential, major improvements to service, or substantial
improvements to methods or procedures.
Medium – Designated recommendations are of medium priority. In some instances, the
implementation of these recommendations is expected to provide moderate improvements in
profitability of operations, or management methods and performance. In other instances,
implementation may provide significant longer-term benefits which are less predictable.
Low – Designated recommendations reflect a lower priority. In many instances, they should be
studied further or implemented sometime during the next few years. Potential benefits are
perceived to be either modest or difficult to measure.
In many recommendations, it is not possible or practical at this time to measure “quantitative” benefits.
The benefits associated with these recommendations fall primarily into four categories:
Reduction in actual costs of operations within a DPU area
Increase in a revenue source within a DPU area
Change in work flow processes used in the provision of services to DPU customers on a more
effective or efficient basis
Change in other processes resulting in good business practices being implemented
Particularly in instances where a new management practice or procedure is recommended (where one
either did not exist or was not fully implemented), it may be difficult to estimate the actual benefit to be
derived. It is believed, however, that the overall benefit will be improved effectiveness and efficiency of
the specified DPU area. Additionally, qualitative benefits may occur that cannot be easily quantified.
They could include improved effectiveness and efficiency in operations, increased customer satisfaction,
additional cost savings, increased revenues, etc. It should also be noted that, because it is not possible in
all instances to estimate expected benefits prior to implementation, any implementation plan should
include a reliable measurement tool to track benefits after implementation.

Draft Report – For Review and Verification Purposes Only 3
12/18/2014
Quantifiable benefits (increased revenues or additional cost savings) have been provided where they
could be estimated. This quantification is subject to some judgment and would require additional effort
beyond the scope of this review to refine the estimates. The actual benefits from these
recommendations are, therefore, subject to a degree of uncertainty. For other recommendations the
benefits to be derived are of a more qualitative nature or, simply stated, the expectations of prudent
management. Those areas where major quantifiable benefits have been identified in the report are
described on the following pages.
As DPU will have varying ways to implement recommendations, Schumaker & Company did not
estimate the impact of implementing audit recommendations on DPU’s expense. However, the short-
term impact could be considerable. Additionally, implementation of recommendations often requires a
phase-in period before benefits can be achieved.
B. Recommendations Listing
The actual recommendation statements contained in the audit report are shown by phase and work plan
area on the following pages. We have also indicated the recommendation number, page number in the
report, priority, estimated time-frame to initiate implementation efforts, and estimated benefits following
implementation. The details of each recommendation can be found in the individual chapters where the
subject matter is evaluated.
Chapter III – Performance Measurement
Implementation
Description Page Priority Initiation
Time Frame Benefits
III-1 Undertake steps to address all areas of the organization best practices assessment. (Refer to Finding III-1.)
50 High 6 – 12 months TBD
III-2 Undertake steps to address all of the areas of bottom quartile performance to move the DPU to a top quartile performer. (Refer to Finding III-2.)
51 High 6 – 12 months TBD
Chapter IV – Administrative Services
Implementation
Description Page Priority Initiation
Time Frame Benefits
IV-1 Improve the annual DPU budgeting process to formally incorporate detailed goals/objectives/performance measures included as part of the annual process. (Refer to Finding IV-1 and Finding IV-2.)
84 High 0 – 6 months TBD

4 Draft Report – For Review and Verification Purposes Only
12/18/2014
Implementation
Description Page Priority Initiation
Time Frame Benefits
IV-2 Require all DPU operating divisions to formally monitor actual-to-budget financial figures on a monthly basis and provide explanation to management for any significant variance. (Refer to Finding IV-3.)
84 High 0 – 6 months TBD
IV-3 Work with the City Finance and ICT Departments to expand DPU’s SAP capabilities. (Refer to Finding IV-4 and Finding IV-11.)
85 Medium 6 – 12 months TBD
IV-4 Establish standard rules for rebilling and provide formal training not only to Accounting & Financial Analysis employees but also Customer Service Unit employees who discuss bills with customers. (Refer to Finding IV-5 and Finding IV-19.)
85 Medium 6 – 12 months TBD
IV-5 Establish a formal performance measurement process for all DPU divisions that supports the Utility’s strategic planning process. (Refer to Finding IV-6.)
86 High 0 – 6 months TBD
IV-6 Have agents contact Supervisors immediately when escalation of calls is necessary. (Refer to Finding IV-7.)
86 High 0 – 6 months TBD
IV-7 Regularly monitor customer calls at least once per week for each agent. (Refer to Finding IV-8 and Finding IV-9.)
86 High 0 – 6 months TBD
IV-8 Modify service request and implementation procedures to improve customer interactions. (Refer to Finding IV-10.)
86 Medium 6 – 12 months TBD
IV-9 Assign at least one dedicated training staff to the Utilities Administration group to provide regular training to Customer Service Unit and Billing & Records employees. (Refer to Finding IV-12.)
87 High 6 – 12 months TBD
IV-10 Integrate DPU billing and water emergency calls into one Customer Service Unit. (Refer to Finding IV-14.)
87 High 6 – 12 months TBD
IV-11 Incorporate into the Adjustment Committee at least one external individual who is not part of the DPU service process. (Refer to Finding IV-15.)
87 Low 12 + months TBD
IV-12 Perform a formal investigation and study focusing on determining the costs and benefits of using collection agencies and collection law firms. (Refer to Finding IV-16.)
87 Low 12 + months TBD
IV-13 Develop a formal write-off policy for the DPU organization. (Refer to Finding IV-16.)
88 Low 12 + months TBD

Draft Report – For Review and Verification Purposes Only 5
12/18/2014
Implementation
Description Page Priority Initiation
Time Frame Benefits
IV-14 Combine the Billing & Records group and the Water Distribution Collections group into one entity located at the Water Distribution facility and improve electronic workflow between groups. (Refer to Finding IV-17 and Finding IV-18.)
88 Medium 6 – 12 months TBD
IV-15 Assign a Supervisor who supervises the Legal Technicians and Clerk currently located in the Utilities Administration group. (Refer to Finding IV-20.)
88 Medium 6 – 12 months TBD
Chapter V – Safety
Implementation
Description Page Priority Initiation
Time Frame Benefits
V-1 Analyze high-injury work processes and identify work method changes to reduce associated occupational injuries. (Refer to Finding V-1 Finding V-2, Finding V-3, and Finding V-8.)
99 High 0 – 6 months TBD
V-2 Measure and report safety performance. (Refer to Finding V-3 and Finding V-4.)
99 High 0 – 6 months TBD
V-3 Recognize and reward good performance. (Refer to Finding V-4.)
100 Medium 12 + months TBD
V-4 Strengthen safety accountability at every level of the organization. (Refer to Finding V-4.)
100 Medium 12 + months TBD
V-5 Create a safety committee scorecard. (Refer to Finding V-3, Finding V-4, Finding V-5, and Finding V-6.)
101 High 0 – 6 months TBD
V-6 Implement a training management system. (Refer to Finding V-6.)
101 Medium 12 + months TBD
V-7 Hire a least one additional safety professional (Refer to Finding V-3, Finding V-4, Finding V-5 and Finding V-6.)
102 Medium 12 + months TBD

6 Draft Report – For Review and Verification Purposes Only
12/18/2014
Chapter VI – Operating Divisions
Implementation
Description Page Priority Initiation
Time Frame Benefits
VI-1 Initiate a formal annual strategic planning process. (Refer to Finding VI-1.)
120 High 0 - 6 months TBD
VI-2 Complete the implementation of Cityworks throughout DPU. (Refer to Finding VI-3.)
121 Medium 6 – 12 months TBD
VI-3 Create higher-level performance reporting tied to the Cityworks software. (Refer to Finding VI-7.)
121 High 6 – 12 months TBD
VI-4 Investigate incorporation of risk into the main replacement program and closely monitor the pipe breaks per mile to assure a decreasing number of breaks based on the additional funding. (Refer to Finding VI-12.)
123 High 12 + Months TBD
Chapter VII – Organization and Human Resources
Implementation
Description Page Priority Initiation
Time Frame Benefits
VII-1 Develop a comprehensive workforce plan that addresses future needs, including staffing and associated skill levels. (Refer to Finding VII-1, Finding VII-2, and Finding VII-3.)
137 High 6 – 12 months TBD
VII-2 Develop a comprehensive management succession plan that that addresses future needs and defines recruitment and retention strategies, including compensation. (Refer to Finding VII-2, Finding VII-5, Finding VII-6, Finding VII-7, Finding VII-8, Finding VII-9, and Finding VII-10.)
138 High 6 – 12 months TBD
VII-3 Combine jobs, where possible, and implement a competency/certification based job-progression system to encourage professional development, employee retention, deployment flexibility and productivity. (Refer to Finding VII-1, Finding VII-2, Finding VII-4, Finding VII-9, Finding VII-11, Finding VII-13, Finding VII-14, Finding VII-15, and Finding VII-16.)
138 Medium 12 + months TBD
VII-4 Implement a formal employee training system and a learning management system to deliver and document training. (Refer to Finding VII-11, Finding VII-12, and Finding VII-14.)
140 Medium 12 + mjonths TBD

Draft Report – For Review and Verification Purposes Only 7
12/18/2014
Implementation
Description Page Priority Initiation
Time Frame Benefits
VII-5 Consider reducing the number of Commissioners and streamlining the management and supervisory structure. (Refer to Finding VII-1, Finding VII-5, Finding VII-6, Finding VII-7, Finding VII-8, and Finding VII-9)
141 Medium 12 + Months TBD
VII-6 Integrate customer service functions under Utilities Administration. (Refer to Finding VII-17.)
142 Medium 12 + Months TBD

Draft Report – For Review and Verification Purposes Only 9
12/18/2014
II. Study Background
A. High-Level Evaluation Criteria – Utility of the Future
A management support study of a water utility brings to bear:
The specific knowledge and skills of the individual consultant relative to the state of today’s
management practices
The specific knowledge of what other similar utilities have in place or plans for managing the
specific activities involved in a utility
An assessment of management performance must take into consideration both of these items in
developing an overall assessment of a water utility such as Philadelphia Water Department (PWD). It
should go without saying that some utilities are more advanced in some areas of their organization than
others. Some are still in the planning stages, some are well into the implementation phases, and some
are simply unaware of areas within their organization that need to be strengthened or improved.
However, the utilities we usually rank as higher performers in management support study have at their
core the certain types of vision, mission, and values. At a minimum, they also strive to:
1. Foster a safe, accident-free work environment.
2. Develop employees who are highly skilled, empowered, motivated, and ambassadors for the
organization.
3. Deliver high-quality products and services that meet or exceed customer expectations and all
regulatory requirements.
4. Be held in esteem by the communities they serve.
5. Maintain competitive rates.
6. Operate a highly reliable, efficient distribution system constructed of appropriate materials.
7. Maintain a current strategic plan that fosters management through objectives with relevant
metrics and through reportage at all levels that link to the plan (such as planned versus
emergency work, % travel time).
8. Have a flexible, robust, and easy-to-use reporting and data inquiry system.
9. Organize themselves in a lean, flat, effective structure.
10. Optimize the use of electronic data entry and retrieval, and eliminate paper reporting and data
gathering.
11. Proactively pursue continuous improvement in technology (both Information Technology (IT)
and non-IT), work practices, and processes

10 Draft Report – For Review and Verification Purposes Only
12/18/2014
12. Maintain very few and flexible job classifications that address all work crews/individuals, thereby
enabling work across functions (e.g., combining distribution and collector systems crews), and
having one job classification to perform Meter, Delinquency and Repair, and Customer Service
work.
13. Operate a single call center manned by empowered employees who have access to information
that enables them to handle all inquiries, including accounting and billing, scheduling field visits,
complaints, and job status.
14. Plan, schedule, dispatch, and supervise all work using a comprehensive work management
system. Supervision has access to all jobs and crew locations via global positioning system
(GPS) and the crew/individual work queues.
15. Field operations crews and single dispatch employees work out of efficient, strategically placed
reporting locations with sufficient capacity for onsite parking for all company vehicles, materials,
equipment administrative functions, and employee facilities.
16. Deploy two-man crews with the proper vehicles, tools, and equipment and communication
devices as the “standard work crew.” Recognize that combining multiple crews for specific jobs
or having a one-man “crew” is appropriate when needed.
17. Equip crews and individuals with electronic communications devices that enable the entry and
retrieval of data as required for their jobs (e.g., service orders, customer appointments, meter
data, customer account data, work orders, crew locations and job assignments, asset data and
location, safety standards, construction standards, time reporting, job completion data, etc.).
The objective of this is that data entry and retrieval need to be handled only once, at the source.
18. Leverage geographic information system (GIS) technologies in all mapping and records systems
and GPS location services in field force dispatching operations
In future operations, all work performed and the metrics relating to that work will be linked directly the
DPU strategic plan. It is expected that the work performed and products provided will be of the highest
quality and will meet or exceed customer expectations. It is given that the inside plant infrastructure will
continue to be right sized for changes in demand and will be maintained to be reliable and efficient. It is
envisioned that the transition of the piping systems from cast iron to material such as malleable iron
pipe in an effort to eliminate the breakage occurring in winter will proceed as quickly as economically
feasible with prioritization of replacements being based on risk. A single call center manned by
empowered employees will handle all customer inquiries. Field operations will work out of well-
equipped reporting locations. All work, both planned and emergent, is initiated, planned, scheduled,
and dispatched using a comprehensive work management system. A typical crew will consist of two
employees using a vehicle that is equipped with an onboard compressor and that is towing a mini-
excavator. “Customer service” personnel will be able to be dispatched to perform all service inquiries
including meter and disconnection and connection work. Crews and customer service personnel will be
regularly monitored for quality. Field employees will receive and report on all activities using an
electronic device. This device will also enable them to do time reporting, access asset data from GIS,
look up constructions standards and procedures, look up safety standards and procedures, create work
Draft Report – For Review and Verification Purposes Only 11
12/18/2014
orders, and complete work orders. In essence, all data required to be communicated to and from field
associates will be done using this device. Customers will be regularly asked for their feedback on
service.
It is realized that there are many initiatives underway within DPU to achieve a number of the goals
mentioned above (such as the implementation of Cityworks). Incorporating the recommendations
contained in this report into the plan and executing the plan puts DPU well on its way to fulfilling its
vision “to become America’s model 21st Century urban water utility—one that fully meets the complex
responsibilities and opportunities of our time and our environment.”
B. Toledo Department of Public Utilities (DPU)
DPU is one of the largest units in the City of Toledo with approximately 659 employees serving within
seven divisions: Water Treatment, Water Distribution, Sewer and Drainage Services, Water Reclamation,
Engineering Services, Environmental Services, and Utilities Administration. Schumaker & Company
review only addressed the first four division (Water Treatment, Water Distribution, Sewer and Drainage
Services, Water Reclamation) and Utilities Administration.
DPU operates a water treatment system that produces 26 billion gallons of high-quality drinkng water
per year to an estimated 500,000 people in Toledo, and Lucas, Wood and Fulton Counties in Ohio, and
Momoe, Michigan. The Collins Park Water Treatment Plant draws from Lake Erie and produces an
average of 73 million gallons per day (MGD) with a capacity of 150 MGD. The City's water distribution
system is comprised of 1165 miles of transmission lines.
The sanitary sewage system operated by DPU collected and treated approximately 88 million gallons of
wastewater per day from 103,287 residential, commercial, institutional and industrial customers within
Toledo and approximately 7,686 customers outside of the City. An estimated 320,000 people are served
by the sewer system. Wastewater is collected by 961 miles of local and interceptor sanitary sewers
owned by the City. The City's Bay View Wastewater Treatment Plant is an activated sludge plant that
practices nitrification and chemical phosphorous removal sized with an average daily flow of 102 million
gallons per day. The plant is designed with a firm capacity to provide full treatment to 195 MGD. The
plant is also equipped with a High Rate Treatment process that has a film capacity to treat 185 MGD of
storm flows. This brings its total capacity to 380MGD.
DPU Rates
DPU’s rates compared to other similar municipalities are shown in Exhibit II-1. DPU’s rates compare
favorably with other similar municipal utilities.

12 Draft Report – For Review and Verification Purposes Only
12/18/2014
Exhibit II-1 2013 Residential Rates Comparison
Based on 1,000 Cubic Feet per Month, 5/8” Meter as of December 31, 2012
City Water Rates Wastewater Rates Total
Ann Arbor, MI $29.12 $38.32 $67.44
Cleveland, OH $33.69 $58.90 $92.59
Columbus, OH $59.16 $48.06 $107.22
Detroit, MI $25.12 $61.77 $86.89
Fort Wayne, IN $26.53 $45.64 $72.17
Average of Above Cities $34.72 $50.54 $86.26
Average of Reporting Water Systems $31.51 $40.79 $72.30
TOLEDO, OH $14.53 $48.71 $62.24
Source: Information Response 112 – 2013 Water and Wastewater Rate Survey – American Water Works Association (AWWA)
In a similar manner, DPU’s industrial rates are shown in Exhibit II-2.
Exhibit II-2 2013 Industrial Rates
Based on 1 Million Cubic Feet per Month, 4” Meter as of December 31, 2013
City Water Rates Wastewater Rates Total
Ann Arbor, MI $30,302.67 $34,888.33 $65,191.00
Cleveland, OH $29,523.87 $56,802.10 $86,325.97
Columbus, OH $20,087.28 $40,110.86 $60,198.14
Detroit, MI $16,486.83 $41,273.89 $57,760.72
Fort Wayne, IN $15,017.13 $39,967.68 $54,984.81
Average of Above Cities $22,283.56 $42,608.57 $64,892.13
Average of Reporting Water Systems $25,659.91 $34,552.20 $60,212.11
TOLEDO, OH $11,640.90 $37,672.99 $49,313.89
Source: Information Response 112 2013 Water and Wastewater Rate Survey – American Water Works Association (AWWA)
Staffing Levels
The increase in budgets staffing levels over the last 11 years is shown in Exhibit II-3. Overall staffing
levels have increased by 13.7% over this time period.

Draft Report – For Review and Verification Purposes Only 13
12/18/2014
Exhibit II-3 Budgeted Staffing Levels as of December 31, 2013
Source: Information Response 5 Utilities Administration is now referred to as Administrative Services
However, not all areas have increased at that rate as shown in Exhibit II-4. In fact during this time
period, the Sewer and Drainage area has had a slight decrease in staffing levels, whereas all of the other
areas have experienced an increase in budgeted staffing levels as shown in Exhibit II-4.
2002 2003 2004 2005 2006 2007 2008 2009 2010 2011 2012 2013
Engineering Services 59 62 62 63 66 67 69 74 73 73 73 71
Environmental Services 42 44 40 44 48 47 47 47 48 47 44 49
Sewer and Drainage 141 142 134 140 141 141 141 140 141 138 141 141
Water Reclamation 110 112 116 112 115 116 117 121 123 125 127 129
Water Distribution 147 143 151 150 153 155 158 158 159 162 155 162
Water Treatment 78 79 79 83 82 80 80 81 82 97 101 101
Utilities Administration 61 67 76 70 63 63 63 63 63 64 72 85
0
100
200
300
400
500
600
700
800

14 Draft Report – For Review and Verification Purposes Only
12/18/2014
Exhibit II-4 10 Year Changes in Staffing Levels
as of December 31, 2013
Source: Information Response 5 Utilities Administration is now referred to as Administrative Services
However, a slightly different conclusion would be drawn if the organization charts are studied in detail.
The above figures are “budget” figures and therefore must be adjusted for “vacancies” i.e. budgeted but
not filled. In short, many of the division have not been operating at their budgeted staffing levels during
this timeframe.
C. Objectives and Scope
Schumaker & Company understands that the scope of work to provide performance audit services will
include, but not be limited to, the following five themes as defined in the RFP. Quantitative evaluation
is expected for each already identified performance measure, as follows:
A. Strategic Planning
i) Identify to what degree the Utility has planned and implemented progressive strategies in the
areas of water and wastewater system management, customer service, finance, human
resources management and business process improvement.
ii) Evaluate how the department communicates its long-term strategic vision to DPU’s
stakeholders, including: the Mayor, City Council, ratepayers, citizens, businesses, and other
governmental partners.
iii) Provide examples of ways to improve external and internal communication.
-5.0% 0.0% 5.0% 10.0% 15.0% 20.0% 25.0% 30.0%
Utilities Administration
Water Treatment
Water Distribution
Water Reclamation
Sewer and Drainage
Environmental Services
Engineering Services
Total

Draft Report – For Review and Verification Purposes Only 15
12/18/2014
iv) For each performance measure above, consider the following:
(1) In what ways has the Utility fostered an innovative culture?
(2) How might technology be utilized more effectively/or business process improvements
and reaching other overarching objectives throughout the organization?
(3) Does the Utility assess its strengths and opportunities/or improvement over the short-
and long-terms?
(4) Does it have short- and long-term action plans, including how resources will be directed
toward achieving goals and strategies the Utility has adopted?
(5) Does it have a process for strategic plan development and annual review or updates,
including review a/vision, mission and organization value statements?
(6) How does the City engage other community partners? Is there a process in place which
gives these community partners a “seat at the table?” Seek input from outlying
communities about their experiences with the City.
B. Financial Planning
i) Do long-term financial plans include development of adequate rates, fees and charges to
support costs associated with ongoing operation and maintenance, including asset
management, capital improvements, and reserves?
ii) Review the following business operation key performance indicators (KPIs):
(1) System Renewal/Replacement Rate (%)
(2) Return on Assets (%)
(3) Cash Reserve Days (Number of days)
C. Performance Measurement System
i) How does the Utility measure performance?
ii) Does it provide measures focused on quality, efficiency, and effectiveness?
iii) Does it include regular monitoring and reporting?
iv) Has it established targets in conjunction with the budgeting process that reflect broad
internal, external, and financial improvement goals?
v) Water Operations KPIs include:
(1) Drinking Water Compliance Rate (%)
(2) Distribution System Water Loss (%)
(3) Water Distribution System Integrity (per 100 miles of pipe)
(4) Operation & Maintenance Cost Ratios for Water ($)
(5) Planned Maintenance Ratio for Water (% per 100 miles of pipe)
(6) Water Plant Capacity (MOD)
vi) Wastewater Operations KPIs include:
(1) Sewer Overflow Rate (per 100 miles of pipe)
(2) Collection System Integrity (per 100 miles of pipe)

16 Draft Report – For Review and Verification Purposes Only
12/18/2014
(3) Wastewater Treatment Effectiveness Rate (%)
(4) Operations & Maintenance Cost Ratios for Wastewater ($)
(5) Planned Maintenance Ratio for Wastewater (% per 100 miles of pipe)
D. Customer Satisfaction
i) Does the Utility efficiently resolve customer issues and complaints?
ii) Does the Utility solicit input on projects and programs under consideration, in planning or
under construction?
iii) Measure customer relations against Customer Service Complaints (per 1,000 accounts)
iv) Analyze existing customer appeals process
v) Evaluate complaint resolution tracking mechanisms
vi) Identify any customer call routing issues/opportunities using the following KPIs:
(1) Disruptions of Water Service (per 1,000 accounts)
(2) Disruptions of Sewer Service (per 1,000 accounts)
(3) Residential Cost of Water Service ($ per 111onth)
(4) Residential Cost of Sewer Service ($ per month)
(5) Residential Cost of Storm Water Service ($ per month)
(6) Customer Service Cost per Account ($)
(7) Billing Accuracy (per 10,000 billings)
(8) Service Affordability-As compared to other Ohio and Midwestern region water utilities.

Draft Report – For Review and Verification Purposes Only 17
12/18/2014
E. Human Resource Management
i) Evaluate the impact of the following aspects on the overall strength of the organization:
(1) Appropriate Staffing Levels
(2) Appropriate Administrative Staffing Levels
(3) Job Classifications & Descriptions
(4) Recruitment & Retention
(5) Continuing Training & Education
(6) Management Compensation
(7) Succession Planning
(8) Labor Contracts
(9) Safety
ii) Use the following impact Staff Efficiency Indicators:
(1) Customer Accounts per Employee-Water, calculated as (Number of active accounts-
water)/(FTE’s-water)
(2) Customer Accounts per Employee-Wastewater, calculated as (Number of active
accounts-wastewater)/(FTE’ s-wastewater)
(3) Million Gallons per Day (MGD) of Water Delivered per Employee, calculated as
(Average MOD water delivered)/(FTE’s-water)
(4) Million gallons per day (MGD) of Wastewater Processed per Employee, calculated as
(Average MOD wastewater processed per employee)/(FTE’s wastewater)
This project was designed to help the Toledo Department of Public Utilities (DPU) identify, evaluate,
and improve its organizational and operational processes that can help to improve customer service,
level of service, service delivery, and identify opportunities to reduce costs. The focus of this proposed
assignment was to perform a detailed field activities review to assess the appropriateness of the current
organizational structure, review overall staffing issues, identify opportunities for streamlining services,
and develop performance measures and management reporting systems to achieve customer service
excellence. We recognized that the current integration of Cityworks is providing additional tools to
capture and manage field activities. Any suggestions for improvements were based on the Cityworks
effort, instead of replace or be separate from that program.
We conducted this audit in a three-step review process which has been custom tailored to meet the
DPU’s objectives. This process provided the Schumaker & Company project team with a structured
approach that is comprehensive and logical, as well as interactive and participative with the City and DPU.
The process was originally designed to establish and sustain vital, interactive working relationships among
City, DPU, and Schumaker & Company representatives during the course of management and operations
review projects. We have refined this three-step process over many reviews, audits, and studies
conducted with the same team members proposed for this project.

18 Draft Report – For Review and Verification Purposes Only
12/18/2014
D. Review Standards
Schumaker & Company subscribes to the audit standards set forth by the U.S. Government
Accountability Office’s “Standards for Audit of Government Organizations, Programs, Activities, and
Functions,” (commonly referred to as the “Yellow Book”), as applicable to performance audits. Our
project documentation system, PMIA, has been specifically developed to meet the requirements of these
standards.
E. Project Organization & Staffing
The single most important element a consulting firm brings to an assignment is the qualifications of the
individual members of the consultant team. A team composed of individuals who have worked together
successfully in the past; their talents and expertise complementing one another.
Schumaker & Company’s team has a strong working knowledge of utility company operations, as well as
current industry issues. Our consultants typically hold advanced degrees and average more than 25 years
of professional experience. The educational and professional designations of each proposed consultant
are summarized in Exhibit II-5.
Exhibit II-5 Consultant Team Experience
Name
Responsibility
Years Exp.
Education and Professional Designations
Dennis J. Schumaker Engagement/Project Manager & Senior Consultant
30+ BME (Mechanical Engineering), MS (Nuclear Engineering), MBA (Strategic & Corporate Planning) CMC®, PMP®, MCSE, MCSA
D. Kerry Laycock Senior Consultant 29+ BS (Business Administration and Management), MS (Organizational Development), CMC®
Patricia H. Schumaker Senior Consultant 30+ BSBA (Accounting), MBA (Operations Research) CMC®, CPA, PMP®
Jaye M. Kain Project Administrator & Analyst 22+ BS (Environmental Geoscience), BS/MS (Geology)
F. Methodology Summary
To accomplish the scope of work in this project, Schumaker & Company will review the DPU executive
group’s compiled data concerning DPU operations and benchmark comparisons and link the
performance audit process with the formal strategic benchmarking process already underway.
Our project team will follow a three-phase study process designed to establish and sustain vital,
interactive working relationships among the DPU personnel and the Schumaker & Company project
team. We have used a similar approach on other projects of this type, including past projects for over

Draft Report – For Review and Verification Purposes Only 19
12/18/2014
50 different entities and have found it to be very effective in achieving the intended goals of the project.
Specifically, the three phases of our proposed work plan are:
Phase I – Initial Assessment and Roadmap
Phase II – Operational Review & Assessment
Phase III – Implementation Plan and Final Report Development
Phase I: Initial Assessment and Roadmap
Schumaker & Company will engage the Mayor’s Office, DPU department heads, and key staff. These
initial meetings and onsite interviews will be essential to gain a better understanding of the DPU’s
current operations and areas for improvement. Review information obtained will allow for
benchmarking and comparison between departments selected and other similarly-situated communities.
This phase will culminate with a presentation by Schumaker & Company summarizing key findings and
recommending additional analyses of specific departments, services, or City Mayor functions based on
anticipated cost savings.
Task 1: Meetings with City & DPU Leadership – Meet with key City & DPU leadership to identify
the priorities and areas of critical concern. The results of these meetings will help to frame the
kickoff meeting proposed for Task 2.
Task 2: Kickoff Meeting – Conduct a kickoff meeting to introduce Schumaker & Company to key
staff members, clarify deliverables, and align expectations. This meeting, attended by senior
directors and department heads, will also provide Schumaker & Company with an opportunity
to answer questions posed by City/DPU staff and clarify objectives. The final activity of this
task will be to schedule proposed department head and key staff member interviews.
Task 3: Conduct Onsite Interviews – Prepare and conduct interviews with department heads and
other key staff identified. Approximately four key staff members per department will be
interviewed unless it is determined additional interviews are critical to the success of the
performance audit.
Task 4: Benchmarking – Review information already obtained by the executive team to develop
their best practices initiative plan during Task 3 to enable a comparison between the DPU and
other similarly-situated communities. The review shall include at least three communities of
similar population and services provided.
Task 5: Prepare and Present Key Preliminary Findings – Prepare and present preliminary findings after
completing Tasks 1 – 4 for the DPU’s review and comment. We will prepare a presentation
based on the feedback and comments from the chosen DPU areas. The presentation will
identify the areas and functions with the greatest opportunities for efficiency savings and quality
improvement.
20 Draft Report – For Review and Verification Purposes Only
12/18/2014
Phase II: Operational Review & Assessment
Schumaker & Company will perform an operational review and assessment for the selected DPU groups
identified for future study as part of the initial assessment and roadmap. We will assess operational
efficiency effectiveness for each selected group, service, or function identified for review, by identifying
existing work processes and determining modifications to these work processes or addition of new work
processes, plus cataloging and reporting of required staffing and associated skill sets. A draft report to
summarize recommendations for changes needed to match recommended work processes will be
prepared and presented to the Mayor and other City leadership for comment and feedback.
Task 1: Analysis of Existing Processes – Identify existing work processes for each selected DPU
area or service identified for review during the meetings with City leadership. Identify existing
work processes and determining modifications to these work processes or addition of new work
processes, plus cataloging and reporting of required staffing and associated skill sets.
Task 2: Develop Recommended Efficiency Improvements – Work with key City leadership and key staff
members to develop recommendations for addressing Task 1 activities.
Task 3: Prepare and Present Draft Report Findings & Recommendations – Prepare a draft report,
including background, findings/conclusions, and recommendations for City review and
comment. This draft report will provide recommendations for business processes, staffing
charts, and anticipated efficiency improvements. We will prepare a final report to include the
City’s comments. The final report, prepared during Phase III activities, will summarize
recommendations for changes needed.
Phase III: Implementation Plan and Final Report Development
Information and data collected during the operational review and assessment phase will be used to
analyze potential service delivery options and to identify solutions, training, and change management
courses of action to address recommendations. All recommendations will be based on
findings/conclusions and prioritized for the City leadership’s consideration. An implementation plan
will be prepared in draft format for review and comment, final format to match the optimized state of
operations, and presentation format to present to the City leadership at the conclusion of the
Implementation Plan and Final Report Development phase.
Task 1: Analysis of Service Delivery Options and Recommendations – Identify potential service delivery
options for the City to consider. The options identified will help move the DPU from the
existing state of operations to an optimized state of operations.
Task 2: Provide Recommendations Based on Delivery Options – Provide suggestions for training and
change management services based on the Task 1 recommendations.
Task 3: Prepare and Present Final Report and Implementation Plan – Prepare three deliverables: a draft
report/implementation plan, a final report/implementation plan, and a presentation of findings

Draft Report – For Review and Verification Purposes Only 21
12/18/2014
and recommendations. We will prepare the final report/implementation plan after completing
the analysis of service delivery options and recommendations for the City’s review and
comment. The final report will include background, findings/conclusions, and
recommendations and the final implementation plan will summarize recommendations for
service delivery to match the optimized state of operations. The final report and
implementation plan will be presented to the City at the conclusion of Phase III activities.
G. Framework
The overall thrust of this performance audit is to focus on the efficiency and effectiveness of the business
processes, staffing, and systems in place within the DPU to assess their efficiency and effectiveness in
delivering the activities and tasks that are necessary in fulfillment of City and DPU overall strategies
resulting in the successful achievement of mission, goals, and objectives. Strategies are developed to fulfill
the organization’s mission and fulfill the specific goals and objectives. These strategies result in the
definition of specific activities or tasks that an organization takes on to achieve the strategy which in turn,
again, fulfills the overall mission, goals, and objectives of the organization.
This is represented by a diagram, shown in Exhibit II-6, where within the context of a framework (the
boxes within the gray rounded box) all organizations have a mission, with goals and objectives for
fulfilling that mission, whether it is articulated and/or documented.

22 Draft Report – For Review and Verification Purposes Only
12/18/2014
Exhibit II-6 Strategic and Functional Assessment of Business Process Framework
The framework involves the development of specific business processes with an organization that are
designed to fulfill these activities and tasks. As illustrated in Exhibit II-6, business processes are
composed of the following three separate, yet interrelated, components that need to be structured to
create effective business processes:
Organization – The creation of a specific groping of resources (in this case people and systems)
that are charged with the specific activities/tasks – the performance of which fulfills the
strategies identified within the organization.
People – The staffing of the organization with skilled, knowledge personnel that can perform the
necessary activities within the systems developed to support the overall business processes.
Systems – The creation of effective and efficient systems, whether they be manual processes or
computer processes that support the overall business processes.
One of the key work products for this project will be to recommend to the DPU management a series of
mechanisms where the departments, boards, commissions, or agencies can regularly collect, track, review,
and analyze performance and management information and data, identify key issues and questions, and
query these organizations pertaining to such information and data.
Strategy
Mission, Goals, and Objectives
Business Activities / Tasks
Business Processes
Organization
Systems People
Draft Report – For Review and Verification Purposes Only 23
12/18/2014
Our approach will revolve around addressing the scope of work’s five themes mentioned earlier and the
questions shown below for each identified area reviewed:
What key tasks/activities are performed by the group?
Does each task/activity support a strategic or operational objective?
What are the primary performance indicators currently being used and if not applicable, what
data is available?
Is each task/activity a key competency?
What are the resources (staff hours and other resources) currently committed to each task/activity?
What can be done to improve the cost efficiency of the task/activity?
Can a task/activity be made more efficient and/or consolidated with another to achieve
efficiencies (and how quickly), performed elsewhere or outsourced, or eliminated?
These questions will serve as a starting point for accessing the DPU’s tasks and activities and the
associated performance information and data that should be collected so as to allow management to
collect, track, review, and analyze indicators as input to improving the efficiency and effectiveness of the
DPU’s business processes. This information would be compiled through a combination of individual
and group interviews to supplement any documents initially received at the beginning of the project.
This information would be loaded into a SharePoint site for further analysis and presentation purposes.
Our project approach assumes that we will be creating various steering committees and teams to facilitate
the information gathering and review/feedback activities of the project.


Draft Report – For Review and Verification Purposes Only 25
12/18/2014
III. Performance Measurement
One of the themes identified in the RFP was performance measurement. When talking about
performance measurement as it relates to an organization, it can be thought of as two distinct
components:
Internal Performance Measurement – This type of measurement includes activities that an
entity takes to measure its performance based on internal systems that have been implemented
within the organization. In the case of the Toledo Department of Public Utilities (DPU), this
could involve the creation of measurements using the Cityworks application or other internal
systems and measuring this performance indicator on an ongoing basis. For instance, the
number of jobs completed in a day could be measured as a performance indicator or the
percentage of preventive work orders versus corrective work orders could be measured.
External Performance Measurement – This type of measurement includes activities that an
entity takes to measure its performance to other similar entities. This involves collecting
information in a similar manner and then comparing it to similar information from another
entity and determining if the difference in the numbers is in a positive (beneficial) or negative
(less than beneficial) direction.
All performance measurement indicators can be changed as new systems or capabilities are implemented
within an organization. In particular, internal performance measurement is driven by the capabilities of
internal measurement systems and is typically used to drive performance by measuring the performance
over a period of time – i.e. one might expect the jobs per day to improve with changes in operations to
improve that performance. Ideally, these actions would also drive improvement in external performance
measures.
Internal performance measurement has been addressed in each of the other chapters of this report.
This chapter presents external performance measurements that have been developed using 2012
American Water Works Association Benchmarking Study – Performance Indicators of Water and
Wastewater Utilities: Survey Data and Analyses Report (2012 AWWA Benchmarking Report).
A. Organization Best Practices 1
The 2012 AWWA Benchmarking Report includes a section on Organizational Best Practices.
Schumaker & Company used this metric to provide an overall DPU assessment.
According to the AWWA, this metric summarizes the integration of eleven specific utility management
practices. A self-scoring system is used to assign between 1 and 5 points for each practice, resulting in
an aggregate score between 11 and 55. Points are assigned based on the following guidance:
This activity is fully implemented (5 points)

26 Draft Report – For Review and Verification Purposes Only
12/18/2014
This activity is largely implemented but there is room for improvement (4 points)
This activity is implemented but there is room for substantial improvement (3 points)
This activity is implemented, but only occasionally or without uniformity (2 points)
This activity is not currently practiced (1 point)
This type of self-assessment is necessarily subjective, and a single respondent may have only limited
knowledge to make a selection. However, a team composed of executive, managerial, and operations
personnel can provide a deeper and broader collective view and is likely to offer a truer assessment. For
this reason, an inclusive process involving all stakeholders is recommended when assessing an
organization’s performance in these areas.
The practices that comprise the Organizational Best Practices index are as follows:
l. Strategic Planning
Good strategic planning practice can include:
Analyses and selection of strategies for improvement in the areas of organizational
development, business operations, customer service, water operations and/or wastewater
operations
An assessment of the utility’s strengths, weaknesses, opportunities, and threats for the
upcoming 3 to 10 years
Short- and long-term action plans, including allocation of resources directed at achieving the
goals and strategies the utility has adopted
A process for strategic plan development and annual review or updates that facilitates input
from customers, employees, and other stakeholders
Vision, mission, and organizational values statements
2. Long-Term Financial Planning
Long-term financial plans include development of adequate rates, fees, and charges for costs associated
with operation and maintenance, asset management, capital improvements including renewal and
replacement, and justifiable reserves. Planning horizons typically range from 5 to 25 years.
3. Risk Management Planning
Risk management planning is used to identify potential risks to the utility within the context of its
strategic plan and for developing plans to mitigate physical and financial losses. Elements of risk
management planning include:
Draft Report – For Review and Verification Purposes Only 27
12/18/2014
Health and safety programs for employees and the general public
Security and resiliency of resources, facilities, and service delivery systems
Disaster readiness and emergency operations
Assessment and mitigation of potential public and environmental liability
Hazardous material contingency planning
Insurance procurement (or alternative self-insurance policies), including property and
casualty insurance, health and worker’s compensation insurance, and liability
insurance
4. Performance Measurement System
An effective performance measurement system will:
Provide measures focused on quality, efficiency, and effectiveness
Establish targets, usually in conjunction with the budgeting process, that reflect broad internal,
external, and financial improvement goals
Include regular monitoring and reporting
Support both routine work and special projects as done by staff or outside parties
Performance measurement systems beyond AWWA’s Utility Benchmarking Program include
the Kaplan and Norton balanced scorecard and the GASB performance measurement
framework. These tools offer additional approaches for organizing performance measurement.
5. Optimized Asset Management Program
An optimized asset management program strikes a balance between performance, risk, and
cost to support infrastructure renewal and replacement decisions. Such asset management
programs include:
A complete inventory of infrastructure assets and their locations in the system
Condition assessment for all asset classes
Replacement cycle estimates (i.e., typical life-spans) for each asset class
Estimates of asset maintenance and replacement costs
Risk rankings based on the impacts of specific asset failure

28 Draft Report – For Review and Verification Purposes Only
12/18/2014
6. Customer Involvement Program
A formal customer involvement program ensures customers participate effectively in the utility
management process. Examples of good practices include:
Offering consumer education programs and materials and assessing their
effectiveness
Conducting customer satisfaction surveys and responding to the results
Soliciting input on projects and programs under consideration, in planning, or under
construction
Efficiently resolving customer issues and complaints
7. Governing Body Transparency and Accountability
Accountability is an obligation or willingness to explain actions to stakeholders. Accountability means
holding individuals and organizations responsible for executing their powers properly (in accordance
with the rules and duties of their post), and for paying particular consideration to vulnerable parties.
Transparency is an obligation or willingness to publish and make available critical data about the
organization. Transparency involves clear public disclosure of information, rules, plans, processes, and
actions. It is the principle that public affairs need to be conducted in the open. Areas where
transparency is encouraged include financial management and financial record keeping.
8. Drought Response/Water Shortage Contingency Plan
From AWWA Manual of Water Supply Practices M60, Drought Preparedness and Response, a water
shortage contingency plan (WSCP) enables a supplier to assess the risks and reduce the vulnerability of a
community to drought impacts and establish priorities that will provide water for public health and
safety that minimize impacts on economic activity, environmental resources, and the region’s lifestyle.
There are seven steps to a WSCP:
Form a water shortage response team
Forecast supply in relation to demand
Balance supply and demand, and assess mitigation options
Establish triggering levels
Develop a staged demand reduction program
Adopt the plan
Implement the plan
Draft Report – For Review and Verification Purposes Only 29
12/18/2014
9. Source Water Protection Plan
From ANSIJAWWA Standard G300, Source Water Protection, a Source Water Protection Plan (SWPP)
is a highly site-specific process that must account for local conditions, incorporate diverse stakeholder
interests, require commitment to the source water protection process by all involved parties, and be
sustainable over the long term. There are six essential steps in the SWPP:
19. Formalize a vision to align priorities and resources
20. Characterize the source water and the land or subsurface area from which the source water is
derived
21. Set goals and objectives to resolve problems identified in the characterization of source water
22. Develop an action plan to map the activities to achieve the goals and objectives
23. Implement the action plan
24. Evaluate the results of implementing the action plan and make revisions to steps 1 through 4 as
necessary
10. Succession Planning
Identify key roles for succession or replacement
Define the competencies required to undertake those roles
Assess people against these criteria
Identify pools of talent that could potentially fill and perform highly in key roles
Develop employees to be ready for advancement into key roles
11. Continuous Improvement Program
A continuous improvement program helps employees examine their work practices with the goal of
identifying and implementing improvements to service quality, effectiveness, and efficiency. Good
practice includes examining the following improvement programs in addition to AWWA’s Utility
Benchmarking Program and participating in those aligned with the utility’s mission and goals.
AWWA’s Partnership for Safe Water
AWWA’s Utility Management Standards
Water Environment Federation’s (WEF’s) National Bio solids Partnership
ISO 9000 series
ISO 14001
Work process documentation programs
Self-assessment and peer or consultant reviews

30 Draft Report – For Review and Verification Purposes Only
12/18/2014
B. Findings and Conclusions
Finding III-1 DPU is in the bottom quartile with respect to Organizational Best
Practices.
Schumaker & Company’s assessment of DPU’s Organizational Best Practices is shown in
Exhibit III-1. The DPU scored low in many areas of the metrics resulting in a lower quartile
ranking when compared to other entities participating in the ranking, as shown in Exhibit III-2.
Exhibit III-1 Schumaker & Company Organizational Best Practices Assessment
as of December 31, 2014
Source: Schumaker & Company Assessment
Organizational Best Practices Score
1 Strategic Planning 3
2 Long-Term Financial Planning 3
3 Risk Management Planning 1
4 Performance Measurement Systems 2
5 Optimized Asset Management Program 1
6 Customer Involvement Program 3
7 Governing Body Transparency and Accountabliity 2
8 Drought Response/Water Shortage Contingency Plan 2
9 Source Water Protection Plan 2
10 Succession Planning 1
11 Continuous Improvement Program 1
Total 21

Draft Report – For Review and Verification Purposes Only 31
12/18/2014
Exhibit III-2 AWWA Aggregate Data for the Organization Best Practices Indicator
as of December 31, 2012
Source: 2012 AWWA Benchmarking Report
The DPU scored 21 points, whereas the bottom quartile combined operations bottom quartile was 35
points. There were many areas where the DPU could raise its score by initiating activities in areas where
it was only given a rating of 1.
Finding III-2 The DPU’s performance relative to other entities reporting in the AWWA
Benchmarking Report tends to be in the lower to mid quartile indicating
room for improvement.
The AWWA’s Utility Benchmarking Report uses performance indicators that are broadly
categorized into five areas of water and wastewater utility operations: organizational
development, business operations, customer service, water operations and wastewater operations. The
report identified and reported on over 60 different metrics. On this study, Schumaker & Company used
approximately 25 of those metrics to compare DPU’s performance to the reporting utilities. In some
cases, assumptions had to be made to develop somewhat comparable information and in some cases it
was not possible to develop the information in a similar format, because the information had not been
kept that way by the DPU. The following metrics have been developed.
System Renewal and Replacement
Return on Assets
Cash Reserves
Drinking Water Compliance
Distribution System Water Losses
Water Distribution System Integrity: Leaks and Breaks
Maintenance – Water
Water Supply
Sewer Overflow
Collection System Integrity
Wastewater Treatment Effectiveness
O&M Costs for Wastewater Services
Top
Quartile Median
Bottom
Quartile
Top
Quartile Median
Bottom
Quartile
Top
Quartile Median
Bottom
Quartile
44 39 34 40 30 26 45 41 35
Water Operations Wastewater Operations Combined Operations
Aggregate data for the organizational best practices indicator (1-5 self-assessed points in
each category; 55 points possible)

32 Draft Report – For Review and Verification Purposes Only
12/18/2014
Service Complaints
Water Service Disruptions
Wastewater Service Disruptions
Residential Cost of Service
Billing Accuracy
Service Affordability
System Renewal and Replacement
These indicators quantify the renewal and replacement activities into four broad asset
categories, specifically:
1. Water treatment and pumping facilities
2. Water pipelines and distribution
3. Wastewater pipelines and collection
4. Wastewater treatment and pumping facilities
In one sense, this indicator measures the extent to which the utility renews and replaces its aging
facilities to ensure current day and future availability – in essence, the more you invest in renews and
replacements, the better you are maintaining the system. The aggregate data for System Renewals and
Replacement are shown in Exhibit III-3. DPU was not able to provide the data by the four categories
identified above but more on a water treatment and distribution and wastewater collection and
treatment basis. However, the numbers estimated for the DPU were:
Water Treatment and Distribution – 14%
Wastewater Collection and Treatment – 6.7%
These numbers would place DPU in the top quartile. In a sense, it would be expected that with the
major construction taking place at the water treatment plant and the Toledo Waterways Initiative
spending, it is not too surprising.

Draft Report – For Review and Verification Purposes Only 33
12/18/2014
Exhibit III-3 AWWA System Renewal and Replacement
as of December 31, 2012
Source: 2012 AWWA Benchmarking Report
Top
Quartile Median
Bottom
Quartile
Top
Quartile Median
Bottom
Quartile
9.1% 1.4% 0.5% 3.7% 1.5% 0.8%
Top
Quartile Median
Bottom
Quartile
Top
Quartile Median
Bottom
Quartile
2.6% 1.2% 0.6% 4.1% 1.7% 0.6%
Top
Quartile Median
Bottom
Quartile
Top
Quartile Median
Bottom
Quartile
3.4% 1.9% 0.7%
Top
Quartile Median
Bottom
Quartile
Top
Quartile Median
Bottom
Quartile
6.4% 1.6% 0.3%
Aggregate data for the system renewal and replacement indicators
for water treatment and pumping facilities
Aggregate data for the system renewal and replacement indicators
for water pipelines and collection
Aggregate data for the system renewal and replacement indicators
for wastewater treatment and pumping facilities
Aggregate data for the system renewal and replacement indicators
for wastewater pipelines and collection
WasteWater Operations Combined Operations
Water Operations Combined Operations
Water Operations Combined Operations
WasteWater Operations Combined Operations

34 Draft Report – For Review and Verification Purposes Only
12/18/2014
Return on Assets
This indicator provides an estimate of the utility’s financial effectiveness. Investor-owned and
enterprise-fund utilities are particularly interested in this indicator seeking higher ratios where possible
and allowable. The aggregate data for the Return on Asset indicator by service is shown in Exhibit III-4.
Exhibit III-4
AWWA Return on Assets Indicator as of December 31, 2012
Source: 2012 AWWA Benchmarking Report
The comparable information for the DPU is:
Water Operations – 1.3%
Wastewater Operations – 3.1%
The number of wastewater utilities report this metric was relatively low (3). Therefore the metric reported
is based on a limited sample. However, the DPU is in the bottom quartile in the water operations area.
Cash Reserves
This indicator quantifies the number of days of available cash reserve as a measure of financial liquidity.
The aggregate data for the Cash Reserves indications is shown in Exhibit III-5.
Exhibit III-5 AWWA Cash Reserve Indicator
as of December 31, 2012
Source: 2012 AWWA Benchmarking Report
Top
Quartile Median
Bottom
Quartile
Top
Quartile Median
Bottom
Quartile
Top
Quartile Median
Bottom
Quartile
3.1% 2.2% 1.0% 0.6% 2.6% 1.7% 0.5%
Water Operations Wastewater Operations Combined Operations
Top
Quartile Median
Bottom
Quartile
Top
Quartile Median
Bottom
Quartile
Top
Quartile Median
Bottom
Quartile
474 265 159 555 391 225 118
Water Operations Wastewater Operations Combined Operations
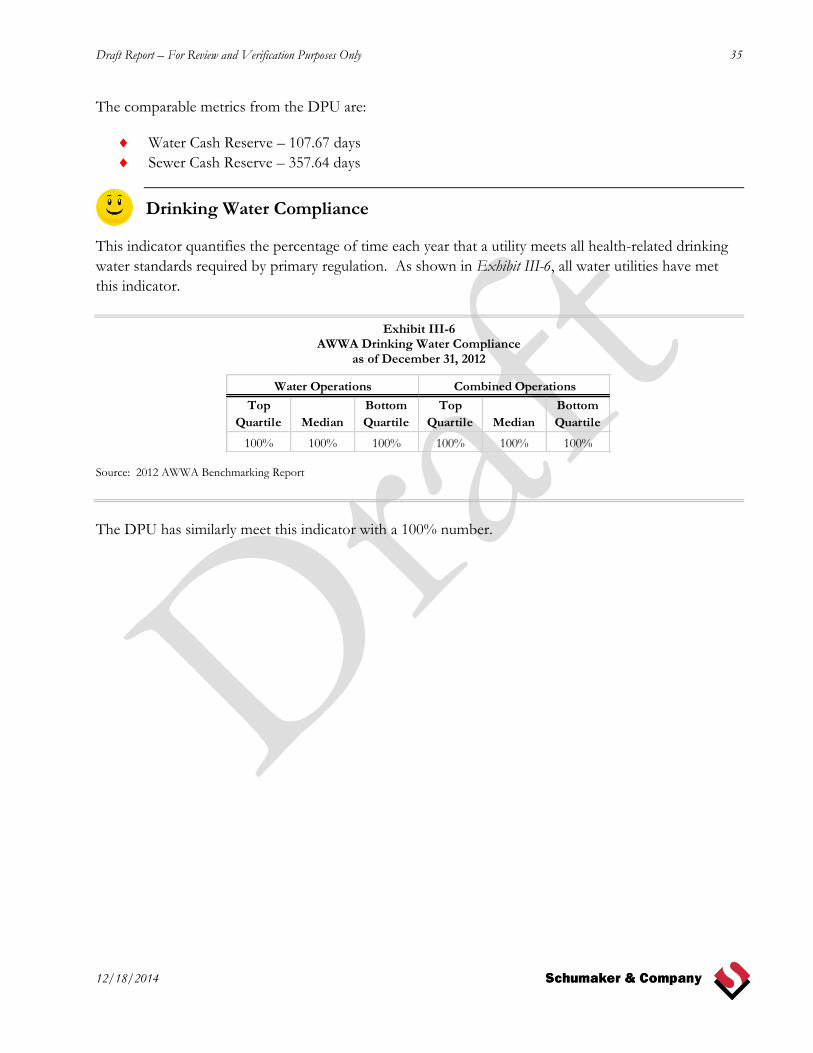
Draft Report – For Review and Verification Purposes Only 35
12/18/2014
The comparable metrics from the DPU are:
Water Cash Reserve – 107.67 days
Sewer Cash Reserve – 357.64 days
Drinking Water Compliance
This indicator quantifies the percentage of time each year that a utility meets all health-related drinking
water standards required by primary regulation. As shown in Exhibit III-6, all water utilities have met
this indicator.
Exhibit III-6 AWWA Drinking Water Compliance
as of December 31, 2012
Source: 2012 AWWA Benchmarking Report
The DPU has similarly meet this indicator with a 100% number.
Top
Quartile Median
Bottom
Quartile
Top
Quartile Median
Bottom
Quartile
100% 100% 100% 100% 100% 100%
Water Operations Combined Operations

36 Draft Report – For Review and Verification Purposes Only
12/18/2014
Distribution System Water Losses
This indicator quantifies the percentage of water that fails to reach customers and cannot otherwise be
accounted for through authorized consumption. The other utilities' distribution water losses are shown
in Exhibit III-7.
Exhibit III-7 AWWA Distribution Water system Loss
as of December 31, 2012
Source: 2012 AWWA Benchmarking Report
The DPU’s water loss (Real Loss) calculation of 20.09% places it in the bottom quartile.
Water Distribution System Integrity: Leaks and Breaks
These indicators quantify the condition of a water distribution system, expressed as an annual number
of leaks or breaks per 100 miles of distribution piping. These numbers from the reporting utilities are
shown in Exhibit III-8. The DPU does not differentiate between breaks and leaks. The DPU number is
33.1 breaks and leaks/100 miles. Thus if you assume that the number is all leaks or that the number is
all breaks, in either case the DPU is in the bottom quartile.
Top
Quartile Median
Bottom
Quartile
Top
Quartile Median
Bottom
Quartile
0.2% 2.2% 4.8% 3.2% 7.4% 12.9%
Top
Quartile Median
Bottom
Quartile
Top
Quartile Median
Bottom
Quartile
1.0% 5.9% 9.5% 2.5% 5.0% 13.8%
Water Operations Combined Operations
Water Operations Combined Operations
Aggregate data for the distribution system water loss indicators -
Real Loss

Draft Report – For Review and Verification Purposes Only 37
12/18/2014
Exhibit III-8 AWWA Water System Integrity Indicators
as of December 31, 2012
Source: 2012 AWWA Benchmarking Report
Top
Quartile Median
Bottom
Quartile
Top
Quartile Median
Bottom
Quartile
2 16 28 9 25 63
Top
Quartile Median
Bottom
Quartile
Top
Quartile Median
Bottom
Quartile
6 14 20 3 11 23
Water Operations Combined Operations
Water Operations Combined Operations
Aggregate data for the water distribution system integrity
indicators (leaks/100 miles of pipe)
Aggregate data for the water distribution system integrity
indicators (breaks/100 miles of pipe)

38 Draft Report – For Review and Verification Purposes Only
12/18/2014
Maintenance – Water
These indicators quantify a utility’s effort regarding planned (proactive) and corrective (reactive)
maintenance. The metrics are divided into water production and water distribution. The reporting
utility numbers are shown in Exhibit III-9.
Exhibit III-9 AWWA Maintenance Water
as of December 31, 2012
Source: 2012 AWWA Benchmarking Report
Top
Quartile Median
Bottom
Quartile
Top
Quartile Median
Bottom
Quartile
75% 55% 42% 70% 48% 29%
Top
Quartile Median
Bottom
Quartile
Top
Quartile Median
Bottom
Quartile
0.1 1.1 2.4 0.6 1.3 2.4
Top
Quartile Median
Bottom
Quartile
Top
Quartile Median
Bottom
Quartile
1.5 0.8 0.2 1.8 0.9 0.4
Top
Quartile Median
Bottom
Quartile
Top
Quartile Median
Bottom
Quartile
114 930 3,052 545 996 2,112
Top
Quartile Median
Bottom
Quartile
Top
Quartile Median
Bottom
Quartile
3,070 595 124 1,900 895 604
Aggregate data for maintenance - Planned maintenance
Aggregate data for the maintenance - Corrective maintenance to
production (hours/MG)
Aggregate data for the maintenance - Planned maintenance to
production (hours/MG)
Aggregate data for the maintenance - Corrective maintenance to
distribution (hours/100 mile of pipe)
Aggregate data for the maintenance - Planned maintenance to
distribution (hours/100 miles of pipe)
Water Operations Combined Operations
Water Operations Combined Operations
Water Operations Combined Operations
Water Operations Combined Operations
Water Operations Combined Operations

Draft Report – For Review and Verification Purposes Only 39
12/18/2014
The DPU distribution numbers are:
Corrective Maintenance to Distribution – 773 hours/100 miles of pipe
Planned Maintenance – 684 hours/100 miles of pipe
These numbers place the DPU near the median of the reporting utilities with a significant improvement
potential with respect to planned maintenance to reach the top quartile.
With respect to water treatment (production), the numbers had to be estimated due to the lack of a
computerized maintenance management system at the water treatment plant. These number were
estimated at:
Corrective Maintenance to Production – 1.86 hours/MG
Planned Maintenance – 1.24 hours/MG
These estimated numbers place the DPU at or below the median of the reporting utilities.
Water Supply
This indicator provides a gauge of water resources, including an assessment of current water demand
compared to supplies and an estimate of future requirements. The DPU excels in this area in that the
water supply is Lake Erie – notwithstanding algae bloom considerations.
Sewer Overflow
This indicator measures the total number of sewer overflow events expressed as the ratio of the number
of events per 100 miles of sanitary collection system piping. The aggregate data for the sewer overflow
indicator for the reporting utilities is shown in Exhibit III-10.
Exhibit III-10 AWWA Sewer Overflow Indicator
as of December 31, 2012
Source: 2012 AWWA Benchmarking Report
The DPU number is 3.709, which places DPU close to the bottom quartile.
Top
Quartile Median
Bottom
Quartile
Top
Quartile Median
Bottom
Quartile
0.7 2.2 3.3 0.9 2.7 6.7
Water Operations Combined Operations

40 Draft Report – For Review and Verification Purposes Only
12/18/2014
Collection System Integrity
This indicator quantifies the condition of a wastewater collection system, expressed as the annual
number of failures per 100 miles of collection system piping. The data reported by the utilities is shown
in Exhibit III-11.
Exhibit III-11 AWWA Collection System Integrity Indicator
as of December 31, 2012
Source: 2012 AWWA Benchmarking Report
In that the DPU number is 59 that places DPU well below the bottom quartile.
Wastewater Treatment Effectiveness
Wastewater treatment effectiveness is expressed as the percentage of days during which the utility meets
or exceeds all of the effluent quality standards in effect at a facility. The data reported by the utilities is
shown in Exhibit III-12.
Exhibit III-12 AWWA Wastewater Treatment Effectiveness
as of December 31, 2012
Source: 2012 AWWA Benchmarking Report
The DPU number is 99.73%, placing the DPU near the bottom quartile.
O&M Costs for Wastewater Services
The operations and maintenance (O&M) costs for wastewater services can be compared between utilities
once normalized by production rate to give a unit cost ($/MG) or on a basis of the accounts served or the
length of the collection pipe network. The data reported by the utilities is shown in Exhibit III-13.
Top
Quartile Median
Bottom
Quartile
Top
Quartile Median
Bottom
Quartile
0.7 2.2 3.3 0.9 2.7 6.7
Water Operations Combined Operations
Top
Quartile Median
Bottom
Quartile
Top
Quartile Median
Bottom
Quartile
100.00% 98.08% 96.99% 100.00% 100.00% 99.73%
Water Operations Combined Operations

Draft Report – For Review and Verification Purposes Only 41
12/18/2014
Exhibit III-13 AWWA O&M Costs for Wastewater Services
as of December 31, 2012
Source: 2012 AWWA Benchmarking Report
The DPU’s numbers are:
O&M Cost of Wastewater – $295.75/account
O&M Cost for Wastewater Service – Collection per Customer - $72.67
Total O&M Cost for Wastewater = $295.75 + $72.67 = $368.42/account
O&M Cost of Wastewater Services – $1,711.97 /MG
O&M Cost of Wastewater Service – Per 100 miles of pipe - $900,495
This places DPU near the median to the top quartile in all categories.
Maintenance – Wastewater
These indicators quantify a utility’s efforts regarding planned (proactive) and corrective (reactive)
maintenance.
Top
Quartile Median
Bottom
Quartile
Top
Quartile Median
Bottom
Quartile
$166 $227 $272 $250 $373 $463
Top
Quartile Median
Bottom
Quartile
Top
Quartile Median
Bottom
Quartile
$2,399 $2,056 $3,122 $4,259
Top
Quartile Median
Bottom
Quartile
Top
Quartile Median
Bottom
Quartile
$1,396,453 $1,763,789 $2,479,952 $1,573,765 $2,143,610 $3,109,259
Aggregate data for the O&M cost of wastewater services
indicators ($/account)
Aggregate data for the O&M cost of wastewater services
indicators ($/MG)
Aggregate data for the O&M cost of wastewater services
indicators ($/100 miles of pipe)
Wastewater Operations Combined Operations
Wastewater Operations Combined Operations
Wastewater Operations Combined Operations

42 Draft Report – For Review and Verification Purposes Only
12/18/2014
Exhibit III-14 AWWA Maintenance - Wastewater
as of December 31, 2012
Source: 2012 AWWA Benchmarking Report
The DPU’s numbers are:
Planned Maintenance to Wastewater – 71%
Planned Maintenance to Collection – 86%
Corrective Maintenance to Wastewater – 0.54 hr/MG
Planned Maintenance to Wastewater – 1.3 hr/MG
Corrective Maintenance to Collection – 326 hours/100 mile of pipe1
1 / documentation reported 3.26 but on review it should be 326
Top
Quartile Median
Bottom
Quartile
Top
Quartile Median
Bottom
Quartile
73% 83% 95% 51% 62% 82%
Top
Quartile Median
Bottom
Quartile
Top
Quartile Median
Bottom
Quartile
0.2 0.5 0.8 0.6 1.7 3.7
Top
Quartile Median
Bottom
Quartile
Top
Quartile Median
Bottom
Quartile
1.9 1.6 1.3 4.6 2.0 0.9
Top
Quartile Median
Bottom
Quartile
Top
Quartile Median
Bottom
Quartile
181 361 808 401 996 2,546
Top
Quartile Median
Bottom
Quartile
Top
Quartile Median
Bottom
Quartile
2,487 2,141 1,751 4,854 1,882 810
Aggregate data for the maintenance - Planned maintenance
Aggregate data for the maintenance - Corrective
maintenance to wastewater processed (hours/MG)
Aggregate data for the maintenance - Planned maintenance
to wastewater processed (hours/MG)
Aggregate data for the maintenance - Corrective
maintenance to collection (hours/100 miles of pipe)
Aggregate data for the maintenance - wastewater indicators -
Planned maintenance to collection (hours/100 miles of pipe)
Wastewater Operations Combined Operations
Wastewater Operations Combined Operations
Wastewater Operations Combined Operations
Wastewater Operations Combined Operations
Wastewater Operations Combined Operations
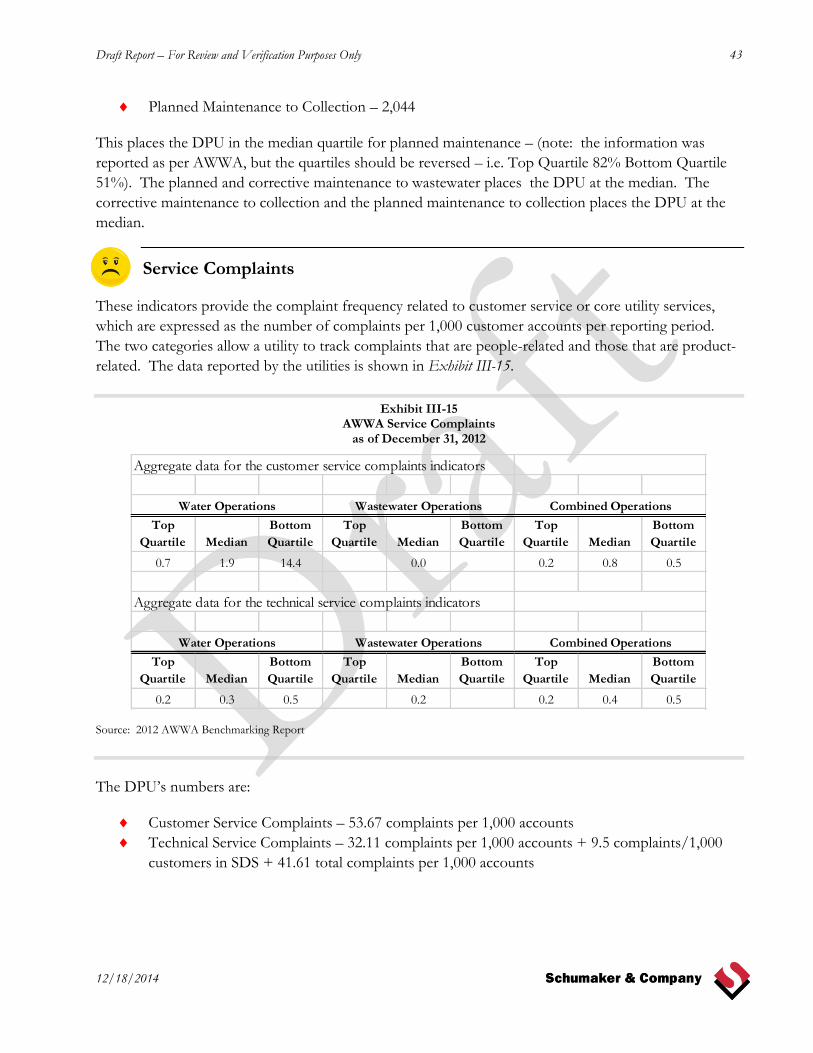
Draft Report – For Review and Verification Purposes Only 43
12/18/2014
Planned Maintenance to Collection – 2,044
This places the DPU in the median quartile for planned maintenance – (note: the information was
reported as per AWWA, but the quartiles should be reversed – i.e. Top Quartile 82% Bottom Quartile
51%). The planned and corrective maintenance to wastewater places the DPU at the median. The
corrective maintenance to collection and the planned maintenance to collection places the DPU at the
median.
Service Complaints
These indicators provide the complaint frequency related to customer service or core utility services,
which are expressed as the number of complaints per 1,000 customer accounts per reporting period.
The two categories allow a utility to track complaints that are people-related and those that are product-
related. The data reported by the utilities is shown in Exhibit III-15.
Exhibit III-15 AWWA Service Complaints
as of December 31, 2012
Source: 2012 AWWA Benchmarking Report
The DPU’s numbers are:
Customer Service Complaints – 53.67 complaints per 1,000 accounts
Technical Service Complaints – 32.11 complaints per 1,000 accounts + 9.5 complaints/1,000
customers in SDS + 41.61 total complaints per 1,000 accounts
Top
Quartile Median
Bottom
Quartile
Top
Quartile Median
Bottom
Quartile
Top
Quartile Median
Bottom
Quartile
0.7 1.9 14.4 0.0 0.2 0.8 0.5
Top
Quartile Median
Bottom
Quartile
Top
Quartile Median
Bottom
Quartile
Top
Quartile Median
Bottom
Quartile
0.2 0.3 0.5 0.2 0.2 0.4 0.5
Aggregate data for the customer service complaints indicators
Aggregate data for the technical service complaints indicators
Water Operations Wastewater Operations Combined Operations
Water Operations Wastewater Operations Combined Operations
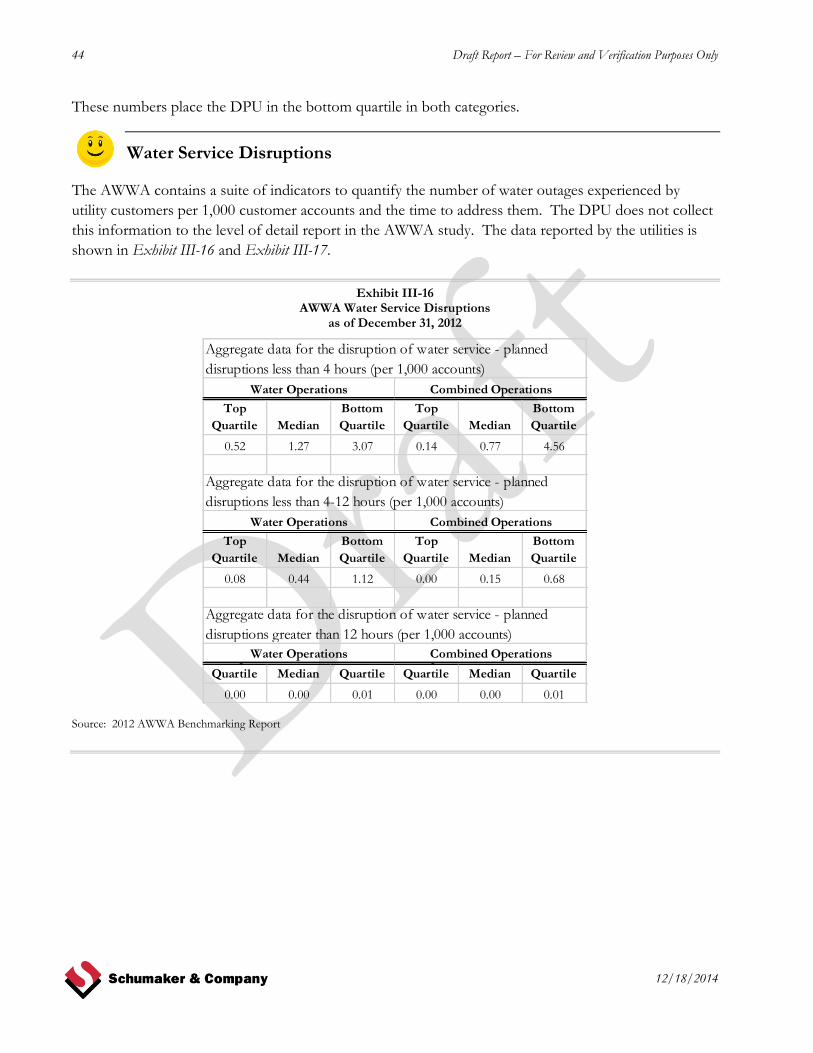
44 Draft Report – For Review and Verification Purposes Only
12/18/2014
These numbers place the DPU in the bottom quartile in both categories.
Water Service Disruptions
The AWWA contains a suite of indicators to quantify the number of water outages experienced by
utility customers per 1,000 customer accounts and the time to address them. The DPU does not collect
this information to the level of detail report in the AWWA study. The data reported by the utilities is
shown in Exhibit III-16 and Exhibit III-17.
Exhibit III-16 AWWA Water Service Disruptions
as of December 31, 2012
Source: 2012 AWWA Benchmarking Report
Top
Quartile Median
Bottom
Quartile
Top
Quartile Median
Bottom
Quartile
0.52 1.27 3.07 0.14 0.77 4.56
Top
Quartile Median
Bottom
Quartile
Top
Quartile Median
Bottom
Quartile
0.08 0.44 1.12 0.00 0.15 0.68
Top
Quartile Median
Bottom
Quartile
Top
Quartile Median
Bottom
Quartile
0.00 0.00 0.01 0.00 0.00 0.01
Aggregate data for the disruption of water service - planned
disruptions less than 4 hours (per 1,000 accounts)
Aggregate data for the disruption of water service - planned
disruptions less than 4-12 hours (per 1,000 accounts)
Water Operations Combined Operations
Water Operations Combined Operations
Water Operations Combined Operations
Aggregate data for the disruption of water service - planned
disruptions greater than 12 hours (per 1,000 accounts)

Draft Report – For Review and Verification Purposes Only 45
12/18/2014
Exhibit III-17 AWWA Restoration Time as of December 31, 2012
Source: 2012 AWWA Benchmarking Report
The DPU’s numbers are
Water Service Disruptions – 1.312 per 1,000 customers
Restoration Time – 2 hours
Top
Quartile Median
Bottom
Quartile
Top
Quartile Median
Bottom
Quartile
3.00 7.90 21.30 2.00 5.00 20.00
Top
Quartile Median
Bottom
Quartile
Top
Quartile Median
Bottom
Quartile
0.38 2.23 3.90 0.00 0.75 3.39
Top
Quartile Median
Bottom
Quartile
Top
Quartile Median
Bottom
Quartile
0.18 0.75 1.57 0.00 0.09 0.59
Top
Quartile Median
Bottom
Quartile
Top
Quartile Median
Bottom
Quartile
0.00 0.01 0.08 0.00 0.00 0.01
Top
Quartile Median
Bottom
Quartile
Top
Quartile Median
Bottom
Quartile
5.40 9.70 34.40 0.00 5.00 18.80
Aggregate data for the disruption of water service - Average time
to address planned disruptions (hours)
Water Operations Combined Operations
Water Operations Combined Operations
Water Operations Combined Operations
Water Operations Combined Operations
Water Operations Combined Operations
Aggregate data for the disruption of water service - unplanned
disruptions less than 4 hours (per 1,000 accounts)
Aggregate data for the disruption of water service - unplanned
disruptions 4-12 hours (per 1,000 accounts)
Aggregate data for the disruption of water service - planned
disruptions greater than 12 hours (per 1,000 accounts)
Aggregate data for the disruption of water service - Average time
to address unplanned disruptions (hours)

46 Draft Report – For Review and Verification Purposes Only
12/18/2014
These numbers place the DPU near the median for Water Service Disruptions, although in the top
quartile for Restoration Time.
Wastewater Service Disruptions
The AWWA contains a suite of indicators to quantify the number of wastewater outages experienced by
utility customers per 1,000 customer accounts and the time to address them. The DPU does not collect
this information to the level of detail report in the AWWA study. The data reported by the utilities is
shown in Exhibit III-18 and Exhibit III-19.
Exhibit III-18 AWWA Wastewater Service Disruptions
as of December 31, 2012
Source: 2012 AWWA Benchmarking Report
Top
Quartile Median
Bottom
Quartile
Top
Quartile Median
Bottom
Quartile
0.00 0.00 0.00 0.00 0.00 0.00
Top
Quartile Median
Bottom
Quartile
Top
Quartile Median
Bottom
Quartile
0.00 0.00 0.00 0.00 0.00 0.00
Top
Quartile Median
Bottom
Quartile
Top
Quartile Median
Bottom
Quartile
0.00 0.00 0.00 0.00 0.00 0.00
Aggregate data for the disruption of sewer service - planned
disruptions less than 4 hours (disruptions per 1,000 accounts)
Aggregate data for the disruption of sewer service - planned
Aggregate data for the disruption of sewer service - planned
disruptions greater than 12 hours (disruptions per 1,000 accounts)
Wastewater Operations Combined Operations
Wastewater Operations Combined Operations
Wastewater Operations Combined Operations
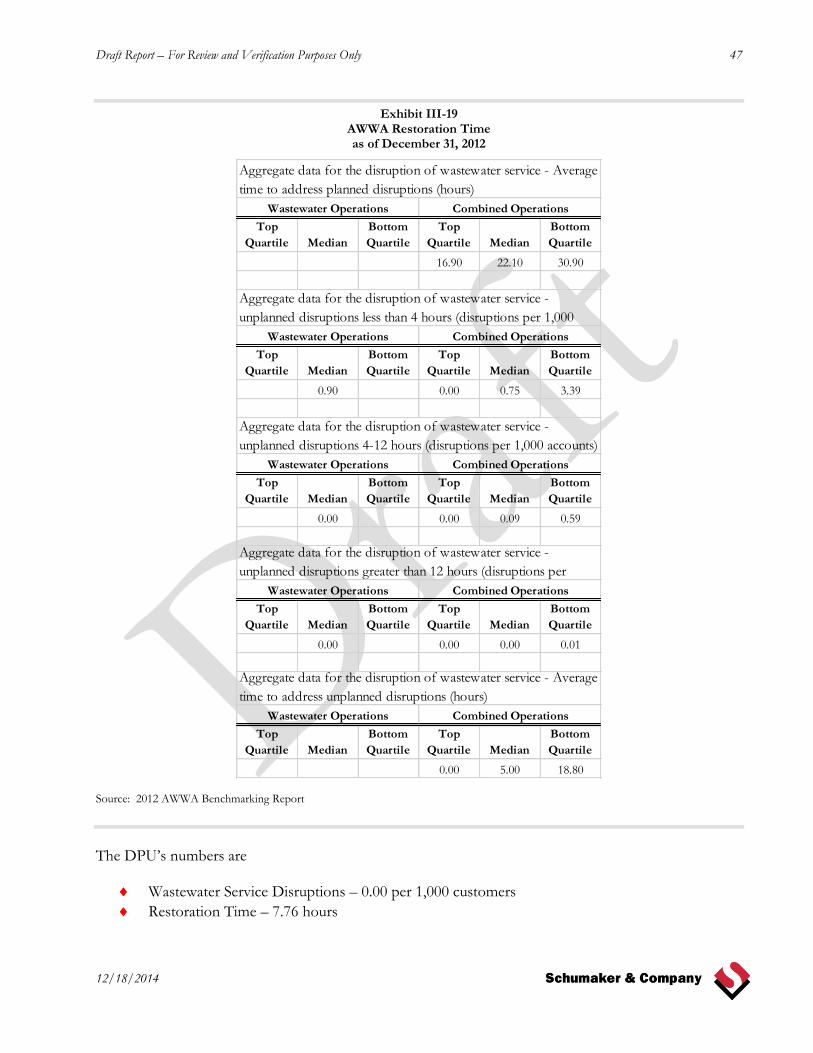
Draft Report – For Review and Verification Purposes Only 47
12/18/2014
Exhibit III-19 AWWA Restoration Time as of December 31, 2012
Source: 2012 AWWA Benchmarking Report
The DPU’s numbers are
Wastewater Service Disruptions – 0.00 per 1,000 customers
Restoration Time – 7.76 hours
Top
Quartile Median
Bottom
Quartile
Top
Quartile Median
Bottom
Quartile
16.90 22.10 30.90
Top
Quartile Median
Bottom
Quartile
Top
Quartile Median
Bottom
Quartile
0.90 0.00 0.75 3.39
Top
Quartile Median
Bottom
Quartile
Top
Quartile Median
Bottom
Quartile
0.00 0.00 0.09 0.59
Top
Quartile Median
Bottom
Quartile
Top
Quartile Median
Bottom
Quartile
0.00 0.00 0.00 0.01
Top
Quartile Median
Bottom
Quartile
Top
Quartile Median
Bottom
Quartile
0.00 5.00 18.80
Aggregate data for the disruption of wastewater service - Average
time to address planned disruptions (hours)
Aggregate data for the disruption of wastewater service -
unplanned disruptions less than 4 hours (disruptions per 1,000
Wastewater Operations Combined Operations
Wastewater Operations Combined Operations
Wastewater Operations Combined Operations
Wastewater Operations Combined Operations
Wastewater Operations Combined Operations
Aggregate data for the disruption of wastewater service -
unplanned disruptions 4-12 hours (disruptions per 1,000 accounts)
Aggregate data for the disruption of wastewater service -
unplanned disruptions greater than 12 hours (disruptions per
Aggregate data for the disruption of wastewater service - Average
time to address unplanned disruptions (hours)
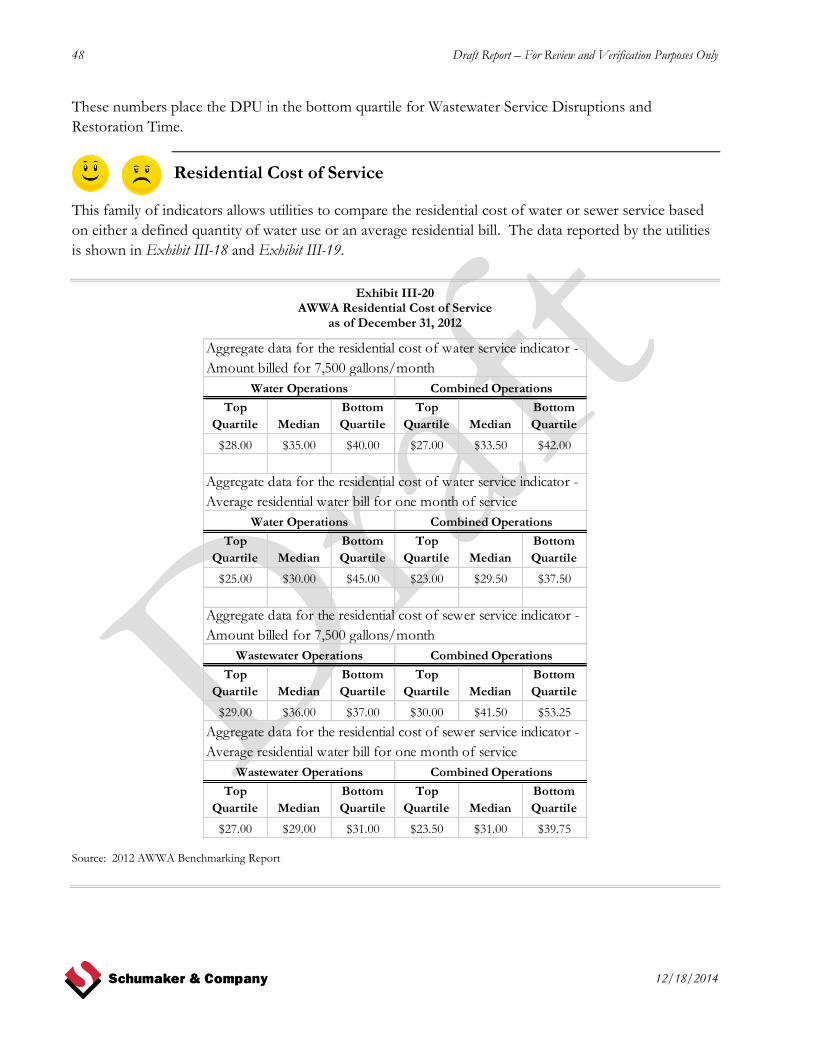
48 Draft Report – For Review and Verification Purposes Only
12/18/2014
These numbers place the DPU in the bottom quartile for Wastewater Service Disruptions and
Restoration Time.
Residential Cost of Service
This family of indicators allows utilities to compare the residential cost of water or sewer service based
on either a defined quantity of water use or an average residential bill. The data reported by the utilities
is shown in Exhibit III-18 and Exhibit III-19.
Exhibit III-20 AWWA Residential Cost of Service
as of December 31, 2012
Source: 2012 AWWA Benchmarking Report
Top
Quartile Median
Bottom
Quartile
Top
Quartile Median
Bottom
Quartile
$28.00 $35.00 $40.00 $27.00 $33.50 $42.00
Top
Quartile Median
Bottom
Quartile
Top
Quartile Median
Bottom
Quartile
$25.00 $30.00 $45.00 $23.00 $29.50 $37.50
Top
Quartile Median
Bottom
Quartile
Top
Quartile Median
Bottom
Quartile
$29.00 $36.00 $37.00 $30.00 $41.50 $53.25
Top
Quartile Median
Bottom
Quartile
Top
Quartile Median
Bottom
Quartile
$27.00 $29.00 $31.00 $23.50 $31.00 $39.75
Aggregate data for the residential cost of water service indicator -
Amount billed for 7,500 gallons/month
Aggregate data for the residential cost of water service indicator -
Average residential water bill for one month of service
Aggregate data for the residential cost of sewer service indicator -
Amount billed for 7,500 gallons/month
Wastewater Operations Combined Operations
Wastewater Operations Combined Operations
Water Operations Combined Operations
Water Operations Combined Operations
Aggregate data for the residential cost of sewer service indicator -
Average residential water bill for one month of service
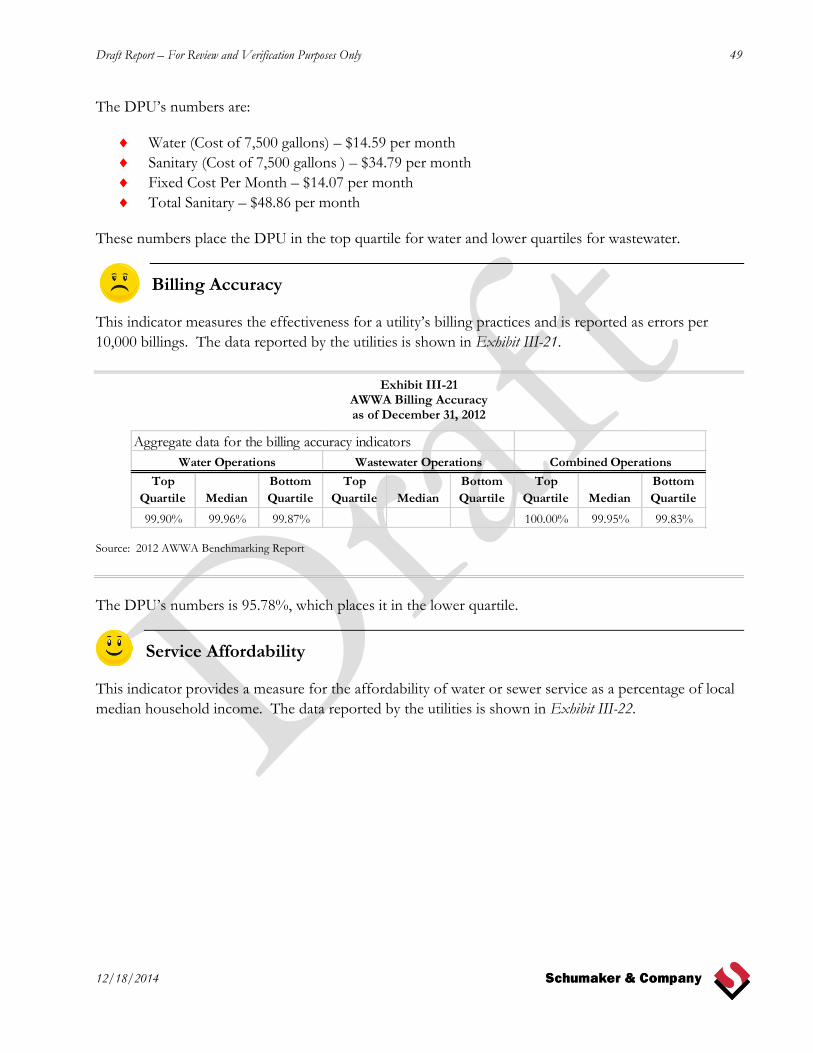
Draft Report – For Review and Verification Purposes Only 49
12/18/2014
The DPU’s numbers are:
Water (Cost of 7,500 gallons) – $14.59 per month
Sanitary (Cost of 7,500 gallons ) – $34.79 per month
Fixed Cost Per Month – $14.07 per month
Total Sanitary – $48.86 per month
These numbers place the DPU in the top quartile for water and lower quartiles for wastewater.
Billing Accuracy
This indicator measures the effectiveness for a utility’s billing practices and is reported as errors per
10,000 billings. The data reported by the utilities is shown in Exhibit III-21.
Exhibit III-21 AWWA Billing Accuracy as of December 31, 2012
Source: 2012 AWWA Benchmarking Report
The DPU’s numbers is 95.78%, which places it in the lower quartile.
Service Affordability
This indicator provides a measure for the affordability of water or sewer service as a percentage of local
median household income. The data reported by the utilities is shown in Exhibit III-22.
Top
Quartile Median
Bottom
Quartile
Top
Quartile Median
Bottom
Quartile
Top
Quartile Median
Bottom
Quartile
99.90% 99.96% 99.87% 100.00% 99.95% 99.83%
Water Operations Wastewater Operations Combined Operations
Aggregate data for the billing accuracy indicators
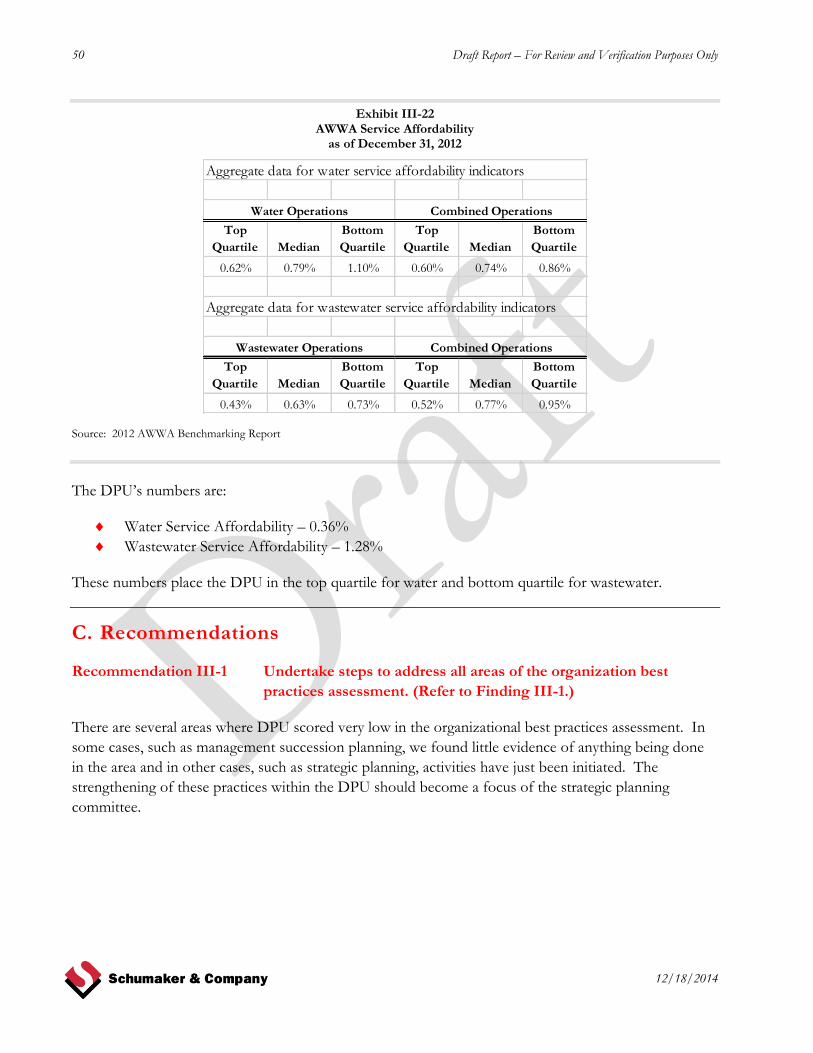
50 Draft Report – For Review and Verification Purposes Only
12/18/2014
Exhibit III-22 AWWA Service Affordability
as of December 31, 2012
Source: 2012 AWWA Benchmarking Report
The DPU’s numbers are:
Water Service Affordability – 0.36%
Wastewater Service Affordability – 1.28%
These numbers place the DPU in the top quartile for water and bottom quartile for wastewater.
C. Recommendations
Recommendation III-1 Undertake steps to address all areas of the organization best
practices assessment. (Refer to Finding III-1.)
There are several areas where DPU scored very low in the organizational best practices assessment. In
some cases, such as management succession planning, we found little evidence of anything being done
in the area and in other cases, such as strategic planning, activities have just been initiated. The
strengthening of these practices within the DPU should become a focus of the strategic planning
committee.
Aggregate data for water service affordability indicators
Top
Quartile Median
Bottom
Quartile
Top
Quartile Median
Bottom
Quartile
0.62% 0.79% 1.10% 0.60% 0.74% 0.86%
Aggregate data for wastewater service affordability indicators
Top
Quartile Median
Bottom
Quartile
Top
Quartile Median
Bottom
Quartile
0.43% 0.63% 0.73% 0.52% 0.77% 0.95%
Water Operations Combined Operations
Wastewater Operations Combined Operations

Draft Report – For Review and Verification Purposes Only 51
12/18/2014
Recommendation III-2 Undertake steps to address all of the areas of bottom quartile
performance to move the DPU to a top quartile performer. (Refer
to Finding III-2.)
A major focus of the strategic planning committee should be to insure that steps are taken to address all
of the lower quartile areas identified in this benchmarking process, so as to improve the DPU’s
performance and move it to a top quartile performer. Specific plans should be developed for each area
identified in this report chapter.
Additionally the DPU should also include the following:
Updating the above performance indicators by comparing these results to the indicators being
reported in the 2013 American Water Works Association Benchmarking Study – Performance
Indicators of Water and Wastewater Utilities: Survey Data and Analyses Report. – The DPU
information reported above is 2013 information whereas the AWWA information is 2012
information. The 2013 AWWA information is scheduled to be out in February 2015.
Therefore, it should be obtained and the above results compared to the newer information.
Participating in the next several AWWA benchmarking surveys as a part of the ongoing
strategic planning effort.

Draft Report – For Review and Verification Purposes Only 53
12/18/2014
IV. Administrative Services
The Administrative Services (AS) organization provides the primary administrative, fiscal, and
operational control functions for the Toledo Department of Public Utilities (DPU). It consists of the
following sections: Administration, Accounting & Financial Analysis (Accounting & Float Pool,
Financial Analysis, and DPU/SAP Support), and Utilities Administration (Customer Service, Billing &
Records, and Legal).2 It provides services to approximately 131,000 customers estimated to represent
over 500,000 people. Its service area includes Toledo, Maumee, Perrysburg, Sylvania, Monroe County,
Lucas County, Rossford, Wood County, Fulton County, and Northwood.3
A. Background & Perspective
Organization
The Administrative Services organization within the Toledo Department of Public Utilities is shown in
Exhibit IV-1.4
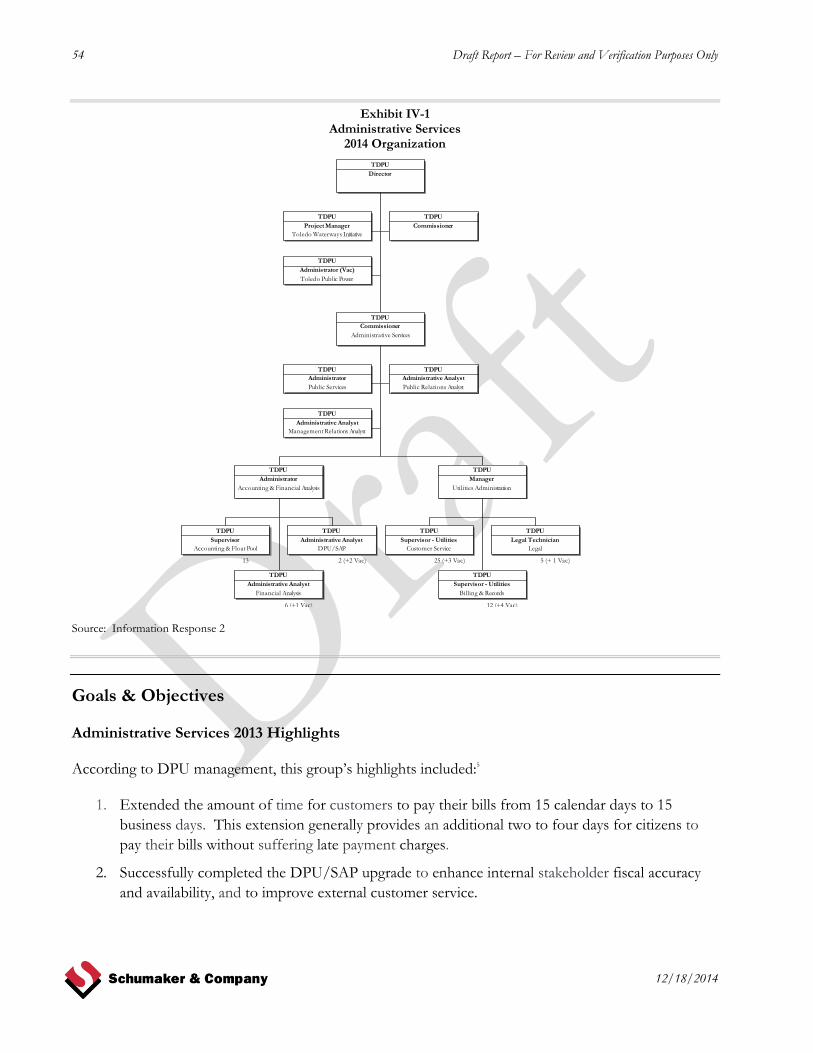
54 Draft Report – For Review and Verification Purposes Only
12/18/2014
Exhibit IV-1 Administrative Services
2014 Organization
Source: Information Response 2
Goals & Objectives
Administrative Services 2013 Highlights
According to DPU management, this group’s highlights included:5
1. Extended the amount of time for customers to pay their bills from 15 calendar days to 15
business days. This extension generally provides an additional two to four days for citizens to
pay their bills without suffering late payment charges.
2. Successfully completed the DPU/SAP upgrade to enhance internal stakeholder fiscal accuracy
and availability, and to improve external customer service.
TDPU
Director
TDPU
Project Manager
Toledo Waterways Initiative
TDPU
Commissioner
TDPU
Administrator (Vac)
Toledo Public Power
TDPU
Commissioner
Administrative Services
TDPU
Administrator
Public Services
TDPU
Administrative Analyst
Public Relations Analyst
TDPU
Administrative Analyst
Management Relations Analyst
TDPU
Administrator
Accounting & Financial Analysis
13
TDPU
Supervisor
Accounting & Float Pool
6 (+1 Vac)
TDPU
Administrative Analyst
Financial Analysis
2 (+2 Vac)
TDPU
Administrative Analyst
DPU/SAP
TDPU
Manager
Utilities Administration
25 (+3 Vac)
TDPU
Supervisor - Utilities
Customer Service
12 (+4 Vac)
TDPU
Supervisor - Utilities
Billing & Records
5 (+ 1 Vac)
TDPU
Legal Technician
Legal
Draft Report – For Review and Verification Purposes Only 55
12/18/2014
a. Continued to implement best business practices from the Benchmarking initiative into the
DPU/SAP Customer Billing and Information System.
b. Increased notification time of overdue account reminder notices sent to customers’ tenants
to give them 30 days’ notice prior to disconnection.
3. Extended the DPU Call Center’s hours by 1 ½ hours per day to improve customer service by
adding one hour in the morning (7:00 a.m. to 8:00 a.m.) and one-half hour in the evening (5:30
p.m. to 6:00 p.m.).
4. Increased the number of occasions in which there were zero calls in Customer Service’s call line
queue and reduced overall wait time by almost 41% from 2011 to 2013 year-to-date (YTD).
After that point, hired an additional four Customer Service Representatives to even further
reduce customer wait times.
5. Established a “Continuous Improvement Process” for all sections to enhance communication
among employees in order to streamline operations and improve customer service.
6. Hired a Water Loss Investigator in the effort to increase revenue and to reduce the number of
incidents and the magnitude of theft of utility services.
7. Created the DPU Customer Advisory Committee, made up of private sector business leaders
and other stakeholders, to advise DPU regarding how to improve communication with and
customer service to business and rental property owner communities. This initiative also
followed the results of Benchmarking efforts.
8. Hosted the Ohio American Water Works Association’s 2013 Annual Conference to much
acclaim from the 527 delegates who paid to attend.
9. Issued over $190 million in water bonds (including a refunding of the 2005 Series Bonds) to
continue to design and construct the needed major improvements for the water treatment and
distribution systems.
10. Refunded $13.6 million in 2003 Series Sewer Bonds to obtain lower debt service payments.
11. Received Toledo City Council’s approval to enact a new Section 100.04 in Appendix C entitled
“Customer Bill of Rights & Responsibilities.”
12. Purchased and installed hardware and software to digitally process and transmit checks to the
bank.
13. Began to implement the hardware and design the software to accommodate the online billing
initiative. Implementation is scheduled for 2014.
14. Hired a Safety & Training Program Coordinator to prioritize employee safety and training across
DPU.
15. Began to serve its first industrial customer, OmniSource, enabling this local firm to save on its
energy bills and thus expand its operations on N. Detroit Avenue.
56 Draft Report – For Review and Verification Purposes Only
12/18/2014
Administrative Services 2014 Goals
This group’s 2014 goals included:6
1. Consistently endeavor to decrease customers’ waiting time in the telephone call queue to
improve customer service.
a. Increase employee training in customer service precepts.
b. Implement cross-functional training.
c. Employ best practices and continuous improvement principles learned from Benchmarking
efforts.
16. Increase positive perception of the Utility through enhanced communication, customer
outreach, and collaborative activities.
a. Continue to use the DPU Customer Advisory Committee for input and feedback.
b. Improve knowledge of customers through increased content available through the website
and in public presentations.
c. Implement strategies identified through the performance audit.
d. Continue to communicate with largest contract customers through participation on the
Regional Water Advisory Board.
17. Continue to aggressively reduce meter tampering and water theft by allocating sufficient
resources to investigate and prosecute perpetrators, then exact restitution from them once
judgments have been obtained in court.
a. Publicize to customers and the general public the results of these enforcement activities to
raise awareness of the existence of and the consequences resulting from the commission of
such crimes.
18. Continue to improve the DPU/SAP Customer Service and Billing computer system.
a. Continue to make needed enhancements and implement best business practices to improve
internal and external customer service.
19. Implement Online Monthly Billing
a. Create and implement a cost-effective online monthly billing function to allow customers to
view their meter reading and billing data, then make payments electronically in “real time.”
Such implementation will improve overall service to customers and reduce the average
waiting time in the call queue.
20. Collaborate with the Department of Finance to greatly improve the timely and accurate
exchange, matriculation, and reporting of financial data to benefit all internal and external
stakeholders.
Draft Report – For Review and Verification Purposes Only 57
12/18/2014
Accounting & Financial Analysis
Accounting & Float Pool
Activities performed by the Accounting & Float Pool group include:7
At roughly 4:15 p.m. daily, meter reads are uploaded to SAP. At roughly 5:30 p.m. the upload is
then typically complete, and billing can be processed for that day’s cycles. (DPU has 19 monthly
and 54 quarterly cycles.)
Bill and correspondence printing (2,200 to 2,300 bills daily) then goes to the Billing & Records
group for reconciliation of the number of items against records. Finally, it goes to the Mail-It
organization, which in turn mails out the bills to DPU customers.
Process cash and check payments received via mail on the same day; open mail, digitize items,
record stubs to customer accounts, and submit dollars to bank electronically (typically 600 to
1,000 daily, although sometimes as high as 2,500 based on daily cycles). Then the next day
verify stubs and payments. At roughly 2:00 p.m. daily, the Supervisor submits information to
Treasury, which submits it to DPU’s bank.
Also receive FedEx/UPS shipments twice daily, which may need processing.
Process email/fax payments from Paymentus, which were credit card payments received by
Paymentus via online web or IVR access; download file to SAP through ICT (City IT
department) organization; and verify that information has been posted correctly. Paymentus
also sends a file to DPU for verification purposes.
Payments can be made at the Cashier’s Office on the first floor of the Ohio Building. At the
beginning of this project, customers could only make cash, check, or money order payments,
although starting in July 2014 customers are also now able to make credit card payments. Only
security number, account number, and amount needs to be input. The remainder is fully
automated.
Customers may also make payments electronically through several organizations, which in turn
send payments electronically to DPU:
- Checkfree (100 to 200/day)
- IPay (50/day)
- Metavante (100 to 200/day)
- Huntington (75 to 200/day)
There is a drop box in front of the Ohio Building where customers may drop off payments.
Each day someone from the Accounting & Float Pool group goes with a security person to pick
up any payments, which are processed immediately.
Also coming into the drop box are payments (identified by customer) from “unauthorized” vendors;
Kroger and Meijer stores typically make drops at night and send a total payment via Checkfree.

58 Draft Report – For Review and Verification Purposes Only
12/18/2014
Also available is the Bank Plan, which deducts customers’ cash payments directly from their
bank accounts, sends a file (roughly 500 items/day) for specific customers, and transmits dollars
for the total amount to DPU for processing. On a weekly basis, the Accounting & Float Pool
group downloads information showing those customers who have signed up. Each day, a file is
also downloaded, which automatically posts to accounts. This file is typically run two days in
advance of due date. As the information in the file “hits” customer accounts and DPU’s bank
account, it is then also sent to Treasury. Typically this process takes approximately four days.
Process transfers and refunds, remove late fees if Customer Service approves, as documented
on forms, etc.
Besides picking up mail from the United States Postal Service (USPS) each morning for processing
by the Accounting & Float Pool group, the mail clerk also goes to the locations of the other six
DPU divisions and picks up interoffice and outgoing mail (often twice daily). Then the Accounting
& Float Pool group determines the number of items in the outgoing mail and charges the divisions
for postage costs.
Additionally the mail clerk stops at the government center (twice daily) and drops off bills to the
Mail-It organization for mailing. Occasionally the mail clerk will also fill up vehicles with gas, if one
of the Administrative Services management staff needs a vehicle to use.
At roughly 1:00 p.m. daily, return mail is received and sorted. It is then possibly processed or
goes to the Legal/Bankruptcy organizations.
Regarding the Cashier’s Office, the Accounting & Float Pool performs a daily over/short
reconciliation of cash.
Financial Analysis
The Financial Analysis group is the general accounting group within the DPU organization, which
includes:8
Oversight responsibility of the other DPU divisions regarding budgeting activities
- Typically 2014 budgets were created by limiting them to 3% over last year’s actuals.
- To monitor actuals versus budgets, DPU must create two reports, one for revenues and one
for expenses to monitor DPU in total and by division.
- Operations and maintenance (O&M) expenses as well as DPU Capital Improvements
Program (CIP) construction projects.
- DPU CIP activities also include quarterly bond analysis and funding/refunding bond
analyses.
Review and log all proposed contracts prior to the Director’s signature
Consolidations
Analyses
Draft Report – For Review and Verification Purposes Only 59
12/18/2014
Reconciliation of water sent to other government entities in DPU’s service territory; besides
Toledo, DPU does customer billing only for Lucas County and Sylvania; other entities do their
own.
Working with the City Finance Department regarding corrections
Working with the City Debt Officer regarding bond financing
Reconciliation of general ledger accounts
Providing monthly reports to DPU Commissioners and Director
Help with SAP testing
- New reports and processes involved with trust funds; what pay based on received funds
- Online billing
- Main/sub ledger reconciliations
Monitoring travel expenses and educational reimbursements to ensure funds exist and rules are
being complied with
Answering questions and helping with due dates and timelines associated with accounting
requirements
Performing monitoring of multiple funds (25) and public power
Performing legislative review using systems and newspapers
Generating the annual information statement (AIS) used for bond funding, not the
Comprehensive Annual Financial Report (CAFR), but also performing fund breakdown for
CAFR
Asset management activities
Write RFPs and legislation, as needed, for Administrative Services use only
DPU/SAP
The DPU/SAP group is currently comprised of two Administrative Analysts and one alternate
Administrative who lead and manage SAP customer billing support and troubleshooting. These
individuals also perform data warehouse administration. SAP was implemented at DPU during
approximately the 2005–2006 timeframe. The DPU groups primarily using SAP customer billing are
Customer Service, Legal, Billing, and Water Distribution (meter reads, taps, etc.).9 This group also
provides notifications when SAP changes occur. In addition, it provides training (often train-the-trainer
type) or presentations when changes occur. Then Supervisors within the groups, using SAP customer
billing, typically train their own employees. This group also provides “how to” training documentation
for call center agent training.10
One of the reports provided monthly by the DPU/SAP group is a “garbage report.” Because Republic
now performs garbage pickup for Lucas County, the City wants to know the number of properties and
the number of units, because a DPU bill can include water, waste water, storm water, and garbage billing
items, if they apply.11

60 Draft Report – For Review and Verification Purposes Only
12/18/2014
One of the Administrative Analysts is the Project Manager for an online billing project. On DPU’s
website, customers can currently pay bills, but they cannot view bills nor can they see any billing history.
By summer or fall 2014, DPU expects that customers will be able to view their current bill plus 12
months’ history. That means commercial customers will be able to see 12 bills (monthly billing), while
residential customers will be able to see four bills (quarterly billing). Utegration, AT&T, and ICT are
helping DPU by implementing this capability. Eventually DPU expects to allow mobile access to these
items.12
Also currently underway is a pilot test involving selected landlords/tenants to perform monthly billing
instead of quarterly billing. Following the pilot, DPU will assess if a change to monthly billing for
selected or all residential customers is warranted.13
Utilities Administration
Customer Service
The Customer Service Unit within the Utilities Administration organization is the primary call center for
DPU (419-425-1800) based on the amount of data tracked and the volume of inbound calls and
customers who “walk in” for service to the walk-in center (first floor of the Ohio Building) on a daily
basis. This group is available from 7:00 a.m. to 6:00 p.m. Mondays through Fridays.14 As of September
2014 there is one Customer Service Supervisor and two approved alternates beginning training to back
up the Supervisor. There are 20 agents, with six vacancies, providing billing help on calls, doing
realtor/title work, doing electronic messages, doing account upgrades such as refuse and storm billing,
and two in the walk-in center.15 For the months of July, August, and September 2014, three Customer
Service agents were assisting the Billing & Records group to catch up on their backlog; however, as of
October 2014, they were back on the telephones full-time, as the backlog was caught up.16
The Customer Service Unit considers itself a “Customer Contact Center,” because it also takes requests for
service from customers in person and via email, phone, fax, and postal mail. Its primary functions are to
assist DPU customers with questions and concerns related to services for which they are billed (water,
sewer, storm, refuse), whether it is through opening or closing accounts, scheduling meter read
exchanges, closing accounts, or explaining bills.17 The unit’s agents can also help determine if a call is an
emergency and, if so, can forward the call to the Call City Hall (CCH) organization.18 This group can
also schedule Field Technician visits (specific days according to geographic areas; only the Tuesday zone
has another day that can be used, which is Fridays) based on a four-hour window (8:00 a.m. to noon or
noon to 4:00 p.m. on Mondays through Thursdays) or an eight-hour window (8:00 a.m. to 4:00 p.m. on
Fridays). Sometimes the Customer Service Unit agents must call the Water Distribution Meter Reading
& Inspections group) to ask that special permission be granted to schedule appointments outside of the
normal window of time for a certain area or request a 30-minute call ahead, which can be an issue if it is
early in the morning or beyond 3:30 p.m., when the Supervisor of that group leaves.19
Any calls regarding DPU water and sewer services and emergencies are typically taken by the CCH
organization at 419-936-2020. Prior to 2007, CCH was part of the Department of Neighborhoods,

Draft Report – For Review and Verification Purposes Only 61
12/18/2014
primarily taking nuisance complaints. Then in 2007, it began taking city-wide calls and moved to the
Water Distribution building at 401 South Erie. Call City Hall reports to the Field Operations
Commissioner; however, it is not officially part of the DPU organization. Besides DPU water and sewer
service and emergency calls, this call center also takes calls regarding streets, code inspections, trees,
potholes, health, and other Lucas County matters.20 Approximately 50% of calls are information only,
while the other 50% require action on the City’s part. Of this latter 50%, 40% are DPU calls, 50% are
nuisance calls, and 10% are other calls.21 Three CCH employees work from 7:00 a.m. to 3:00 p.m. and
two employees work from 8:00 a.m. to 4:00 p.m., with four employees working from 3:00 p.m. to 11:00
p.m. on Wednesdays and two or three employees working this shift on other days. Only one employee
works from 11:00 p.m. to 7:00 a.m. unless many emergencies are occurring. In that case, other agents
are called in.22 When CCH gets three calls in a particular geographic area, the organization assumes that
a pervasive issue exists. Information is then conveyed back and forth with Field Services (or other
departments), including scripts agents should use when talking with customers. Other mechanisms used
include a foreman using radio to call the field staff, the website, an alert system (text message or email
messages), etc. For non-emergency requests, it usually takes about a day to get service requests to
Cityworks and converted to work orders so field workers can address the request. However, for
emergency requests, calls are transferred immediately to the Water Distribution group. If an emergency
call comes in after Field Services hours, then agents will call the general foreman no matter what time.23
Billing & Records
The Billing & Records group is involved in many activities related to billing functions, such as:24
One of the activities taking up a considerable amount of this group’s time until October 2014
was entering completed work orders into SAP once paperwork had been received from the
Field Services organizations, at which point the backlog was eliminated. Based on inspections,
this group may do bill adjustments, as necessary, because up-to-date information is not in SAP
as a result of a large backlog. A simple work order may take five minutes to enter; however, it
can easily take a minimum of 20 minutes if adjustment reversals are necessary. In that case, the
person addressing the work orders must send them to the Billing & Records Supervisor, who in
turn sends them to an Administrative Analyst in the Financial Analysis group. From there, they
are sent to an Administrative Analyst in the DPU/SAP group to handle, especially if a full
reversal is needed, which can take two to three days.
When the prior legacy system was used, a late fee was reversed if billing was redone. Now,
although not frequently done, a clerk in the Billing & Records group requests the full reversal
from the DPU/SAP group and copies his or her supervisor.
Addressing the EL70 implausible report is essentially an eight-hour job each day and is done by
one Billing & Records employee. This report highlights bad reads, in versus out discrepancies,
etc. Once reviewed, this employee gives the information to Customer Service Unit agents,
particularly one, who makes proactive calls to customers and asks for customer rereads. If
customers can’t read, then the agent may schedule inspections.

62 Draft Report – For Review and Verification Purposes Only
12/18/2014
Addressing the EL70 two error code report, which highlights zero consumption as well as high
consumption, is done by another Billing & Records employee. This employee either releases
the item and a bill is sent or alerts the Water Distribution Collections group to have field
workers leave a green card notice at the customer’s location.
These activities also include testing SAP, as necessary, each time something changes, including
upgrades and rate changes.
Also assisting Billing & Records with entering work order completions in SAP was the Water Distribution
Collections group, located at 401 South Erie. DPU Water Distribution field workers complete a work
order and manually complete paperwork. When they come back to South Erie, the paperwork is then
sent to the Billing & Records group at 420 Madison. The Billing & Records group, which was trying to
reduce a six-month backlog of entering completed work order data in SAP, then sent many of the simpler
work orders back to the Collections group for entering into SAP.25 Subsequently, by October 2014, the
backlog has been caught up. These activities are in addition to the group’s regular work of giving four
Field Services Water Technicians a listing of turnoffs and reconnects (along with a routing for work using
Street Sync) and then updating SAP. All accounts over $200 that are 90 days late are printed daily using
the non-pay ZMAS report. They are then put into a spreadsheet and routing is done, so the Collections
group can give routes to the Field Services Water Technicians by 8:00 a.m. the following day. A green
card notice is left, and then roughly three business days later, a shutoff occurs if no payment has been
made; however, roughly 25% to 50% of customers pay if a green card is left. When a payment occurs at
the Ohio Building, a form is filled out and an email message is sent to the Collections group, who must
check each item before Water Technicians go back out to turn off service.26
Also part of the Billing & Records group is a separate unit which performs records activities. This unit is
comprised of two clerks that are responsible for maintaining the business records of the Administrative
Services division.
Legal Technicians
Currently four Legal Technicians, who each report administratively to the Utilities Administration (UA)
Manager, are in the UA Legal Unit. They are assisted by an Intermediate Clerk, who primarily helps
with filings at common pleas and probate courts involving tax foreclosures and liens. In addition, she
also picks up mail for the UA Legal unit. The employees in this unit are assisted functionally by City
attorneys who are co-located in the same office area. 27
The Legal Technicians’ specific focus areas include:28
Primarily bankruptcy cases, in which the Legal Technician gets notifications, updates the
system, and files proof of claims; also lien payments and auditing of books29
Primarily interaction with collection law firms, in which approximately 30 days after turnoffs, if
no payment is received, referrals are made to collection law firms; also reviewing closed
accounts and sending them to collection law firms; involvement in theft investigations by
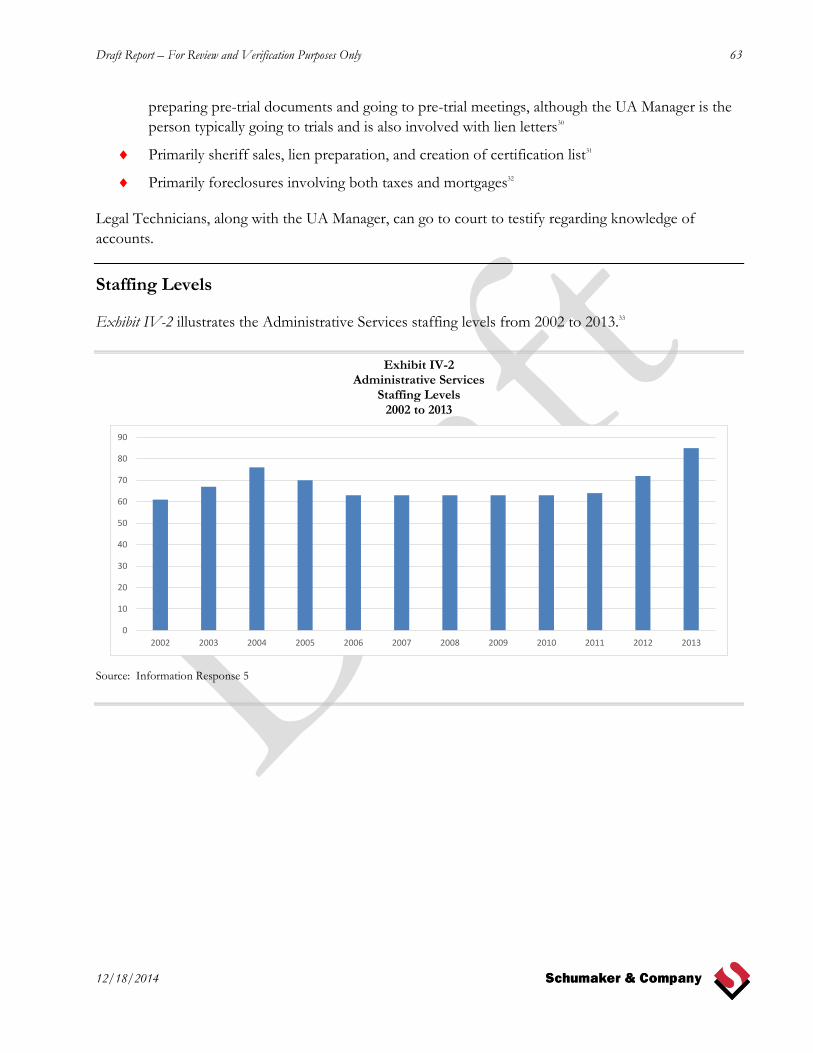
Draft Report – For Review and Verification Purposes Only 63
12/18/2014
preparing pre-trial documents and going to pre-trial meetings, although the UA Manager is the
person typically going to trials and is also involved with lien letters30
Primarily sheriff sales, lien preparation, and creation of certification list31
Primarily foreclosures involving both taxes and mortgages32
Legal Technicians, along with the UA Manager, can go to court to testify regarding knowledge of
accounts.
Staffing Levels
Exhibit IV-2 illustrates the Administrative Services staffing levels from 2002 to 2013.33
Exhibit IV-2 Administrative Services
Staffing Levels 2002 to 2013
Source: Information Response 5
0
10
20
30
40
50
60
70
80
90
2002 2003 2004 2005 2006 2007 2008 2009 2010 2011 2012 2013

64 Draft Report – For Review and Verification Purposes Only
12/18/2014
Systems
The systems currently in place for Customer Service & Accounting functions include:34
SAP (current customer service system)/CIS (prior system)
Internet
Microsoft Office Suite – Word, Excel, PowerPoint, and Outlook
Auditor’s Real Estate Information System (AREIS)
Court Dockets
Secretary of State website
Cityworks
Paymentus (online bill payment)
Check 21 (check verification)
CISCO Viewpoint (network security)
JIRA (bug and issue tracking)
OnBase (workflow, document, and records management)
Stop Process
Multiline telephone systems
Standard copy machines
Currently, the City of Toledo has a Cisco Internet protocol (IP) Telephony system being used at 10
locations. This Cisco IP Telephony system includes Call Manager, Unity Voice Mail, IP Contact Center,
RSI Call Accounting Software, voice gateways, 7900 Series IP phones, and ATA analog adapters.35

Draft Report – For Review and Verification Purposes Only 65
12/18/2014
Financial Results
DPU’s financial results for the year ending December 2013, broken down by water, sewer, utility
administrative services, and storm are illustrated in Exhibit IV-3.36
Exhibit IV-3 Toledo Department of Public Utilities
2013 DPU Financial Results Statement of Revenues, Expenses, and Changes in Fund Net Position
Proprietary Funds for the Year Ended December 31, 2013
(thousands)
Source: City of Toledo 2013 CAFR Pages 44 (Water, Sewer, and Utility Administrative Services) and
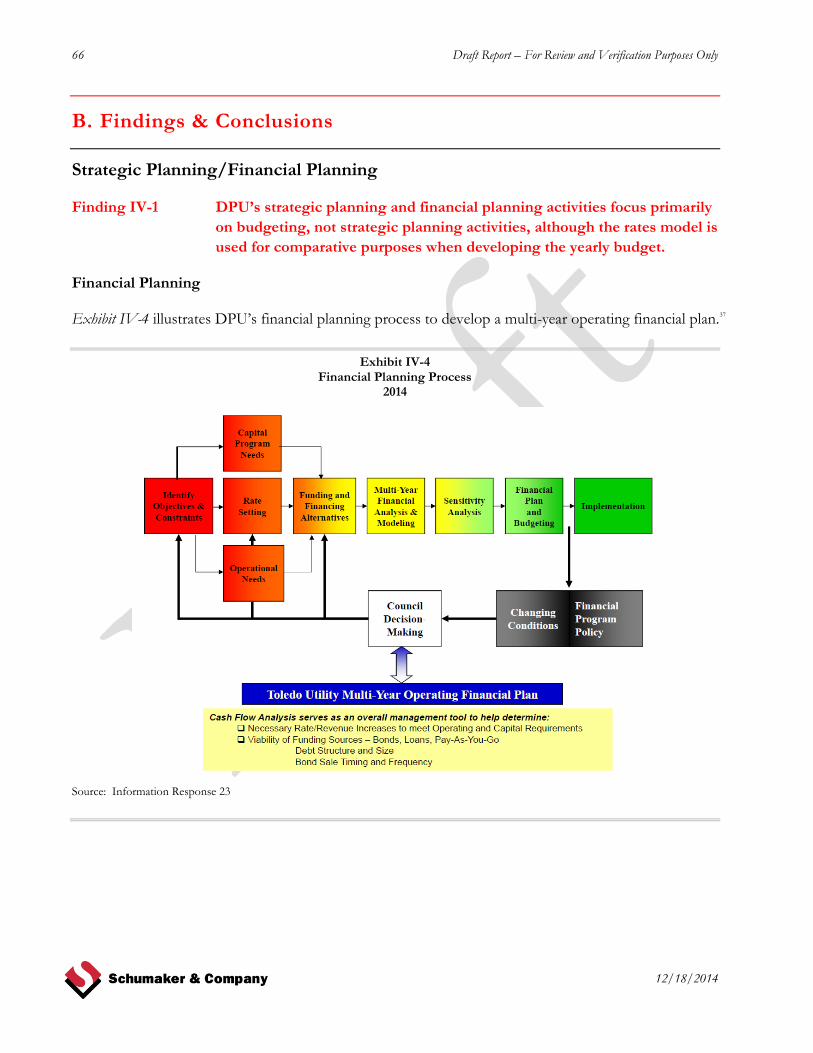
66 Draft Report – For Review and Verification Purposes Only
12/18/2014
B. Findings & Conclusions
Strategic Planning/Financial Planning
Finding IV-1 DPU’s strategic planning and financial planning activities focus primarily
on budgeting, not strategic planning activities, although the rates model is
used for comparative purposes when developing the yearly budget.
Financial Planning
Exhibit IV-4 illustrates DPU’s financial planning process to develop a multi-year operating financial plan.37
Exhibit IV-4 Financial Planning Process
2014
Source: Information Response 23

Draft Report – For Review and Verification Purposes Only 67
12/18/2014
Several funds are used to account for water and sanitary sewer revenues and expenditures, as shown in
Exhibit IV-5.38
Exhibit IV-5 Flow of Utility Revenues
2014
Source: Information Response 21
Funds placed in the replacement reserve accounts are intended to replace existing assets; the reserves are
funded with revenues in excess of operations and maintenance expense requirements that are
transferred from operating funds.39 Funds placed in bond improvement reserve accounts (Funds 62 and
72) are intended for capital additions that are funded with bond proceeds.40 Funds for the improvement
accounts (Funds 61 and 71) are taken from operating account revenues, with targeted funding equal to
the following year’s capital improvements budget plus $ 1million.41

68 Draft Report – For Review and Verification Purposes Only
12/18/2014
Budgeting
The recent changes to the operating budget processes in Toledo represent a significant departure from
past practices. The individual departments and divisions are much more involved with the process and
there has been positive movement toward matching available resources with spending patterns.
According to City management, the monitoring of the budget has become much more rigorous in the
past two years, in part because of the City department’s work with City Council to pass the budget much
earlier than required by the City’s charter.42
The format and presentation of the budget changed significantly with the 2013 budget. The 2014
budget process continued to refine and enhance this budget presentation. The finished budget product
included charts and graphs, as well as additional narrative to supplement the accumulated data. The
document is meant to be user friendly for not only City of Toledo employees but also the public at large.
To accomplish this goal, departments were called upon to provide information about their goals,
accomplishments, and performance measures.43
Like 2013, the 2014 budget also incorporated the City’s Capital Improvements Program budget into the
operating budget process. While the operating and CIP budget ordinances will remain as separate pieces
of legislation, the merging of the processes represents a tacit recognition that the two impact one
another tremendously and neither can exist outside the context of the other.44 Additionally, DPU has a
capital budget process that specifically incorporates DPU-only capital expenditures.
The 2014 budget, in both its development and implementation, continued to emphasize the role of City
departments and divisions in all stages of the process, including the initial crafting of the budget, the
presentation to City Council, and the ongoing monitoring of the budget throughout the year. This
budget works from the assumptions that (1) the role of departments is to fully know and understand the
programs that their department is responsible for, including the budgetary implications of the programs,
and (2) the roles of the City Finance Department are to coordinate the budget process, provide technical
assistance to departments as needed, and moderate the budgetary requests of departments given scarce
resources. The process as a whole is expected be an iterative one, with the City Finance Department
constantly in communication with departments and divisions. The departments and divisions, however,
are also able to use the City’s SAP financial system’s reporting capacity to guide decision making on their
own within the parameters of an approved budget. In other words, divisions are able to (and will be
expected to) monitor and manage their own budgets, making many spending decisions without the
involvement of the City Finance Department, provided they stay within their budgets.45
The 2014 budget cycle again used a “modified zero based” budgeting approach, which is closely
monitored by the City Budget Office.46 With regard to DPU specifically, the 2014 budget was essentially
limited to 3% over 2013’s actual figures.47

Draft Report – For Review and Verification Purposes Only 69
12/18/2014
The budget development schedule for the 2014 budget was as shown in Exhibit IV-6.48
Exhibit IV-6 Budget Development Schedule
2014 Budget Cycle
May 31, 2013 Budget guidance released to departments
May 31 – August 2, 2013 Meetings between departments and Budget Office
June 11, 2013 CIP budget guidance released to departments
August 2, 2013 Departments submit draft operating budget materials
August 12, 2013 Departments submit draft CIP budget materials
August 30, 2013 City Finance Department completes draft budget
August 30 – September 20, 2013 Review by Mayor and Deputy Mayor
September 20 – October 4, 2013 Communication with departments about revisions Appeal period for departments
October 4 – November 15, 2013 Budget staff prepares and formats final documents
November 15, 2013 Submit budget to City Council
December 3, 2013 Clerk of Council publishes legislation per Section 46 of charter
November 15, 2013 – January 28, 2014 Departmental budget hearings before Council
December 3, 2013 CIP proposed budget presented to Council
December 10, 2013 Target date for Council-passed temporary appropriations ordinance for January – March 2014
November 15, 2013 – January 28, 2014 Public meetings
January 28, 2014 Target date for Council-passed budget
January 28, 2014 Target date for Council-passed CIP budget
March 31, 2014 Statutory deadline for Council-passed budget Source: Information Response 17
Historically DPU developed a one-year budget; however, DPU is now looking at a three-year budget at
the new Director’s request.49
Finding IV-2 Detailed goals/objectives/performance measures are not typically part of
DPU’s planning/budgeting process.
The development of the City’s 2014 budget also included steps in the direction of performance-based
budgeting. Two departments included detailed performance measures as part of their budget
submission and presentation.50 At DPU, however, neither goals and objectives nor detailed performance
measures were always included in the budgeting process.
Finding IV-3 Formal monitoring of actual versus budget reporting is not being done by
DPU management or staff in all divisions
In the past, DPU created monthly reporting of actual versus budget information and data. In addition,
DPU held monthly meetings, but these activities are not necessarily now being done.51 Also the ongoing
monitoring of DPU actual versus budget figures, including developing an explanation of why significant
variances exist, has not generally occurred at the various DPU divisions, although recently the
Accounting & Financial Analysis group has begun to focus on these activities. 52

70 Draft Report – For Review and Verification Purposes Only
12/18/2014
Other Financial Management Practices, including SAP Issues
Finding IV-4 The way in which the SAP enterprise resource planning (ERP) system and
data warehouse is currently being used results in various issues.
Several SAP issues within the Accounting & Financial Analysis group currently exist: 53
DPU does not have access to its monthly financial statements from the SAP ERP system, but must take data from
the data warehouse and create such reports manually. – DPU cannot see its financial statements directly
from the SAP ERP system. It would like to be able to do so, even if such visibility was read-only
access. Now DPU must run the business warehouse to separately format retrieve revenue and
expense data. The Utility must then take both types of data and put them into a financial
statement format.
The Accounting & Financial Analysis group is unable to directly make journal entries into the SAP ERP system.
– Journal entries can’t be done directly by DPU’s Accounting & Financial Analysis group, but must
go the City Finance Department to be made. The DPU Accounting & Financial Analysis group
would like to do entries, and then use workflow to have the City Finance Department approve.
DPU cannot produce reports using the SAP ERP data warehouse but must use ICT or others to do it. –
Currently DPU does not use the business warehouse for creating custom reports; DPU originally
purchased the warehouse, but later gave it to the City SAP ERP system. Now, if it wants custom
reports, DPU must go to ICT (or others) for programming of reports. According to Accounting
& Financial Analysis management, there are several reasons why DPU can’t get the customization
ability back at this time: (a) limited staff resources and (b) limited dollars. That is because DPU
would need to buy additional server equipment to do so.
Finding IV-5 The elimination of full reversals has complicated DPU’s ability to explain
billing adjustments to customers, and call center agents are not fully
trained on understanding the process.
The Accounting & Financial Analysis group has essentially stopped full reversals (except in a few cases),
because such activities got rid of all documentation involving reversals. Instead an adjustment reversal
was implemented, which doesn’t get rid of all documentation. However, the Customer Service/Billing
& Records groups find it extremely difficult to explain to customers what is happening now that the
adjustment reversals are being used. The Customer Service/Billing & Records groups believe it’s a
control issue, but the Accounting & Financial Analysis group indicates that the process is needed to
eliminate full reversals for accounting purposes.54

Draft Report – For Review and Verification Purposes Only 71
12/18/2014
Performance Measurement System
Finding IV-6 DPU has no formal performance measurement processes or systems in
place.
While the City Budget Office has some key performance indicators (KPIs), DPU does not do anything
official regarding KPIs. 55 The only similar action taken is to monitor compliance with rate and bond
financing targets,56 or to compare DPU rates to other entities through mechanisms such as the American
Water Works Association (AWWA) or regional surveys.57
Financial Management
Schumaker & Company requested information regarding DPU’s financial KPIs (targets and results) for
the last five years (2010–2014), including but not limited to system renewal/replacement rate (%), return
on assets (%), and cash reserve days (number of days), to review results against any targets. Included in
Exhibit IV-7 are selected KPIs, including return on assets and cash reserve days.58

72 Draft Report – For Review and Verification Purposes Only
12/18/2014
Exhibit IV-7 Financial KPIs
2010 to 2014
WATER
SEWER
Source: Information Response 113
According to DPU management, DPU does not calculate the system renewal/replacement rate. $50
million supported by the five-year increase in water rates, which commenced in January 2014, was set
aside specifically to quadruple the previous replacement rate of the water distribution system (from 377
years to 100 years). However, because the Utility was already behind in its replacement of this
infrastructure, the improvement, while significant, is not a panacea. Prior to 2014, approximately $2.5
million was spent annually on water line replacement. Beginning in 2014, that amount is now
approximately $10 million on an annual basis. The plan calls to replace at least 1% of the system per
year (based on 100 years of expected life); replace all 4” mains serving hydrants within 10 years, and
close all significant dead-end mains within 10 years.59
2010 2011 2012 2013 2014
Current Ratio (Current Assets/Current Liabilities) 0.97 1.31 1.78 3.27 4.15
Quick Ratio (Cash & Cash Equivalents/Current Liabilities) 0.30 0.10 0.82 2.13 2.98
Operating Ratio (O&M\Total Operating Revenue) 0.66 0.75 0.75 0.59 0.67
Net Take-Down Ratio (Operating Income - O&M/Gross Revenue) 0.43 0.61 0.60 0.27 0.42
Liabilities to Total Assets 0.39 0.37 0.46 0.66 0.65
Debt to Equity Ratio (Total O/S Debt/Equity) 0.64 0.60 0.85 1.94 1.86
Debt Ratio (Total O/S Debt/Total Assets) 0.34 0.32 0.42 1.25 1.24
Debt Service Safety Margin (Net Operating Income-Debt Service/Gross Revenue)0.42 0.54 0.52 0.39 0.14
Restricted Assets/Restricted Liabilities 0.22 - 0.08 0.05 0.06
Debt Service Ratio (Gross Revenue - Operating Expense(Net of Depreciation)/Debt Service)3.77 4.54 4.33 4.05 1.54
System Renewal/Replacement Rate TDPU Does Not Calculate
Return on Assets 0.04 0.02 0.02 0.04 0.01
4.49% 2.49% 2.47% 4.35% 1.04%
Cash Reserve Days 0.50 43.26 83.63 216.38 608.07
2010 2011 2012 2013 2014
Current Ratio (Current Assets/Current Liabilities) 0.97 1.42 1.81 5.45 4.95
Quick Ratio (Cash & Cash Equivalents/Current Liabilities) 0.59 0.93 1.13 3.74 3.64
Operating Ratio (O&M\Total Operating Revenue) 0.59 0.58 0.60 0.52 0.42
Net Take-Down Ratio (Operating Income - O&M/Gross Revenue) 0.44 0.43 0.47 0.10 (0.04)
Liabilities to Total Assets 0.52 1.26 0.78 1.14 1.08
Debt to Equity Ratio (Total O/S Debt/Equity) 1.12 1.20 1.29 1.38 1.29
Debt Ratio (Total O/S Debt/Total Assets) 0.46 1.13 0.71 1.10 1.05
Debt Service Safety Margin (Net Operating Income-Debt Service/Gross Revenue) 0.16 0.22 0.20 0.12
Restricted Assets/Restricted Liabilities 0.04 0.08 0.07 0.17 0.17
Debt Service Ratio (Gross Revenue - Operating Expense(Net of Depreciation)/Debt Service) 2.66 3.11 2.85 1.54
System Renewal/Replacement Rate TDPU Does Not Calculate
Return on Assets 0.02 0.03 0.03 0.08 0.05
1.79% 2.64% 2.82% 8.49% 4.66%
Cash Reserve Days 0.30 30.58 33.24 28.22 98.23

Draft Report – For Review and Verification Purposes Only 73
12/18/2014
Other information received as part of this request included:60
Investment activity report (April 2014)
Investment portfolio (as of April 30, 2014)
Outstanding investments by fund (daily since December 31, 2002)
Customer Service
Schumaker & Company requested information regarding DPU’s customer satisfaction KPIs (targets and
results) for the last five years (2010–2014) regarding each of the following metrics: customer service
complaints per 1,000 accounts; disruptions of water service per 1,000 accounts; disruptions of sewer
service per 1,000 accounts; residential cost of water service ($ per month); residential cost of sewer
service ($ per month); residential cost of storm water service ($ per month); customer service cost ($)
per account; and billing accuracy per 10,000 billings.61 Included in Exhibit IV-8 are selected KPIs
provided by DPU, although none of those requested was provided.
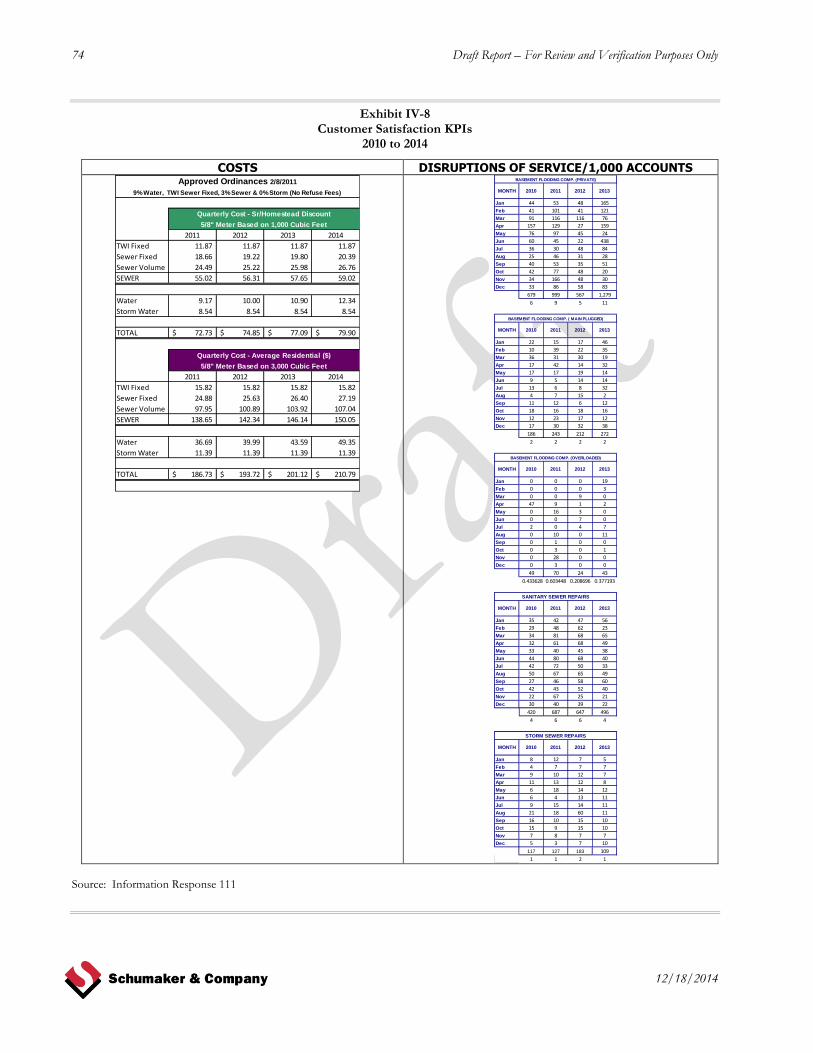
74 Draft Report – For Review and Verification Purposes Only
12/18/2014
Exhibit IV-8 Customer Satisfaction KPIs
2010 to 2014
COSTS DISRUPTIONS OF SERVICE/1,000 ACCOUNTS
Source: Information Response 111
2011 2012 2013 2014
TWI Fixed 11.87 11.87 11.87 11.87
Sewer Fixed 18.66 19.22 19.80 20.39
Sewer Volume 24.49 25.22 25.98 26.76
SEWER 55.02 56.31 57.65 59.02
Water 9.17 10.00 10.90 12.34
Storm Water 8.54 8.54 8.54 8.54
TOTAL 72.73$ 74.85$ 77.09$ 79.90$
2011 2012 2013 2014
TWI Fixed 15.82 15.82 15.82 15.82
Sewer Fixed 24.88 25.63 26.40 27.19
Sewer Volume 97.95 100.89 103.92 107.04
SEWER 138.65 142.34 146.14 150.05
Water 36.69 39.99 43.59 49.35
Storm Water 11.39 11.39 11.39 11.39
TOTAL 186.73$ 193.72$ 201.12$ 210.79$
5/8" Meter Based on 3,000 Cubic Feet
Approved Ordinances 2/8/2011
9% Water, TWI Sewer Fixed, 3% Sewer & 0% Storm (No Refuse Fees)
Quarterly Cost - Sr/Homestead Discount
5/8" Meter Based on 1,000 Cubic Feet
Quarterly Cost - Average Residential ($)
Jan 44 53 48 165
Feb 41 101 41 121
Mar 91 116 116 76
Apr 157 129 27 159
May 76 97 45 24
Jun 60 45 22 438
Jul 36 30 48 84
Aug 25 46 31 28
Sep 40 53 35 51
Oct 42 77 48 20
Nov 34 166 48 30
Dec 33 86 58 83
679 999 567 1,279
6 9 5 11
Jan 22 15 17 46
Feb 10 39 22 35
Mar 36 31 30 19
Apr 17 42 14 32
May 17 17 19 14
Jun 9 5 14 14
Jul 13 6 8 32
Aug 4 7 15 2
Sep 11 12 6 12
Oct 18 16 18 16
Nov 12 23 17 12
Dec 17 30 32 38
186 243 212 272
2 2 2 2
Jan 0 0 0 19
Feb 0 0 0 3
Mar 0 0 9 0
Apr 47 9 1 2
May 0 16 3 0
Jun 0 0 7 0
Jul 2 0 4 7
Aug 0 10 0 11
Sep 0 1 0 0
Oct 0 3 0 1
Nov 0 28 0 0
Dec 0 3 0 0
49 70 24 43
0.433628 0.603448 0.208696 0.377193
Jan 35 42 47 56
Feb 29 48 62 23
Mar 34 81 68 65
Apr 32 61 68 49
May 33 40 45 38
Jun 44 80 68 40
Jul 42 72 50 33
Aug 50 67 65 49
Sep 27 46 58 60
Oct 42 43 52 40
Nov 22 67 25 21
Dec 30 40 39 22
420 687 647 496
4 6 6 4
Jan 8 12 7 5
Feb 4 7 7 7
Mar 9 10 12 7
Apr 11 13 12 8
May 6 18 14 12
Jun 6 4 13 11
Jul 9 15 14 11
Aug 21 18 60 11
Sep 16 10 15 10
Oct 15 9 15 10
Nov 7 8 7 7
Dec 5 3 7 10
117 127 183 109
1 1 2 1
BASEMENT FLOODING COMP. (PRIVATE)
MONTH 2010 2011 2012 2013
BASEMENT FLOODING COMP. ( MAIN PLUGGED)
MONTH 2010 2011 2012 2013
BASEMENT FLOODING COMP. (OVERLOADED)
MONTH 2010 2011 2012 2013
SANITARY SEWER REPAIRS
MONTH 2010 2011 2012 2013
STORM SEWER REPAIRS
MONTH 2010 2011 2012 2013

Draft Report – For Review and Verification Purposes Only 75
12/18/2014
Customer Satisfaction
Customer Service Unit
Finding IV-7 Escalation of calls to Supervisors is not done electronically or at the time
the issue is identified.
Escalation of calls to Supervisors is not done in a timely manner. When required, agents complete a
paper form, which is put into a box for Supervisors to address. When they have time, typically within
72 hours of the original call, Supervisors listen to the call, then call the customer back.62
Finding IV-8 Little monitoring of Call Center agent calls is being done regularly by
Supervisors.
Currently Customer Service Unit Supervisors generally do not monitor calls performed by agents. In
most cases, Supervisors should monitor at least one to two calls per week for each agent. However, the
Manager listens to calls at night and on weekends and lets Supervisors know if there are specific
concerns regarding an agent’s calls that need addressing. 63
Finding IV-9 No Team Leaders who could help with call monitoring activities exist for
the Customer Service group, and such activities are generally not done
due to lack of Supervisor time.
If the Customer Service Unit had Team Leaders to assist Supervisors, then call monitoring could be
done on a regular basis. As a result, feedback could be provided to agents in a timely manner based on
agent calls being monitored weekly. 64
Finding IV-10 Customer complaints occur due to how DPU does scheduling of service
requests.
According to Utilities Administration management, a lot of customer complaints occur based on how
DPU does scheduling of service requests. Not only can’t agents guarantee that times will be met, but
they also schedule visits on specific days based on specific geographic areas within the service area. The
agents can specify either morning or afternoon when scheduling service request visits, but they cannot
schedule visits in which field workers call ahead to customers, unless it is the last resort.65
Customer Service Unit employees also indicated that it is often difficult for employees, such as the
Utilities Administration Manager or the Customer Service Unit Supervisors, to reach Water Distribution
management, especially at the beginning or end of the day, to discuss the specific scheduling needs of
customers.66
76 Draft Report – For Review and Verification Purposes Only
12/18/2014
Finding IV-11 The SAP billing system requires DPU agents to type in information that
should be available in drop-downs.
In SAP, agents must currently type in the following information in a freeform field when scheduling
service requests, because no drop-downs are available:67
Morning (a.m.)/afternoon (p.m.) preference by customer for service visit by field worker
Description of what is needed of the service visit by field worker occurs
If the customer (or someone for the customer) will be onsite during the service visit, and if so,
whom
Telephone number and name of person making call (however, field workers, including Meter
Shop, often won’t call if there’s a problem)
The freeform field should augment what information can be done through SAP drop-downs. It would
help make the process more efficient, plus increased use of drop-downs would help provide consistency
in how agents complete information and data regarding calls. Additionally, while a freeform description
may be appropriate, there is no coding an agent can do that will help in later identifying what types of
problems or issues typically exist when a customer calls in.68
Finding IV-12 The DPU Call Center and Billing groups do not have trainers to regularly
provide training to employees.
Schumaker & Company’s experience is that a group having a dedicated training staff typically results in
better training for employees; however, neither the DPU Call Center nor the Billing group has dedicated
staff to regularly provide training to employees.69

Draft Report – For Review and Verification Purposes Only 77
12/18/2014
Finding IV-13 The DPU’s Customer Service Unit Call Center performance
statistics are improving.
The DPU Customer Service Unit has available statistics by month, day, and hour, as illustrated for the
March 2014 in Exhibit IV-9.70
Exhibit IV-9 Call Center Work Study by Day and Hour
March 2014
Source: Information Response 52
Abandoned calls include calls where customers use other options (including going to other agents if one
doesn’t pick up), not just truly abandoned calls.71

78 Draft Report – For Review and Verification Purposes Only
12/18/2014
Exhibit IV-10 illustrates the DPU Contact Service Queue Activity Report for 2013 and 2014 (through
April 8, 2014).72
Exhibit IV-10 Contact Service Queue Activity Report
2013 and 2014 YTD
2013
2014 Through April 8, 2014
Source: Information Response 52
Average speed of answer statistics improved by late 2013 as additional staff were hired, as shown in
Exhibit IV-11. This improvement occurred even though Customer Service Unit call volumes remained
roughly the same throughout the year (and into 2014).73
Exhibit IV-11 Monthly Customer Service Unit Call Center Statistics
2013
Source: Information Response 52
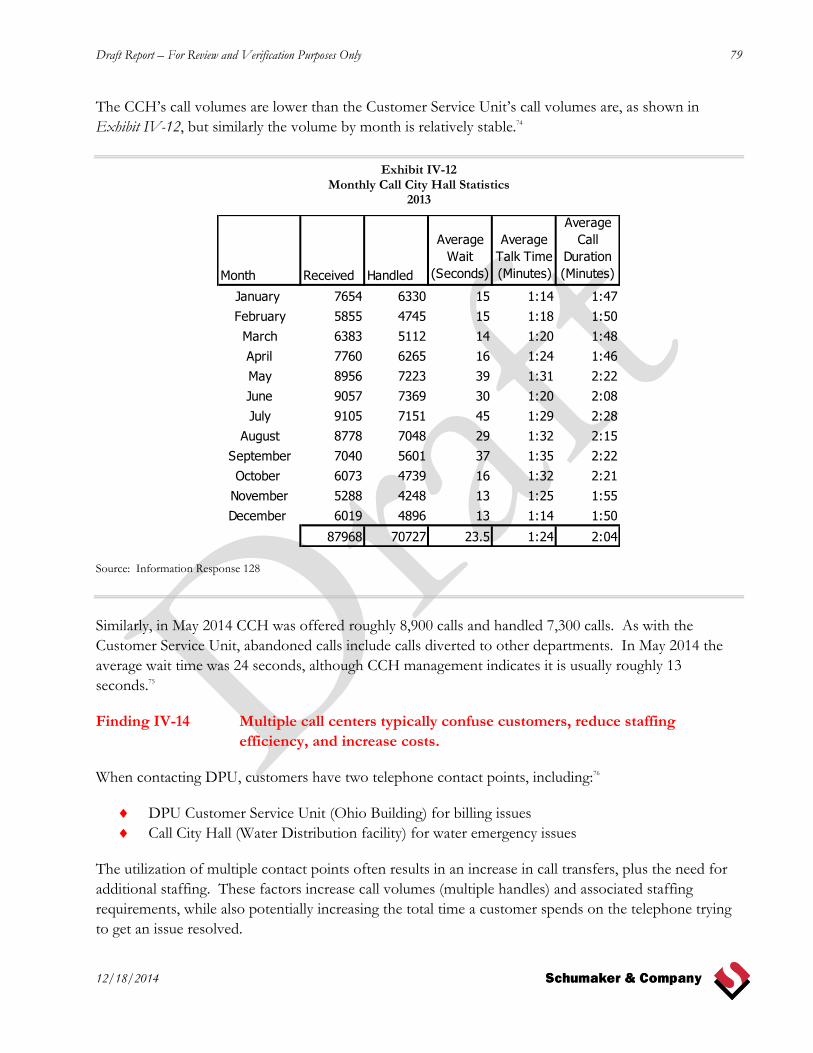
Draft Report – For Review and Verification Purposes Only 79
12/18/2014
The CCH’s call volumes are lower than the Customer Service Unit’s call volumes are, as shown in
Exhibit IV-12, but similarly the volume by month is relatively stable.74
Exhibit IV-12 Monthly Call City Hall Statistics
2013
Source: Information Response 128
Similarly, in May 2014 CCH was offered roughly 8,900 calls and handled 7,300 calls. As with the
Customer Service Unit, abandoned calls include calls diverted to other departments. In May 2014 the
average wait time was 24 seconds, although CCH management indicates it is usually roughly 13
seconds.75
Finding IV-14 Multiple call centers typically confuse customers, reduce staffing
efficiency, and increase costs.
When contacting DPU, customers have two telephone contact points, including:76
DPU Customer Service Unit (Ohio Building) for billing issues
Call City Hall (Water Distribution facility) for water emergency issues
The utilization of multiple contact points often results in an increase in call transfers, plus the need for
additional staffing. These factors increase call volumes (multiple handles) and associated staffing
requirements, while also potentially increasing the total time a customer spends on the telephone trying
to get an issue resolved.
Month Received Handled
Average
Wait
(Seconds)
Average
Talk Time
(Minutes)
Average
Call
Duration
(Minutes)
January 7654 6330 15 1:14 1:47
February 5855 4745 15 1:18 1:50
March 6383 5112 14 1:20 1:48
April 7760 6265 16 1:24 1:46
May 8956 7223 39 1:31 2:22
June 9057 7369 30 1:20 2:08
July 9105 7151 45 1:29 2:28
August 8778 7048 29 1:32 2:15
September 7040 5601 37 1:35 2:22
October 6073 4739 16 1:32 2:21
November 5288 4248 13 1:25 1:55
December 6019 4896 13 1:14 1:50
87968 70727 23.5 1:24 2:04
80 Draft Report – For Review and Verification Purposes Only
12/18/2014
Appeals Process
Finding IV-15 Appeals to the Adjustment Committee include only DPU management
employees and appear to be generally done without bias; however, the
lack of outside involvement on the committee may give the perception
that this is not true.
Any customers who question or dispute any charges on the DPU utility bill pursuant to § 104.04
(Council Proceedings section) should contact the Customer Service Unit for clarification or correction
of disputed charges.77
If the dispute is not resolved by the Customer Service Unit, the customer may write a letter within 30
days of contact with the Customer Service Unit to the DPU’s Adjustment Committee.78 The letter
should clearly set forth the issue or issues in dispute, the basis for seeking an adjustment pursuant to
§104.04, along with any proof, such as copies of bills, necessary to help the Adjustment Committee
understand the basis for and support for the customer’s claim. Any appeal requests received after thirty
(30) days are denied.79 The Adjustment Committee is generally made up of representatives from each
unit within the Utilities Administration and Water Distribution areas, specifically.80
Meter Shop
Meter Reading
Customer Service
Billing
The Adjustment Committee reviews a customer’s letter and supporting documents and renders a
decision. A letter or other written communication, such as a corrected bill, is then sent to the customer
explaining the approval, partial approval/denial, or denial of the claim. Any customers who receive a
denial letter from the Adjustment Committee and who still, in good faith, believe the previous denials
were in error pursuant to §104.04 may request an administrative hearing. For the hearing to be granted,
the customer must demonstrate that the Adjustment Committee failed to follow the DPU’s rules and
regulations or applicable law or that the denials ignored evidence that demonstrated an adjustment was
warranted. Hearings cannot be granted if a customer merely does not like the previous rulings, if no
justification exists to provide an adjustment pursuant to §104.04, or if the customer raises new issues
that were not previously brought before the Adjustment Committee.81
At an administrative hearing, the customer bears the burden of proof. The customer presents his or her
case at the administrative hearing and provides all proof or documentation to justify the claim for relief.
DPU will also present a case that responds to the customer’s case. The administrative hearings are
presided over by an Administrative Hearing Officer appointed by the DPU Director. The decisions of
the Administrative Hearing Officer are final appealable orders of the City pursuant to Ohio Revised
Code (ORC) Chapter 2506.82
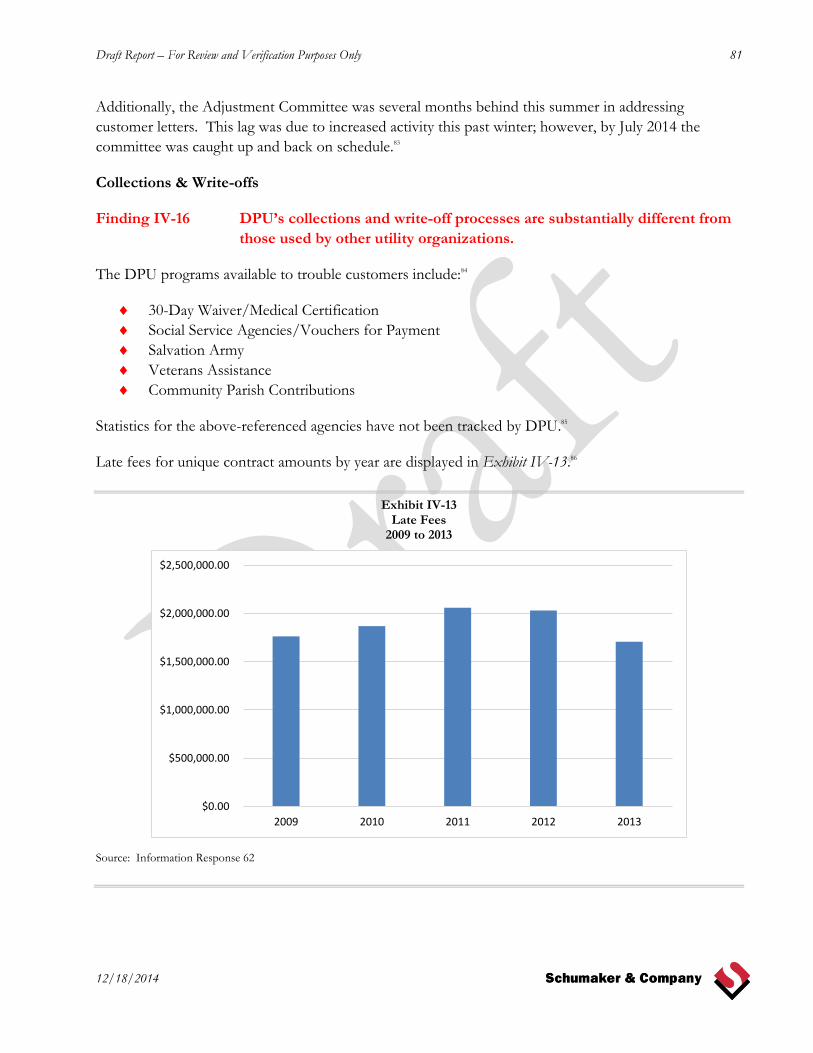
Draft Report – For Review and Verification Purposes Only 81
12/18/2014
Additionally, the Adjustment Committee was several months behind this summer in addressing
customer letters. This lag was due to increased activity this past winter; however, by July 2014 the
committee was caught up and back on schedule.83
Collections & Write-offs
Finding IV-16 DPU’s collections and write-off processes are substantially different from
those used by other utility organizations.
The DPU programs available to trouble customers include:84
30-Day Waiver/Medical Certification
Social Service Agencies/Vouchers for Payment
Salvation Army
Veterans Assistance
Community Parish Contributions
Statistics for the above-referenced agencies have not been tracked by DPU.85
Late fees for unique contract amounts by year are displayed in Exhibit IV-13.86
Exhibit IV-13 Late Fees
2009 to 2013
Source: Information Response 62
$0.00
$500,000.00
$1,000,000.00
$1,500,000.00
$2,000,000.00
$2,500,000.00
2009 2010 2011 2012 2013

82 Draft Report – For Review and Verification Purposes Only
12/18/2014
Collections
Over the last couple of years, the 12-month average arrears has generally been climbing, although 2013
was lower than other years, as shown in Exhibit IV-14.87
Exhibit IV-14 12-Month Average Arrears
February 2012 to December 2013
Source: Information Response 63
Prior to 2007, once they hit a certain point (if more than $195 balance) most accounts went to collection
agencies. Now, since 2007, they go to collections law firms instead, which is extremely unusual for
utility accounts.
Write-offs
The City-wide write-off policy must be uniform; therefore, currently no policy exists,88 unlike it does in
most utility organizations.
Also, DPU accounts are written off only due to bankruptcies, court orders, or adjustments, not if they
have been determined to be uncollectible by collection law firms.89 Again this is unlike the situation in
most utility organizations.
When accounts are written off, a write-off form is completed with account number, name, service
address, write-off amount, and explanation for write-off. Screen shots of the final balance are attached
to the original write-off form. The form is approved and signed by the Commissioner of Administrative
Services and DPU Director. The form is then given to an Administrative Analyst in the Accounting
Department to record in DPU’s customer account in SAP.90
$0.00
$500,000.00
$1,000,000.00
$1,500,000.00
$2,000,000.00
$2,500,000.00
2009 2010 2011 2012 2013

Draft Report – For Review and Verification Purposes Only 83
12/18/2014
Billing & Records
Finding IV-17 Although the Billing and Water Distribution Collections groups are now
both working to input work orders to SAP, the lack of using electronic
workflow for sending documents, coupled with these groups’ different
locations, results in inefficiencies in workflow activities.
Two different DPU groups are now working to input work orders to SAP, particularly due to the
increased backlog, as discussed in Finding IV-18. The group primarily responsible for these and other
billing activities is the DPU Billing group located at the Ohio Building. Recently the DPU Water
Distribution Collections group, which is located at the Water Distribution facility, added input of
“simple” work orders to their regular duty of developing routes on a daily basis for field workers in the
Water Technicians group.91
When Water Technicians complete a work order, they bring paperwork back to the Water Distribution
facility, which is then sent to the Billing group at the Ohio Building. The Billing group then goes through
the paperwork and sends selected ones, usually “simple” work orders, back to the Collections group at the
Water Distribution facility. Furthermore, imaging of these work orders and using electronic workflow
capabilities (such as can be done with OnBase) to send these documents is not being used.92
This oversight results in inefficiencies due to the need to send this paperwork via interoffice mail.
Moreover, it is more difficult for these two groups to communicate because they are in different buildings.93
Finding IV-18 A large backlog of work order items has resulted in confusion to
customers due to the increased need for re-billing.
The backlog of these work orders during this study was typically six to nine months, which results in
confusion to customers as to the status of their account. In addition, it can increase the extent to which
re-billing is required due to the lag of getting work orders input to SAP.
By October 2014, the backlog was eliminated. Currently the Billing & Records group is working with
the Water Distribution Collections group to ensure that work orders are processed in a timely manner.
Finding IV-19 No standard rules exist for re-billing.
Some of these backlogs include simple items, plus others, such as exchanges and rebills; however, DPU
does not have standard rules for rebilling. This tendency further complicates the situation because
Customer Service Unit agents often do not understand what is occurring when customers call in.94

84 Draft Report – For Review and Verification Purposes Only
12/18/2014
Legal Technicians
Finding IV-20 Each of the Legal Technicians reports directly to the Manager, as do other
groups, without having a Supervisor for their group.
The Legal Technicians within the Utilities Administration organization provide support to City attorneys
assigned to DPU; however, their administrative supervision is provided by the UA Customer Service
Unit Manager. This type of supervision is unusual for a utility organization.95
C. Recommendations
Strategic Planning/Financial Planning
See Chapter IV – Operating Divisions for specific recommendations regarding strategic planning suggestions.
Recommendation IV-1 Improve the annual DPU budgeting process to formally
incorporate detailed goals/objectives/performance measures
included as part of the annual process. (Refer to Finding IV-1 and
Finding IV-2.)
As formal goals/objectives/performance measures for each DPU division are incorporated into the
DPU’s strategic planning processes, as discussed in Chapter IV – Operating Divisions, they should also be
incorporated into the annual budgeting process.
Recommendation IV-2 Require all DPU operating divisions to formally monitor actual-to-
budget financial figures on a monthly basis and provide
explanation to management for any significant variance. (Refer to
Finding IV-3.)
Each of the DPU operating divisions plus the Administrative Services division should be required to
formally monitor actual-to-budget financial figures on a monthly basis. When “significant” variances are
found, detailed explanations should be provided to the Accounting & Financial Analysis group, so they
can be compiled and provided to senior management. Either minimum percentages or dollar limits
should be developed that designate a variance as “significant” and that require comment in their
monthly explanations reporting.
Draft Report – For Review and Verification Purposes Only 85
12/18/2014
Other Financial Management Practices, including SAP Issues
Recommendation IV-3 Work with the City Finance and ICT Departments to expand
DPU’s SAP capabilities. (Refer to Finding IV-4 and Finding IV-11.)
The DPU Accounting & Financial Analysis group should begin formal discussions with the City Finance
and ICT Departments to have expanded SAP capabilities, such as:
Change security features such that DPU can, at a minimum, have access to financial statements
for DPU and each of its divisions directly from the SAP ERP system, without having to
separately format retrieve revenue and expense data and then take both types of data and put
them into a financial statements format.
Implement workflow capabilities in SAP such that designated Accounting & Financial Analysis
employees in DPU can directly make journal entries into SAP, thereby letting the City Finance
Department employee(s) review these entries.
Explore adding server equipment so the Accounting & Financial Analysis group can produce
reports using the SAP ERP data warehouse data. This group’s members would also need to
have training so they know how to produce such reports without having to ask ICT employees
for assistance.
The DPU Utilities Administration group should also begin formal discussions with the ICT Department
to allow more drop-downs within the SAP modules used by the Customer Service Unit agents.
The City of Toledo will need to make additional investments into SAP, including changing procedures,
how the system is configured, and possibly adding equipment, so that changes can be made to address
these issues.
Recommendation IV-4 Establish standard rules for rebilling and provide formal
training not only to Accounting & Financial Analysis employees
but also Customer Service Unit employees who discuss bills with
customers. (Refer to Finding IV-5 and Finding IV-19.)
The DPU Administrative Services organization should develop standard rules for rebilling. Then all
appropriate Accounting & Financial Analysis employees performing the rebilling and all Customer
Service Unit employees explaining bills, including rebilling, to customers should be extensively trained
on this topic.

86 Draft Report – For Review and Verification Purposes Only
12/18/2014
Performance Measurement System
Recommendation IV-5 Establish a formal performance measurement process for all DPU
divisions that supports the Utility’s strategic planning process.
(Refer to Finding IV-6.)
Goals and objectives are being created during the strategic planning process that has been developed as
a part of this project. These will be quantified with specific performance measures to the extent
possible.
Customer Satisfaction
Customer Service Unit
Recommendation IV-6 Have agents contact Supervisors immediately when escalation of
calls is necessary. (Refer to Finding IV-7.)
Rather than having agents complete a paper form that is given to Supervisors for later call back to
customers, which is frustrating to customers, agents should be able to transfer calls immediately to
Supervisors when escalation is necessary.
Recommendation IV-7 Regularly monitor customer calls at least once per week for each
agent. (Refer to Finding IV-8 and Finding IV-9.)
As part of an agent’s ongoing development and training, his or her calls should be regularly monitored
by Supervisors or Team Leaders at least once per week. Currently the Customer Service Unit has one
Supervisor and another Alternative Supervisor (who is also responsible for training agents). To ensure
that proper monitoring of calls is being done, the configuration of the Customer Service Unit should be
reassessed to determine the number of Supervisors needed and to consider the possibility of adding
Team Leader positions to the group.
Also, refer to Finding IV-12 and Recommendation IV-9 for additional discussion regarding training
requirements.
Recommendation IV-8 Modify service request and implementation procedures to improve
customer interactions. (Refer to Finding IV-10.)
Whenever possible, Customer Service Unit agents should schedule service calls on designated days for
the morning or afternoon. Also, in all cases, field workers should be required to call ahead to customers
when they are close to arriving at the customer’s location.
Because communications between the Utilities Administration Manager or Customer Service Unit
Supervisors and Water Distribution management is frequently difficult, formal backup employees should

Draft Report – For Review and Verification Purposes Only 87
12/18/2014
be provided to the Customer Service Unit when discussions with Water Distribution management are
necessary to handle specific scheduling situations.
Recommendation IV-9 Assign at least one dedicated training staff to the Utilities
Administration group to provide regular training to Customer
Service Unit and Billing & Records employees. (Refer to
Finding IV-12.)
Such dedicated staff understand what Customer Service Unit and Billing & Records employees should
be doing to perform their jobs with regard to best practices. It is also especially important that staff
who are trainers have a background in providing training, because training itself is a skill set that is
imperative to this position. Training of these groups should be performed regularly, not just when an
individual assumes a new position. All employees should receive refresher training at least annually or
more frequently when changes occur.
Recommendation IV-10 Integrate DPU billing and water emergency calls into one
Customer Service Unit. (Refer to Finding IV-14.)
Having a CCH group to handle calls for all non-DPU complaints is not an issue; however, having this
group perform DPU water emergency calls, while the DPU Customer Service Unit handles only DPU
billing issues, can confuse DPU customers, reduce staffing efficiency, and increase costs. The DPU
organization, along with other City representatives, should take steps to integrate customer service
functions under the Utilities Administration Customer Service Unit.
Appeals Process
Recommendation IV-11 Incorporate into the Adjustment Committee at least one external
individual who is not part of the DPU service process. (Refer to
Finding IV-15.)
To ensure that bias is not part of the appeals process, DPU should incorporate at least one person who
is not part of the DPU processes into the Adjustment Committee. Most appeal processes for utility
organizations involve both internal employees and external individuals. This involvement by both will
help ensure that bias is not part of the DPU appeals process and also that there is no perception that
bias occurs when the committee makes its decisions.
Collections & Write-Offs
Recommendation IV-12 Perform a formal investigation and study focusing on determining
the costs and benefits of using collection agencies and collection
law firms. (Refer to Finding IV-16.)
One of the concerns that Schumaker & Company has is that use of collection law firms, rather than
collection agencies, for attempting to collect amounts owed by customers that have reached a long-

88 Draft Report – For Review and Verification Purposes Only
12/18/2014
overdue period would be the possibility that the use of collection law firms might be more costly and
not necessarily more beneficial than using collection agencies. Our firm has never seen a utility
organization use collection law firms for collections activities.
Once a formal investigation and study has been done to identify the costs and benefits of each type of
collections organization, if the results show the collections agencies would be a better practice, then
formal changes should be made to convert from collection law firms to collection agencies.
Recommendation IV-13 Develop a formal write-off policy for the DPU organization. (Refer
to Finding IV-16.)
Not only should DPU develop a formal policy for writing off accounts due to bankruptcies, court
orders, or adjustments, but it should also include accounts which, once they have gone to a collections
organization, have been determined to be uncollectible, even though they do not fall into one of these
three categories.
Billing & Records
Recommendation IV-14 Combine the Billing & Records group and the Water Distribution
Collections group into one entity located at the Water Distribution
facility and improve electronic workflow between groups. (Refer to
Finding IV-17 and Finding IV-18.)
The Billing & Records group and the Water Distribution Collections group should be combined into
one group. This combined group should be located at the Water Distribution facility so that group
members can be located close to field workers. This proximity would allow proper interaction, plus it
would improve efficiencies in workflows and reduce the work order backlog. Also, DPU should image
work order documents so electronic workflow can be used for communicating between groups.
Legal Technicians
Recommendation IV-15 Assign a Supervisor who supervises the Legal Technicians and
Clerk currently located in the Utilities Administration group. (Refer
to Finding IV-20.)
Having the Legal Technicians and Clerk report directly to the Utilities Administration Manager causes
this manager to have too many employees reporting directly to her. In addition, she has only
administrative duties with regard to these employees because the City attorneys located close by
provides functional oversight. A Supervisor position should be added, possibly filled by one of the City
attorneys, to supervise these employees. It may also make sense to transfer this group out of the
Utilities Administration group.

Draft Report – For Review and Verification Purposes Only 89
12/18/2014
V. Safety
A. Background & Perspective
The City of Toledo Department of Public Utilities has an Administrator of Public Services (Safety
Administrator) that serves as the safety coordinator. The Safety Administrator reports to the
Commissioner for Administrative Services as shown in Exhibit V-1. There are no additional staff
dedicated to occupational health and safety within the DPU.
Exhibit V-1 DPU Safety Organization
2014
Department of Public Utilities
Director
Administrative Services
Commissioner
Public Services
Administrator
The Safety Administrator supports seven safety committees – one for each division. These committees
are central to assuring occupational health and safety within the organization. The Safety Administrator
also supports works compensation claims management, manages safety training and supports incident
response and water quality issues.
B. Findings & Conclusions
Finding V-1 DPU occupational injury rates exceed comparable industry benchmarks.
Using standard metrics, Schumaker & Company analyzed DPU occupational injury rates and found that
DPU’s safety performance falls far below that of comparable organizations. Benchmarks used were
utilities across the country, municipalities across the country, and water utilities data from the American
Water Works Association (AWWA). In every case, DPU’s safety performance was substantially worse.
To perform any of the standard safety metric calculations it is necessary to know the total number of
hours worked (not paid) by all employees in the organization. Ohio reports data somewhat differently

90 Draft Report – For Review and Verification Purposes Only
12/18/2014
than the standard Occupational Safety & Health Administration (OSHA) numbers. A precise figure for
total DPU employee hours worked was not available (although good data for several of the divisions
was provided). Using the total average full-time equivalent (FTE), adjusted for leave usage and
overtime, we were able to make an estimate of total hours worked that we feel very confident using it to
calculate standard occupational safety metrics.
Perhaps the most basic safety metric is the incidence rate. This measures the total number of reportable
occupation illnesses and injuries and standardizes the figure for organizations of different size. DPU’s
incidence rate for 2013 was 13.5. This was more than twice that of any comparable benchmark group.
Exhibit V-2 provides incidence rate comparisons.
Exhibit V-2 Occupational Injury and Illness Incidence Rate
(Reportable Incidents per 100 Workers) 2012/2013
Source: * Bureau of Labor Statistics, Survey of Occupational Injuries and Illnesses, 2012

Draft Report – For Review and Verification Purposes Only 91
12/18/2014
The incidence rate has fluctuated somewhat over the last three years, but in each year was significantly
higher than benchmark rates. Exhibit V-3 provides the DPU incidence rate for the past three years.
Exhibit V-3 Occupational Injury and Illness Incidence Rate
(Reportable Incidents per 100 Workers) 2011 – 2013
The incidence rate includes first-aid only cases. Although an important safety indicator, a high incidence
rate may reflect aggressive reporting of minor injuries. The day-away, restricted, and transferred
(DART) measures cases with lost work-days and provides insight into the severity of injuries. Here
again, DPU’s safety performance falls far below benchmark measures and is three times as high as any
of the benchmark comparisons. DART rate comparisons are provided in Exhibit V-4.

92 Draft Report – For Review and Verification Purposes Only
12/18/2014
Exhibit V-4 DART Rate
(Day Away, Restricted or Transferred Cases per 100 Workers) 2012/2013
Source: * Bureau of Labor Statistics, Survey of Occupational Injuries and Illnesses, 2012
The American Water Works Association uses total lost days as the key measure of occupational injuries.
Whereas the other measures examined here count the number of cases, this measure looks at lost time.
This is an important measure of both severity and costs. These cases typically incur the highest workers’
compensation medical and indemnity costs on top of the direct and indirect costs associated with lost
work time. This information is summarized in Exhibit V-5.
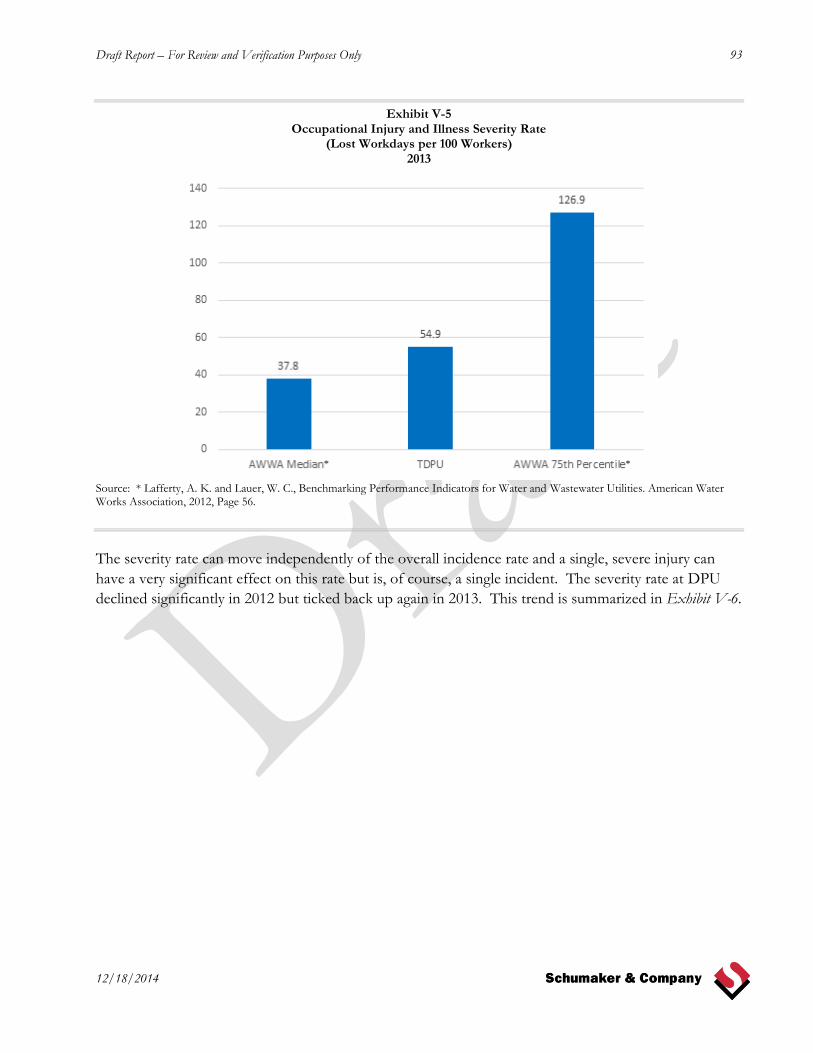
Draft Report – For Review and Verification Purposes Only 93
12/18/2014
Exhibit V-5 Occupational Injury and Illness Severity Rate
(Lost Workdays per 100 Workers) 2013
Source: * Lafferty, A. K. and Lauer, W. C., Benchmarking Performance Indicators for Water and Wastewater Utilities. American Water Works Association, 2012, Page 56.
The severity rate can move independently of the overall incidence rate and a single, severe injury can
have a very significant effect on this rate but is, of course, a single incident. The severity rate at DPU
declined significantly in 2012 but ticked back up again in 2013. This trend is summarized in Exhibit V-6.
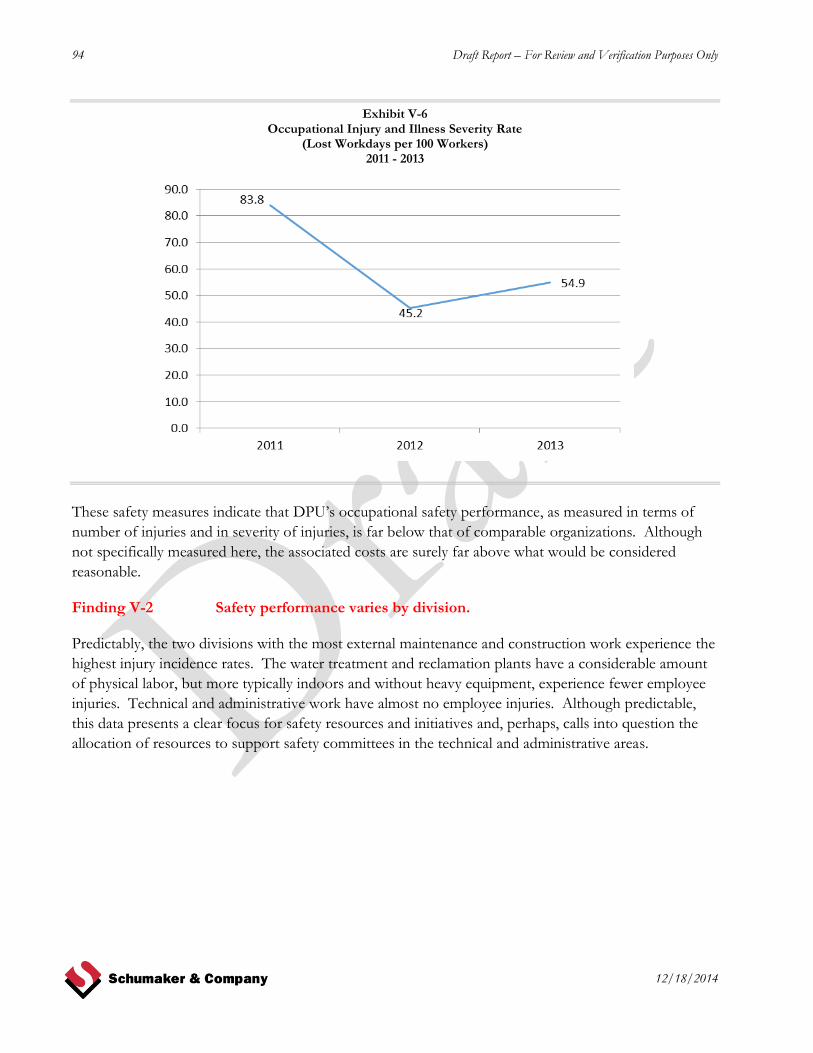
94 Draft Report – For Review and Verification Purposes Only
12/18/2014
Exhibit V-6 Occupational Injury and Illness Severity Rate
(Lost Workdays per 100 Workers) 2011 - 2013
These safety measures indicate that DPU’s occupational safety performance, as measured in terms of
number of injuries and in severity of injuries, is far below that of comparable organizations. Although
not specifically measured here, the associated costs are surely far above what would be considered
reasonable.
Finding V-2 Safety performance varies by division.
Predictably, the two divisions with the most external maintenance and construction work experience the
highest injury incidence rates. The water treatment and reclamation plants have a considerable amount
of physical labor, but more typically indoors and without heavy equipment, experience fewer employee
injuries. Technical and administrative work have almost no employee injuries. Although predictable,
this data presents a clear focus for safety resources and initiatives and, perhaps, calls into question the
allocation of resources to support safety committees in the technical and administrative areas.

Draft Report – For Review and Verification Purposes Only 95
12/18/2014
The incidence rates for each division are provided in Exhibit V-7.
Exhibit V-7 Occupational Injury and Illness Rate By Division
(Reportable Incidents per 100 Workers) 2013
*Based on estimated total employee hours **Based on actual employee hours

96 Draft Report – For Review and Verification Purposes Only
12/18/2014
Exhibit V-8 provides a comparison of severity rates by division. Water Reclamation, with a substantially
lower incidence rate, has the highest severity rate. As mentioned in Finding V-1, the severity rate can be
influenced by a single significant injury in the way the incidence rate is not.
Exhibit V-8 Occupational Injury and Illness Severity Rate by Division
(Lost Workdays per 100 Workers) 2013
** Based on estimated total employee hours * Based on actual employee hours
Finding V-3 Safety performance is not measured and communicated.
Any business improvement initiative requires performance measures. At DPU, safety measures are not
routinely calculated and do not appear to be shared with managers and safety committees. Safety
activities appear to be policy and compliance driven, but are not informed by any data regarding actual
performance. Schumaker & Company believes the relatively poor performance documented in
Finding V-1 reflects the lack of data and drive to improve.
Finding V-4 Safety accountability at the operational level is weak.
A 2010 report by the Water Research Foundation (formerly AWWA Research Foundation) and the U.S.
Environmental Protection Agency (USEPA) found that a lack of accountability for safety and health
programs was a key factor in poor safety performance.96

Draft Report – For Review and Verification Purposes Only 97
12/18/2014
The comparatively poor safety performance of water utilities can be attributed to the widespread lack of
accountability for safety and health program performance. This research provides more evidence that
without leadership accountability, organizations are unlikely to develop organizational structure or to apply
the resources necessary to achieve even average safety performance. An advanced safety and health
culture, i.e., one that places worker safety and health at the top of organizational priorities, is the result of a
sustained leadership commitment to improving worker safety and health. Utilities with top-flight safety
programs realize the benefits of fewer injuries / illnesses, including decreased direct costs of worker’s
compensation and property damage, as well as substantially lower indirect costs associated with lost time
and operating inefficiency. Indirect costs are typically not tracked at water utilities, but have been shown to
exceed direct costs in general industry by several times.
Schumaker & Company believes the lack of accountability is evident at DPU. Although the Director
appears to be very committed to employee safety, we did not see evidence of this at the commissioner
and supervisory level. Front line supervisors appear to believe that the safety staff is accountable for
safety performance. Supervisors (and safety committees, for that matter) are not provided with safety
performance data to drive improvements (as discussed in Finding V-3). The Safety Administrator is
burdened with many other duties and has no staff to support a comprehensive safety program.
A high performing safety culture begins at the top of the organization. Performance data is routinely
collected, consistently analyzed, widely shared, and used to drive improvements. Accidents and injuries
are openly discussed and prevention strategies are identified and implemented. Hazard identification is
widely taught and reporting of work hazards is rewarded. Most of all, senior management is
accountable, visible, and provides the resources necessary for creating a safe work environment.
Finding V-5 DPU operates with insufficient staffing of occupational health and safety
professionals.
There is no accepted standard for safety staffing levels but water utilities are generally considered to be
understaffed.97 Factors such as number of employees, system complexity and age, number of locations
and geographic dispersion, the degree of responsibility the safety office has for policy and procedure
development, the degree to which accountability rests with operating supervisors, and injury experience
are key variables. DPU operates with single occupational safety professional. The large number of
employees, the lack of formalization of occupational health and safety programs, and the relatively poor
safety performance level all point to this being insufficient.
Finding V-6 Safety training and documentation is inadequate.
We appreciate the fact that DPU has provided some safety training and is working to do more. That
said, we found this effort to be limited and insufficiently documented. Training and certifications
records appear to be mostly the responsibility of frontline supervisors. This approach lacks consistency
and does not support adequate needs assessment. It also limits DPU’s ability to document training and
certification when accidents do occur. This has the potential to increase liability exposure.
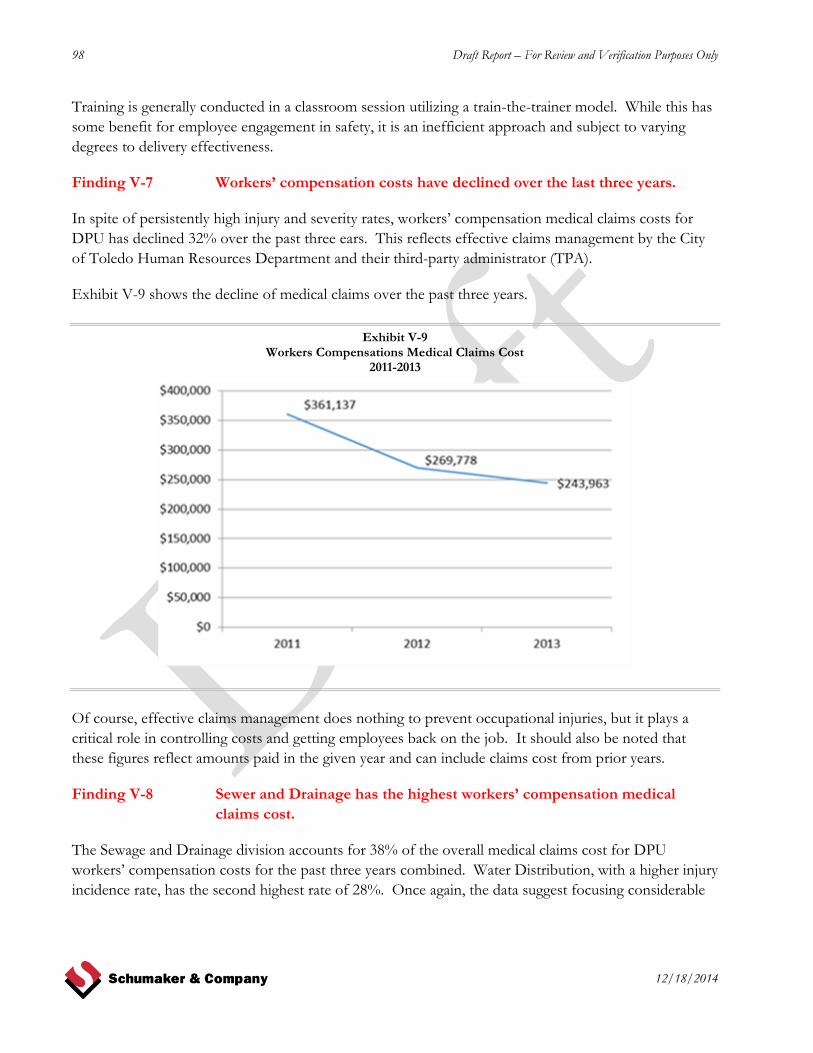
98 Draft Report – For Review and Verification Purposes Only
12/18/2014
Training is generally conducted in a classroom session utilizing a train-the-trainer model. While this has
some benefit for employee engagement in safety, it is an inefficient approach and subject to varying
degrees to delivery effectiveness.
Finding V-7 Workers’ compensation costs have declined over the last three years.
In spite of persistently high injury and severity rates, workers’ compensation medical claims costs for
DPU has declined 32% over the past three ears. This reflects effective claims management by the City
of Toledo Human Resources Department and their third-party administrator (TPA).
Exhibit V-9 shows the decline of medical claims over the past three years.
Exhibit V-9 Workers Compensations Medical Claims Cost
2011-2013
Of course, effective claims management does nothing to prevent occupational injuries, but it plays a
critical role in controlling costs and getting employees back on the job. It should also be noted that
these figures reflect amounts paid in the given year and can include claims cost from prior years.
Finding V-8 Sewer and Drainage has the highest workers’ compensation medical
claims cost.
The Sewage and Drainage division accounts for 38% of the overall medical claims cost for DPU
workers’ compensation costs for the past three years combined. Water Distribution, with a higher injury
incidence rate, has the second highest rate of 28%. Once again, the data suggest focusing considerable
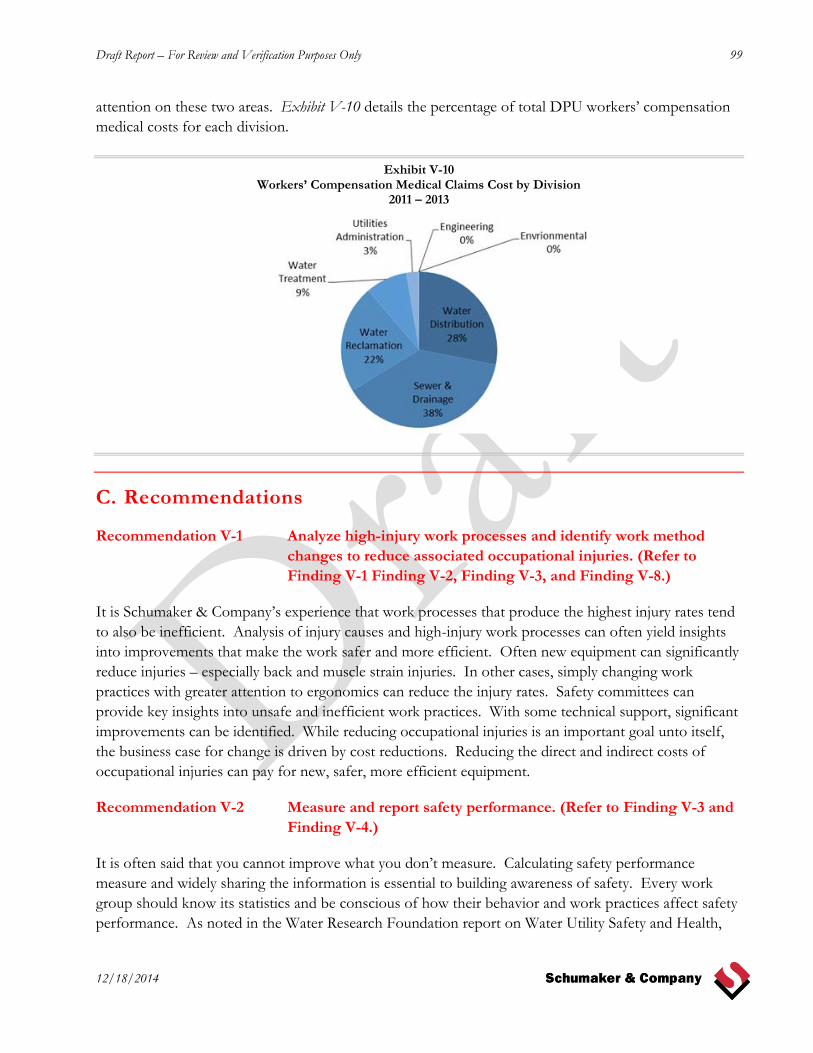
Draft Report – For Review and Verification Purposes Only 99
12/18/2014
attention on these two areas. Exhibit V-10 details the percentage of total DPU workers’ compensation
medical costs for each division.
Exhibit V-10 Workers’ Compensation Medical Claims Cost by Division
2011 – 2013
C. Recommendations
Recommendation V-1 Analyze high-injury work processes and identify work method
changes to reduce associated occupational injuries. (Refer to
Finding V-1 Finding V-2, Finding V-3, and Finding V-8.)
It is Schumaker & Company’s experience that work processes that produce the highest injury rates tend
to also be inefficient. Analysis of injury causes and high-injury work processes can often yield insights
into improvements that make the work safer and more efficient. Often new equipment can significantly
reduce injuries – especially back and muscle strain injuries. In other cases, simply changing work
practices with greater attention to ergonomics can reduce the injury rates. Safety committees can
provide key insights into unsafe and inefficient work practices. With some technical support, significant
improvements can be identified. While reducing occupational injuries is an important goal unto itself,
the business case for change is driven by cost reductions. Reducing the direct and indirect costs of
occupational injuries can pay for new, safer, more efficient equipment.
Recommendation V-2 Measure and report safety performance. (Refer to Finding V-3 and
Finding V-4.)
It is often said that you cannot improve what you don’t measure. Calculating safety performance
measure and widely sharing the information is essential to building awareness of safety. Every work
group should know its statistics and be conscious of how their behavior and work practices affect safety
performance. As noted in the Water Research Foundation report on Water Utility Safety and Health,

100 Draft Report – For Review and Verification Purposes Only
12/18/2014
“the greatest value of metrics in an organization is to drive change and improvement. By far, the most
frequently cited metrics driving change in water utility safety and health programs involved
injury/accident statistics and trends in some form.”98
Recommendation V-3 Recognize and reward good performance. (Refer to Finding V-4.)
High performing organizations with strong safety cultures recognize individuals and groups who work
safely and consistently strive to improve. Safety awards build awareness of safe work practices.
Incentives for meeting goals, like number of days without a lost work day, are another tool to build
awareness. Reward and recognition for employee reporting of work hazards encourages attention and
also communicates that the organization values safety. Obviously to be effective, these incentives need
to be associated with the right equipment and training, but in the end, it is awareness and behavior that
matters most.
Recommendation V-4 Strengthen safety accountability at every level of the organization.
(Refer to Finding V-4.)
Perhaps a statement of the obvious, accountability begins at the top of the organization. Quoting again
form the Water Research Foundation Report; “Without exception, the most important factor for
achieving excellence in water utility safety and health performance is the active participation and high
visibility of senior leadership in driving a safety culture. This can include participation (at least
occasionally) in safety committee meetings, reward and recognition mentioned above, holding others
managers accountable and accepting personal responsibility for poor safety performance. Safety should
become a key element in management performance reviews and have a significant impact on incentive
compensation where appropriate.
Accountability should extend to all levels – but the role of the first line supervisor is critical. Supervisors
give work direction, set priorities and set the standards for behavior on the work site. We recommend
that supervisors whose work group experiences a lost time accident should be required to present the
results of the accident investigation and the remediation plan at a senior management meeting.
Schumaker & Company believes this drives accountability in both directions.
We have certainly tried to emphasize the importance of positive incentives, but we don’t want to
exclude the possibility of discipline as well. Any employee, management of not, found responsible for
unsafe work practices should be subject to discipline within the guidelines of civil service and collective
bargaining agreements.
Overall, safety culture is a reflection of what the organization values. Values are manifested in behavior
and behavior is shaped through rewards and punishment. In other words, culture reflects what we teach.
Building a system of accountability, consistent with training and support will build a strong safety culture
at DPU. This in turn will lead to fewer occupational injuries and dramatically lower costs.

Draft Report – For Review and Verification Purposes Only 101
12/18/2014
Recommendation V-5 Create a safety committee scorecard. (Refer to Finding V-3,
Finding V-4, Finding V-5, and Finding V-6.)
However many safety committees DPU decides to support, it is important to have a way to evaluate
committee effectiveness and to offer support for performance improvement. At minimum, there
should be a scorecard that is produced quarterly. This will provide safety committees with important
feedback and provide an apples-to-apples comparison across the organization. Exhibit V-11 provides a
sample scorecard:
Exhibit V-11 Sample Safety Committee Scorecard Elements
Element Metric(s)
Meeting frequency Number of safety committee meeting held during the
period
Participation level Percent of members present at meetings
Record keeping Agenda and minutes submitted
Hazard Identification and Risk Assessment reports
Training Hours of safety training per employee
Hazard identification
Number of hazards identified Number of recommendations for remediation
implemented
Safe work duration Number of days since a lost work accident
Performance Incidence rate
DART rate Severity rate
Source: Schumaker & Company Experience
Recommendation V-6 Implement a training management system. (Refer to Finding V-6.)
Improving training is essential to creating a strong safety culture and reducing occupational accidents.
Given the limited safety professional staffing at DPU, we recommend, at a minimum, adding an
experienced safety trainer to develop, manage, and deliver training as part of a comprehensive annual
safety improvement plan.
In addition, we recommend the adoption of a training content management, delivery and documentation
system. Several products exist for this purpose. Schumaker & Company is particularly impressed with
Target Solutions (http://www.targetsolutions.com/home).2 This product offers content developed
specifically for water and wastewater utilities. It also allows for the uploading and sharing of practically any
content developed in-house or purchased elsewhere. It also allows for testing and will record employee
training completion and scores. Perhaps most importantly, it has a comprehensive training records system.
This system allows for easy documentation of training and certifications, tracks expirations and notifies
employee and supervisors of pending certification expirations or training refresher requirements. This
2 Schumaker & Company has no relationship with Target Solutions and we are not recommending purchase of this specific system without
appropriate needs assessment and review of multiple vendors.
102 Draft Report – For Review and Verification Purposes Only
12/18/2014
system has the added benefit of being applicable beyond safety training and can be utilized for operating
licensing and other professional certification requirements. This would include competent persons for
confined space entry and excavation.
Recommendation V-7 Hire a least one additional safety professional (Refer to
Finding V-3, Finding V-4, and Finding V-5 and Finding V-6.)
We noted in Finding V-4 that there is no standard for determining occupational health and safety
staffing levels. Factors such as number of employees, system complexity and age, number of locations
and geographic dispersion, the degree of responsibility the safety office has for policy and procedure
development, the degree to which accountability rests with operating supervisors, safety experience are
all to be considered. Depending on how you weight these factors, we would expect a two to three
person occupational health and safety staff for DPU. A degreed industrial hygienist and a training
coordinator (to be shared with other training needs) would be appropriate additions.
Draft Report – For Review and Verification Purposes Only 103
12/18/2014
VI. Operating Divisions
The City of Toledo Department of Public Utilities (DPU) is organized into four operating divisions (not
counting the administrative services division, which is covered in a separate chapter), specifically:
Water Treatment
Water Distribution
Sewer & Drainage
Water Reclamation
Each of these divisions is responsible for certain aspects of water treatment through the reclamation
process and each is briefly discussed in the background section that follows.
A. Background & Perspective
Water Treatment
Water Treatment personnel manage a system that produces 26 billion gallons of high-quality drinking
water per year for an estimated 500,000 people in the greater metropolitan Toledo area, including Lucas
County and portions of Wood, Fulton, and Monroe Counties. The Collins Park Water Treatment Plant
uses surface water drawn from Lake Erie as its source. Plant operations purify and transport an average
of 73 million gallons per day (MGD) with a capacity of 120 MGD to enhance the lives of residents and
to support business and industry.99
Organization
The Water Treatment organization is shown in Exhibit VI-1.100

104 Draft Report – For Review and Verification Purposes Only
12/18/2014
Exhibit VI-1 Water Treatment Organization
as of December 31, 2012
Source: Information Response 2
Water Treatment 2013 Highlights
During 2013, Water Treatment provided an uninterrupted supply of potable, high-quality, good-tasting
water 24 hours per day, seven days a week for 365 days of the year to 500,000 consumers. The division
continues implementation of the 20-year Master Plan for the Collins Park Water Treatment Plant,101
concentrating on site-specific actions required by the Ohio Environmental Protection Agency (EPA).
These efforts are undertaken to maintain and enhance DPU’s ability to serve Toledo and the
surrounding population and industries with superior award-winning water. 102
To remain in compliance with new EPA mandates, DPU is expanding and improving it present
capabilities to meet new and more stringent testing requirements. Toledo Department of
Public Utilities has identified multiple projects to increase redundancy and efficiency and has
secured $190 million in funding to implement the first phase of the improvements.
TDPU
Commissioner
Plant Operations
TDPU
Administrator
Public Services
TDPU
Secretary
TDPU
Supervisor
Maintenance
27 (+9 Vac)
TDPU
Supervisor WT Maintenance
Maintenance
5 (+2 Vac)
TDPU
Supervisor - Instrumentation
Electrical
6 (+1 Vac)
TDPU
Senior Prof Engineer
Engineering
5
TDPU
Administrative Operations Officer
Administrative32 (+4 Vac)
TDPU
Admin Public Services
Operations

Draft Report – For Review and Verification Purposes Only 105
12/18/2014
To complete the construction phase, which expands the area and capabilities of the lab, DPU is
in the process of installing new equipment.
Outside contracts have been entered into for assistance with construction services to implement
the 20-year Master Plan.
Projects under design, in construction, or completed in 2013 at a cost of more than $28 million
include:
- Water Treatment Main Building and Roof Rehabilitation
- Chlorine Disinfection Facility
- Sedimentation Basin Access Hatch Rehabilitation
- Chemical Feed Improvements
- Heatherdowns Pumping Station Rehabilitation
- Spent Lime Lagoon Cleaning
Water Treatment 2014 Goals
Numerous projects identified in the 20-year Master Plan have been or are being designed and built.
Systematic capital improvements to the plant and making major improvements to the pumping stations
are major goals for 2014. A detailed construction schedule was be developed and agreed upon by the
Ohio EPA and the City of Toledo by February 2014. 103
Continue to meet each and every deadline imposed by the Ohio EPA to comply with the
deficiency letter and the sanitary survey mandates.
In 2014, DPU will complete training and certification of current and new chemists, including
cross-training individuals in various disciplines and certification to enhance the DPU’s
compliance and flexibility. This last phase should be completed by August of 2014.
Continue with the apprenticeship program for the skilled trades positions and the shadowing
program for the administrative positions.
Due to requirements for the Journeyman status to fill skilled trades positions, develop an
apprenticeship program to fill these positions from within DPU’s system.
Continue to work with Owens Community College to implement this formal apprenticeship
program to full scale by December 31, 2014.
Water Distribution
The Water Distribution division’s professional employees are responsible for the maintenance and repair
of 1,188 miles of water mains and 10,430 fire hydrants located in the City of Toledo water distribution
system. Additionally they read approximately 135,000 meters on a quarterly or monthly basis, and they
repair, replace, and install water meters daily.104

106 Draft Report – For Review and Verification Purposes Only
12/18/2014
Organization
The Water Distribution division is composed of seven different sections and has a staffing level of
about 140 employees, as shown in Exhibit VI-2. A satellite maintenance section from Fleet and
Facilities and the Call City Hall Call Center are housed at Water Distribution. 105
Exhibit VI-2 Water Distribution Organization
as of June 30, 2014
TDPU
Commissioner
Field Operations
12
TDPU
Manager
Call City Hall
130 (+23 Vac)
TDPU
Manager
Water Distribution
36 (+ 4 Vac)
TDPU
Administrator
Water Distribution
17 (+2 Vac)
TDPU
Field Services
12 (+1 Vac)
TDPU
Collections
6 (+1 Vac)
TDPU
Accounting
3 (+1 Vac)
TDPU
Engineering
90 (+17 Vac)
TDPU
Administrator
Water Distribution
75 (+11 Vac)
TDPU
Tapping and Construction
15 (+6 Vac)
TDPU
Meter Shop
Source: Information Response 2
Each of the major areas is briefly described in the following section.
Tapping & Construction – The Tapping and Construction section is responsible for the maintenance
of the water distribution system including the village of Berkey. This responsibility encompasses main
repairs, service repairs, valve repairs and replacements, and hydrant maintenance and replacements. The
team members perform any new private development connections to the distribution system along with
the connecting and re-tapping service lines on new water line installations. They also perform service
repairs, new service taps, and re-taps in Lucas County. Also included with the maintenance of the
system is the surveying of the water lines for possible leaks and breaks that do not surface. 106

Draft Report – For Review and Verification Purposes Only 107
12/18/2014
Tapping & Construction section statistics:
2010 2011 2012 2013
Water Main Breaks 442 287 330 291
Valves Operated 1,222 4,216 3,186 1,636
Landscaping 1,363 1,667 1,556 358
Repair Hydrant 853 326 364 198
Collections Turn-Offs 676 412 625 213
Curb Boxes Dug Up & Put in Shape
409 409 439 518
Large/Fire Taps 45 26 24 14
Small Taps 261 119 91 136
Services Killed 497 372 606 64
Valves Replaced 13 32 45 16
Surveyed Water Lines for Leaks (in miles)
185.9 97 325 148.9
Hydrants Operated 9,670 13,560 13,650 10,829
Water Emergency Responses
6,638 7,346 8,212 5,967
Engineering – The Engineering section is responsible for inspection of private water line installations,
large meter settings (3” and above), and backflow preventers. Its team members also perform hydrant flow
tests to determine the pressure and amount of flow in various areas of the distribution system. In addition,
they are in charge of the Boil Advisory Program and the Backflow Prevention Program. The Engineering
section is also responsible for maintaining the existing distribution system to the Ohio EPA standards.
This responsibility includes working with the Division of Engineering Services on water construction
standards and new water line construction projects. The Engineering staff serves as the liaison between
large project contractors and the division’s Tapping and Construction section. The Engineering section
performs the major role of Cityworks’ setup, implementation, and training for all divisions.107
108 Draft Report – For Review and Verification Purposes Only
12/18/2014
Engineering section statistics:
2011 2012 2013*
Projects Completed 20 13 19
Private Waterline Installations
21 34 25
Large Meter and Backflow Preventer Inspections
12 36 19
Hydrant Flow Tests 35 40 39
Boil Advisories 226 183 193
*2013 figures are through 11/19/13
Meter Shop – The Meter Shop is responsible for the installation, replacement, and removal of water
meters within the water distribution system. Additionally, employees of this section perform the duties
of turning on and water service and making repairs to City of Toledo equipment that may already be
installed at a customer’s location. A 30-day tag procedure on exchange orders was implemented to
provide the customer with ample time to make the needed repairs and avoid disconnection. 108
Meter Shop statistics:
2010 2011 2012 2013*
Radio Transmitters Installed 4,088 6,393 4,620 7,184
Completed Work Orders 16,291 17,627 17,719 17,654
Water Meters Tested to American Water Works Association (AWWA) Standards
540 665 1,061 1,152
Hydrants Rented 156 167 185 141
*2013 figures are through 11/19/13
Meter Reading & Inspection – The Meter Reading & Inspection section is responsible for all data
collection, both manual and automated, for some 135,000 residential and commercial water meters
located throughout the City of Toledo’s water distribution system. This section responds to all
customer inquiries, complaints, and concerns with regard to water meters. Additionally, Meter Reading
& Inspection is responsible for enforcing the Department of Public Utilities’ rules and regulations
inclusive of small and large meter regulations; domestic, irrigation, and process metering regulations; and
new service line installations. StreetSync routing software is used to efficiently and effectively plan
Meter Reading & Inspection routes. 109
Draft Report – For Review and Verification Purposes Only 109
12/18/2014
Meter Reading & Inspection statistics:
2011 2012 2013
# of Reads 523,025 490,514 395,140
Inspection Performed 3,803 4,513 2,757
Call City Hall – Call City Hall is operated 24 hours per day, 365 days per year and is promoted as the
number where citizens can reach city services, report nuisance issues, convey concerns, offer
suggestions, or obtain general information on all city departments and divisions including the Mayor’s
Office, the Department of Public Service, the Department of Public Utilities, and the Department of
Inspection. Call City Hall also provides referrals to Lucas County for citizens needing the dog warden,
marriage licenses, birth certificates, or the Auditor’s Office. In 2013 Call City Hall received 90,639 calls,
making 19,937 database entries. 110
Call City Hall 2014 goals area as follows:
Provide superior customer service to the citizens of Toledo.
Ensure information provided to City departments is highly accurate.
Promote increased communication from City divisions to Call City Hall.
Sewer & Drainage Services
Sewer & Drainage Services (SDS) operates and maintains the sanitary sewer, storm sewer, and ditch
drainage systems for the City of Toledo. The Sewer & Drainage Services division is responsible for the
following items. 111
Annual Budget Total – $18,189,835.16
Sanitary Sewer Miles – 1,100
Storm Sewer Miles – 986
Open Ditch Miles – 64
Enclosed Ditch Miles – 32
Funded Full Time Equivalents (FTEs) – 140
Organization
The group is organized as shown in Exhibit VI-3. There are approximately 115 individuals assigned to the
Sewer & Drainage Services area. They are organized into four major sections as shown in Exhibit VI-3. 112
Administrative
Engineering and Inspection
Construction
Cleaning
- Sewers Maintenance
- Ditch Maintenance

110 Draft Report – For Review and Verification Purposes Only
12/18/2014
Exhibit VI-3 Sewer & Drainage Services
as of June 30, 2013
TDPU
Commissioner
Sewage And Drainage Services
115 (+9 Vac)
TDPU
Manager
6 (+1 Vac)
TDPU
Administrative Section
13 (+2 Vac)
TDPU
Engineering Section
6 (+1 Vac)
TDPU
Tele-Inspection
4 (+1 Vac)
TDPU
Inspection Section
46 (+2 Vac)
TDPU
Construction Section
11 (+1 Vac)
TDPU
SC&M Zone 1
11 (+1 Vac)
TDPU
SC&M Zone 2
12
TDPU
SC&M Zone 3
11
TDPU
City Wide
49 (+4 Vac)
TDPU
Cleaning Section
7 (+ 2 Vac)
TDPU
Zone 1 N&E
9
TDPU
Zone 2 West
9 (+ 1 Vac)
TDPU
Zone 3 South
11 (+ 1 Vac)
TDPU
Zone 4 City Wide
12
TDPU
Ditches
3
TDPU
Building Support
Source: Information Request 2
Each of these sections is briefly discussed below.
Administration – Manages the budget and provides administrative support to field personnel with
clerical tasks, payroll duties, supplies and material, maintenance of physical facilities, and maintenance of
equipment. 113
Engineering & Inspection – Provides direct support to field personnel engaged in the cleaning and
repair of storm and sanitary sewers. The section also does CCTV (closed circuit television) inspection
of the system, which assists in the diagnosis of problems and maintenance of the system. The section
Draft Report – For Review and Verification Purposes Only 111
12/18/2014
inspects private and contractual city repairs as well as water and sewer taps and kills. Its activities for
2013 included: 114
Sanitary Repairs, Main – 15
Sanitary Repairs, Lateral – 127
Storm Repairs, Lateral – 2
Sewer Kills – 613
Sanitary Taps – 82
Storm Taps – 64
Cleaning – Holds responsibility for maintaining the sanitary and storm sewer drainage system by
routinely cleaning the system’s sewer lines, cross-overs, catch basins, and inlets in the public right of
way. In 2013, this section’s activities resulted in the following actions: 115
Sanitary Footage – 1,555,379 linear feet cleaned
Storm Footage – 101,056 linear feet cleaned
Basins, Inlets, and Manholes Cleaned – 4,803
Basement Flooding Private – 1,279
Basement Flooding Main Plugged – 272
Basement Flooding Overload – 43
Construction – Holds responsibility for the repair of the sanitary and storm sewer drainage system
located within the public right of way. This section replaces and rebuilds damaged lines, catch basins,
and inlets. The following activities were performed in 2013: 116
Sanitary Repairs, Main – 45
Sanitary Repairs, Lateral – 220
Storm Repairs, Main – 76
Storm Repairs, Laterals – 7
Water in the Basement – 122
Inlet Repairs – 29
Ditch Maintenance – Maintains the proper flow of the City’s open ditch drainage system. This section
removes blockages and trees and repairs erosion and obstructions from storm inlets, basins, and cross-
overs in the public right of way. Its activities for 2013 included: 117
Removal of Major Blockages: Swan Creek, Half Way Creek, and Silver Creek
Major Dredging Projects: Peterson Ditch, Shantee Creek, Van Gunten Ditch, and Smith Ditch
Erosion Control: Hill Ditch, Shantee Creek, and Brock Ditch
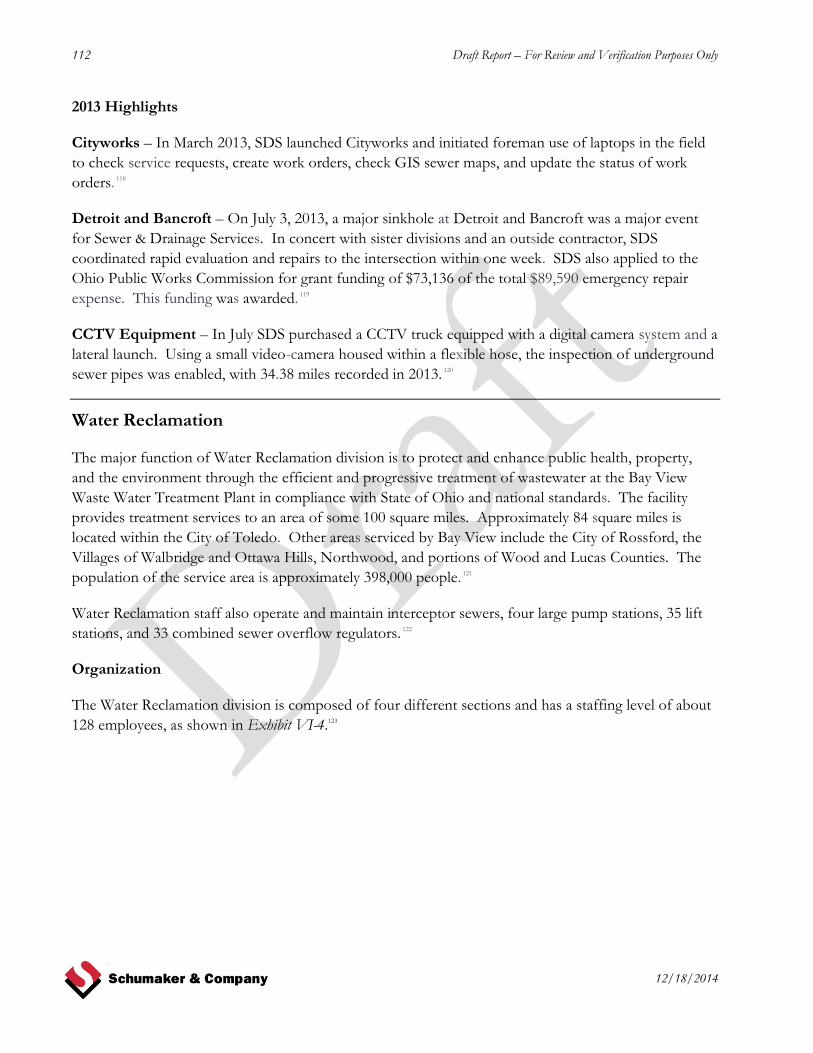
112 Draft Report – For Review and Verification Purposes Only
12/18/2014
2013 Highlights
Cityworks – In March 2013, SDS launched Cityworks and initiated foreman use of laptops in the field
to check service requests, create work orders, check GIS sewer maps, and update the status of work
orders. 118
Detroit and Bancroft – On July 3, 2013, a major sinkhole at Detroit and Bancroft was a major event
for Sewer & Drainage Services. In concert with sister divisions and an outside contractor, SDS
coordinated rapid evaluation and repairs to the intersection within one week. SDS also applied to the
Ohio Public Works Commission for grant funding of $73,136 of the total $89,590 emergency repair
expense. This funding was awarded. 119
CCTV Equipment – In July SDS purchased a CCTV truck equipped with a digital camera system and a
lateral launch. Using a small video-camera housed within a flexible hose, the inspection of underground
sewer pipes was enabled, with 34.38 miles recorded in 2013. 120
Water Reclamation
The major function of Water Reclamation division is to protect and enhance public health, property,
and the environment through the efficient and progressive treatment of wastewater at the Bay View
Waste Water Treatment Plant in compliance with State of Ohio and national standards. The facility
provides treatment services to an area of some 100 square miles. Approximately 84 square miles is
located within the City of Toledo. Other areas serviced by Bay View include the City of Rossford, the
Villages of Walbridge and Ottawa Hills, Northwood, and portions of Wood and Lucas Counties. The
population of the service area is approximately 398,000 people. 121
Water Reclamation staff also operate and maintain interceptor sewers, four large pump stations, 35 lift
stations, and 33 combined sewer overflow regulators. 122
Organization
The Water Reclamation division is composed of four different sections and has a staffing level of about
128 employees, as shown in Exhibit VI-4.123
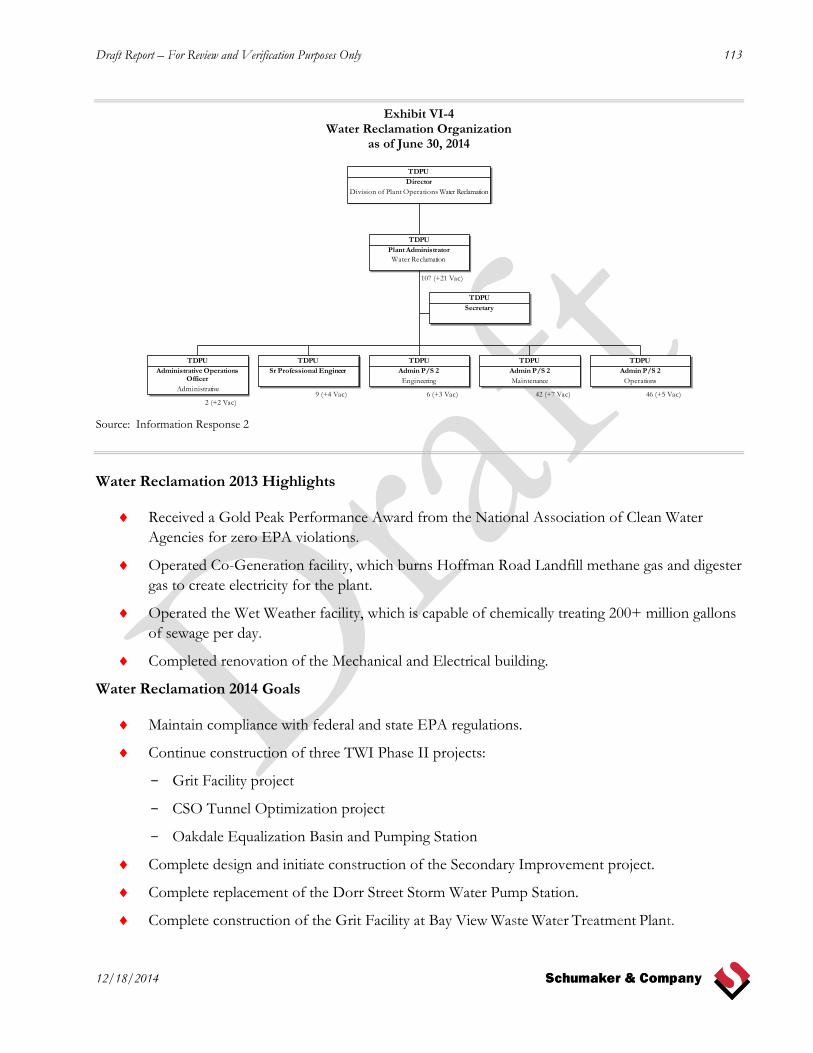
Draft Report – For Review and Verification Purposes Only 113
12/18/2014
Exhibit VI-4 Water Reclamation Organization
as of June 30, 2014
TDPU
Director
Division of Plant Operations Water Reclamation
107 (+21 Vac)
TDPU
Plant Administrator
Water Reclamation
TDPU
Secretary
2 (+2 Vac)
TDPU
Administrative Operations Officer
Administrative9 (+4 Vac)
TDPU
Sr Professional Engineer
6 (+3 Vac)
TDPU
Admin P/S 2
Engineering
42 (+7 Vac)
TDPU
Admin P/S 2
Maintenance
46 (+5 Vac)
TDPU
Admin P/S 2
Operations
Source: Information Response 2
Water Reclamation 2013 Highlights
Received a Gold Peak Performance Award from the National Association of Clean Water
Agencies for zero EPA violations.
Operated Co-Generation facility, which burns Hoffman Road Landfill methane gas and digester
gas to create electricity for the plant.
Operated the Wet Weather facility, which is capable of chemically treating 200+ million gallons
of sewage per day.
Completed renovation of the Mechanical and Electrical building.
Water Reclamation 2014 Goals
Maintain compliance with federal and state EPA regulations.
Continue construction of three TWI Phase II projects:
- Grit Facility project
- CSO Tunnel Optimization project
- Oakdale Equalization Basin and Pumping Station
Complete design and initiate construction of the Secondary Improvement project.
Complete replacement of the Dorr Street Storm Water Pump Station.
Complete construction of the Grit Facility at Bay View Waste Water Treatment Plant.

114 Draft Report – For Review and Verification Purposes Only
12/18/2014
B. Findings & Conclusions
Finding VI-1 There is no overall integrated strategic plan or strategic planning process.
One of the expectations of a well-run water utility would be the existence of a thorough, integrated
strategic plan and strategic planning process. DPU has developed various plans on an as-needed basis,
such as the: 124
Collins Park Water Treatment Plant 20-Year Master Plan and Needs Assessment
Wastewater Treatment Plans
However, there is not an ongoing strategic planning process in place at DPU. As part of the extensive
benchmarking undertaking in 2013, the preliminary steps for creating a strategic plan and strategic
planning process were performed; however, the effort was terminated prior to completion. During that
timeframe three versions of a Strengths, Weaknesses, Opportunities, and Threats (SWOT) analysis were
developed and some preliminary missions, visions, services, and goals and objectives were created but
the effort was cancelled. Some of the individual divisions had developed goals and objectives but
nothing has been created from the top to institutionalize this process. 125
Finding VI-2 Field and plant activities appear appropriate, although there are
opportunities for improvement in two areas in particular (discussed in
subsequent findings).
Schumaker & Company consultants visited areas from which field crews are dispatched and also rode
with supervisors to observe operations in the field (i.e., primarily for water distribution and sewerage
and drainage personnel). We also visited each water reclamation and water treatment plant, toured their
facilities, and conducted interviews. With the exception of the water treatment plant, which is currently
in some disarray from the ongoing construction, all of the field facilities appeared well organized and
very functional. All facilities are secured via a security gate and/or guard personnel. The plants typically
have guard personnel whereas the field depots are secured via security gates that require a key code to
operate. Most facilities have sufficient space for DPU personnel to park their personal vehicles behind
the security perimeter. Most of the DPU vehicles and equipment can be stored in a covered building
with some level of heat available, such that the vehicles can be started during winter conditions. Most of
the materials and equipment inventory is also stored inside, with only some items (shoring boxes) stored
outside, but everything is contained within the security perimeter. The facilities appeared to be generally
well maintained. 126
Finding VI-3 Cityworks has been implemented to some level of success throughout
DPU.
The level of implementation of Cityworks (a geographic work order system for managing activities)
varies among the four divisions as summarized in Exhibit VI-5. 127
Draft Report – For Review and Verification Purposes Only 115
12/18/2014
Exhibit VI-5 Status of Cityworks Implementation
as of July 31, 2014
Source: Schumaker & Company Analysis
Cityworks is a tool that can be used to more effectively manage all maintenance activities in the field and
in the plants. However, it is currently only partially implemented within DPU. The left-hand column of
Exhibit VI-5, lists some of the key features that are necessary for managing effective maintenance. Each
of the divisions is displayed for each of the columns and an assessment of the degree to which the key
element has been implemented within that division, using a simple yes/no/some designation, is
provided. In short, the Water Distribution division is furthest along in an effective maintenance system
whereas Water Reclamation’s implementation has stalled, and Water Treatment has not even begun. As
old as the Water Treatment plant is, there is no longer even a card (manual system) at the facility. The
system has been installed in Water Reclamation but it is not currently being used to manage preventive
maintenance. 128
Finding VI-4 Multiple organizations and narrow job definitions reduce deployment
flexibility and increase costs.
DPU has organized its field forces into various specialized groups with somewhat narrow job
definitions. For example, there are opportunities within Water Distribution and the plants to combine
some job classifications to provide greater workforce flexibility. 129
In many utilities that we have observed, these activities are performed by one individual—a field service
technician who can read meters. The only specialized group that exists within those organization is one
related to large meter installation and testing—which is a more specialized craft.130
In general, narrow job definitions and task assignments drive larger crews and inefficiencies in staffing.
One of the primarily nonproductive times in the field is windshield time or travel time. Various
techniques have been used to minimize travel time, such as the assignment of technicians to districts
(geographic territories) and GPS routing; however, another often overlooked improvement is an in-
depth look at reorganizing the job definitions and creating more flexibility in how and by whom the
work can be performed. 131
Key Elements of Maintenance Systems
Water Distribution
Divison
Sewer and Drainage
Divison
Water Reclamation
Divison
Water Treatment
Divison
Equipment Database Yes Yes Yes No
Equipment Histories Yes Yes No No
Materials Inventory Yes Yes Yes No
Work Order Generation Yes Yes Yes No
Preventive WO Yes Yes No No
Use for Maintenance Planning No No No No
Field Forces Computer Usage Some No No No
Use of Maintenance Records For Analysis No Some No No

116 Draft Report – For Review and Verification Purposes Only
12/18/2014
There are several utilities that have undertaken thorough reviews of job definitions (classifications) and
that have significantly reduced the number of positions while also increasing workforce flexibility. 132
City of Ann Arbor Water and Wastewater Operations – The original project was limited to the water
utility and was intended to: 1) accommodate the effects of an early retirement program and 2)
achieve permanent staffing reductions and operational efficiencies. Working with union and
management design teams, operations and mechanic jobs were combined into a single
classification. This classification is divided into five levels with each level having progressively
higher licensing and competency requirements. Using the combined classification, the water
treatment plant now operates with five fewer employees, including one less supervisor. This
staffing reduction has produced an annual operating cost reduction of more than $300,000.
Similar results were achieved in the wastewater treatment plant. In short the total number of
separate job classifications was reduced.
Detroit Water and Sewerage Department (DWSD) – DWSD is in an era of significant organizational
change in an effort to control rates charged to customers, achieve long-term financial
sustainability, and continue to provide quality services to its customers. In 2012, an
optimization assessment identified significant opportunities to modernize technology,
streamline business processes, and redeploy the workforce. In 2013, newly designed, broad-
banded jobs were created that will enable the workforce to go from 257 job classifications to
approximately 57 classifications. Pilots of the new business processes and job designs are
currently in process throughout the customer service, field, water, and wastewater operations.
Finding VI-5 One area where DPU has excelled is with respect to its use of commercial
driver’s licenses (CDLs).
In some utilities, crews sometimes stand down due to the unavailability of heavy equipment operators
and inability to upgrade from a lower classification. The result is lost crews or overstaffed crews. DPU
has created leveled classifications and has incentivized individuals to obtain CDL designation and other
skills that would create a more flexible and efficient organization. Furthermore, the driver of the vehicle
is a working crew person on the job. 133
Finding VI-6 Crew sizes appear reasonable.
With respect to crew sizes, all utilities are reducing the size of their crews. DPU has many one- and
two-man crews but it also had three- and four-man crews. The purpose behind reducing crew sizes is to
create more efficient crews to match the work. The truck sizes appear reasonable, with smaller crew
sizes supporting smaller vehicles (meaning fewer personnel to carry). If more people are needed for a
particular job, crews can be combined. 134
Draft Report – For Review and Verification Purposes Only 117
12/18/2014
Finding VI-7 Performance measures have not been developed based on installed
systems.
There are a limited number of productivity measures and they do not appear to drive performance
improvement. For instance, we did not see any performance measures against a target. One of the key
management systems used within the operating divisions is the Cityworks software. The reporting
capabilities of Cityworks have not been developed to the extent possible. The software has been
installed in each operating division and has been implemented to a varying extent; however, a greater
benefit could be achieved if some key management reports/dashboards were created to leverage the use
of Cityworks. These concepts are further described in our recommendations. 135
Finding VI-8 The fleet mix appears reasonable, although there are some older vehicles.
Most of the DPU vehicles and equipment can be stored in a covered building with some level of heat
available such that the vehicles can be started during winter conditions. DPU has crew vehicles with on-
board compressors, which has become a characteristic of the industry (as opposed to having a tow-
behind compressor). A fair number of vacuum trucks are available for cleaning sewer facilities, multiple
camera (CCTV) trucks exist for videotaping sewers, and specialized equipment, such as the Menzi Muck
Spider all-terrain excavator, has been procured. The Spider is a piece of equipment that mows, dredges,
trims trees, and picks up logs from waterways then loads them in trucks for disposal. 136
Finding VI-9 Facilities appear well maintained and not crowded (except maybe Water
Treatment, which is in a state of construction).
Schumaker & Company consultants visited each of the division’s facility locations to tour them, to
conduct interviews of both management and labor personnel, and to observe management practices and
procedures. In addition, we went “out in the field” or “into the plant” to observe activities and to
conduct standup interviews with field and plant personnel. 137
Most of the materials and equipment inventory is also stored inside, with only some items (shoring
boxes) stored outside, but everything is contained within the security perimeter. In general, we found
the facilities to be well organized. All of the facilities are well maintained and have sufficient room for
ongoing operations. The only possible exception is the Water Treatment facility, which is undergoing
extensive construction at this time, making organization and maintenance a more challenging issue. 138
Finding VI-10 Property security is reasonable.
All facilities are secured via a security gate and/or guard personnel. The plants typically have guard
personnel whereas the field depots are secured via security gates that require a key code to operate.
Most facilities have sufficient space for DPU personnel to park their personal vehicles behind the
security perimeter. 139

118 Draft Report – For Review and Verification Purposes Only
12/18/2014
Finding VI-11 There are good basic systems in place (GIS & Cityworks) that need to be
further developed for management of activities.
DPU has developed a geographic information system (GIS) based on what is becoming an industry
standard GIS. The Environmental Systems Research Institute (Esri) is an international supplier of GIS
software, web GIS, and geodatabase management applications. Esri products (particularly ArcGIS
Desktop) have 40.7% of the global market share. By 2002, Esri had approximately a 30% share of the
GIS software market worldwide, more than any other vendor. 140
More recently, within the last several years, DPU has added Cityworks as a work order management
system. It is somewhat unique in that it handles both service requests and work orders. It also
integrates with the Esri GIS such that when viewing a work order it will also present a geographical
depiction of the particular facility or equipment on a screen map. 141
Much of the implementation of both products has been handle by personnel in Water Distribution and
Engineering Services. However, more work is needed for each division to begin to use these systems
for management purposes.142
Finding VI-12 The main replacement program has not yet achieved positive results.
DPU uses a point system similar to other water and gas utilities to determine which mains get replaced.
The Water Capital Improvement Plan includes $10 million per year for water main replacement. These
earmarked funds are designed to provide for approximately 12.4 miles of 8”-diameter main replacement.
This corresponds to a little over 1% of the system, which provides for less than a 100-year replacement
cycle. The City is using a 100-year expected useful life for water mains. Water mains are prioritized for
replacement based on a point scale that considers factors such as year constructed, ongoing road
projects, number of main breaks, age, corrosion potential, etc. Projects are then selected from this list in
priority order to come up with each year’s replacement program. This list is further refined to take into
account the roadway improvement plan and condition of the roads.143 The results of this program do
not show the desired downward trend in breaks (ideally this would be in breaks per mile) of main, as
shown in Exhibit VI-6. With the extremely cold winter of 2013–2014, it would be expected that the
number of breaks would continue to increase. It is too early to tell if the increase in spending on main
replacement is having the desired effect or if more money will be required to reverse the upward trend
shown in Exhibit VI-6.144
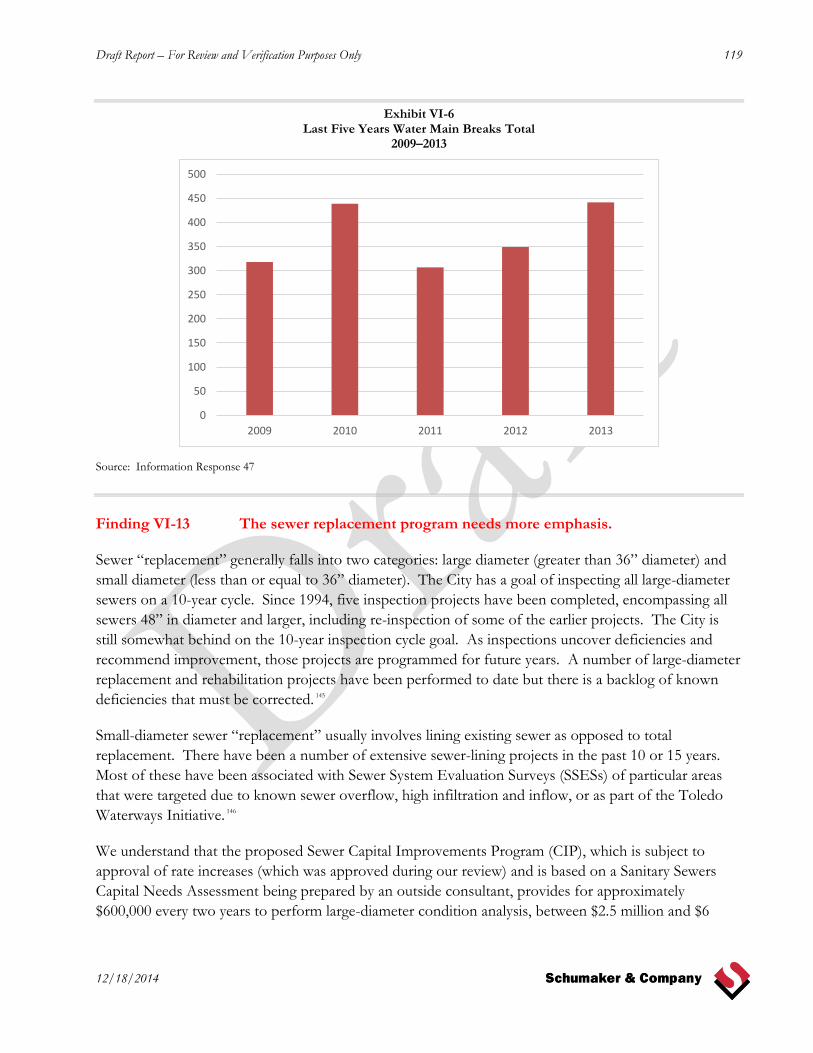
Draft Report – For Review and Verification Purposes Only 119
12/18/2014
Exhibit VI-6 Last Five Years Water Main Breaks Total
2009–2013
Source: Information Response 47
Finding VI-13 The sewer replacement program needs more emphasis.
Sewer “replacement” generally falls into two categories: large diameter (greater than 36” diameter) and
small diameter (less than or equal to 36” diameter). The City has a goal of inspecting all large-diameter
sewers on a 10-year cycle. Since 1994, five inspection projects have been completed, encompassing all
sewers 48” in diameter and larger, including re-inspection of some of the earlier projects. The City is
still somewhat behind on the 10-year inspection cycle goal. As inspections uncover deficiencies and
recommend improvement, those projects are programmed for future years. A number of large-diameter
replacement and rehabilitation projects have been performed to date but there is a backlog of known
deficiencies that must be corrected. 145
Small-diameter sewer “replacement” usually involves lining existing sewer as opposed to total
replacement. There have been a number of extensive sewer-lining projects in the past 10 or 15 years.
Most of these have been associated with Sewer System Evaluation Surveys (SSESs) of particular areas
that were targeted due to known sewer overflow, high infiltration and inflow, or as part of the Toledo
Waterways Initiative. 146
We understand that the proposed Sewer Capital Improvements Program (CIP), which is subject to
approval of rate increases (which was approved during our review) and is based on a Sanitary Sewers
Capital Needs Assessment being prepared by an outside consultant, provides for approximately
$600,000 every two years to perform large-diameter condition analysis, between $2.5 million and $6
0
50
100
150
200
250
300
350
400
450
500
2009 2010 2011 2012 2013
120 Draft Report – For Review and Verification Purposes Only
12/18/2014
million per year for large-diameter sewer replacement and rehabilitation, and $2 million per year for
small-diameter sewer lining. The large-diameter program will continue to strive for the 10-year
inspection cycle, followed up with correction of identified deficiencies. The small-diameter program will
address sewer deficiencies uncovered through tele-inspection by the Sewer & Drainage division or under
contract by the Engineering Services division. These tele-inspection programs target areas of known
basement backups and sewers under roadways that are planned for reconstruction. A special emphasis
will be made to address 24” brick sewers, which have been a chronic source of sewer cave-ins.147
C. Recommendations
Recommendation VI-1 Initiate a formal annual strategic planning process. (Refer to
Finding VI-1.)
An ongoing strategic planning process needs to be implemented, one that leverages off some of the
earlier work discussed in Finding VI-1 but not completed to implementation at that time.
Schumaker & Company has begun working with DPU personnel to implement such a program and has
proposed the following rapid development project.
There have been numerous planning efforts (especially multiple-year capital planning efforts), but
currently there is not an integrated strategic planning process initiated by upper management. These
steps would put such a program in place in a short period of time. The eight-step process is as follows:
1. Develop and Revalidate DPU’s Vision & Mission – We understand that some of these items
have already been created, but we should revalidate the following items before proceeding
a. Vision
b. Mission
c. Values
2. Review and Revalidate Prior Strength, Weakness, Opportunity, and Threat (SWOT)
Analyses – Three iterations of SWOT analysis had been performed as part of the benchmarking/
best practices initiative by Dr. Steve Cady. DPU needs to review the final version for changes and
other considerations and must adopt a Version 4 for the strategic plan to be developed.
3. Develop Higher-Level Goals and Objectives to Address – The results of items 1 and 2 above
should be used to formulate overall, relatively near-term goals and objectives that support the vision,
mission, and values; leverage strengths and opportunities; and mitigate weaknesses and threats.
a. Vision, Mission, and Values
b. SWOT Findings

Draft Report – For Review and Verification Purposes Only 121
12/18/2014
4. Work with Individual Units on Developing Supporting Goals and Objectives – Water
Treatment, Water Reclamation, Water Distribution, Sewer & Drainage, and Utilities
Administration each need to develop specific unit-level goals and objectives that support the
higher-level DPU goals and objectives. In many cases, these units have developed their own
mission statement with goals and objectives that now need to be tied into the higher-level goals
and objectives.
5. Create a Summary-Level Strategic Planning Document – This document would summarize
the current strategic plan, which would include vision, mission, values, SWOT, and unit-level
goals and objectives.
6. Create a Quarterly Review Process – Individual units would be responsible for reporting their
progress in completing the lower unit-level goals and objectives on a quarterly basis to the DPU
Director. A process of summarizing these results against the higher-level goals and objectives
would need to be created for the strategic plan.
a. Report to DPU Director
b. Progress to date
7. Incorporate Strategic Plan Summary into the Current Annual Report – The current year’s
strategic plan and results from the prior year’s strategic plan would be summarized as part of the
Annual Report to City Council, Mayor, and other parties.
a. Prior-year results
b. Next year’s updated strategic plan
8. Turn Over Strategic Planning Process to DPU – This is envisioned as an ongoing process
within DPU and would have to be assigned to an internal individual, as a part of that individual’s
responsibilities, as such.
Recommendation VI-2 Complete the implementation of Cityworks throughout DPU.
(Refer to Finding VI-3.)
As discussed in Finding VI-3, the Cityworks implementation is not completed. A cross-functional team
(with the Commissioners acting as a Project Steering Committee) needs to be created to ensure that
Cityworks implementation is completed. In particular, Water Reclamation and Water Treatment need to
be brought up to the level of Water Distribution and Sewer & Drainage services.
Recommendation VI-3 Create higher-level performance reporting tied to the Cityworks
software. (Refer to Finding VI-7.)
If you look at each division’s organization charts, they show many unfilled positions. Whether each of
these positions is really needed from a long-term perspective is difficult to determine due to the lack of
basic reporting from Cityworks. The following reporting needs to be implemented from Cityworks in
the order that each one is presented:
122 Draft Report – For Review and Verification Purposes Only
12/18/2014
Backlog Reporting – All work that is performed from a maintenance perspective is to be
entered into Cityworks. This would include corrective (something broke and now we need to
fix it), preventive (work performed in advance to help ensure things do not break), inspections
(work performed to assess the condition of a piece of equipment or facility to determine if
maintenance should be done), and other types of items. Therefore, at any point in time,
Cityworks will contain a listing of “jobs” that need to be performed by maintenance crews.
One indication of appropriate staffing levels is that the backlog should not be growing
significantly over time. Therefore, the following reports would be useful:
- Monthly Backlog Reports
Outstanding Backlog (Number of Jobs) Open – end of month
Jobs Completed During Prior Month (Number of Jobs)
Jobs Added to Backlog During Month (Number of Jobs)
Backlog Schedule Performance – A look into Cityworks reveals that each job has an
initiation date (or something similar). This date would correspond to the date the job was
added to the backlog. Each job also probably has an “assigned” date, the date it was assigned
to a crew for completion. Each job has a “completion” date as well, the date the crew
completed the work. And finally, each job has a “closed” date, the date the supervisor or
foreman closed out the job as completed (all I’s dotted and t’s crossed). Therefore, monthly
schedule performance reports could be created from this information, including:
- Average Time from Initiation to Assignment – monitoring the time it takes for a job to
be assigned to a crew: Average, High, Low
- Average time from Assignment to Completion – monitoring the time from a job being
assigned to crew completion: Average, High, Low
- Average Time from Completion to Closure – monitoring the time from a job being crew
complete to closed by the supervisor
Job Profile Demographics – A look at Cityworks reveals that each job can collect the amount
of crew time spent in completing the work. The amount of time expected to complete the
work can also be estimated (up front), but we do not believe that such estimation is being used
at this time. Therefore, we have decided to collect the actual time being spent on jobs. The
following reports could be created:
- Average Time Per Job – Total Time Spent on Jobs in a Month/ Total Number of Jobs
Completed
- High Time Per Job – Time on Spent on Top 10% Highest Time on Jobs
- Low Time Per Job – Time Spent on 10% Lowest Time on Jobs
Job Hours Projections – translating the backlog numbers into hours of workload using the
average time per job numbers

Draft Report – For Review and Verification Purposes Only 123
12/18/2014
Backlog Profile – portraying backlog jobs by type on a monthly basis
- Number of preventive versus corrective jobs
- Predictive- or condition-based maintenance
- Other information being collected
Monthly Resources Available – total resources used in the month to apply to the backlog.
Over time, this would provide the total resources available to apply to a workload (backlog) in a
given month.
Contract Resources Applied – total contractor resources applied to the backlog in a given
month. Ideally, contractor resources would eventually be a part of Cityworks resources.
All of the above information would be reported on a monthly basis to the Director of Public Utilities,
although more frequent reporting might be desired within each division. All of these reports could be
developed such that this information could be drilled down by division, district, group, and even person.
Cityworks is an SQL database, so this information should be readily available in report or dashboard
form.
Recommendation VI-4 Investigate incorporation of risk into the main replacement
program and closely monitor the pipe breaks per mile to assure a
decreasing number of breaks based on the additional funding.
(Refer to Finding VI-12.)
Although the main replacement program has not yielded positive results to date, DPU needs to begin to
incorporate risk into its point system and must consider increased spending. The gas industry has
already been motivated or, perhaps more appropriately, forced via the need for a Distribution Integrity
Management Program (DIMP) to incorporate risk into its decision criteria. In layman’s terms, a pipe on
which a break could cause more damage (such as one near electrical facilities) would be given a larger
number of points versus one that is traversing an open field. Other water utilities are beginning to
migrate their main replacement program along these lines.


Draft Report – For Review and Verification Purposes Only 125
12/18/2014
VII. Organization and Human Resources
A. Background & Perspective
The Toledo Department of Public Utilities (DPU) does not have an internal Human Resources (HR)
function. It receives HR support from the City of Toledo Human Resources Department. The City of
Toledo operates under a Civil Service Commission and the DPU must confirm to Civil Service
requirements. This includes the approval of job descriptions and requirements.
Most DPU employees are represented by American Federation of State, County and Municipal
Employees (AFSCME) Ohio Council 8, Local 7. Supervisory employees are represented by AFSCME
Ohio Council 8, Local 2858. Water Reclamation employees are represented by International
Brotherhood of Teamsters, Local 8.
The Director is appointed by the Mayor and approved by City Council. The Commissioners are
appointed by the Mayor and approved by City Council based on a recommendation from the Director.
Other Fair Labor Standards Act (FLSA) exempt managers are employed under Civil Service rules and
protections.
B. Findings & Conclusions
Finding VII-1 DPU staffing levels are average in terms of per-employee productivity
measures.
Productivity in a water utility is difficult to measure and comparisons to other utilities are even more so.
Different utilities structure jobs differently and have differing levels of technology. Nonetheless, standard
benchmarks compare number of employees it takes to process a million gallons per day (MGD) of water
produced and wastewater processed, and the number of customer accounts per employee. It should also
be noted that these numbers are difficult to calculate as they require the allocation of administrative and
other non-operating/maintenance staff to the two sides of the utility. Obviously, assumptions and
estimations are used in the calculation. In an effort to make these calculations, Schumaker & Company
consulted directly with American Water Works Association (AWWA) benchmark data analysts to assure
that our approach was consistent with theirs and that we were making a valid comparison.
Our calculations produce adjusted staffing figures above those that are used internally at the DPU
(leading to somewhat lower productivity ratios). We believe that the DPU calculations under-count staff
to a degree. Of course, making a perfect apples-to-apples comparison to a benchmark is not possible as
different utilities operate under different circumstances and certain assumptions are made in the
calculations. Nonetheless, Schumaker & Company is confident that our approach is in line with that
used by the AWWA.

126 Draft Report – For Review and Verification Purposes Only
12/18/2014
Because the DPU has been operating at a staffing level below that which is authorized in the budget, we
did our comparisons for both authorized (budgeted) staffing and average actual (average) staffing levels
for FY2014 and FY2015. In general, DPU productivity is in line with the median levels reported by
comparably sized utilities. The comparison of MGD for water production is provided in Exhibit VII-1.
Exhibit VII-1 MGD of Water Produced per Employee
2012/FY2014 & FY2015
AWWA Data for Combined Operations Utilities (2012) DPU (FY2014) DPU (FY2015)
Top Quartile Median Bottom Quartile
0.35 0.24 0.16 Budgeted FTE: 0.21 Budgeted FTE: 0.22
Average FTE: 0.27 Average FTE: 0.26
Source: 2012 AWWA Benchmarking Report
The comparison of MGD for wastewater processed is provided in Exhibit VII-2.
Exhibit VII-2 MGD of Wastewater Processed per Employee
2012/FY2014 & FY2015
AWWA Data for Combined Operations Utilities (2012) DPU (FY2014) DPU (FY2015)
Top Quartile Median Bottom Quartile
0.35 0.23 0.13 Budgeted FTE: 0.17 Budgeted FTE: 0.17
Average FTE: 0.20 Average FTE: 0.20
Source: 2012 AWWA Benchmarking Report
Although DPU productivity is close to the median for both water and wastewater operations, the data
suggests that the DPU could being doing more to enhance productivity.
When looking at staff size compared to the number of accounts, the DPU falls well into the bottom
quartile. The comparison of customer accounts per employee is provided in Exhibit VII-3.
Exhibit VII-3 Customer Accounts per Employee
2012/FY2014 & FY2015
AWWA Data for Combined Operations Utilities (2012) DPU (FY2014) DPU (FY2015)
Top Quartile Median Bottom Quartile
836 616 433 Budgeted FTE: 319 Budgeted FTE: 330
Average FTE: 393 Average FTE: 383
Source: 2012 AWWA Benchmarking Report

Draft Report – For Review and Verification Purposes Only 127
12/18/2014
Finding VII-2 DPU has an aging workforce.
The average age of a DPU employee age is 48. Although somewhat older than the average age in the
general workforce, this is about average for utilities – especially in the public sector. That said, a closer
look at the data suggests that the DPU has a very large proportion of its workforce eligible for
retirement and, as we will discuss in the following finding, does not have a plan to address the potential
loss of institutional knowledge and experience. As described in Exhibit VII-4, 15% of DPU employees
are eligible for retirement today and another 4% will be eligible in the next twelve months.
Exhibit VII-4 Retirement Eligibility
as of October, 2014
Source: 2012 AWWA Benchmarking Report
A common metric for workforce planning is the percentage of employees eligible for retirement in the
next five years. American Water Works Association reports that the median percentage of the
workforce eligible for retirement in the next five years is 21%. At the DPU, fully 38% of employees are
eligible to retire in the next five years. This figure place the DPU well into the bottom quartile of
comparable water utilities for this metric. These figures are provided in Exhibit VII-5.
Exhibit VII-5 Percent of Employees Eligible to Retire in Five Years or Less
2012/FY2014
AWWA Data for Combined W/WW Operations Utilities (2012) DPU (2014)
Top Quartile Median Bottom Quartile
9% 21% 30% 38%
Source: 2012 AWWA Benchmarking Report

128 Draft Report – For Review and Verification Purposes Only
12/18/2014
Finding VII-3 DPU does not have a workforce plan and employs limited recruitment and
retention strategies.
During the course of our interviews, Schumaker & Company heard of difficulty hiring qualified
operators, given that a license is a requirement at entry. This, combined with aging workforce and the
possibility of significant retirements, suggests the need to for a comprehensive plan with recruitment
targets, retention strategies, and job designs that address the growing need for technical skills. The DPU
has no such plan. Hiring is further constrained by a Civil Service process that is slow to respond to
changing workforce requirements and is not designed to produce the most qualified candidates for a
position.
Finding VII-4 DPU operators pay rates are comparable, although somewhat lower, to
benchmark median pay rates.
DPU pay rates for operator positions are comparable to the national average median rates for large
city/county municipal water systems as reported by the American Water Works Association in
Exhibit VII-6. These wages likely reflect strong collective bargaining and suggest that the DPU should
be able to attract qualified workers to enter these relatively good paying jobs.
Exhibit VII-6 AWWA/FDPU Operator Salaries Comparison
2013/FY2014
AWWA Data for City/County Utilities (2013) (Average utility in sample has 547 employees)
DPU (FY2014)
AWWA Position Min. Mid Max DPU
Position Min Max
Entry Level Wastewater Treatment Plant
Operator (Operator In Training)
$33,151 $40,990 $50,327
Water Reclamation Operator
$41,904 $46,559 Wastewater Treatment
Plant Operator (Intermediate)
$38,339 $48,193 $58,097
Senior/Lead Wastewater Treatment Plant
Operator $46,202 $58,205 $71,181
Entry Level Water Treatment Plant
Operator (Operator In Training)
$36,412 $44,062 $52,546 Water Control Room
Operator $33,966 $45,288
Water Treatment Plant Operator (Intermediate)
$37,850 $47,010 $56,790
Senior/Lead Water Treatment Plant
Operator $47,464 $58,752 $70,018
Senior Water Control Room Operator
$46,675 $54,914
Source: 2012 AWWA Benchmarking Report

Draft Report – For Review and Verification Purposes Only 129
12/18/2014
Finding VII-5 The DPU does not have a management succession plan.
Identifying future skill and leadership needs, developing employees to assume greater responsibility, and
identifying key positions where no internal candidate is available and documenting this in a succession
plan with clear strategies to assure qualified individuals will be ready to lead the utility in the future is an
essential practice. Most utilities have robust succession planning processes aligned to comprehensive
employee development processes and market-based recruitment strategies. Succession planning is
identified as a best practice by the American Water Works Association. The DPU has no succession
planning process.
Finding VII-6 DPU management salaries are below market.
When compared to national averages for large city/county municipal water systems, DPU management
salaries fall considerably short. Top (maximum) rates for senior management positions at the DPU are
near or below the minimum reported salaries in the AWWA national survey for comparable positions.
Example comparisons are provided in Exhibit VII-7.
Exhibit VII-7 AWWA/FDPU Management Salaries Comparison
2013/FY2014
AWWA Data for City/County Utilities (2013) (Average utility in sample has 547 employees)
DPU (FY2014)
AWWA Position
Min. Mid Max DPU
Position Min Max
Top Executive $110,781 $145,274 $175,651 Director $75,625 $115,625
Top Engineering Executive
$86,279 $113,025 $136,346
Commissioner $65,000 $98,875
Top Administration
Executive $91,735 $116,628 $134,883
Water Operations Manager
$75,045 $94,296 $115,778
Environment Manager
$70,618 $90,316 $110,382
Water Treatment
Plant Manager $64,049 $80,889 $99,154
Manager $60,625 $85,625 Wastewater Treatment
Plant Manager $65,983 $84,347 $105,311
Source: 2012 AWWA Benchmarking Report
130 Draft Report – For Review and Verification Purposes Only
12/18/2014
Non-competitive compensation makes it very difficult to attract highly qualified leaders for the
organization. During our interviews, Schumaker & Company heard many comments that individuals
did not want to accept promotions as they would have to take a cut in pay, or accept much more
responsibility and longer hours with relatively little increase in pay.
The situation appears to have been worsened, at least temporarily, by recent (September 2014) changes to
City of Toledo FLSA exempt employee pay. Schumaker & Company was told there had not been a pay
increase for exempt employees since 1998. The September increase appears to have been more than offset
by an increase in medical insurance premium co-pay, as well as termination of city pension contributions.
The net effect of these changes was a decrease in total compensation for exempt employees. Exempt
employee pay should rise in the subsequent years, but remains well below comparable market rates.
Schumaker & Company understands the difficult financial situation that many municipalities, including
the City of Toledo, face. That said, the water utility is an enterprise and must be able to attract and
retain talented managers to oversee and improve the utility. A continuation of this trend will render the
DPU, at best, a good place for young, talented individuals to gain experience before moving on to more
lucrative opportunities.
Finding VII-7 DPU management has had frequent restructurings and significant
turnover of senior management that limit its ability to plan and execute
performance improvement initiatives.
In the last eighteen months, DPU has had three Directors. The utility has had three Water Treatment
Commissioners in less than six months. A review of DPU leadership structure over the last two years
suggests frequent structural changes, including loss of the Deputy Director Position, the addition of
Commissioner of Special Projects, and changes of positions from Manager to Commissioner. In the last
18 months, it appears that every senior position has changed at least once, some twice, and a few three
times (although all of this is difficult to even track).
The reasons for these changes are many and largely outside the scope of this study. That said, the
political appointments and better career opportunities elsewhere are major causal factors. The effects of
this instability are not quantifiable, but common sense suggests they are severely detrimental to the
organization. Schumaker & Company is especially concerned that the DPU has been unable to plan and
initiate performance improvement initiatives.
The shortcomings cited in this report are many. There are no quick fixes to most of what we have
identified. It takes time for a Director (Chief Executive Officer) to set priorities and mobilize resources
to affect major changes in an organization. The DPU Directors typically have less than a year in the
position and his or her direct reports change frequently as well. Hence the lower levels of management
are focused on keeping things running day-to-day, as they should be, but no one is able to focus on the
future and on strengthening the business enterprise.
Draft Report – For Review and Verification Purposes Only 131
12/18/2014
Finding VII-8 DPU Commissioners have few direct reports and inconsistent reporting
structures.
Schumaker & Company finds the DPU senior management organization structure to be, frankly,
incomprehensible. This was compounded by the frequent changes discussed in the prior finding. It was
difficult to even know which version of the organization charts were current.
We note that the Water Treatment Plant is headed by a Commissioner with a single direct report of an
Administrator who appears to act as the Plant Operations Manager. This Administrator appears to have
three Administrators reporting to him. The Water Reclamation Division, on the other hand, operates
without a Commissioner. This division is headed by the Plant Administrator and he has several
Administrators and a Senior Engineer reporting to him.
Similarly, Water Distribution is headed by a Commissioner (acting) with two Managers reporting to him.
One manager is responsible for the largely unrelated function of Call City Hall. The other is a single
Manager responsible for Water Distribution operations. Similarly, the Commissioner of Sewer and
Drainage Services division has a single Manager reporting directly to him.
The Engineering Division is currently headed by an acting Administrator, replacing a Commissioner of
Engineering Services. Four Administrators and a Senior Engineer report to the acting Administrator of
this division.
There is also a Commissioners for Special Projects with no direct reports and an acting Commissioner
for Water Treatment/Water Construction Program as well as an acting Administrator for TWI.
Exhibit VII-8 provides a graphic depiction of the current senior management positions at the DPU.

132 Draft Report – For Review and Verification Purposes Only
12/18/2014
Exhibit VII-8 Senior Management Structure
as of November, 2014
Schumaker & Company is unable to make a clear distinction between the roles of Commissioner,
Administrator, and Manager with respect to responsibility and authority. Nor are we able to understand
how these roles are applied relative to the divisional structure. We are also concerned that in a few
cases, a division is headed by a Commissioner with a single direct report who appears to have full
responsibility for the division. The difference between the two treatment divisions are perhaps the most
glaring and incomprehensible.
Finding VII-9 The DPU use of supervisory titles and associated levels of authority are
inconsistent.
Schumaker & Company found the DPU management structure to complex and difficult to understand.
(see Finding VII-8). This complexity and confusion is evident at the supervisory level of the
organization. For example, in Water Treatment, eight Operators are supervised by five Senior
TDPU
Director
TDPU
Commissioner
Special Projects
TDPU
Acting Commissioner, Water Construction Program
Drinking Water Treatment
TDPU
Acting Administrator
TWI
TDPU
Acting Commissioner
Utilities Administration
TDPU
Acting Commissioner
Water Distribution
TDPU
Commissioner
Sewer & Drainage Services
TDPU
Acting Commissioner
Environmental Services
TDPU
Acting Administrator
Engineering Services
TDPU
Administrator
Wastewater Treatment
TDPU
Commissioner
Drinking Water Treatment

Draft Report – For Review and Verification Purposes Only 133
12/18/2014
Operators (Supervisors represented by Local 2058) who reports to the Operator of Record. At the
pump stations, in the same division, eight Operators report to a single Superintendent, who reports to
the Operator of Record. In distribution, Senior Watermain & Service Repair Workers are represented
by Local 7 and report to Foreman who report to General Foreman. In Water Distribution, the
foreman-to-worker ratio is about one-to-twelve.
Schumaker & Company reviewed job descriptions to try to better understand these distinctions. The
job descriptions provide little clarity. For example, the Senior Water Control Room Operator (a
supervisor represented by AFSCME Local 2058) “supervises and reviews the work of assigned
operators and Chemist/Bacteriologist” (although on the organization charts, the Senior Chemists report
to the Chief Chemist and there is no mention of a Bacteriologist). In the Distribution Division, the
Senor Watermain and Service Repair Worker (a non-supervisory position represented by AFSCME
Local 7) is responsible for “overseeing a crew performing a variety of semi-skilled and unskilled manual
tasks.”
Schumaker & Company understands that a distinction can be made between “overseeing” work
(providing work direction absent supervisory authority) and “supervising” (having authority in hiring,
transfer, suspension, promotion, discharge, assignment, reward, or discipline of other employees,
direction of the work of other employees, or responding to employee grievances on behalf of the
employer). We are not sure that this distinction is evident in the day-to-day work of the senior-level
positions and see the use of a common title as a further source of confusion.
Other examples of this kind of title and responsibility confusion, as well as vastly different reporting
rations, exist in the DPU. In any organization, clarity of roles and responsibilities, as well as an efficient
management structure is essential to effective performance. In a Civil Service/collective bargaining
environment it is even more so as roles and boundaries are more narrowly defined by policy and
contract. Employees should not be supervised by someone in the same collective bargaining unit.
Titles should be consistent and denote a standardized level of authority and reasonability. Outdated
titles and classifications should be phased out or revised for clarity and consistency.
Finding VII-10 DPU’s aging workforce, lack of workforce and succession plans, high
turnover, and below market management compensation present a
continuity risk for the utility.
In the prior findings, we have made the point that the DPU has not planned for the replacement of its
aging workforce, has not developed internal leaders, suffers from frequent turnover at the senior level,
and offers uncompetitive compensation for managers. Taken together, Schumaker & Company believes
it rises to a level of risk to the continuity of operations of the utility. Accelerated retirement activity and
significantly better career opportunities elsewhere (especially in an improving economy) along with the
risk of any number of unforeseen events could lead to a sudden loss of significant number of key
personnel. Low compensation and organizational turmoil can hamper the DPU’s ability to attract and
retain talent. At the risk of sounding alarmist, this does have the potential to have serious consequences
to the safe and efficient operation of the system.

134 Draft Report – For Review and Verification Purposes Only
12/18/2014
Finding VII-11 DPU does little employee training.
Schumaker & Company requested documentation on employee training and hours of training provided (to
compare to industry benchmarks). This information was largely not available. The Customer Service and
Safety areas appear to have the most formal training efforts, while nearly all other employee training is on-
the-job training (OJT).
Training responsibilities appear to be shared by supervisors and senior employees. While we do not
wish to discredit the training that is done, we are aware that the OJT typically suffers from significant
inconsistencies in content and effectiveness. Some employees are naturally effective trainers. Others
are not. Some employees teach good habits, some teach bad ones.
In the absence of clear standards, documented activities, and demonstration of trainee competency
(through testing or work demonstration), there is a significant risk that the training fails to meet its
objectives. In an age of increasing technology, heightened regulatory compliance requirements, and
increased customer expectations, the old way of training employees is not sufficient. Training must have
clear objectives based on rigorous job/task analysis, effective instructional design, documentation of
proficiency, and delivered by competent trainers delivering to a known standard.
Finding VII-12 DPU has no formal training and certification records system.
If nothing else, regulatory compliance requires extensive documentation of training and certifications.
In the case of system events, the DPU needs to be able to prove that employees were properly trained,
credentialed, and equipped. We discussed above the fact that the DPU cannot produce training records.
Licensing and recertification requirements are divisional responsibilities and there is no standard for
record keeping.
Finding VII-13 DPU utilizes job classifications that limit employee development and
deployment flexibility.
On a positive note, the DPU does not appear to have many of the narrow, outdated, and inefficient job
definitions seen in some utilities – especially municipal utilities. Broadly defined jobs, where employees
can performs a range of tasks as the work demands provide significant deployment flexibility and
operational efficiency.
While there are not a lot of obsolete jobs at the DPU, jobs do appear to be defined at a low level and do
not encompass advanced licensing, skill development, and broad technical skills. In addition, movement
from some jobs to the senior classification is promotional rather developmental (see Finding VII-14).
We note that a Water Treatment Maintenance Worker requires a tenth grade reading proficiency and
one year of experience. A Senior Water Treatment Maintenance Worker requires a general educational
development (GED) and three years of experience. Neither requires certifications or special training.
We understand the value of general labor, but emphasize the growing technical requirements of utility
work and would look for jobs designed to perform higher level work as well as lower skilled tasks. More
Draft Report – For Review and Verification Purposes Only 135
12/18/2014
importantly, increasing the skill variety and task significance of a job has positive effects on the
motivating potential of the work. In addition, a vast array of unskilled tasks can be assigned to the
Utility Worker classification adding task variety to this classification and improving the overall
motivational potential of the work.
Our concern is that the existing job descriptions and the job designs they reflect reduce the
qualifications to a simple standard that conforms well to Civil Service requirements, but does not
necessarily produce the most capable employees, with the broadest skills, able to perform the greatest
variety of work. Advancing technology, regulation, and demands for quality and efficiency require
modern job designs.
Finding VII-14 The DPU provides limited incentive for operators to get advanced
licensing.
Advanced licensing is one way to achieve higher employee skill levels. It also fits well within a civil
service environment that values objective testing over selective performance judgment. Unfortunately,
the City of Toledo offers a small incentive of about 25 cents an hour for additional licensing. This is a
relatively small incentive for achieving the difficult goal of preparing for and passing these difficult tests.
Schumaker & Company understands the complexities of pay modification within a collective bargaining
and civil service environment. But considering new compensation structures in conjunction with more
robust job design offers opportunity for improved organizational performance and employee rewards.
Finding VII-15 The AFSCME Local 7 contract presents a significant opportunity to
redesign jobs to encourage professional development and deployment
flexibility.
The recently ratified AFSCME Local 7 contract continues a joint union/management committeemen to
eliminating narrow, redundant, and obsolete job classifications through a cooperative process.
Schumaker & Company was impressed with the positive management/union relationship in general, and
this commitment as reflected in contract language. We believe this offers a significant opportunity to
address the concerns raised in the prior two findings. These will be discussed further in our related
recommendations.
Finding VII-16 DPU uses significant amounts of overtime to address chronic vacancies.
Overtime is an essential tool for managing variable work demands. Appropriate use of overtime is far
more efficient than overstaffing and is, within limits, generally welcomed by employees. On the other
hand, excessive overtime is expensive and takes a toll on worker morale and may lead to worker fatigue.
Fatigue has been shown to be a contributing, and sometimes causal, factor in employee operational
errors and accidents.
Overtime costs increased by almost 25% between 2012 and 2013. The overtime cost trend is graphically
displayed in Exhibit VII-9.

136 Draft Report – For Review and Verification Purposes Only
12/18/2014
Exhibit VII-9 DPU Overtime Costs
2010 to 2013
Our concern about excessive overtime was raised during interviews where plant employees expressed
concern about repeated double shifts. For example, in the first six months of this year, seven Control
Room Operators at the Water Treatment plant worked 217 overtime shifts, of which 72 were double
shifts. Four Senior Control Room Operators worked 183 overtime shifts, of which 72 were double
shifts.
As of September 15, 2014, eight High-Service (HS)/Low-Service (LS) Operators have been required to
work overtime 359 times for 2014. Of these occurrences, 220 occurrences were for 12 hours or more.
The extensive occurrences of double shifts seems to be related to the difficulty filling of Operator
positions. Certainly the slow City of Toledo hiring process is a contributing factor, but the requirement
that Operators be licensed prior to being hired adds to the challenge.
Finding VII-17 DPU divides customer service between Utilities Administration and Water
Distribution.
Customer with water billing and general service issues call the DPU customer service call center or visit
the customer service office. Water emergencies and system service issues are handled by the agents at
Call City Hall (CCH), which is currently housed within the Water Distribution division. The placement
of this function in Water Distribution apparently reflects a desire to expand the role of the dispatchers
to take citizen calls about a variety of city services.

Draft Report – For Review and Verification Purposes Only 137
12/18/2014
Schumaker & Company believes strongly that the water utility is a distinct municipal enterprise requiring
its own customer service function. Dispatchers should be field-facing and support communication and
coordination of field efforts. Well trained customer service agents should be customer-facing and fully
capable of addressing customer needs and relaying information internally.
Splitting the customer contact between the Call City Hall and Customer Service organizations is
confusing to the customer and potentially inefficient. In addition, the system knowledge required to
give effective customer service and the complexity of tasks associated with water billing and customer
service needs is beyond what can reasonably be combined with other municipal services. Water
Distribution is not a customer-facing function and not in a position to give CCH the support it needs.
As we have stated elsewhere, the water utility is an enterprise function. Its customer service needs are
complex and time sensitive. Combining these function with other City services seems ill advised.
Schumaker & Company heard talk of combining the water utility customer service into a larger city-wide
311 function. Every 311 operation we have seen struggles to relay accurate information and take simple
service requests for the vast array of city services and functions. It is well beyond the capability of any
311 operation we have seen to take on the complex billing and service requests that a water utility must
handle.
C. Recommendations
Recommendation VII-1 Develop a comprehensive workforce plan that addresses future
needs, including staffing and associated skill levels. (Refer to
Finding VII-1, Finding VII-2, and Finding VII-3.)
Utilities, of all types, are dealing with an aging workforce. Today, most utilities have a comprehensive
workforce plan, which forecasts attrition, especially retirements, in key operational positions and
identifies goals and strategies to assure that qualified people will be available to operate the system.
Among the key elements of these plans is clear definition of the workforce of the future defining skills
and attributes of the next generation of workers. Changing technology and increased regulatory
requirements demand higher skilled workers with technical knowledge. The push toward higher levels
of licensing in water utilities is evidence of this trend.
Workforce plans often identify strategies such as partnerships with community colleges and trade
schools to promote utility careers, support licensure, and identify high potential candidates. This
coupled with robust internal internship and career development programs help assure the availability of
qualified workers to operate the system. The DPU needs to do attrition assessments by job
classification, define the emerging skills and attributes, and develop a plan to assure qualified workers are
available.

138 Draft Report – For Review and Verification Purposes Only
12/18/2014
Recommendation VII-2 Develop a comprehensive management succession plan that that
addresses future needs and defines recruitment and retention
strategies, including compensation. (Refer to Finding VII-2,
Finding VII-5, Finding VII-6, Finding VII-7, Finding VII-8,
Finding VII-9, and Finding VII-10.)
Succession planning is one of eleven organizational best practices identified by the American Water
Works Association.cxlviii Succession planning increases the availability of experienced and capable
employees that are prepared to assume leadership roles, as required by promotions and attrition. At
minimum, these plans include:
Identification of key roles for succession or replacement
Analysis of job requirements and development of n associated competency model
Identification of development career paths and individuals on these paths
Identification of key roles without an identifiable internal successor
Assessment of these individuals and estimation of readiness for promotion
A formal development process for potential successors
Below market compensation for DPU management was discussed in Finding VII-6. We expect that the
succession plan will identify roles for which the utility will likely look outside for someone to fill. The
low salaries at the DPU will certainly present a challenge to attracting and retaining talented leadership.
We understand that these roles are paid consistent with other comparable City of Toledo management
positions. We have not assessed the market rates for other municipal managers, but believe strongly
that the benchmark is other municipal water utilities. As such, we believe the Toledo water utility
should be operated as a municipal enterprise and allowed to implement a market-based compensation
strategy.
Given all the factors we have identified, relatively low pay available to DPU managers, the high
turnover, and high retirement eligibility, a succession plan seems especially critical for the ongoing
success of the DPU.
Recommendation VII-3 Combine jobs, where possible, and implement a
competency/certification based job-progression system to encourage
professional development, employee retention, deployment flexibility
and productivity. (Refer to Finding VII-1, Finding VII-2,
Finding VII-4, Finding VII-9, Finding VII-11, Finding VII-13,
Finding VII-14, Finding VII-15, and Finding VII-16.)
Given DPU’s staffing shortages in key Operator positions, the pressure it is under to not fill vacant
positions, and the difficulty it has filling positions in a timely fashion, it is essential that the utility
develop strategies to assure workforce availability. Rather than aggressively filling open positions,
Schumaker & Company believes that the DPU should invest in redesigning jobs to create more flexible
deployment and improve staffing efficiency.

Draft Report – For Review and Verification Purposes Only 139
12/18/2014
The joint-effort between City of Toledo and Local 7 to consolidate positions and eliminate obsolete job
classifications is consistent with what we are proposing here, but has largely been limited to
consolidating work into an existing classification. This is an efficient, and largely effective, strategy
within the context of Civil Service rules and processes. We recommend that the work within the DPU
go further in two important ways. First, we recommend that the consolidation of classifications be done
in a manner that creates career progressions based on the acquisition of licenses, certifications or the
demonstration of specific competencies. The jobs are designed with a clear progression path and
associated increases in compensation. This creates and incentive for employees to develop additional
skills and attain higher levels of licensure. At the same time, more skilled employees, able to perform a
broader range of tasks, allows the DPU more flexibility in deployment and generate significant staffing
efficiencies.
Second, another key difference from the city-wide effort is that these jobs must be specific to the DPU.
Again we emphasize the importance of managing the DPU as an enterprise. A well-functioning job
progression system has associated training costs. The benefit of this investment should return to the
utility. The investment in employee development should create career development paths inside the
organization, not paths that lead outside the organization.
Advancement within the progression is based on individual attainment of the competency or
certification. Well-designed progression systems have no instructional barrier to progression. This
means there is no need for a vacancy at a higher level to be able to progress. As such, it is theoretically
possible to have all employees paid at the highest level, although normal attrition and individual
limitations make this practically impossible. It is important to note that anyone within the progression
can perform all work associated with his/her level and all levels below. This means that senior
employees may sometimes be assigned lower level work. It is this deployment flexibility that produces
staffing efficiencies, as one person may be assigned a range of tasks that were was divided into two jobs.
(This should not be read as one person doing the work volume of two people. It simply means that the
range of tasks is combined.)
Many job progressions also have mandatory progression levels (usually the first three of five) and higher,
voluntary levels. These additional job requirements are, of course, subject to collective bargaining
Schumaker & Company sees opportunity for job progressions in Water Treatment, Water Reclamation,
and Customer Service. With deeper analysis, others may be identified. Exhibit VII-10 provides a sample
job progression for Water Treatment Plant Operators.

140 Draft Report – For Review and Verification Purposes Only
12/18/2014
Exhibit VII-10 Sample Job Progression for Water Treatment Plant Operator
Level Designation Requirements
(to enter the level) Key Functions
5 Lead Operator Class 3 License Process control, training
4 Operator 2 Class 2 License System operations and routine maintenance
3 Operator 1 Class 1 License
2 Operator in Training Working under the direction of a Lead Operator to develop knowledge and skills, and gain experience necessary for licensing
1 Operator Assistant High School Diploma/GED
Utility worker and minor maintenance
At the same time, the DPU should redefine the Senior Water Control Room Operator as a Supervisor
position, distinguishing it from the Lead Operator. The Supervisor performs work restricted to
supervisory/management classifications, including hiring, evaluating, disciplining, and terminating
employees. In addition, Supervisors manage the progression process and play a key role in employee
development.
A key feature of such a system is that employees advance based on acquisition of required certifications
and not based on seniority, subjective qualifications, or the availability of a promotional opportunity.
While it is theoretically possible for all employees to be at the top of the pay scale, it is unlikely given
turnover, varying levels of desire to progress, and the time it takes to do so. In general, the progression
should be built so that it takes a minimum of five to seven years to reach the top level.
Such a system does have the potential to increase payroll and training costs. These expenses are
typically recouped in greater deployment flexibility and associated staffing level optimization.
Recommendation VII-4 Implement a formal employee training system and a learning
management system to deliver and document training. (Refer to
Finding VII-11, Finding VII-12, and Finding VII-14.)
We recommended in our chapter on occupational health and safety the adoption of a training content
management, delivery, and documentation system. We indicated in that chapter that we are impressed
with Target Solutions (http://www.targetsolutions.com/home).3 This product offers content developed
specifically for water and wastewater utilities. It also allows for the uploading and sharing of practically
any content developed in-house or purchased elsewhere.
A system such as this would be particularly useful for the call centers. It could support initial training
and provide a convenient and efficient method for training on new policies and procedures—including
testing and electronic signatures to document that an agent has read policy changes. Testing can be used
3 Schumaker & Company has no relationship with Target Solutions and we are not recommending purchase of this specific system without
appropriate needs assessment and review of multiple vendors.
Draft Report – For Review and Verification Purposes Only 141
12/18/2014
in many ways to assure comprehension of standardized procedures. The system will record employee
training completion and scores. Perhaps most importantly, it has a comprehensive training records
system. It also allows for easy documentation of training and testing for advancement, it tracks
expirations of mandated trading, and it notifies employees and supervisors of pending certification
expirations or training refresher requirements.
In the call center, the instructional designer can push out new content quickly, with employees able to
access such content at their work stations. This capability reduces the need for classroom training and
provides a way to easily document employee participation and comprehension (when testing is used).
This system would be equally useful in supporting employee development in operations. Wherever
career progressions are implemented, there is a significantly heightened need for formal employee
development. Encouraging employees to achieve higher licensing levels requires formal training and
practice testing, all of which is best managed through a centralized training delivery and learning
management system.
Using a system such as this across the enterprise makes for a very low-cost solution with wide applicability.
It offers efficient delivery of standardized content and documentation for training completion, testing,
and policy compliance.
Recommendation VII-5 Consider reducing the number of Commissioners and streamlining
the management and supervisory structure. (Refer to
Finding VII-1, Finding VII-5, Finding VII-6, Finding VII-7,
Finding VII-8, and Finding VII-9)
It is beyond the scope of this project to provide a comprehensive reorganization of the DPU. Such an
undertaking requires more extensive knowledge of present and future operational demands, as well as
well-structured process to respond to political, union, and Civil Service interests and requirements.
Schumaker & Company is comfortable in recommending that the number of Commissioners be
reduced. We believe this would be the appropriate starting point for a reconsideration of the entire
management structure down through first-line supervision. We believe that the DPU could function
effectively with four Commissioners all reporting to the Director.
A Commissioner of Plant Operations would be responsible for both Water Treatment and Water
Reclamation. Both plants would be under the authority of a highly qualified plant manager (exempt,
Civil Service position). A Commissioner of Field Operations would be responsible for Water
Distribution and Sewers and Drainage. A Commissioner of Engineering and Environmental Services
would, as the title suggests, be responsible for what is now two separate divisions bringing together the
technical/professional functions with a clear focus on regulatory compliance and system performance. A
Commissioner of Customer Service and Administration would be responsible for the combined
divisions of these names. Central to this role is improving customer service while effectively managing
utility revenue and expenses. This structure is graphically described in Exhibit VII-11.
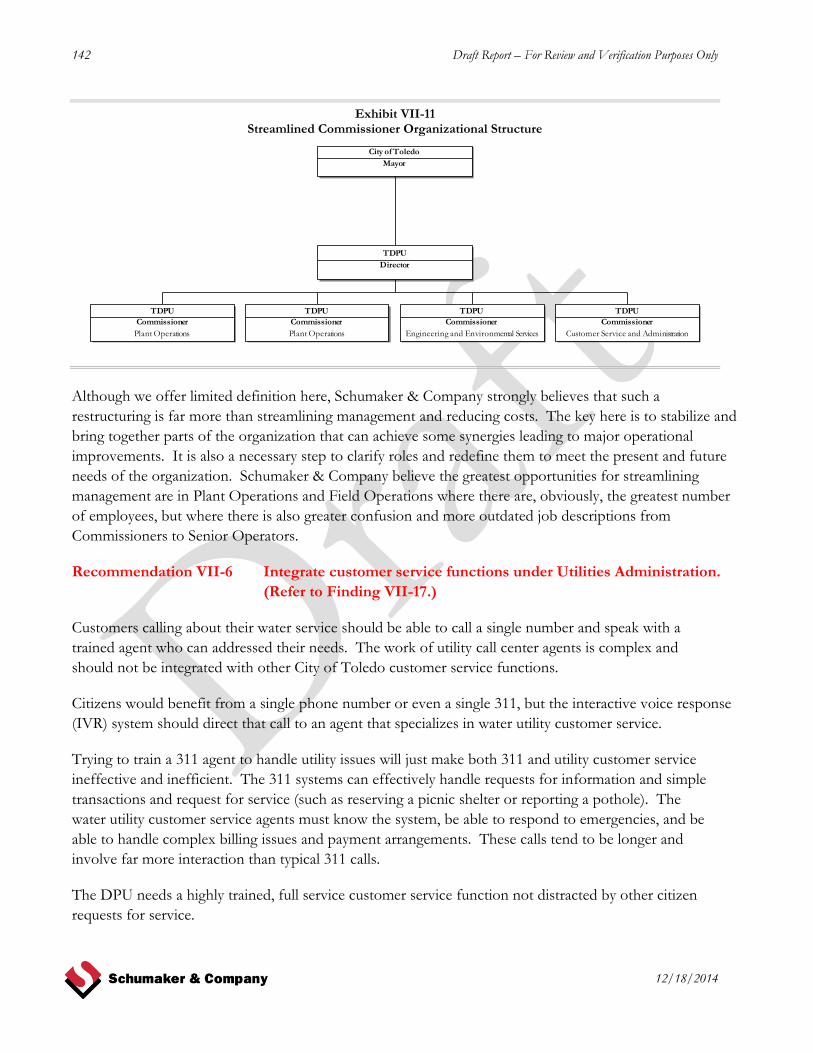
142 Draft Report – For Review and Verification Purposes Only
12/18/2014
Exhibit VII-11 Streamlined Commissioner Organizational Structure
Although we offer limited definition here, Schumaker & Company strongly believes that such a
restructuring is far more than streamlining management and reducing costs. The key here is to stabilize and
bring together parts of the organization that can achieve some synergies leading to major operational
improvements. It is also a necessary step to clarify roles and redefine them to meet the present and future
needs of the organization. Schumaker & Company believe the greatest opportunities for streamlining
management are in Plant Operations and Field Operations where there are, obviously, the greatest number
of employees, but where there is also greater confusion and more outdated job descriptions from
Commissioners to Senior Operators.
Recommendation VII-6 Integrate customer service functions under Utilities Administration.
(Refer to Finding VII-17.)
Customers calling about their water service should be able to call a single number and speak with a
trained agent who can addressed their needs. The work of utility call center agents is complex and
should not be integrated with other City of Toledo customer service functions.
Citizens would benefit from a single phone number or even a single 311, but the interactive voice response
(IVR) system should direct that call to an agent that specializes in water utility customer service.
Trying to train a 311 agent to handle utility issues will just make both 311 and utility customer service
ineffective and inefficient. The 311 systems can effectively handle requests for information and simple
transactions and request for service (such as reserving a picnic shelter or reporting a pothole). The
water utility customer service agents must know the system, be able to respond to emergencies, and be
able to handle complex billing issues and payment arrangements. These calls tend to be longer and
involve far more interaction than typical 311 calls.
The DPU needs a highly trained, full service customer service function not distracted by other citizen
requests for service.
City of Toledo
Mayor
TDPU
Director
TDPU
Commissioner
Plant Operations
TDPU
Commissioner
Plant Operations
TDPU
Commissioner
Engineering and Environmental Services
TDPU
Commissioner
Customer Service and Administration
Draft Report – For Review and Verification Purposes Only 143
12/18/2014
1 / Discussion in large part taken from 2012 American Water Works Association Benchmarking Study – Performance Indicators of Water and Wastewater
Utilities: Survey Data and Analyses Report (2012 AWWA Benchmarking Report). 2 / Information Response 3
3 / Information Response 3
4 / Information Response 2
5 / Information Response 3
6 / Information Response 3
7 / Interview 7 and DPU comments
8 / Interview 7 and DPU comments
9 / Interview 7
10 / Interview 7 and DPU comments
11 / Interview 7
12 / Interview 7
13 / Interview 7
14 / Information Response 52
15 / Interview 8 and TDU comments
16 / DPU comments
17 / Information Response 52
18 / Information Response 8
19 / Interviews 8 and 11D
20 / Interview 11C
21 / Interview 11C
22 / Interview 11C
23 / Interview 11C
24 / Interview 8
25 / Interviews 8 and 11B
26 / Interviews 8 and 11B
27 / Interview 8
28 / Interview 8
29 / Interviews 8 and 14
30 / Interviews 8 and 15
31 / Interviews 8 and 16
32 / Interviews 8 and 18
33 / Information Response 5
34 / Information Response 61
35 / Information Response 53
36 / Information Response 2
37 / Information Response 23
38 / Information Response 21
39 / Information Response 21
40 / Information Response 21
41 / Information Response 21
42 / Information Response 17

144 Draft Report – For Review and Verification Purposes Only
12/18/2014
43
/ Information Response 17 44
/ Information Response 17 45
/ Information Response 17 46
/ Information Response 17 47
/ Kickoff Meeting and Interviews 7 and 11A 48
/ Information Response 17 49
/ Interviews 7 and 11A 50
/ Information Response 17 51
/ Interview 7 52
/ Interviews 7 and 11A 53
/ Interview 7 54
/ Interview 7 55
/ Interview 7 56
/ Interview 7 57
/ Information Response 21 58
/ Information Response 113 59
/ Information Response 113 60
/ Information Response 113 61
/ Information Response 111 62
/ Interviews 8 63
/ Interviews 8 64
/ Interviews 8 65
/ Interviews 8 66
/ Interviews 8 67
/ Interviews 8 68
/ Interviews 8 69
/ Interviews 8 and 19 70
/ Information Response 52 71
/ Interview 8 72
/ Information Response 52 73
/ Information Response 52 and Interview 8 74
/ Information Response 128 75
/ Interview 11 76
/ Interviews 8 and 11 77
/ Information Response 57 78
/ Information Response 57 79
/ Information Response 57 80
/ Information Response 57 and Interview 20 81
/ Information Response 57 82
/ Information Response 57 83
/ Interview 20 and July 25, 2014 Presentation to DPU Management 84
/ Information Response 62 85
/ Information Response 62 86
/ Information Response 62 87
/ Information Response 63 88
/ Discussions with UA Management 89
/ Discussions with UA Management 90
/ Information Response 60

Draft Report – For Review and Verification Purposes Only 145
12/18/2014
91
/ Interviews 8, 11, and 19 92
/ Interviews 8, 11, and 19 93
/ Interviews 8, 11, and 19 94
/ Interviews 7, 8, and 13 95
/ Interviews 8, 14, 16, 17, and 18 96
/ Borowski, J. and Adams, P. Water Utility Safety and Health: Review of Best Practices. Water Research Foundation. 2010, Page 21. 97
/ Borowski, J. and Adams, P. Water Utility Safety and Health: Review of Best Practices. Water Research Foundation. 2010, Page 43. 98
/ Borowski, J. and Adams, P. Water Utility Safety and Health: Review of Best Practices. Water Research Foundation. 2010, Page 6. 99
/ 2013 Department of Public Utilities Annual Report 100
/ Information Response 2 101
/ 2013 Department of Public Utilities Annual Report 102
/ 2013 Department of Public Utilities Annual Report 103
/ 2013 Department of Public Utilities Annual Report 104
/ 2013 Department of Public Utilities Annual Report 105
/ Information Response 2 106
/ 2013 Department of Public Utilities Annual Report 107
/ 2013 Department of Public Utilities Annual Report 108
/ 2013 Department of Public Utilities Annual Report 109
/ 2013 Department of Public Utilities Annual Report 110
/ 2013 Department of Public Utilities Annual Report 111
/ 2013 Department of Public Utilities Annual Report 112
/ Information Response 2 113
/ 2013 Department of Public Utilities Annual Report 114
/ 2013 Department of Public Utilities Annual Report 115
/ 2013 Department of Public Utilities Annual Report 116
/ 2013 Department of Public Utilities Annual Report 117
/ 2013 Department of Public Utilities Annual Report 118
/ 2013 Department of Public Utilities Annual Report 119
/ 2013 Department of Public Utilities Annual Report 120
/ 2013 Department of Public Utilities Annual Report 121
/ 2013 Department of Public Utilities Annual Report 122
/ 2013 Department of Public Utilities Annual Report 123
/ Information Response 2 124
/ Interviews 2, 3, 4, and 5 125
/ Interviews 2, 3, 4, and 5 126
/ Interviews 2, 3, 4, and 5 127
/ Interviews 2, 3, 4, and 5 128
/ Interviews 2, 3, 4, and 5 129
/ Interviews 2, 3, 4, and 5 130
/ Schumaker & Company consultant experience 131
/ Interviews 2, 3, 4, and 5 132
/ Schumaker & Company consultant experience 133
/ Interviews 2, 3, 4, and 5 134
/ Interviews 2, 3, 4, and 5 135
/ Interviews 2, 3, 4, and 5 136
/ Interviews 2, 3, 4, and 5 137
/ Interviews 2, 3, 4, and 5 138
/ Interviews 2, 3, 4, and 5

146 Draft Report – For Review and Verification Purposes Only
12/18/2014
139
/ Interviews 2, 3, 4, and 5 140
/ Interviews 2, 3, 4, and 5 141
/ Interviews 2, 3, 4, and 5 142
/ Interviews 2, 3, 4, and 5 143
/ Information Request 34 144
/ Information Response 47 145
/ Information Request 35 146
/ Information Request 35 147
/ Information Request 35 cxlviii
/2012 Benchmarking, Performance Indicators for Water and Wastewater Utilities: Survey Data and Analyses Report. American Water Works
Association, 2014. Page 19.