Dr. Omar Abdelaziz Dr. Som Shrestha - · PDF file · 2016-02-03Dr. Omar Abdelaziz...
36
ORNL is managed by UT-Battelle for the US Department of Energy Soft-optimization Test of R-410A and R-22 Alternatives in Mini-split Air- Conditioners Dr. Omar Abdelaziz Dr. Som Shrestha AHRI Low-GWP AREP Conference January 21, 2016. Orlando, FL
Transcript of Dr. Omar Abdelaziz Dr. Som Shrestha - · PDF file · 2016-02-03Dr. Omar Abdelaziz...

ORNL is managed by UT-Battelle
for the US Department of Energy
Soft-optimization
Test of R-410A and
R-22 Alternatives
in Mini-split Air-
Conditioners
Dr. Omar Abdelaziz
Dr. Som Shrestha
AHRI Low-GWP AREP Conference
January 21, 2016. Orlando, FL

2Alternative Refrigerant Evaluation for High Ambient
Temperature Environments
Program Objective
• To evaluate the soft-optimized performance of mini-split air conditioners with alternative lower-GWP refrigerants to R-22 and R-410A at high-ambient temperature
• Help evaluate the viability of using alternative lower-GWP refrigerants in said markets to avoid a costly two-step transition from HCFC to HFC and then from HFC to lower-GWP refrigerants
http://www.unep.org/dewa/Portals/67/pdf/HFC_report.pdf

3Alternative Refrigerant Evaluation for High Ambient
Temperature Environments
Equipment
• Carrier mini-split AC systems with rotary compressors designed for high ambient applications
– R-22 Unit
• Capacity* = 18.5 kBtu/h (5.42 kW)
• EER* = 9.7 (COP ~ 2.84)
– R-410A Unit
• Capacity* = 18 kBtu/h (~ 5.28kW)
• EER* = 12.0 (COP ~ 3.52)
*Rated at ISO 5151 T1 (Indoor DBT 27°C (80.6°F), WBT 19°C (66.2°F)

4Alternative Refrigerant Evaluation for High Ambient
Temperature Environments
R-22 Alternative Refrigerants
Refrigerant Manufacturer
ASHRAE
Safety
Class
GWP
AR4 AR5
R-22a - A1 1,810 1,760
N-20Bb Honeywell A1 988 904
DR-3b Chemours A2L 148 146
ARM-20Bb Arkema A2L 251 251
L-20Ab Honeywell A2L 295 295
DR-93b Chemours A1 1,258 1,153
R-290a - A3 3 3a Sources: IPCC AR4, 2007; IPCC AR5, 2013b GWP values for refrigerant blends not included in IPCC reports are
calculated as a weighted average using manufacturer-supplied compositions.

5Alternative Refrigerant Evaluation for High Ambient
Temperature Environments
R-410A Alternative Refrigerants
a Sources: IPCC AR4, 2007; IPCC AR5, 2013b GWP values for refrigerant blends not included in IPCC reports are
calculated as a weighted average using manufacturer-supplied compositions.
Refrigerant Manufacturer
ASHRAE
Safety
Class
GWP
AR4 AR5
R-410Aa - A1 2088 1924
ARM-71Ab Arkema A2L 460 461
R-32a Daikin A2L 675 677
DR-55b Chemours A2L 698 676
L41-2b Honeywell A2L 583 572
HPR-2Ab Mexichem A2L 600 593

6Alternative Refrigerant Evaluation for High Ambient
Temperature Environments
R-22 Experiment Setup

7Alternative Refrigerant Evaluation for High Ambient
Temperature Environments
R-410A Experimental Setup

8Alternative Refrigerant Evaluation for High Ambient
Temperature Environments
Soft optimization
• Optimization sequence:
– Calculate capillary tube length
– Calculate charge
– Adjust charge
– Adjust capillary tube
• Check performance at T3 to ensure superheat and subcooling
Cap tube header

9Alternative Refrigerant Evaluation for High Ambient
Temperature Environments
Experiment Uncertainty
R-22 Unit
• Airside Uncertainty:
– Capacity: ±2.3%
– COP: ±2.4%
• Refrigerant side uncertainty:
– Capacity: ±0.7%
– COP: <±0.8%
• Energy balance between air side and refrigerant side measurements:
– AHRI A: -2.30% to 2.89%
– AHRI B: -1.99% to 2.37%
R-410A Unit
• Airside uncertainty:
– Capacity: ±1.5%
– COP: ±1.6%
• Refrigerant side uncertainty:
– Capacity: ±0.65%
– COP: ±0.81%
• Energy balance between air side and refrigerant side measurements:
– AHRI A: -3.60% to 0.05%
– AHRI B: -3.97% to 0.05%
10Alternative Refrigerant Evaluation for High Ambient
Temperature Environments
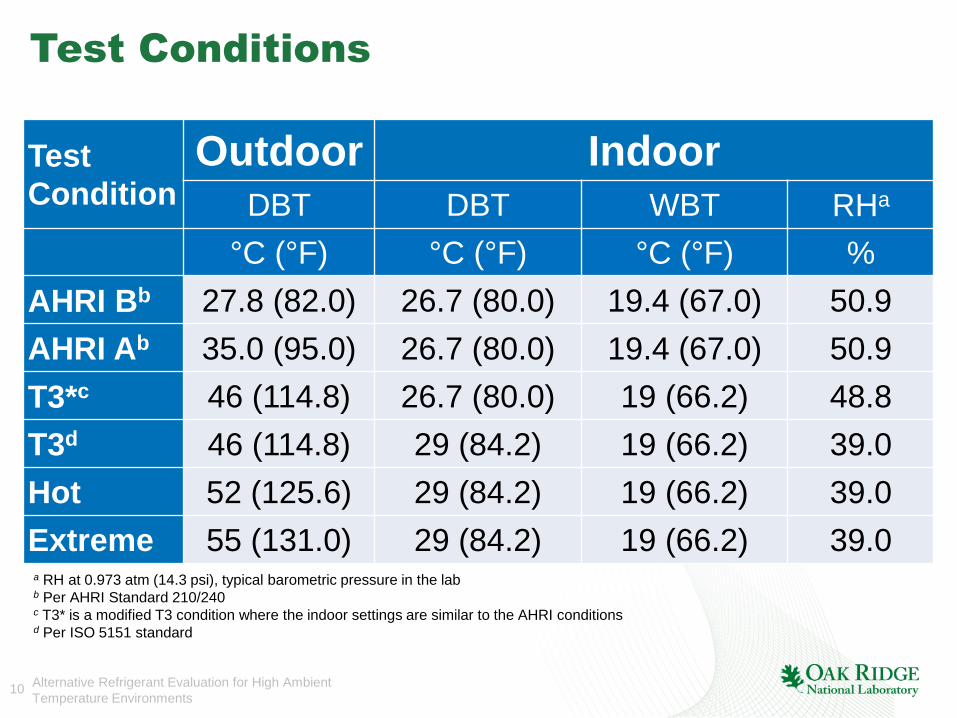
Test Conditions
Test
Condition
Outdoor Indoor
DBT DBT WBT RHa
°C (°F) °C (°F) °C (°F) %
AHRI Bb 27.8 (82.0) 26.7 (80.0) 19.4 (67.0) 50.9
AHRI Ab 35.0 (95.0) 26.7 (80.0) 19.4 (67.0) 50.9
T3*c 46 (114.8) 26.7 (80.0) 19 (66.2) 48.8
T3d 46 (114.8) 29 (84.2) 19 (66.2) 39.0
Hot 52 (125.6) 29 (84.2) 19 (66.2) 39.0
Extreme 55 (131.0) 29 (84.2) 19 (66.2) 39.0a RH at 0.973 atm (14.3 psi), typical barometric pressure in the labb Per AHRI Standard 210/240c T3* is a modified T3 condition where the indoor settings are similar to the AHRI conditionsd Per ISO 5151 standard

11Alternative Refrigerant Evaluation for High Ambient
Temperature Environments
R-22 Unit
Refrigerant
Capillary
Tube Length,
mm (Inch)
Charge Mass,
kg (oz.)
R-22 (Baseline) 508 (20) 1.417 (50)
N-20B 152 (6) 2.087 (73.6)
DR-3 178 (7) 2.007 (70.8)
ARM-20B 178 (7) 1.588 (56)
L-20A (R-444B) 356 (14) 1.568 (55.3)
DR-93 152 (6) 1.828 (64.5)
R-290 203 (8) 0.731 (25.8)
ID: 2 mm (0.079”) for R-22, 1.65 mm (0.065”) for alternative refrigerants

12Alternative Refrigerant Evaluation for High Ambient
Temperature Environments
Impact on Compressor Discharge
Temperature (Tcomp
)
-20
-15
-10
-5
0
5
10
B A T3* T3 Hot Extreme
T com
p–
T com
p, b
ase
line
, °C
L-20A (R-444B) DR-3 N-20B
ARM-20B R-290/POE DR-93

13Alternative Refrigerant Evaluation for High Ambient
Temperature Environments
Performance Relative to R-22 at AHRI A
Conditions
L-20A
DR-3
N-20BARM-20B
R-290
DR-9380%
85%
90%
95%
100%
105%
110%
80% 85% 90% 95% 100% 105%
CO
P
Cooling Capacity

14Alternative Refrigerant Evaluation for High Ambient
Temperature Environments
Performance Relative to R-22 at ISO T3
Conditions
L-20A
DR-3
N-20BARM-20B
R-290
DR-93
80%
85%
90%
95%
100%
105%
110%
80% 85% 90% 95% 100% 105%
CO
P
Cooling Capacity

15Alternative Refrigerant Evaluation for High Ambient
Temperature Environments
Performance Relative to R-22 at Extreme
Conditions
L-20A
DR-3
N-20B
ARM-…
R-290
DR-93
80%
85%
90%
95%
100%
105%
110%
80% 85% 90% 95% 100% 105%
CO
P
Cooling Capacity

16Alternative Refrigerant Evaluation for High Ambient
Temperature Environments
R-22 Conclusions
• The A1 alternative refrigerants lagged in performance
• Two A2L refrigerants showed capacity within 5% and efficiency within approximately 10% of the baseline system at ambient temperature at or above 46°C
• The A3 refrigerant (R-290) exhibited higher efficiency and capacity within 9% of the baseline

17Alternative Refrigerant Evaluation for High Ambient
Temperature Environments
R-410A Unit
Refrigerant
Capillary Tube
Length, mm
(Inch)
Charge Mass,
kg (oz.)
R-410A 673 (26.5) 0.936 (33)
ARM-71A 610 (24) 0.765 (27)
R-32 1016 (40) 0.709 (25)
DR-55 660 (26) 0.811 (28.6)
L41-2 (R-447A) 864 (34) 0.780 (27.5)
HPR-2A 965 (38) 0.808 (28.5)
ID: 2 mm (0.079”) for R-410A, 1.65 mm (0.065”) for alternative refrigerants

18Alternative Refrigerant Evaluation for High Ambient
Temperature Environments
Impact on Compressor Discharge
Temperature
0
5
10
15
20
25
B A T3* T3 Hot Extreme
T com
p–
T com
p, b
ase
line, °
C
R-32 DR-55 L41-2 (R-447A) ARM-71a HPR-2A

19Alternative Refrigerant Evaluation for High Ambient
Temperature Environments
Performance Relative to R-410A at AHRI A
Conditions
R-32DR-55
L41-2
ARM-71AHPR-2A
90%
95%
100%
105%
110%
80% 90% 100% 110%
CO
P
Cooling Capacity

20Alternative Refrigerant Evaluation for High Ambient
Temperature Environments
Performance Relative to R-410A at ISO T3
Conditions
R-32
DR-55L41-2
ARM-71A
HPR-2A
90%
95%
100%
105%
110%
80% 90% 100% 110%
CO
P
Cooling Capacity

21Alternative Refrigerant Evaluation for High Ambient
Temperature Environments
Performance Relative to R-410A at
Extreme Conditions
R-32
DR-55L41-2
ARM-71A
HPR-…
90%
95%
100%
105%
110%
80% 90% 100% 110%
CO
P
Cooling Capacity

22Alternative Refrigerant Evaluation for High Ambient
Temperature Environments
R-410 Conclusions
• R-32 showed better capacity and efficiency; but resulted in higher compressor discharge temperature
• DR-55 had consistently higher COPs and matched the capacity at higher ambient conditions.
• HPR-2A’s performance exceeded the baseline at all ambient temperatures higher than 35°C.
• R-447A and ARM-71A had lower capacity but R-447A had better COP than the baseline at ambient temperatures higher than 46°C.

23Alternative Refrigerant Evaluation for High Ambient
Temperature Environments
Overall Conclusions
• The results are for soft optimized systems only; efficiency and capacity of the alternative refrigerants can be expected to improve through design modifications before introducing a new product to market.
• Multiple alternatives for R-22 performed well, and most R-410A alternatives matched or exceeded the performance of R-410A. These may be considered as prime candidate lower GWP refrigerants for high-ambient-temperature environments.

24Alternative Refrigerant Evaluation for High Ambient
Temperature Environments
Acknowledgment
• US DOE/BTO Support: Dr. Patrick Phelan, Mr. Antonio Bouza
• Ms. Jaqueline Wong at the Executive Office of the President who coordinated to build support among hot climate countries for the accelerated transition
• Navigant Consulting: Mr. William Goetzler, Mr. Matthew Guernsey, Theo Kassuga
• ORNL: Randy Linkous, Jeffrey Munk, and Anthony Gehl
• Ankit Sethi at Honeywell
Panel of International Experts:
Dr. Radhey Agarwal (India)
Dr. Karim Amrane (USA)
Dr. Enio Bandarra (Brazil)
Dr. J. Bhambure (India)
Mr. Ayman El-Talouny (UNEP)
Dr. Tingxun Li (China)
Dr. Samuel Yana Motta
Mr. Maher Moussa (KSA)
Mr. Ole Nielsen (UNIDO)
Mr. Tetsuji Okada (Japan)
Dr. Alaa Olama (Egypt)
Dr. Alessandro Giuliano Peru (Italy)
Dr. Suely M. Carvalho (IPEN, Brazil) and
Dr. Patrick Phelan (Department of Energy, USA)

25Alternative Refrigerant Evaluation for High Ambient
Temperature Environments
References
• IPCC, 2007: Climate Change 2007: The Physical Science Basis. Contribution of Working Group I to the Fourth Assessment Report of the Intergovernmental Panel on Climate Change [Solomon, S., D. Qin, M. Manning, Z. Chen, M. Marquis, K.B. Averyt, M. Tignor and H.L. Miller (eds.)]. Cambridge University Press, Cambridge, United Kingdom and New York, NY, USA; section 2.10.2: Direct Global Warming Potentials. Available: https://www.ipcc.ch/publications_and_data/ar4/wg1/en/contents.html
• IPCC, 2013. Myhre, G., D. Shindell, F.-M. Bréon, W. Collins, J. Fuglestvedt, J. Huang, D. Koch, J.-F. Lamarque, D. Lee, B. Mendoza, T. Nakajima, A. Robock, G. Stephens, T. Takemura and H. Zhang, 2013: Anthropogenic and Natural Radiative Forcing. In: Climate Change 2013: The Physical Science Basis. Contribution of Working Group I to the Fifth Assessment Report of the Intergovernmental Panel on Climate Change [Stocker, T.F., D. Qin, G.-K. Plattner, M. Tignor, S.K. Allen, J. Boschung, A. Nauels, Y. Xia, V. Bex and P.M. Midgley(eds.)]. Cambridge University Press, Cambridge, United Kingdom and New York, NY, USA. Available: https://www.ipcc.ch/pdf/assessment-report/ar5/wg1/WG1AR5_Chapter08_FINAL.pdf

26Alternative Refrigerant Evaluation for High Ambient
Temperature Environments
Discussion
Omar Abdelaziz, [email protected]
Som Shrestha, [email protected]
Visit our website: www.ornl.gov/buildings
Follow me on Twitter: @somsgrFollow us on Twitter: @ORNLbuildings
The detailed report is available to download at AHRI web site
http://www.ahrinet.org/App_Content/ahri/files/RESEARCH/AREP_
Final_Reports/AHRI_Low_GWP_AREP_Rpt_062.pdf

Additional/Backup
Slides

28Alternative Refrigerant Evaluation for High Ambient
Temperature Environments
Test Chamber
Multi-Zone Environmental Chambers,
• Outdoor chamber is 6.1×4.6 m
• DBT is controlled at −23 to 55°C (−10 to 131°F) and relative humidity at 30 to 90%.
• The 8.5 m square indoor chamber can be divided into up to individually controlled four spaces

29Alternative Refrigerant Evaluation for High Ambient
Temperature Environments
Instrumentation: R-22 system
• Custom built air enthalpy tunnel complying with AHRI Standard 210/240 and ANSI/ASHRAE Standard 37: 0.4%
• Coriolis mass flow meter: CMF25 with ±0.5% error
• Pressure sensors: ±0.08% BSL
• T-Type thermocouples: ±0.28°C (0.5°F)
• Dew point sensors: ±0.2°C (0.36°F)
• Barometric pressure sensors: ±0.6 hPa/mb
• Power meters: ±0.2% reading
All Instrumentation were calibrated either at ORNL metrology or third party calibration laboratory prior to initiating the experimental campaign

30Alternative Refrigerant Evaluation for High Ambient
Temperature Environments
Instrumentation: R-410A system
• Code Tester complying with AHRI Standard 210/240 and ANSI/ASHRAE Standard 37
• Coriolis mass flow meter: CMF25 with ±0.5% error
• Pressure sensors: ±0.08% BSL
• RTD: ±0.15°C (0.27°F) @ 0°C
• Wet bulb sensors: ±0.15°C (0.27°F) @ 0°C
• Barometric pressure sensors: ±0.6 hPa/mb
• Power meters: ±0.2% reading
All Instrumentation were calibrated either at ORNL metrology or third party calibration laboratory prior to initiating the experimental campaign

31Alternative Refrigerant Evaluation for High Ambient
Temperature Environments
Impact on Capacity
0
2
4
6
8
B A T3* T3 Hot Extreme
Co
olin
g C
apac
ity,
kW
R-22/mineral oil L-20A (R-444B) DR-3
N-20B ARM-20B R-290/POE
DR-93

32Alternative Refrigerant Evaluation for High Ambient
Temperature Environments
Impact on COP
0.0
1.0
2.0
3.0
4.0
5.0
B A T3* T3 Hot Extreme
CO
P
R-22/mineral oil L-20A (R-444B) DR-3
N-20B ARM-20B R-290/POE
DR-93

33Alternative Refrigerant Evaluation for High Ambient
Temperature Environments
Impact on Capacity
0
1
2
3
4
5
6
B A T3* T3 Hot Extreme
Co
olin
g C
apac
ity,
kW
R-410A R-32 DR-55
L-41 (R-447A) ARM-71a HPR-2A

34Alternative Refrigerant Evaluation for High Ambient
Temperature Environments
Impact on COP
0
1
2
3
4
5
B A T3* T3 Hot Extreme
CO
P
R-410A R-32 DR-55
L-41 (R-447A) ARM-71a HPR-2A

35Alternative Refrigerant Evaluation for High Ambient
Temperature Environments
Temperature glide at the evaporator for
R-22 and its alternatives

36Alternative Refrigerant Evaluation for High Ambient
Temperature Environments
Temperature glide at the evaporator for
R-410A and its alternatives