Dr. Colin Lawrence Director, Prudential Risk Division Financial Services Authority Improving...
24
Dr. Colin Lawrence Director, Prudential Risk Division Financial Services Authority Improving Sustainability in Banks Through Liquidity and Capital Management The Asian Banker Summit 2011 6-8 April 2011
-
Upload
gloria-watson -
Category
Documents
-
view
217 -
download
4
Transcript of Dr. Colin Lawrence Director, Prudential Risk Division Financial Services Authority Improving...

Dr. Colin LawrenceDirector, Prudential Risk Division
Financial Services Authority
Improving Sustainability in Banks Through Liquidity and Capital
Management
The Asian Banker Summit 20116-8 April 2011

Past Weaknesses – Liquidity Policy
• No clear articulation of risk tolerance and supervisory objectives
• Maintain going concern, or handle transition to gone concern?
• Took no account of the business cycle
• Underestimated potential stresses
• Cross-border issues not addressed
• Regulatory liquid assets not liquid

Past Weaknesses - Firms
Liquidity risk mismanaged
Governing Body not fully informed
Stress testing inadequate
Liquidity as a profit centre
Transfer pricing
New product approval

Implications for Firms
• Enhanced liquidity risk management capabilities in firms
• Greater use of stress testing
• Testing and improvements to contingency funding plans
• Less reliance on short-term wholesale funding, including from foreign counterparties
• Greater incentive to attract a higher proportion of retail time deposits
• A higher amount and quality of stocks of liquid assets, including a greater proportion of government debt
• A check on unsustainable expansion of lending during favourable economic times

Systems and Controls Requirements
Governing body & Senior management oversight
Comprehensive liquidity risk measurement
Pricing liquidity risk
Intra-day liquidity risk management
Managing liquidity across legal entities, business lines & currencies
Policies to control liquidity risk
Funding diversification
Management of collateral

New UK Regime- will converge into Basel 3
• Systems and Controls
• Adequate Liquidity & Self Sufficiency
• Stress Testing
• Individual Liquidity Adequacy Standards
• New Reporting
http://www.fsa.gov.uk/pubs/cp/cp09_13.pdf
http://www.fsa.gov.uk/pubs/cp/cp08_22.pdf

Sustainable Business Model is Key Starting PointBut Many Different Business Models Suffered in The Crisis
Businesses need to be well run, and the Business Model and Risk Appetite aligned
High Liquidity
Ratios
Crisis Casualties Included:
Small Building Societies
Regional Banks
Large Universal Banks
Investment Banks
Global Players
Domestic Businesses

Illustrative Impact of Cyclical Downturn on Portfolios
Credit Grade
PD LGDCredit
PremiumTransfer
Price
Branch add-on /
yearCoupon
Economic Capital
RAROCRequired
Shareholder Return (IPO)
Economic Value Added
(EVA)1 0.05% 40% 0.02% 1% 0.05% 1.07% 0.30% 16.95% 14% 0.01%2 0.50% 40% 0.20% 2% 0.20% 2.40% 1.84% 10.87% 14% -0.06%3 1.00% 40% 0.40% 3% 0.40% 3.80% 3.10% 12.90% 14% -0.03%4 5.00% 60% 3.00% 4% 2.00% 9.00% 14.45% 13.84% 14% -0.02%5 10.00% 70% 7.00% 5% 4.00% 16.00% 26.19% 15.27% 14% 0.33%
Net total EVA 0.23%
1 0.20% 60% 0.12% 1% 0.05% 1.17% 1.35% 3.70% 14% -0.14%2 2.00% 60% 1.20% 2% 0.20% 3.40% 7.69% 2.60% 14% -0.88%3 4.00% 60% 2.40% 3% 0.40% 5.80% 12.45% 3.21% 14% -1.34%4 20.00% 80% 16.00% 4% 2.00% 22.00% 44.55% 4.49% 14% -4.24%5 40.00% 90% 36.00% 5% 4.00% 45.00% 69.95% 5.72% 14% -5.79%
Net total EVA -12.39%
1 0.03% 40% 0.01% 1% 0.05% 1.06% 0.17% 30.06% 14% 0.03%2 0.25% 40% 0.10% 2% 0.20% 2.30% 1.08% 18.60% 14% 0.05%3 0.50% 40% 0.20% 3% 0.40% 3.60% 1.84% 21.75% 14% 0.14%4 2.50% 60% 1.50% 4% 2.00% 7.50% 9.01% 22.20% 14% 0.74%5 5.00% 70% 3.50% 5% 4.00% 12.50% 16.86% 23.73% 14% 1.64%
Net total EVA 2.60%
Cyclical Downturn
Cyclical Upturn
Base Case
Gains
Losses
Cyclical
User Cost of Credit
Payable to Treasury
CRM Spread

EPS RAPM
• Risk Information• Diversification
EVA
• Growth rate• Business cycle
Fair Value Stock Price
• Investor perception• Market sentiment
Revenue Risk AdjustedRevenue
Shareholder Value
OperatingMargin
CapitalStructure
• Pricing - Spreads - Fees• Product Cost• Overhead
Market Risk
Credit Risk
Operational Risk
Diversification / Concentration
Benefits
• Portfolio div. (inside risk categories)• Strategic div. (across risk categories)
IndustryGrowth
Share ofMarket
• Market Penetration
• Product expansion
New Client
Client Retention
• Product Mng.
• Sales forces incentives
• Selling skills
Client awareness
Product Innovation
Promotion effectiveness
Liquidity Risk
The Critical Link Between Risk and Stakeholder ValueRisk Transformation is What Banks Do…
To understand risk adjusted profitability, a Board has to understand the risks being run

Historic Return on Equity for UK Banks “…as long as the music is playing, you’ve got to get up and dance. We’re still dancing” Chuck Prince 9 July 2007
Average ROE below 10% pa,
volatility low at c.2% pa
Average ROE over 20% pa, c.30%
pre-crisis and volatility much higher
Higher returns even when driven by higher risk & leverage were rewarded by the market

No Business Model is Inherently “Better”…But Some are Riskier Than Others
1. RAROC• Risk appetite• Risk strategy
2. Capital and Liquidity• Appropriate given 1.• Still appropriate under stress?
3. Risk Management & Control• First line of defence• Local level independent challenge essential• Principal agent problems
4. May show 1. does not work given 2. and 3.• Forces correct pricing• Can you create EVA under stress?
5. Complexity & Opacity• If you can’t measure and monitor risk - you should not do it• Regulators must be willing to shut down areas of business
6. Shadow Banking• Unintended consequence of more regulation?• How do we monitor and control?
Key issues to consider:

Basel 3 – More Capital & Higher Quality CapitalReflects Key Regulatory Objective of Increasing Loss Absorbency
Core(at least 50% of T1)
Non-innovative
Innovative (max 15% of T1)
Upper Tier 2
Lower Tier 2(max 50% of T1)
Upper Tier 3
Lower Tier 3(not limited)
Tie
r 1
Cap
ital
Tie
r 2
capi
tal
Tie
r 3
15%
50%
50%
100%
250%
of
Tier 1
capital
Core
Non- core
Tie
r 1
Cap
ital
Tier 2
Tie
r 2
capi
tal
Goi
ng c
once
rn c
apita
lG
one
conc
ern
capi
tal
50%
4.5% 6%
8%
FSA Current Regime Basel 3 proposal
Global minimum liquidity regime also introduced for the first time

• Sensitivity analyses– Large movement on single factor or parameter
• Scenario analyses– Used to assess model risk, effectiveness of potential hedging strategies etc.– Full representations of possible future situations to which portfolio may be subjected– Involves simultaneous, extreme moves of a set of factors– Reflects individual effects and interactions between different risk factors, assuming a certain cause for the combined adverse movements– Used to assess particular scenarios (e.g worst-case)
• Historical– Based on observed events from the past
• Hypothetical– Plausible events that are yet to be realized– Requires expert judgment and analysis – sometimes difficult to link with underlying factors
• Macroeconomic (eg changes in unemployment, cyclical downturn etc)– A shock to the entire economy – Occurs external to firm and develops over time
• Market (eg stock market crash, change in interest rates, shock to credit spreads in a sector)– A shock to the financial and capital markets– May be historical or hypothetical
• Event-driven – Based solely on a specific event independent of the portfolio characteristics– Identify risk sources/events that cause changes in market and effects of these changes on the risk parameters
• Portfolio-driven – Directly linked to the portfolio– Identify risk parameters changes that result in a portfolio change and identify events that cause the parameters to change
• Worst Case/Catastrophe (E.g. terrorist attack, change in regulations)– Event exogenous to market/economy, though impact arises through resulting changes – Often are tied to specific characteristics of portfolio or exposures
Different Types of Stress Tests RequiredForward Looking, With a Focus on Extreme Tails & Points of Weakness

Expectation of Firm’s Stress Testing FrameworkIntegrated with Risk Appetite & Business, Capital & Liquidity Planning
Business strategy
Risk appetite
Business Plan / Operating plan / Corporate Plan
Capital Planning
Stress testing (base &
stress plan)
Mitigation plan
Stage 1
C. Taking actionManagement
actionsRegular
monitoringAmendments to business plan
B. Implementing
Second-order effects
Challenge process
Firm wide and granular
Forward looking
A. EstablishingStress testing programme
Stress testing infrastructure
Policies and procedures
Stress testing governance framework – active Board and senior management ownership and engagement in all stages
Stage 2

ECONOMETRIC / QUALITATIVE ASSESSMENT
STRESSED IMPAIRMENTS YRS 1-5
ST
RE
SS
ED
CO
RE
TIE
R 1 C
AP
ITA
L V
S. T
HR
ES
HO
LD
STRESSED PPI YRS 1-5
STRESSED PPI YRS 1-5
STRESSED PPI YRS 1-5
STRESSED PPI YRS 1-5
STRESSED VALUATIONS YRS 1-5
STRESSED ADJUSTMENTS YRS 1-5
STRESSED IMPAIRMENTS YRS 1-5
PRE-PROV INCOME(PPI)
BUSINESS UNIT 1
BUSINESS UNIT 2
BUSINESS UNIT 3
REVENUE COST
REVENUE COST
REVENUE COST
GROUP
TRADING BOOK STRUCTURED FINANCE, CREDIT, MONOLINES, MARKET RISK
OTHER STRESS PENSION, CONDUCT OF BUSINESS, ETC
IMPAIRMENTS PORTFOLIO 1
PORTFOLIO 2
PORTFOLIO 3
GROUP
LGD
PD
LGD
ELPD
PD
LGD
EL
STRESSED IMPAIRMENTS YRS 1-5
STRESSED IMPAIRMENTS YRS 1-5
CALIBRATION
GDP UNEMPLOYMENTHOUSE PRICES
COMMERCIAL PROPERTY
INTEREST RATES
MACRO ECONOMIC SCENARIO
INFLATION
REVISED CORE TIER 1 YRS 1-5
STRESSED RWAS YRS 1-5EAD, PD, CYCLICALITY FACTOR/ MARKET RISK RWASRWAS
MNGMT ACTION CAPITAL RAISING, DISPOSALS, COST CUTTING ETC
BA
NK
1
BA
NK
2
BA
NK
3
BA
NK
4
BA
NK
5
SYSTEMIC
& PEER
VIEW
EL
1: Agree the macro scenario 2: Macro to Micro
5: Management Actions
3: Stress the Firm
4: Aggregate outcome
Macro to Micro – Vicious or Virtuous Cycle?Threshold Conditions for Intervention & Management Actions Key

YEAR 1 BANK 1 BANK 2 BANK 3 BANK 4 BANK 5CT 1 START YR 1 7.10% 6.30% 8.20% 7.80% 6.20%
PORTFOLIO A -0.1% -0.1% -0.05% -0.05% -0.08%PORTFOLIO B -0.2% -0.2% -0.1% -0.15% -0.12%PORTFOLIO C -5.0% -6.0% -5.5% -4.0% -6.2%PORTFOLIO D -1.0% -0.5% -0.6% -0.4% 0.9%PORTFOLIO E -2.0% -0.5% -1.5% -0.5% -1.5%
CT 1 FINISH YR 1 7.2% 6.5% 8.5% 8.0% 6.5%
YEAR 2BANK 1 BANK 2 BANK 3 BANK 4 BANK 5
CT 1 START YR 2 7.2% 6.5% 8.5% 8.0% 6.5%PORTFOLIO A -0.7% -0.5% -0.6% -0.5% -0.5%PORTFOLIO B -1.5% -1.2% -2.0% -1.0% -1.2%PORTFOLIO C -7.5% -8.0% -8.0% -7.8% -9.0%PORTFOLIO D -2.0% -2.5% -1.8% -1.9% -2.3%PORTFOLIO E -6.0% -4.0% -6.5% -4.0% -5.0%
CT 1 FINISH YR 2 5.2% 5.4% 6.5% 7.0% 4.8%
YEAR 3BANK 1 BANK 2 BANK 3 BANK 4 BANK 5
CT 1 START YR 3 5.2% 5.4% 6.5% 7.0% 4.8%PORTFOLIO A -0.9% -0.6% -0.9% -0.7% -0.6%PORTFOLIO B -2.3% -1.7% -2.9% -1.6% -1.8%PORTFOLIO C -12.0% -9.0% -11.0% -10.0% -12.0%PORTFOLIO D -3.0% -2.2% -2.8% -2.5% -2.5%PORTFOLIO E -7.5% -4.8% -7.5% -4.9% -6.0%
CT 1 FINISH YR 3 2.5% 4.1% 4.5% 5.5% 2.4%
IMPAIRMENTS UNDER STRESSED CONDITIONS
IMPAIRMENTS UNDER STRESSED CONDITIONS
IMPAIRMENTS
PORTFOLIO C
Systemic Risk KPI
Firms to focus on
Micro to Macro - Illustrative Portfolio AnalysisEarly Signalling of Risk via Leading Indicators Key
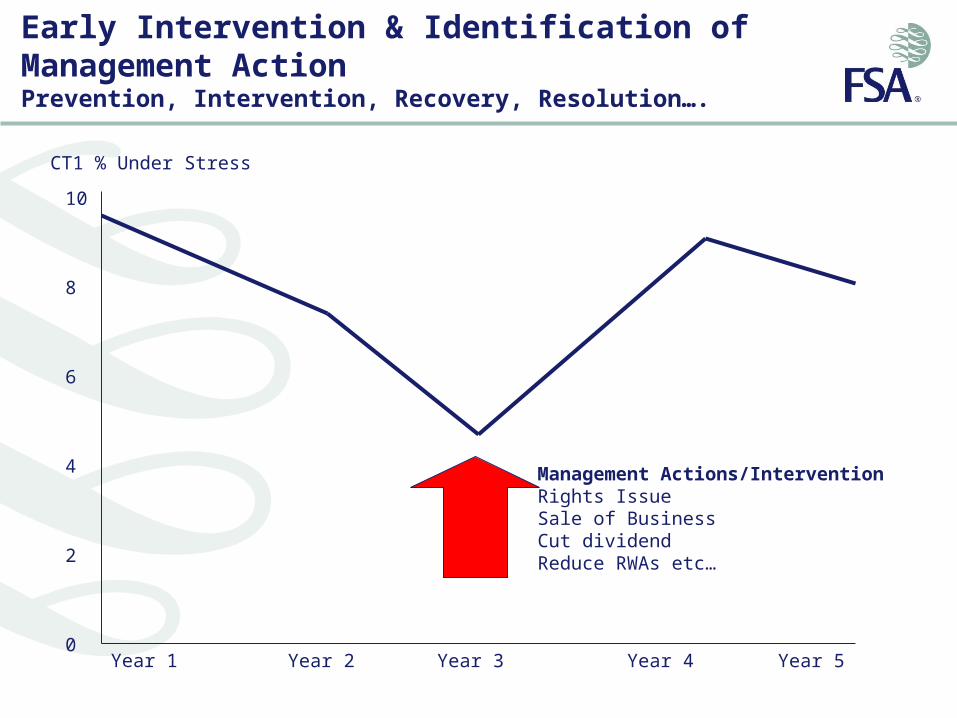
Early Intervention & Identification of Management ActionPrevention, Intervention, Recovery, Resolution….
Year 1 Year 4Year 2 Year 3 Year 5
CT1 % Under Stress
10
8
6
4
2
0
Management Actions/InterventionRights IssueSale of BusinessCut dividendReduce RWAs etc…

Liquidity Stress TestingNeed to Ensure Time For Remedial Action
Cash Flows
Liquidity Position
Profitability
Solvency
Idiosyncratic Stress
Market Wide
Stress
Combination
Stress
Wholesale funding risk
Retail funding risk
Intra-day liquidity risk
Funding diversification risk
Intra-group liquidity risk
Cross-currency liquidity risk
Off-balance sheet liquidity risk
Franchise-viability liquidity risk
Marketable asset risk
Non-marketable asset risk
Short Term & Protracted
Short Term & Protracted
Basel 3 new focus on liquidity, UK regime already implemented

Stress Testing
Cash Flows
Liquidity Position
Profitability
Solvency
Idiosyncratic Stress
Market WideStress
CombinationStress
Wholesale funding risk
Retail funding risk
Intra-day liquidity risk
Funding diversification risk
Intra-group liquidity risk
Cross-currency liquidity risk
Off-balance sheet liquidity risk
Franchise-viability liquidity risk Marketable asset risk
Non-marketable asset risk
Short Term & Protracted
Short Term & Protracted
Includes stress to failure

Hypothetical Comparison of Liquidity Mismatch by Type
Lock Out From Unsecured
-20%
-10%
0%
10%
20%
30%
40%
50%
60%
8 Day Mismatch 1 Month Mismatch 3 Month Mismatch
6 Month Mismatch 12 Month Mismatch > 12 Months Mismatch
Bank A Bank B Bank C Bank D
Lock Out From Unsecured Plus Immediate 20% Outflow of Withdrawable Retail and Corporate Funds
-20%
-15%
-10%
-5%
0%
5%
10%
15%
8 Day Mismatch 1 Month Mismatch 3 Month Mismatch
6 Month Mismatch 12 Month Mismatch > 12 Months Mismatch
Bank A Bank B Bank C Bank D
-25%
-20%
-15%
-10%
-5%
0%
5%
10%
8 Day Mismatch 1 Month Mismatch 3 Month Mismatch
6 Month Mismatch 12 Month Mismatch > 12 Months Mismatch
Bank A Bank B Bank C Bank D
Lock Out From Unsecured Plus Immediate 20% Outflow of Withdrawable Retail and Corporate Funds, 75% Free Client & 15% Off Balance Sheet
Lock Out From Secured & Unsecured
-30%
-20%
-10%
0%
10%
20%
30%
40%
8 Day Mismatch 1 Month Mismatch 3 Month Mismatch
6 Month Mismatch 12 Month Mismatch > 12 Months Mismatch
Bank A Bank B Bank C Bank D
Lock Out From Non Eligible Secured and Unsecured
-20%
-10%
0%
10%
20%
30%
40%
8 Day Mismatch 1 Month Mismatch 3 Month Mismatch
6 Month Mismatch 12 Month Mismatch > 12 Months Mismatch
Bank A Bank B Bank C Bank D
Lock Out From Unsecured Plus 20% Outflow of Withdrawable Retail
-20%
-15%
-10%
-5%
0%
5%
10%
15%
20%
8 Day Mismatch 1 Month Mismatch 3 Month Mismatch
6 Month Mismatch 12 Month Mismatch > 12 Months Mismatch
Bank A Bank B Bank C Bank D

Hypothetical Comparison of Liquidity Mismatch by TypeLink to Liquidity Stress Tests and Funds Transfer Pricing is Key
Increasing Stress (1 - 3)
Lock Out From Unsecured
-20%
-10%
0%
10%
20%
30%
40%
50%
60%
8 Day Mismatch 1 Month Mismatch 3 Month Mismatch
6 Month Mismatch 12 Month Mismatch > 12 Months Mismatch
Bank A Bank B Bank C Bank D
Lock Out From Unsecured Plus Immediate 20% Outflow of Withdrawable Retail and Corporate Funds
-20%
-15%
-10%
-5%
0%
5%
10%
15%
8 Day Mismatch 1 Month Mismatch 3 Month Mismatch
6 Month Mismatch 12 Month Mismatch > 12 Months Mismatch
Bank A Bank B Bank C Bank D
-25%
-20%
-15%
-10%
-5%
0%
5%
10%
8 Day Mismatch 1 Month Mismatch 3 Month Mismatch
6 Month Mismatch 12 Month Mismatch > 12 Months Mismatch
Bank A Bank B Bank C Bank D
Lock Out From Unsecured Plus Immediate 20% Outflow of Withdrawable Retail and Corporate Funds, 75% Free Client & 15% Off Balance Sheet
Lock Out From Secured & Unsecured
-30%
-20%
-10%
0%
10%
20%
30%
40%
8 Day Mismatch 1 Month Mismatch 3 Month Mismatch
6 Month Mismatch 12 Month Mismatch > 12 Months Mismatch
Bank A Bank B Bank C Bank D
Lock Out From Non Eligible Secured and Unsecured
-20%
-10%
0%
10%
20%
30%
40%
8 Day Mismatch 1 Month Mismatch 3 Month Mismatch
6 Month Mismatch 12 Month Mismatch > 12 Months Mismatch
Bank A Bank B Bank C Bank D
Lock Out From Unsecured Plus 20% Outflow of Withdrawable Retail
-20%
-15%
-10%
-5%
0%
5%
10%
15%
20%
8 Day Mismatch 1 Month Mismatch 3 Month Mismatch
6 Month Mismatch 12 Month Mismatch > 12 Months Mismatch
Bank A Bank B Bank C Bank D
A B C
1 2 3
Decreasing Stress (A - C)

Recovery and Resolution Plans “Living Wills”Regulator Actively Involved Through Supervision & Specialist Reviews
1. Key triggers Breached
2. Key triggers breached
Resolution Plan
OPTIONS• Wind-downs and
disposals• Early equity
injection• Deposit transfer/
Bridge Bank• Liquidation/
Deposit pay off• Share transfer
(Temporary Public Ownership)
Regulator Owns & Executes
Gone ConcernKey elements of Recovery Plan also feature in Resolution Plan
CRISIS
DATA
Going Concern
Bank Owns & Executes
Operational & Legal Structure
CURRENT
• Hold-Co vs. Branches• Segregation of accounts• Single customer view• Booking practices• Infrastructure issues• Local liquidity• Collateral (aggregation,
hypothecation…)• Off-balance sheet items• Cross border complications
TIME
Recovery Plan
Recovery Capital Plan
Recovery Liquidity Plan
Reduce / stop activities
Plan to wind down/liquidate trading book
Bank Owns & Executes
Going Concern
RECOVERY
Plan to sell Businesses/Subsidiaries

Speed MattersMarket May Allow Little Time Between Recovery and Resolution
Mar 16
Bear Stearns, acquired by JP Morgan
Sep 14
Merril Lynch is sold to Bank of America
Goldman Sachs receives support of $5Bn from B. Hathaway Investment
Sep 23Sep 07
Fannie Mae & Freddie Mac are rescued by the FED
Oct 12
Wachovia is acquired by Wells Fargo
2008Sep 25
JP Morgan buys Washington Mutual
Lehman Brothers declares bankruptcy
Sep 15Aug 07
Nothern Rock nationalization
2007
Lloyds take-over HBOS
Sep 17 Oct 13
UK Government rescues RBS
The next crisis will be different – together we are building a global framework that is robust and forward looking

Better Macro & Micro Prudential SupervisionData + Analytics + Judgement Key
• WHAT- Ensure financial stability– Monitor, identify and prioritise systemic risk– Link micro-supervision and macro-economic risks– Consider unregulated parts of the market– Ensure it is somebody’s job to remove the “punchbowl”
• HOW - By getting ahead of the curve – Create counter-cyclical buffers – capital/liquidity in the system should rise as risk rises – Identify leading indicators (data + analytics + judgement)– Clear thresholds for intervention
• ACTIONS - Resolve if necessary– Early action when thresholds breached
• Firm specific (Management actions)• Market wide levers (eg LTV ratios)
– Contingency plans in place – Living Wills– Bail–out to Bail-in– Resolution
Monetary Policy
Macro Prudential Supervision
Micro Prudential Supervision