Dr. Arvind Virmani (views are personal) Based on the book, The Sudoku of India… · 2019-10-28 ·...
33
Dr. Arvind Virmani (views are personal)
Transcript of Dr. Arvind Virmani (views are personal) Based on the book, The Sudoku of India… · 2019-10-28 ·...

Dr. Arvind Virmani(views are personal)
Presenter
Presentation Notes
Based on the book, The Sudoku of India’s Growth, BS Books, Business Standard Ltd., New Delhi 2009. See also, Propelling India from Socialist Stagnation to Global Power: Growth Process, Vol. I (Policy Reform, Vol. II), Academic Foundation, New Delhi, 2006.
INTRODUCTION
Long Term Growth Trends, Phases
Recent Performance: 2003‐4 to 2007‐8
Sustaining growth Role of Policy reform
24 September 2009 2Oecd: AV
Presenter
Presentation Notes
Based on and 3 of the book, The Sudoku of India’s Growth, BS Books, Business Standard Ltd., 2009. Propelling India from Socialist Stagnation to Global Power: Growth Process, Vol. I (Policy Reform, Vol. II), Academic Foundation, New Delhi, 2006. Policy Regimes, Growth and Poverty in India: Lessons of Government Failure and Entrepreneurial Success!, Working Paper No. 170, ICRIER, October 2005. “The Dynamics of Competition: Phasing of Domestic and External Liberalisation in India,” Working Paper No. 4/2006-PC, Planning Commission, April 2006.
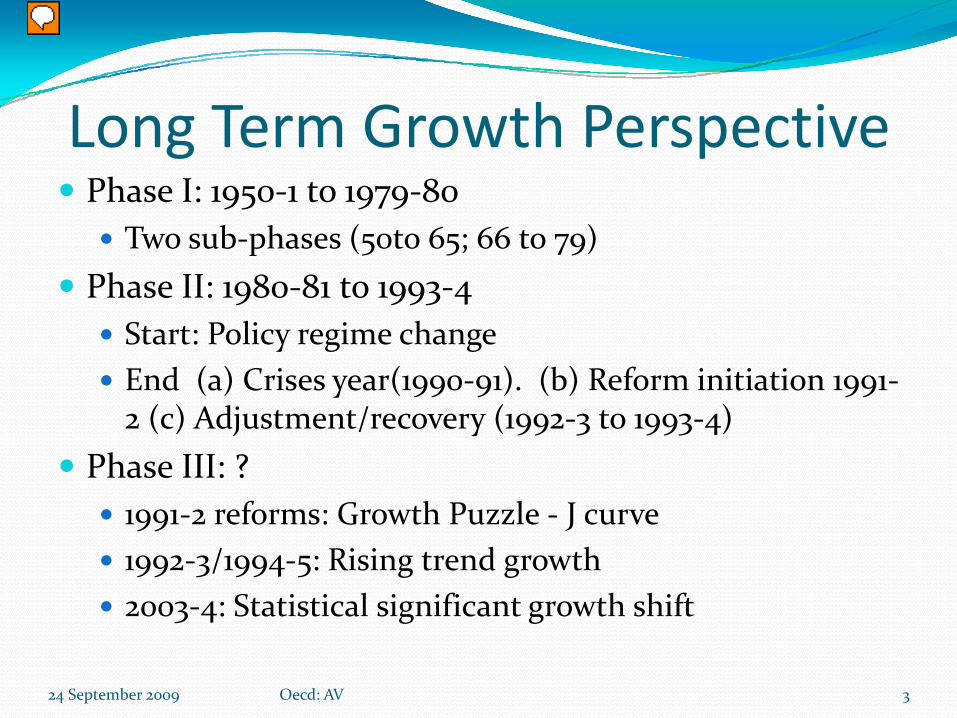
Long Term Growth PerspectivePhase I: 1950‐1 to 1979‐80
Two sub‐phases (50to 65; 66 to 79) Phase II: 1980‐81 to 1993‐4
Start: Policy regime changeEnd (a) Crises year(1990‐91). (b) Reform initiation 1991‐2 (c) Adjustment/recovery (1992‐3 to 1993‐4)
Phase III: ?1991‐2 reforms: Growth Puzzle ‐ J curve1992‐3/1994‐5: Rising trend growth2003‐4: Statistical significant growth shift
24 September 2009 3Oecd: AV
Presenter
Presentation Notes
India’s Economic Growth: From Socialist Rate of Growth to Bharatiya Rate of Growth, Working Paper No. 122, ICRIER, February 2004. Policy Regimes, Growth and Poverty in India: Lessons of Government Failure and Entrepreneurial Success!, Working Paper No. 170, ICRIER, October 2005. “The Dynamics of Competition: Phasing of Domestic and External Liberalisation in India,” Working Paper No. 4/2006-PC, Planning Commission, April 2006.
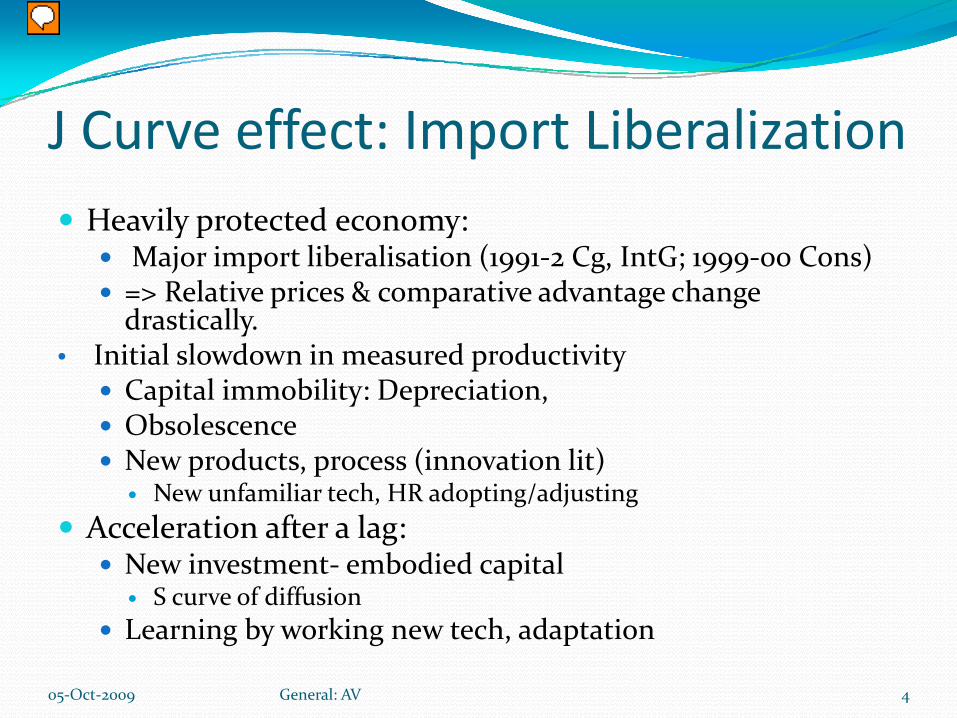
J Curve effect: Import LiberalizationHeavily protected economy:
Major import liberalisation (1991‐2 Cg, IntG; 1999‐00 Cons)=> Relative prices & comparative advantage change drastically.
• Initial slowdown in measured productivityCapital immobility: Depreciation, ObsolescenceNew products, process (innovation lit)
New unfamiliar tech, HR adopting/adjustingAcceleration after a lag:
New investment‐ embodied capital S curve of diffusion
Learning by working new tech, adaptation
05‐Oct‐2009 4General: AV
Presenter
Presentation Notes
Skip for 35-40 min talk.
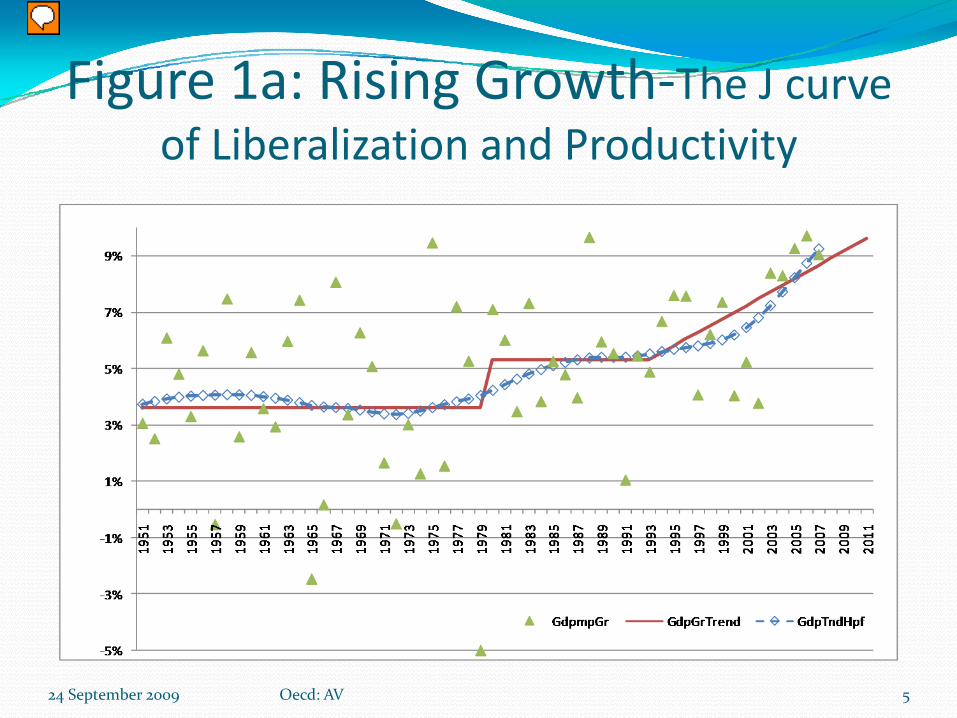
Figure 1a: Rising Growth‐The J curve of Liberalization and Productivity
24 September 2009 5Oecd: AV
Presenter
Presentation Notes
J curve effect. (1) Heavily protected-import liberalisation: drastic change in relative prices. (2) Fall in measured productivity-capital immobility & obsolesence (3) Acceleration after lag: I embodied technology, S curve of diffusion, unfamiliar tech HR adjusting, learning. Adjusted R square = 0.57.
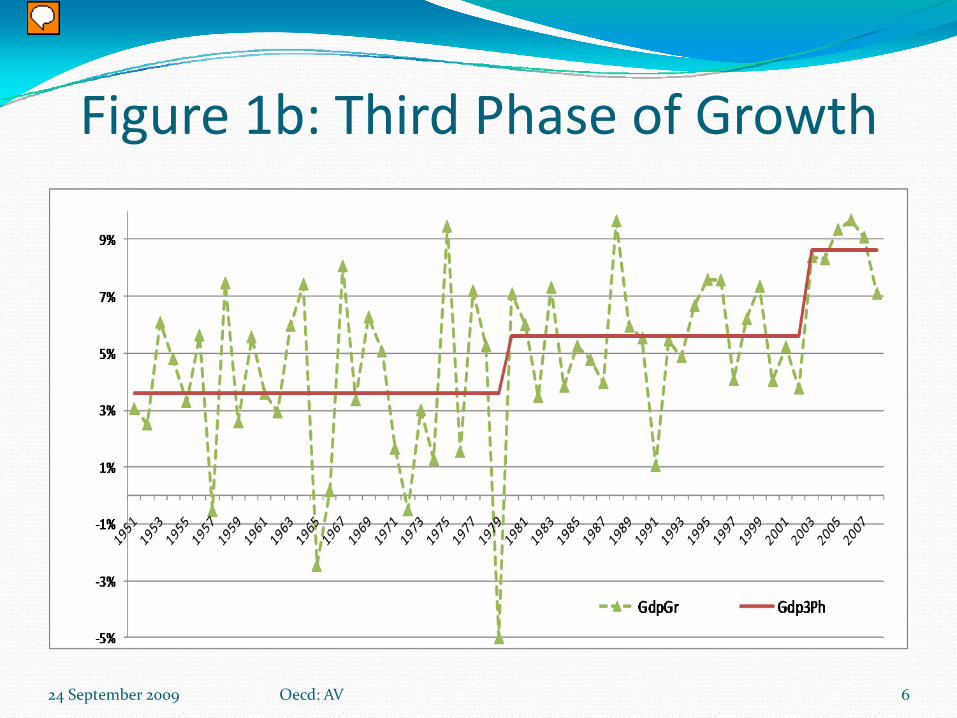
Figure 1b: Third Phase of Growth
24 September 2009 6Oecd: AV
Presenter
Presentation Notes
J curve effect. (1) Heavily protected-import liberalisation: drastic change in relative prices. (2) Fall in measured productivity-capital immobility & obsolesence (3) Acceleration after lag: I embodied technology, S curve of diffusion, unfamiliar tech HR adjusting, learning. Adjusted R square = 0.57.

Recent Developments: Past five years ( 2003‐4 to 2007‐8)
Growth AccelerationGross Domestic ProductAverage Income / Per capita GDPmp (PcGdp)Avg. Private Consumption (PvtCons)
Aggregate Growth driversSupply sideDemand Side
Sector drivers of growth
24 September 2009 7Oecd: AV

Growth acceleration: ( 2003‐4 to 2007‐8)
In the next three figures:‐Cyclical movement around Rising trend
HP filtered trendGDPmp: Avg. growth of 8.9%Per Capita gdp growth has doubled
To 7.3% (from 3.7% in 1980‐1991)Average income will double in ten years
Avg. Private Consumption Gr rt: Almost doubled
24 September 2009 8Oecd: AV
Presenter
Presentation Notes
Related to next three figures
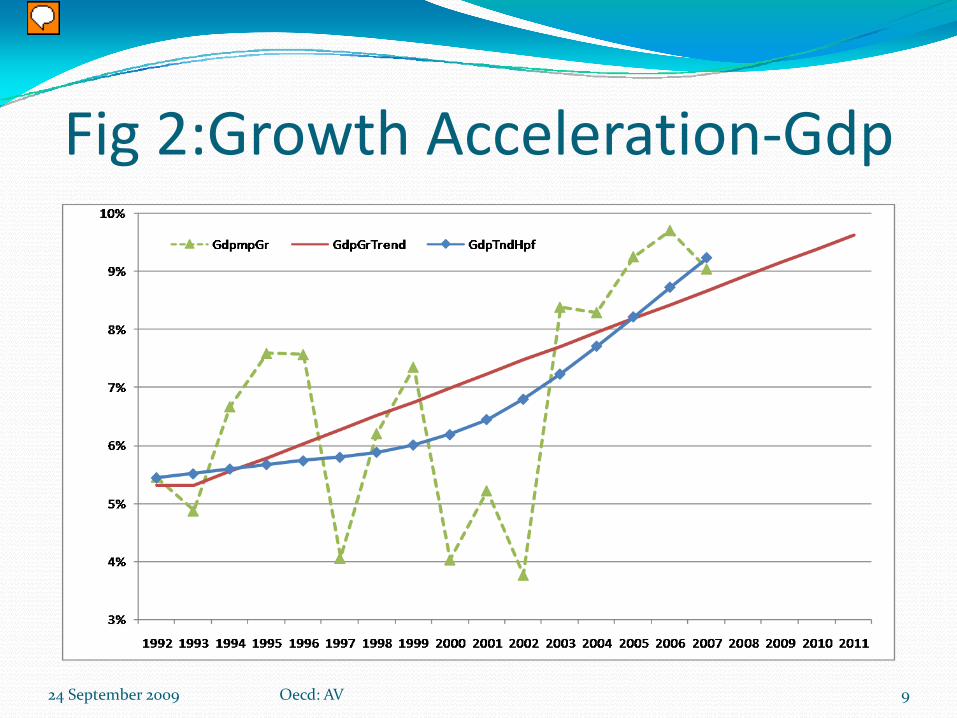
Fig 2:Growth Acceleration‐Gdp
24 September 2009 9Oecd: AV
Presenter
Presentation Notes
2000-2002 pessimism, 2003-2004 Cyclical recovery, 2005-2006 cyclical up swing projected to 10% growth, 2007 back to trend. 2008-9 below trend because of global developments, particularly oil/commodities but also financial crisis (indirect effect of).
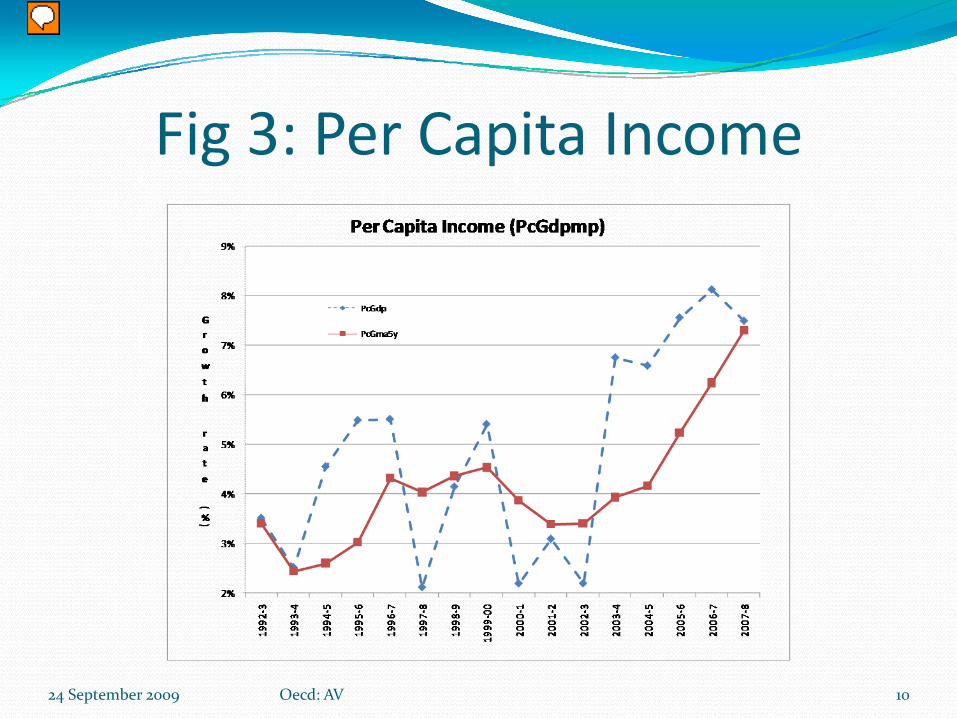
Fig 3: Per Capita Income
24 September 2009 10Oecd: AV
Presenter
Presentation Notes
Per Capita Gdp growth: To 7.3% in 2003-4 to 2007-8 from 3.7% (1980-1 to 1991-2) ; Average income will double in ten years instead of in a generation.
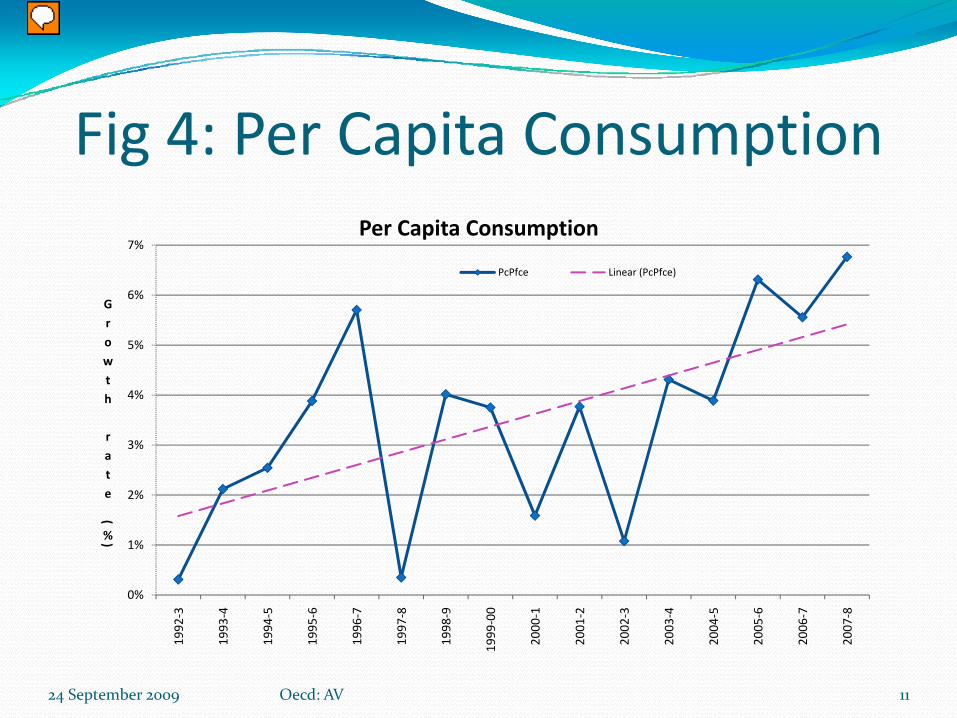
Fig 4: Per Capita Consumption
24 September 2009 11Oecd: AV
0%
1%
2%
3%
4%
5%
6%
7%
1992
‐3
1993
‐4
1994
‐5
1995
‐6
1996
‐7
1997
‐8
1998
‐9
1999
‐00
2000
‐1
2001
‐2
2002
‐3
2003
‐4
2004
‐5
2005
‐6
2006
‐7
2007
‐8
Growth
rate
(
%)
Per Capita Consumption
PcPfce Linear (PcPfce)
Presenter
Presentation Notes
Avg. Private Consumption Gr rt: Almost doubled during the past five years from previous 12 years (and doubled from what it was 10 years prior to that)
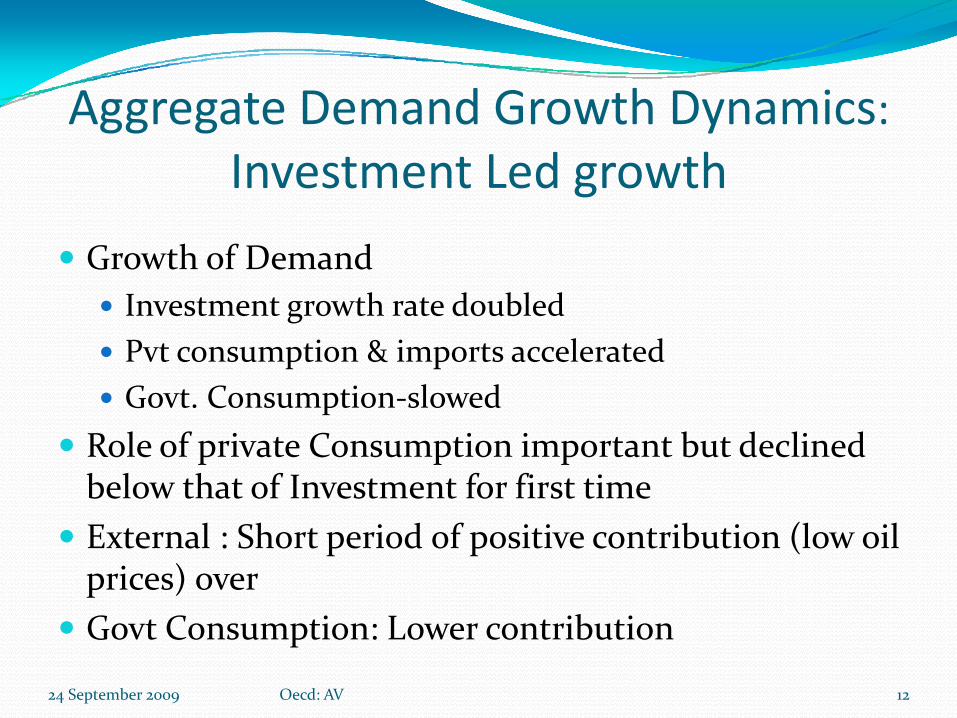
Aggregate Demand Growth Dynamics: Investment Led growth
Growth of Demand Investment growth rate doubledPvt consumption & imports acceleratedGovt. Consumption‐slowed
Role of private Consumption important but declined below that of Investment for first timeExternal : Short period of positive contribution (low oil prices) overGovt Consumption: Lower contribution
24 September 2009 12Oecd: AV

Fig 5: Investment Led
24 September 2009 13Oecd: AV
Presenter
Presentation Notes
Similar picture for Gross Fixed Investment
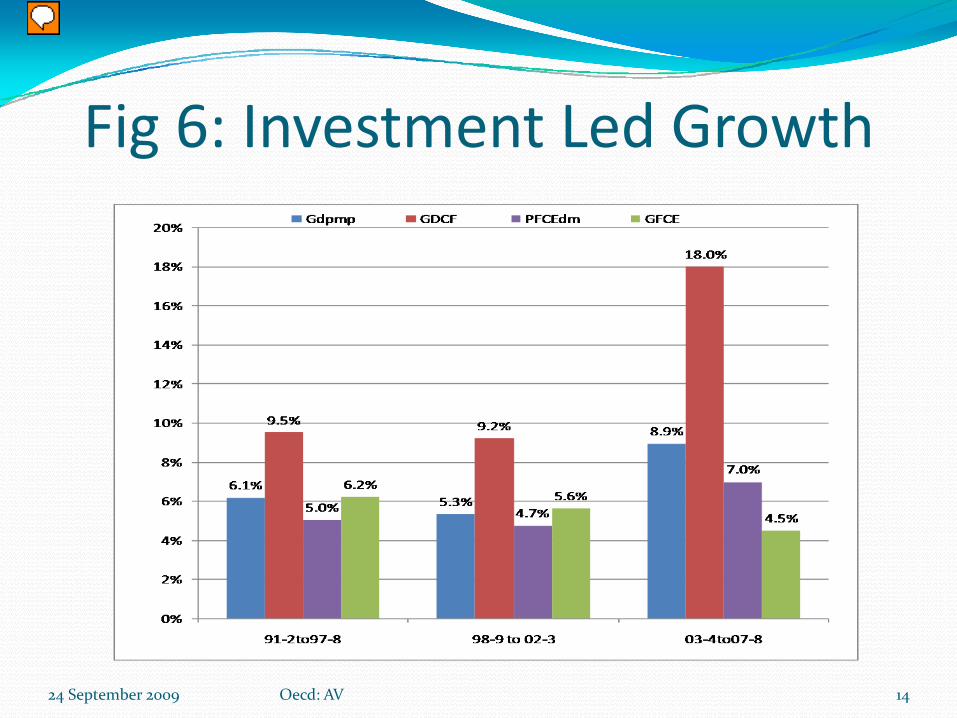
Fig 6: Investment Led Growth
24 September 2009 Oecd: AV 14
Presenter
Presentation Notes
Growth rate of : Total output (blue-accelerated), Total Investment (red-accelerated sharply), Private Final consumption Expenditure (purple-accelerated) and Govt final consumption expenditure (green-declerated).
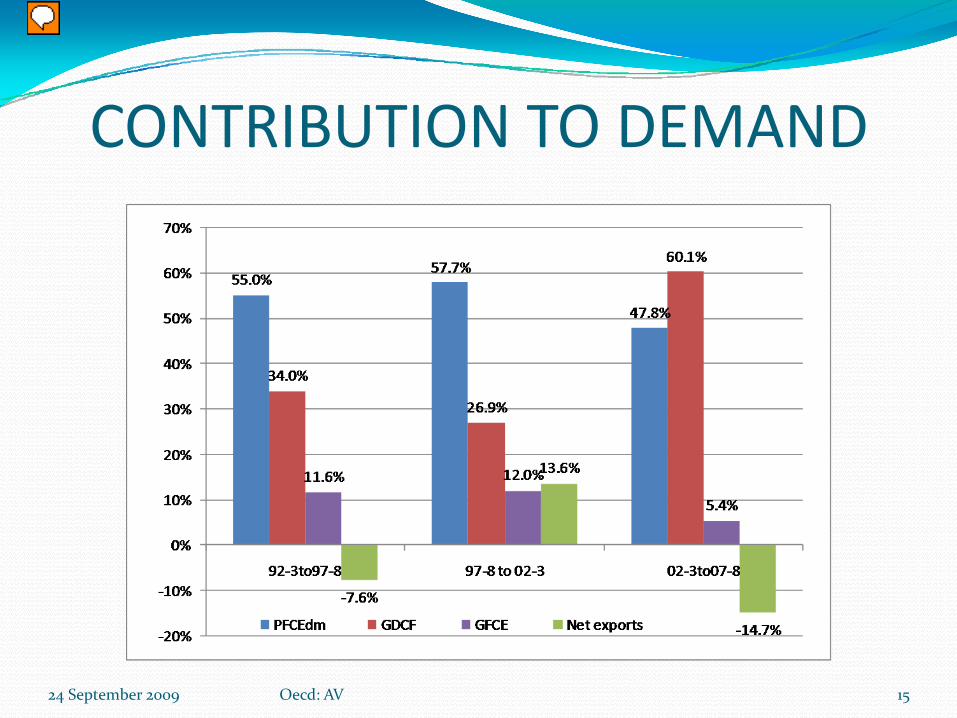
CONTRIBUTION TO DEMAND
24 September 2009 Oecd: AV 15
Presenter
Presentation Notes
Contribution of Govt final consumption down to 5.4% from average of 11.8% in past 10 years (12% & 11.6%).
Supply Side: Investment & SavingsInvestment growth led by
Fixed investment i.e. not inventory build up Private Investment i.e. Profitable
Increase in productive capacity of the economySavings rate also rose: Private & Public sectorsSaving rises with income/investment
Lag during sharp acceleration
24 September 2009 16Oecd: AV

Investment: Total, Fixed & Private (ratio to GDP)
24 September 2009 17Oecd: AV
Presenter
Presentation Notes
GCF: 5 yr avg. 33.5% of GDP from 23.9% in previous 5 yrs (+9.5%). 2007-8 up to 38.4% of GDP i.e Chinese levels. GFCF: 5 yr avg. 30.3% of GDP from 23% in previous 5 yrs (+7.3%). 2007-08 up to 34.6% of GDP (9% gr at 3.8 Icor). I fixed private: Up 6.8% (4 yrs avg) out of total 7.3% (5 yrs avg).

Supply Side: SavingsSavings rate also rose by 9.8% (2003‐4 to 2007‐8)
Avg. 33.3% of GDP from 23.6% in previous 5 yrsPrivate and Public
Increment (4 yrs) 5.1% & 3.4% respectivelyContributed(60:40)
Saving Rate: 36.1% of GDP in 2007‐8Maintenance of Investment and Saving Rate at 2007‐8 levels enough to give average growth 0f around 9%
Possible with deceleration in gr of profits, saving & investment to 9%.
24 September 2009 18Oecd: AV

FDI : Inward and outward
24 September 2009 19Oecd: AV
Presenter
Presentation Notes
Year 2005 2006 2007 Fdi Net $4.7 8.4 9.4 bi Inward $7.7 19.4 22.1 bi Outward $2.9 11.0 12.7 bi

Sources of Growth
24 September 2009 20Oecd: AV
Presenter
Presentation Notes
Net domestic product per person, Capital intensity-Capital stock per person, Total factor productivity

Sector DriversManufacturing
GDP/Value AddedInvestment: GCF, GFCF
CommunicationCompetition and efficiency
Trade, Agriculture, ConstructionLabor intensive
24 September 2009 21Oecd: AV

Drivers of Growth
24 September 2009 Oecd: AV 22

Sector Drivers of GrowthAcceleration in Value Added: Increase in growth rate
Highest for Manufacturing and construction Followed by storage & agriculture.
Investment Growth: Manufacturing 30.5% per yearCapital stock (end 2007‐8 over end 2002‐3).
Construction(1.92 times) Manufacturing (1.75 times), Trade, Hotels & Restaurants (1.62 times).
24 September 2009 Oecd: AV 23
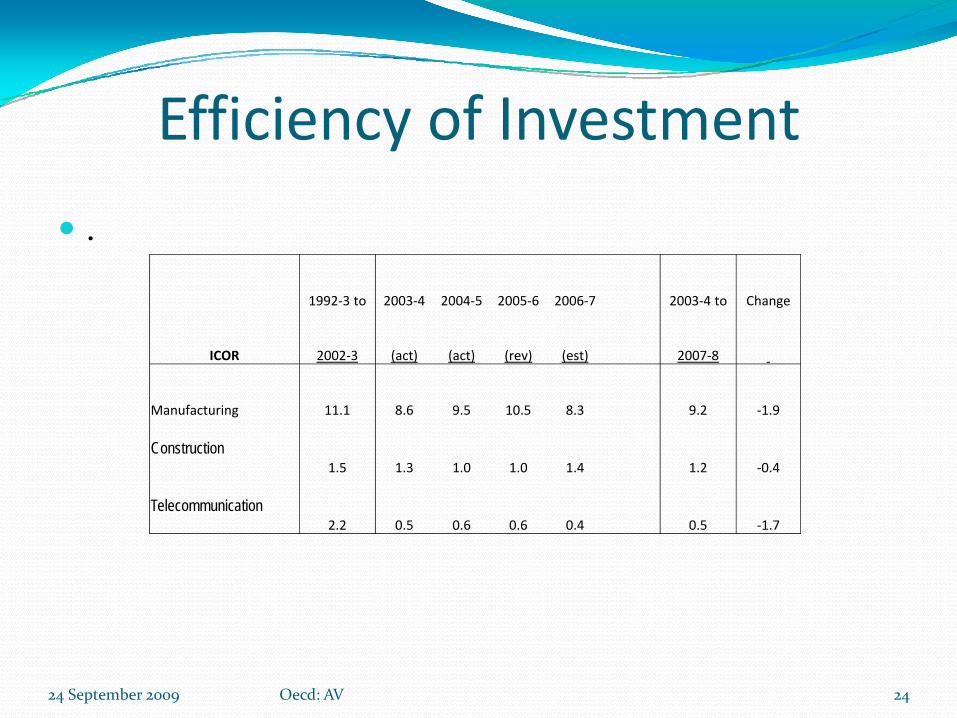
Efficiency of Investment
.
1992‐3 to 2003‐4 2004‐5 2005‐6 2006‐7 2003‐4 to Change
ICOR 2002‐3 (act) (act) (rev) (est) 2007‐8
Manufacturing 11.1 8.6 9.5 10.5 8.3 9.2 ‐1.9
Construction1.5 1.3 1.0 1.0 1.4 1.2 ‐0.4
Telecommunication2.2 0.5 0.6 0.6 0.4 0.5 ‐1.7
24 September 2009 24Oecd: AV

What about Poverty?
24 September 2009 Oecd: AV 25
Time Period Rural Urban Total
1983 to 1993-94 -1.8% -2.0% -1.8%1993-94 to 2004-05 (URP) -2.2% -1.9% -2.1%1999-2000 to 2004-05 (MRP) -3.9% -1.6% -3.3%
(annual average)Table: Reduction in poverty vis-à-vis previous base
Presenter
Presentation Notes
Datt (1973 to 1983): Total ( & rural) = -2.0%, Urban = -2.9% per annum.
Summary: Medium term Gr trendGrowth has accelerated in last five yearsWhile Consumption growth remained robust, the acceleration was Investment ledPrivate investment particularly corporate is leading investment and growthDomestic Saving has increased inline with InvestmentExternal sector was a drag on demand because of oil (and other) price increasesTelecom, Construction, Manufacturing were the leading sectors
24 September 2009 Oecd: AV 26
Sustaining High GrowthReforms essential for sustaining 9% for two decades.
Fiscal: Tax reform, Subsidies Competition: Decontrol, free entry
Industry(sugar, fertilizer, petrol diesel), mining(coal), infrastructure (electricity ‐ open access), FDI(retail)
Education and Skills: Regulated (transparency, rating) entry (freer), controls (minimal) Urban Land policy (land use, supply, development, utilities)Financial Market: Ex.Trd.Der., Fdi insurance
24 September 2009 Oecd: AV 27
Presenter
Presentation Notes
Sustaining Employment and Equitable Growth: Policies For Structural Transformation Of The Indian Economy,” Working Paper No. 3/2006-PC, Planning Commission, March 2006. http://planningcommission.nic.in/reports/wrkpapers/rpwpf.htm.

Sustaining Growth: Institutional reform
Public and Quasi‐Public goods & servicesNational Networks: Drinking Water, Waste (solid and liquid)Universal Primary education‐outcome (not enrolment)Civic/Urban services
Social service delivery: EmpowermentDebit/credit (smart card): PC WP 2002Multi‐application smart card (UID): 2005, 2006, 2007
24 September 2009 Oecd: AV 28
Presenter
Presentation Notes
Sustaining Employment and Equitable Growth: Policies For Structural Transformation Of The Indian Economy,” Working Paper No. 3/2006-PC, Planning Commission, March 2006. http://planningcommission.nic.in/reports/wrkpapers/rpwpf.htm.

ReferencesPrecursor:
India’s Economic Growth: From Socialist Rate of Growth to Bharatiya Rate of Growth, Working Paper No. 122, ICRIER, February 2004.Two Phases (4 sub‐phases), Third phase statistically insignificant.
Heuristic Theory and Empirics!Policy Regimes, Growth and Poverty in India: Lessons of Government Failure and Entrepreneurial Success!, Working Paper No. 170, ICRIER, October 2005. The Dynamics of Competition: Phasing of Domestic and External Liberalisation in India,” Working Paper No. 4/2006‐PC, Planning Commission, April 2006. Propelling India from Socialist Stagnation to Global Power: Growth Process, Vol. I (Policy Reform, Vol. II), Academic Foundation, New Delhi, 2006.“Maco‐economic Management of Indian Economy: Capital Flows, Interest Rates and Inflation, Working paper No. 2/2007‐DEA, Ministry of Finance, November 2007.Economic Survey: (i)2007‐8, February 2008; (ii) 2008‐9, June 2009The Sudoku of India’s Growth, BS Books, Business Standard Ltd., New Delhi 2009
24 September 2009 29Oecd: AV
Presenter
Presentation Notes
India’s Economic Growth: From Socialist Rate of Growth to Bharatiya Rate of Growth, Working Paper No. 122, ICRIER, February 2004. Propelling India from Socialist Stagnation to Global Power: Growth Process, Vol. I (Policy Reform, Vol. II), Academic Foundation, New Delhi, 2006. Policy Regimes, Growth and Poverty in India: Lessons of Government Failure and Entrepreneurial Success!, Working Paper No. 170, ICRIER, October 2005. “The Dynamics of Competition: Phasing of Domestic and External Liberalisation in India,” Working Paper No. 4/2006-PC, Planning Commission, April 2006.
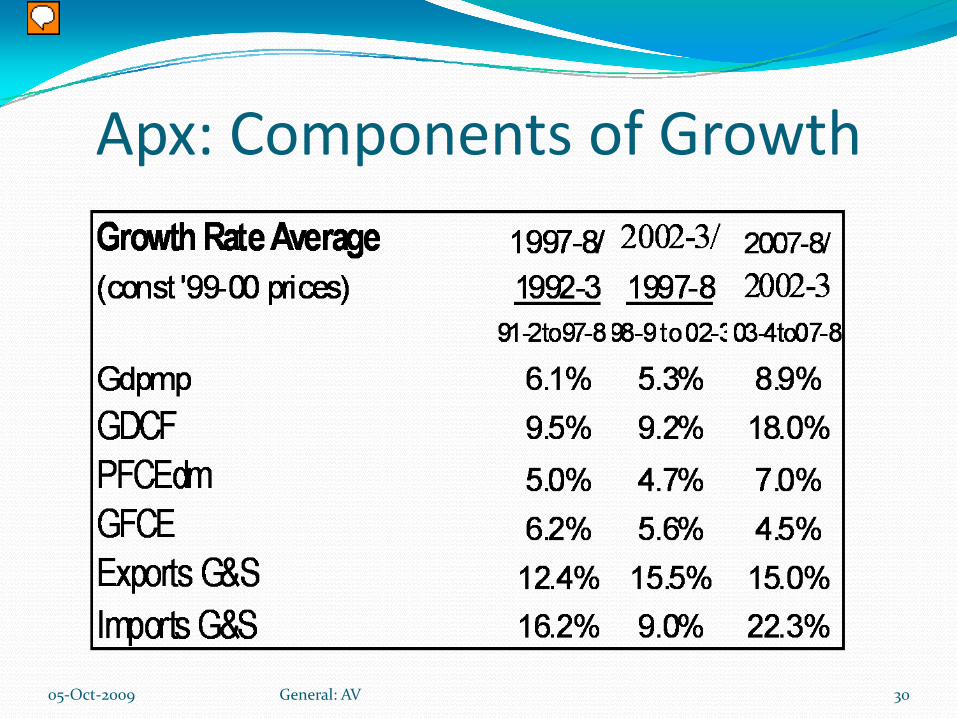
Apx: Components of Growth
05‐Oct‐2009 30General: AV
Presenter
Presentation Notes
Growth of Demand Skip for 35-40 min talk. Investment growth rate doubled Pvt consumption & imports accelerated Govt. Consumption-slowed
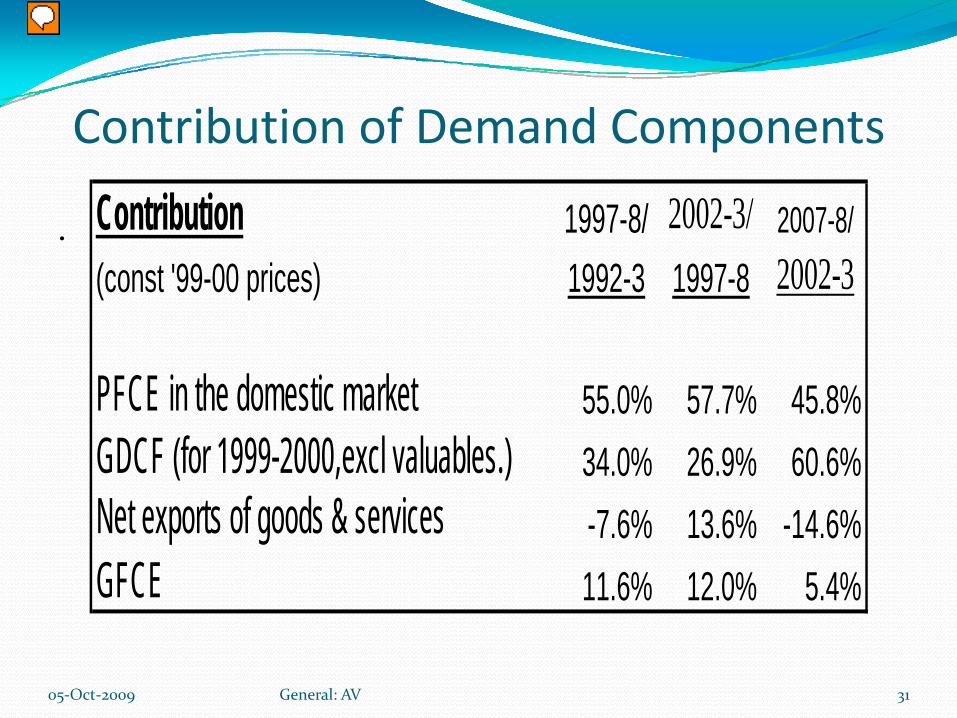
Contribution of Demand Components
. Contribution 1997-8/ 2002-3/ 2007-8/(const '99-00 prices) 1992-3 1997-8 2002-3
PFCE in the domestic market 55.0% 57.7% 45.8%34.0% 26.9% 60.6%-7.6% 13.6% -14.6%
GFCE 11.6% 12.0% 5.4%
GDCF (for 1999-2000,excl valuables.)Net exports of goods & services
05‐Oct‐2009 31General: AV
Presenter
Presentation Notes
Role of Consumption important but declined below that of Investment for first time External : Short period of positive contribution (low oil prices) over Govt Consumption: Lower contribution

Investment and Saving(% of GDP)
. Investment and Saving Rates( Ratios to GDP, current prices)
1992‐3 to 2003‐4 2004‐5 2005‐6 2006‐7 2007‐8 2003‐4 to Change
2002‐3 (act) (act) (rev) (est) (proj) 2007‐8
Gross Capital Formation 23.9% 26.8% 31.6% 34.5% 36.0% 38.4% 33.5% 9.5%
Gross Fixed Capital Formation 23.0% 24.9% 28.4% 31.0% 32.5% 34.6% 30.3% 7.3%
IKprivate 15.5% 18.5% 22.0% 24.0% 25.0% 22.4% 6.8%
GrossDomSaving(/GDP) 23.6% 29.8% 31.8% 34.3% 34.8% 36.1% 33.3% 9.8%
Sprivate(/GDP) 25.3% 28.7% 29.6% 31.7% 31.6% 30.4% 5.1%
Spublic(/GDP) ‐1.1% 1.1% 2.2% 2.6% 3.2% 2.3% 3.4%
05‐Oct‐2009 32General: AV
Presenter
Presentation Notes
GCF: 5 yr avg. 33.5% of GDP from 23.9% in previous 5 yrs (+9.5%). 2007-8 up to 38.4% of GDP i.e Chinese levels. GFCF: 5 yr avg. 30.3% of GDP from 23% in previous 5 yrs (+7.3%). 2007-08 up to 34.6% of GDP (9% gr at 3.8 Icor). I fixed private: Up 6.8% (4 yrs avg) out of total 7.3% (5 yrs avg).
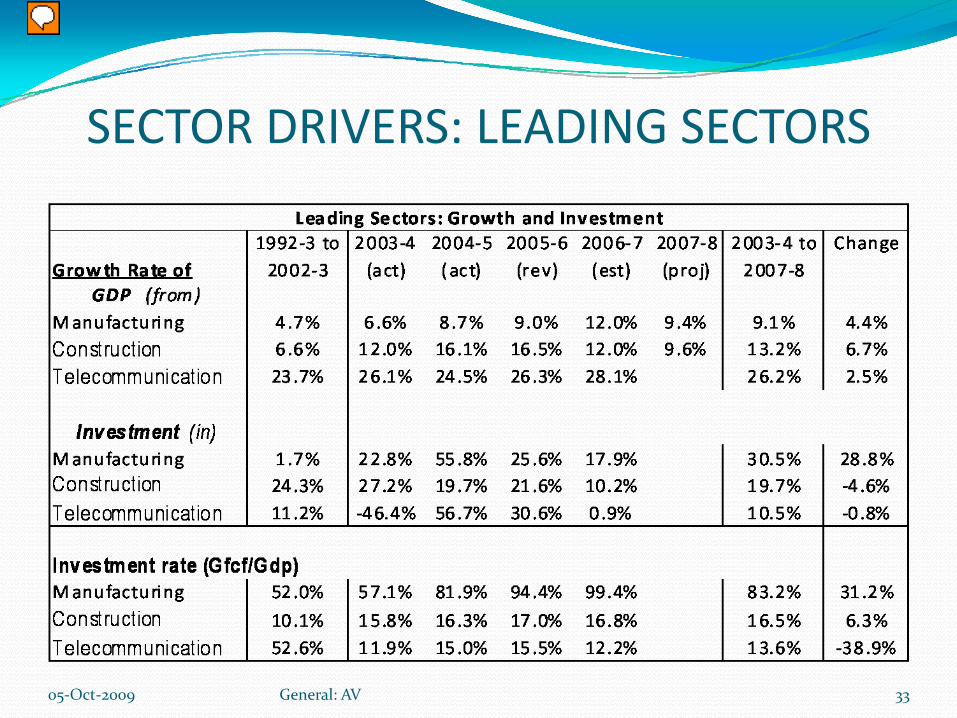
SECTOR DRIVERS: LEADING SECTORS
05‐Oct‐2009 33General: AV
Presenter
Presentation Notes
Increase in growth rate highest for Manufacturing and construction followed by storage & agriculture. Estimated Capital stock at end of 2007-8 in sector Y is (x) times higher than at end 2002-3. Construction(1.92) Manufacturing (1.75), Trade, Hotels & Restaurants (1.62).