DOWNTOWN TRAFFIC CORRIDOR STUDY SAN …hollister.ca.gov/wp-content/uploads/2015/05/042715... ·...
49
DOWNTOWN TRAFFIC CORRIDOR STUDY SAN BENITO STREET
Transcript of DOWNTOWN TRAFFIC CORRIDOR STUDY SAN …hollister.ca.gov/wp-content/uploads/2015/05/042715... ·...

DOWNTOWN TRAFFIC CORRIDOR STUDY
SAN BENITO STREET

Downtown Traffic Corridor Study
February 17, 2015
Hollister, CA

Final Report
Downtown Traffic Corridor Study
In the City of Hollister
February 17, 2015
This Traffic Study has been prepared under the direction of a licensed Traffic Engineer. The licensed Traffic Engineer attests to the technical information contained therein, and has judged the qualifications of any technical specialists providing engineering data, which recommendations, conclusions and decisions are based.
Prepared By:
_________________________________ Ruta Y. Jariwala Principal Engineer TJKM 4305 Hacienda Drive, Suite 550 Pleasanton, CA 94588-2798 Tel: 925.463.0611 Fax: 925.463.3690

Downtown Traffic Corridor Study, City of Hollister
Page | i
TABLE OF CONTENTS
TABLE OF CONTENTS .......................................................................................................................................................................... i
EXECUTIVE SUMMARY ....................................................................................................................................................................... 1
INTRODUCTION .................................................................................................................................................................................... 2
RELEVANT PLANNING DOCUMENTS ........................................................................................................................................... 3
Hollister General Plan .................................................................................................................................................................... 3
Hollister Downtown Plan ............................................................................................................................................................. 3
CONCEPTUAL ALTERNATIVES ......................................................................................................................................................... 5
Alternative 1 ...................................................................................................................................................................................... 5
Alternative 2 ...................................................................................................................................................................................... 5
General Treatments ........................................................................................................................................................................ 5
ANALYSIS METHODOLOGY .............................................................................................................................................................. 6
Evaluation Criteria ........................................................................................................................................................................... 6
Level of Service ................................................................................................................................................................................ 6
EXISTING CONDITIONS ..................................................................................................................................................................... 8
Field Review ...................................................................................................................................................................................... 8
Data Collection ................................................................................................................................................................................ 9
ALTERNATIVE 1 .................................................................................................................................................................................. 12
Summary ......................................................................................................................................................................................... 12
Proposed Segment Improvements ....................................................................................................................................... 12
ALTERNATIVE 2 .................................................................................................................................................................................. 22
Summary ......................................................................................................................................................................................... 22
Proposed Segment Improvements ....................................................................................................................................... 22
LEVEL OF SERVICE ANALYSIS ....................................................................................................................................................... 32
Existing Conditions ...................................................................................................................................................................... 32
Cumulative Conditions .............................................................................................................................................................. 32
Roundabout Analysis .................................................................................................................................................................. 34
Alternative Evaluation ................................................................................................................................................................ 34
ADDITIONAL RECOMMENDATIONS AND DESIGN CONSIDERATIONS ...................................................................... 35
National Association of City Transportation Officials .................................................................................................... 35
Parking ............................................................................................................................................................................................. 35
Sidewalk Amenities ..................................................................................................................................................................... 36
Transit ............................................................................................................................................................................................... 36

Downtown Traffic Corridor Study, City of Hollister
Page | ii
PUBLIC OUTREACH ........................................................................................................................................................................... 37
CONCLUSION ..................................................................................................................................................................................... 38
Alternative Comparison ............................................................................................................................................................. 38
Level of Service ............................................................................................................................................................................. 38
Parking ............................................................................................................................................................................................. 38
Cumulative Conditions .............................................................................................................................................................. 38
GLOSSARY ............................................................................................................................................................................................ 39
List of Tables Table 1: Level of Service Thresholds Based on Intersection Delay ................................................................................... 6 Table 2: Level of Service Analysis for Existing Conditions ................................................................................................. 32 Table 3: Level of Service Analysis for Existing, Existing plus Project, Cumulative and Cumulative plus Project Conditions ............................................................................................................................................................................................ 33 Table 4: Volume Thresholds for Roundabout Lane Requirements ................................................................................ 34 Table 5: Evaluation Criteria Results for Proposed Alternatives ....................................................................................... 34 List of Figures Figure 1: Vicinity Map ......................................................................................................................................................................... 4 Figure 2: Existing Volumes, Lane Configuration and Control Type ............................................................................... 10 Figure 3: Existing Bicycle and Pedestrian Volumes .............................................................................................................. 11 Figure 4: San Felipe Rd between Pinnacles National Hwy-CA 25 and Gateway Dr #1 .......................................... 13 Figure 5: San Felipe Rd between Gateway Dr and Flora Ave, #1.................................................................................... 14 Figure 6: San Felipe Rd between Flora Ave and Maple Ave, #1 ..................................................................................... 15 Figure 7: San Felipe Rd between Maple Ave and Santa Ana Rd-North St (North), #1 .......................................... 16 Figure 8: San Felipe Rd between Maple Ave and Santa Ana Rd-North St (South), #1 .......................................... 16 Figure 9: San Benito St between Santa Ana Rd-North St and 1st St, #1 ...................................................................... 17 Figure 10: San Benito St between 1st St and 4th St, #1 ....................................................................................................... 18 Figure 11: San Benito St between 4th St and South St, #1 ................................................................................................ 19 Figure 12: San Benito St between South St and Hawkins St, #1 .................................................................................... 20 Figure 13: San Benito St between Hawkins St and Nash Rd, #1..................................................................................... 21 Figure 14: San Felipe Rd between Pinnacles National Hwy-CA 25 and Gateway Dr, #2 ...................................... 23 Figure 15: San Felipe Rd between Gateway Dr and Flora Ave, #2 ................................................................................. 24 Figure 16: San Felipe Rd between Flora Ave and Maple Ave, #2 ................................................................................... 25 Figure 17: San Felipe Rd between Maple Ave and Santa Ana Rd-North St (North), #2 ....................................... 26 Figure 18: San Felipe Rd between Maple Ave and Santa Ana Rd-North St (South), #2 ....................................... 26 Figure 19: San Benito St between Santa Ana Rd-North St and 1st St, #2 ................................................................... 27 Figure 20: San Benito St between 1st St and 4th St (North), #2 ....................................................................................... 28 Figure 21: San Benito St between 1st St and 4th St (South), #2 ....................................................................................... 28

Downtown Traffic Corridor Study, City of Hollister
Page | iii
Figure 22: San Benito St between 4th St and South St, #2 ................................................................................................ 29 Figure 23: San Benito St between South St and Hawkins St, #2 .................................................................................... 30 Figure 24: San Benito St between Hawkins St and Nash Rd ............................................................................................ 31
Appendices
Appendix A Preferred Alternative in Plan View Appendix B Gateway Drive Intersection Options Appendix C Existing Turning Movement Counts, Average Daily Traffic Counts, and Lane Geometries Appendix D Conceptual Alternative Evaluation Criteria Appendix E Hollister City Council Resolution No. 2015-26 Appendix F “Downtown Hollister Traffic Plan Approved by Council”

Downtown Traffic Corridor Study, City of Hollister
Page | 1
EXECUTIVE SUMMARY
The purpose of this study is to provide alternative options for the redesign of the San Benito Corridor in the City of Hollister. The Corridor runs from Pinnacles National Highway-California 25 in the north to Nash Road in the south, as seen in Figure 1. Traffic analyses were performed for Existing Conditions and Cumulative Conditions to determine operational impacts to the facility with the implementation of a Complete Streets project. Complete Streets are designed to be safe and accessible to all modes of transportation, helping improve pedestrian, bicycle, and transit facilities while minimizing impacts to vehicular traffic. The alternatives presented incorporate new bicycle facilities, improved pedestrian facilities, and roundabout options at the intersection of San Felipe Road and Gateway Drive. Traffic calming measures, such as a reduction in the number of thru-lanes, provision of exclusive left-turn pockets, and “All-Red Flash Mode” at the 5th Street intersection have been considered.
Currently, San Benito Street is a four-lane arterial and the proposed designs depict a two-lane arterial with exclusive left-turn pockets at key study intersections. The intersection of San Felipe Road and Gateway Drive was analyzed as a signalized intersection and a roundabout (one-lane and two-lane). A signalized intersection with a roundabout design is recommended to provide the aesthetics and traffic calming effects of a roundabout while improving intersection level of service (LOS). It should be noted that Complete Streets projects are expected to degrade LOS throughout a facility due to lane reduction and prioritization of other transportation modes.
The alternatives provide a mix of exclusive and shared bicycle facilities throughout the corridor along with raised medians, and sidewalk and crosswalk enhancements. New bicycle facilities help prioritize cyclists making it a more favorable mode of travel. Where cycle tracks have been proposed, a landscaped buffer is provided to separate cyclists from the vehicular traffic flow. Shared bicycle facilities are found throughout Downtown where the City wants to reduce vehicle speeds and increase pedestrian and bicycle travel.
Alternative 1 provides a consistent pedestrian facility and Alternative 2 retains all existing curb lines for this report. Throughout the corridor, high-visibility crosswalks are proposed for increased pedestrian safety.
The Hollister Downtown Plan includes the concept for “convertible streets” where the street is able to convert from a vehicular travelled way to a pedestrian facility for special events, such as the Farmer’s Market held from May to September of each year. From this concept and the City’s instruction, both alternatives offer four blocks, from 4th Street to South Street, as a convertible street.
The Hollister Downtown Plan calls for the installation of gateways, primary and secondary, in the Downtown. Primary gateways indicate a major transition into the downtown area and secondary gateways indicate a subtle transition. The proposed gateways are as follows: primary gateways at the 3rd Street and South Street intersections and secondary gateways at the 1st Street and Hawkins Street intersections.
Upon City staff review, community input, and consideration of limited funding, Alternative 2 is the preferred alternative from this report and the City Council approved this study at its meeting on February 17, 2015.

Downtown Traffic Corridor Study, City of Hollister
Page | 2
INTRODUCTION
Caltrans relinquished State Route 25, between San Felipe Road in the north and Airline Highway in the south, to the City of Hollister in March of 2014. The Hollister Downtown Plan outlines a redesign of the traffic pattern through the San Benito Corridor and calls for a design reducing the number of thru-lanes and adding center lanes for turning to enhance Downtown land uses and traffic safety for pedestrians, cyclists and vehicles. The plan also outlines providing traffic calming along the corridor.
The Downtown Plan emphasizes the revitalization of the area along San Benito Street between 4th Street and 7th Street. This stretch experiences a lot of commercial, retail and economic activity. A Complete Streets design accommodates all modes of transportation, including pedestrian, bicycle, transit and auto, and provides safe and easy access to all forms of business.
In order to revitalize San Benito Street from a Complete Streets perspective, TJKM performed a detailed Existing Conditions field survey, level of service analysis for Existing and Cumulative Conditions, developed alternative designs, and analyzed the alternatives. The following study intersections were considered for analysis:
1. San Felipe Road/Pinnacles National Highway-California 25 2. San Felipe Road/Gateway Drive 3. San Benito Street/North Street-Santa Ana Road 4. San Benito Street/3rd Street 5. San Benito Street/4th Street 6. San Benito Street/5th Street 7. San Benito Street/6th Street 8. San Benito Street/7th Street 9. San Benito Street/South Street
The conceptual alternatives includes measures such as a road diet, traffic calming, curb bulb-outs, convertible streets, marked bicycle facilities, improved pedestrian facilities, downtown gateways, and raised landscaped medians. The Hollister Downtown Plan and City of Hollister General Plan are considered the governing documents for the corridor’s streetscape project.
This report presents an Existing Conditions and Cumulative Conditions analysis, along with feasibility analysis, of the proposed alternatives for the San Benito Street Corridor. The two proposed alternatives utilize existing right-of-way (ROW) for all segments to reduce impact to existing infrastructure.
Downtown Traffic Corridor Study, City of Hollister
Page | 3
RELEVANT PLANNING DOCUMENTS
HOLLISTER GENERAL PLAN The most current General Plan for the City of Hollister was adopted in December 2005. The Circulation Element of the plan provides an overview of Hollister’s existing roadways, local transit services, and bicycle and pedestrian facilities at the time. The City applies a standard LOS for signalized intersections of “LOS C.” The plan’s recommendations involve roadway widening which provide a less-focused view on bicycle and pedestrian activities. The Hollister Downtown Plan (see below) governs the vision and development of the San Benito Corridor, discussed within this report.
HOLLISTER DOWNTOWN PLAN The Hollister Downtown Plan was adopted in September 2008 and depicts a community-based vision and implementation strategy for Downtown Hollister. The plan summarizes the community’s vision and recommended strategies to revitalize the area. Boundaries of Downtown to the north and south are North Street and Hawkins Street respectively. The plan outlines specific alterations to the San Benito Corridor for streetscape enhancements and improvements to transit service and bicycle facilities. The main goal is to create a welcoming environment for the community and visitors while increasing use of non-auto modes of transportation. The recommendations of the plan were considered while devising alternatives for the project and were adhered to where possible.

Vicinity Map
Figure 1054-005
MAPLE ST.
SANTA ANA RD.NORTH ST.
FLORA AVE.
SAN
FEL
IPE
RD.
SAN
BEN
ITO
ST.
GATEWAY DR.
1st ST.
2nd ST.
3rd ST.
4th ST.
5th ST.
6th ST.
7th ST.
EAST
ST.
EAST
ST.
MO
NTE
REY
ST.
SALL
Y ST
.
SOUTH ST.
HAWKINS ST.
HAYDON ST.
PARK ST.
OLIVE ST.
PALM ST.
VINE ST.
NASH RD.
HILL ST. FURLONG ALLEY
1
2
3
4
5
6
7
8
9
LEGENDExisting Study Intersection
CALIFORNIA
25
N

Downtown Traffic Corridor Study, City of Hollister
Page | 5
CONCEPTUAL ALTERNATIVES
A Draft Conceptual Alternatives Report was completed and presented to City staff in August 2014. The Draft contained two preliminary alternatives that incorporated a Complete Streets effort to be reviewed. The initial alternatives had similar general treatments with different bicycle facilities and parking.
ALTERNATIVE 1 Class II bicycle lanes were proposed from Gateway Drive to Hawkins Street with Class III shared lanes south of Hawkins Street extending to Nash Road. Class II bicycle lanes help separate cyclists from vehicular traffic, promote modal switch, and reduce traffic speeds.
Parking capacity was considered, and new parking proposed where possible along the corridor. The original design caused a reduction in available street parking in the Downtown area due to provision of Class II bicycle lanes and exclusive left-turn pockets.
ALTERNATIVE 2 Class III shared lanes were proposed throughout the corridor. This type of facility alerts drivers to the presence of cyclists. Chevron, or “Sharrow”, symbols are painted in the vehicle lanes to direct cyclists towards the safest location within the lane outside the door zone of parked cars. Sharrow treatment is cost-effective for lightly travelled arterials where the speeds are less than 35 mph and are appropriate for high volume/low speed arterials with on-street parking.
Parking capacity was considered and proposed where possible along San Benito Street. The design resulted in no reduction of available street parking in Downtown due to facility improvements.
GENERAL TREATMENTS At the intersection of San Benito Street and 5th Street, “All Red Flash” mode was analyzed (this mode operates as an all-way stop control). In addition, the intersections at 6th Street and 7th Street were proposed with all-way stop control. This type of control is generally suggested for intersections experiencing heavy pedestrian traffic. Based on the data collected for the project under Existing Conditions, 5th Street, 6th Street, and 7th Street experience high pedestrian volumes. All-way stop control enhances safety and ease of travel for all modes aligning with the objectives for the revitalization of the corridor.
Left-turn pockets were proposed at all intersections in the corridor to help reduce rear-end collisions and remove vehicles waiting to turn from thru traffic. The intersection at Gateway Drive was analyzed as a one- and two-lane roundabout in addition to a signalized intersection. The results are the same for all alternatives, with the roundabout options operating below acceptable LOS per the City of Hollister standard of LOS C and the signal option operating at LOS B or better, as seen in Table 3.
Based on the City’s review and comments for the Draft Conceptual Alternatives Report, the following designs strive to combine the best components of the preliminary alternatives to provide a desirable and functioning streetscape for the San Benito Corridor.

Downtown Traffic Corridor Study, City of Hollister
Page | 6
ANALYSIS METHODOLOGY
EVALUATION CRITERIA TJKM developed evaluation criteria for scoring the two alternatives. The cumulative score allows the more desirable alternative for the City of Hollister to be recommended. The criteria is based on the principles of the Hollister Downtown Plan, Hollister General Plan, applicable engineering standards, California Manual on Uniform Traffic Control Devices (MUTCD), and the California Department of Transportation (Caltrans) Highway Design Manual (HDM). The intent of the evaluation is to provide understanding of the pros and cons of both alternatives. The criteria falls into the following ten categories:
1. Minimum Safety-Related Design Standards for Pedestrians, Bicycles, and Vehicles 2. Enhancement of Transportation Facility 3. Collision Reduction Potential 4. Intersection Operational/Capacity Impacts 5. Roadway Segment Capacity Impacts 6. On-Street Corridor Parking Supply Impacts 7. Potential for Cut-Through 8. Aesthetics/Environmental Sustainability 9. Extent of Downtown Revitalization 10. Cost-Effectiveness and Implementation
LEVEL OF SERVICE Intersection LOS is determined using the Highway Capacity Manual (HCM), 2000 Edition. Signalized intersection LOS is based on the capacity of the intersection as a whole and average delay experienced by a driver. Unsignalized intersection LOS is defined by the average delay experienced by a driver for individual side street approaches. Table 1 provides the relationship between LOS rating and delay for signalized and unsignalized intersections.
Table 1: Level of Service Thresholds Based on Intersection Delay
Level of Service Signalized Intersection
Delay (sec) Unsignalized Intersection
Delay (sec)
A 0 ≤ D ≤ 10 0 ≤ D ≤ 10
B 10 < D ≤ 20 10 < D ≤ 15
C 20 < D ≤ 35 15 < D ≤ 25
D 35 < D ≤ 55 25 < D ≤ 35
E 55 < D ≤ 80 35 < D ≤ 50
F 80 < D 50 < D
Sidra Intersection 6 software was used to analyze the two roundabout options at Gateway Drive with calculations based on HCM, 2010 Edition. The City of Hollister General Plan uses a worst-case standard of

Downtown Traffic Corridor Study, City of Hollister
Page | 7
LOS C for signalized intersections. It should be noted that “plus Project Conditions” lane geometries will cause intersection level of service to degrade to LOS D or E, but this is expected with treatments found in the alternatives.

Downtown Traffic Corridor Study, City of Hollister
Page | 8
EXISTING CONDITIONS
FIELD REVIEW The San Benito Corridor is a four-lane roadway with discontinuous sidewalks to the north of North Street-Santa Ana Road in the northbound and southbound directions. Curb ramps are found at most intersections with a mix of Americans with Disabilities Act (ADA) compliant and non-compliant ramps. No “Bike Route” signs are present throughout the corridor. Existing vehicle, bicycle and pedestrian movement volumes are shown in Figures 2 and 3 and raw count data are in Appendix C.
1. San Felipe Road/Pinnacles National Highway-California 25 (Signalized) No sidewalks are present in the either direction with ADA compliant ramps at all corners. Crosswalks and pedestrian actuators are present at the south, east, and west legs.
2. San Felipe Road/Gateway Drive (One-Way Stop Control) No sidewalks are present in the northbound direction with non-ADA compliant ramps provided at the northwest and southwest corners. No crosswalks exist at the intersection.
3. San Felipe Road-San Benito Street/North Street-Santa Ana Road (Signalized) Sidewalks are present with ADA compliant ramps at the northeast and southwest corners and non-ADA compliant ramps at the northwest and southeast corners. Crosswalks are present on the east and west legs with pedestrian actuators at all legs.
4. San Benito Street/3rd Street (Signalized) Sidewalks are present with non-ADA compliant ramps provided at all corners. Crosswalks with no pedestrian actuators are present at all legs.
5. San Benito Street/4th Street (Signalized) Sidewalks are present with non-ADA compliant ramps provided at all corners. Pedestrian actuators with no crosswalks are present at all legs.
6. San Benito Street/5th Street (Signalized) Sidewalks are present with non-ADA compliant ramps provided at all corners. Crosswalks with pedestrian actuators are present at all legs.
7. San Benito Street/6th Street (Two-way Stop Control) Sidewalks are present with non-ADA compliant ramps provided at all corners. Crosswalks with no pedestrian actuators are present at all legs.
8. San Benito Street/7th Street (Two-way Stop Control) Sidewalks are present with non-ADA compliant ramps provided at all corners. Crosswalks with no pedestrian actuators are present at all legs.
9. San Benito Street/South Street (Signalized) Sidewalks are present with non-ADA compliant ramps provided at all corners. Crosswalks with pedestrian actuators are present at all legs.

Downtown Traffic Corridor Study, City of Hollister
Page | 9
DATA COLLECTION TJKM acquired timing sheets from the City of Hollister for the signalized intersections along San Benito Street for the study. Vehicle, bicycle, and pedestrian movement volumes were collected for the a.m. and p.m. peak periods and projected Cumulative 2035 a.m. and p.m. peak hour volumes were obtained from the San Benito County Travel Demand Model (TDM). Synchro traffic models were then created for Existing, Existing plus Project, Cumulative, and Cumulative plus Project Conditions. The models form a base for analysis of the proposed alternatives, which include a lane reduction throughout the corridor and all-way stop control at the 5th Street intersection. Signal timings were optimized under Cumulative and Cumulative plus Project Conditions analysis to reflect intersection LOS and delay.

Intersection #1San Felipe Rd./SR-25/
Bolsa Rd.
Intersection #2San Felipe Rd./Gateway Dr.
Intersection #3San Benito St./North St./
Santa Ana Rd.
Intersection #4San Benito St./3rd St.
Intersection #5San Benito St./4th St.
Intersection #8 San Benito St./7th St.
Intersection #9San Benito St./South St.
Intersection #6San BenitoSt./5th St.
Intersection #7San Benito St./6th St.
400
(212
)43
2 (3
26)
13 (
39)12 (6)
161 (458)146 (398)
274 (102)
633 (219)
19 (18)32 (8)0 (0)4 (2)
7 (6
)26
5 (5
63)
70 (
281)
89 (
79)
695
(531
)23
(11
)
36 (33)3 (0)
13 (53)
37 (
69)
358
(921
)36
(34
)
137 (115)27 (13)99 (87)
25 (
19)
652
(450
)72
(54
)
11 (15)14 (17)15 (29)
5 (7
)34
2 (7
56)
45 (
158)
45 (57)72 (99)24 (11)
7 (1
9)61
2 (4
16)
21 (
44)
121 (64)65 (109)13 (34)
70 (
170)
366
(649
)24
(70
)
16 (22)249 (248)25 (13)
123
(142
)28
7 (2
06)
22 (
42)
339 (241)245 (311)94 (114)
191
(233
)18
5 (4
08)
15 (
60)
5 (13)40 (18)17 (25)
57 (
16)
402
(343
)15
(22
)
20 (27)14 (19)12 (26)
25 (
15)
279
(516
)2
(11)
78 (78)117 (115)38 (31)
38 (
23)
437
(348
)21
(29
)
28 (20)65 (113)28 (43)
22 (
38)
380
(504
)51
(77
)
1 (24)2 (5)2 (8)
63 (
35)
454
(316
)2
(21)
7 (9)5 (3)
54 (72)
5 (3
6)30
5 (5
18)
4 (3
6)
10 (7)5 (2)3 (5)
61 (
36)
503
(359
)6
(6)
13 (13)8 (3)
91 (38)
20 (
38)
332
(554
)10
(7)
Existing Conditions Traffic Volumes, Lane Geometry, and Controls
Figure 2054-005
MAPLE ST.
SANTA ANA RD.NORTH ST.
FLORA AVE.
SAN
FEL
IPE
RD.
SAN
BEN
ITO
ST.
GATEWAY DR.
1st ST.
2nd ST.
3rd ST.
4th ST.
5th ST.
6th ST.
7th ST.
EAST
ST.
EAST
ST.
MO
NTE
REY
ST.
SALL
Y ST
.
SOUTH ST.
HAWKINS ST.
HAYDON ST.
PARK ST.
OLIVE ST.
PALM ST.
VINE ST.
NASH RD.
HILL ST. FURLONG ALLEY
1
2
3
4
5
6
7
8
9
CALIFORNIA
25
LEGENDExisting Study IntersectionTraffic SignalStop SignAM Peak Hour VolumesPM Peak Hour Volumes
XX(XX)
N

Intersection #1San Felipe Rd./SR-25/
Bolsa Rd.
Intersection #2San Felipe Rd./Gateway Dr.
Intersection #3San Benito St./North St./
Santa Ana Rd.
Intersection #4San Benito St./3rd St.
Intersection #5San Benito St./4th St.
Intersection #8 San Benito St./7th St.
Intersection #9San Benito St./South St.
Intersection #6San BenitoSt./5th St.
Intersection #7San Benito St./6th St.
0 (1)
2 (0)
9 (3
)
0 (1
)
4 (2
)
4 (9)
0 (3)
0 (1
)0
(3)
4 (6
)
1 (2
)
1 (0)
0 (4
)
0 (2
)
1 (0)
11 (
3)
6 (2
)
1 (0)
3 (6)1
(0)
2 (4
)
0 (1)2 (1)
4 (8)
0 (3)1 (0)
0 (3
)0
(2)
5 (1
1)
1 (1
)0
(2)
5 (5)
2 (3
)
1 (4)0 (1)
7 (21)
0 (1)0 (1)0 (1)
0 (3
)3
(3)
0 (1
)
6 (9
)
2 (4
)1
(2)
11 (4)
12 (
21)
0 (1)0 (2)
2 (7)
1 (0)1 (1)
1 (0
)
2 (1
1)
0 (3
)
2 (5)
7 (5
)
0 (4)
3 (14)
0 (1
)
4 (7
)
0 (1
)
2 (12)
17 (
32)
2 (3)
0 (1
)
10 (
5)
0 (1
)
0 (1)
23 (
60)
Pedestrian and Bicycle Volumes
Figure 3054-005
MAPLE ST.
SANTA ANA RD.NORTH ST.
FLORA AVE.
SAN
FEL
IPE
RD.
SAN
BEN
ITO
ST.
GATEWAY DR.
1st ST.
2nd ST.
3rd ST.
4th ST.
5th ST.
6th ST.
7th ST.
EAST
ST.
EAST
ST.
MO
NTE
REY
ST.
SALL
Y ST
.
SOUTH ST.
HAWKINS ST.
HAYDON ST.
PARK ST.
OLIVE ST.
PALM ST.
VINE ST.
NASH RD.
HILL ST. FURLONG ALLEY
1
2
3
4
5
6
7
8
9
CALIFORNIA
25
LEGEND
AM Peak Hour Ped/Bike VolumesPM Peak Hour Ped/Bike VolumesPedestrian Crossing VolumeBicycle Turn Movement Volume
XX(XX)
N

Downtown Traffic Corridor Study, City of Hollister
Page | 12
ALTERNATIVE 1
SUMMARY Alternative 1 uses the available ROW to create a new streetscape that helps prioritize vehicular, pedestrian and bicycle facilities. Continuity of corridor amenities is considered a high priority for the design and requires the adjustment of existing curb lines. Sidewalks in Alternative 1 become 8 to 10 feet throughout the corridor, one-way cycle tracks are located adjacent to the sidewalks, and a landscaped buffer is proposed to separate cyclists from vehicular traffic. The number of thru lanes is reduced to one in the northbound and southbound directions with landscaped medians separating opposing traffic flows except on the segment from Hawkins Street to Nash Road. Left-turn pockets are proposed at all northbound and southbound approaches for study intersections.
Fundamental to Complete Streets policy, exclusive bicycle facilities help improve safety of the transportation network for all modes. Providing buffers to separate cyclists from vehicular traffic also improves safety and helps reduce vehicle-bicycle collisions. The installation of left-turn pockets at the approaches removes vehicles waiting to turn from thru traffic and aids in reducing rear-end crashes.
The intersection of 5th Street and San Benito Street is analyzed with all-way stop control. Located in the center of Downtown, this location experiences heavy pedestrian volumes, which supports all-way stop control to enhance pedestrian safety and ease of travel for all modes. The intersection at Gateway Drive, shown in Appendix B, is proposed with a signalized roundabout to provide the operational efficiency of a signal with the aesthetics and feel of a roundabout.
Parking is proposed at the northern end of the corridor and the alternative has no impact to existing on-street parking conditions through Downtown. The Level of Service Analysis results for Alternative 1 are in Table 3. The following is a segment-wise breakdown of the alternative to provide a detailed look at the proposed conditions.
PROPOSED SEGMENT IMPROVEMENTS The following is a detailed discussion of the proposed improvements along individual segments throughout the study corridor for Alternative 1.

Downtown Traffic Corridor Study, City of Hollister
Page | 13
Between Pinnacles National Highway-California 25 and Gateway Drive Sidewalks are installed in the north and south directions along with Class II bicycle facilities. The existing lane geometry is retained at the Pinnacles National Highway-California 25 intersection and there is a lane drop approximately 250’ south in the southbound travelled lanes on San Felipe Road while approaching Gateway Drive. The existing median is reconfigured and landscaped to begin the transition towards a Complete Street. A signalized roundabout is installed at the Gateway Drive intersection to improve traffic operations and all existing left-turn pockets are retained.
Figure 4: San Felipe Rd between Pinnacles National Hwy-CA 25 and Gateway Dr #1

Downtown Traffic Corridor Study, City of Hollister
Page | 14
Between Gateway Drive and Flora Avenue The existing sidewalks, 5’ wide in the north and south directions, are widened to 9’. Bounding the sidewalks are a 5’ strip of landscaping and one-way cycle track. A 5’ landscaped buffer is installed between the bicycle and parking lanes, a landscaped center median is provided to divide opposing traffic flows, and the number of thru lanes is reduced to one in each direction. All existing left-turn pockets are retained and high visibility crosswalks are installed at the legs of the Gateway Drive intersection.
Figure 5: San Felipe Rd between Gateway Dr and Flora Ave, #1

Downtown Traffic Corridor Study, City of Hollister
Page | 15
Between Flora Avenue and Maple Avenue The existing sidewalks, 5’ wide in the north and south directions, are extended to 9’. Bounding the sidewalks are a 5’ strip of landscaping and one-way cycle track. A 5’ landscaped buffer is installed between the bicycle and parking lanes, a landscaped center median is provided to divide opposing traffic flows, and the number of thru lanes is reduced to one in each direction. All existing left-turn pockets are retained and high visibility crosswalks are installed at the south and west legs of the Flora Avenue intersection.
Figure 6: San Felipe Rd between Flora Ave and Maple Ave, #1

Downtown Traffic Corridor Study, City of Hollister
Page | 16
Between Maple Avenue and Santa Ana Road-North Street The ROW at the Maple Avenue intersection is 115’ and 80’ at the Santa Ana Road-North Street intersection. Geometric constraints for the segment resulted in two cross-sections that provide a smooth transition for the roadway. The existing sidewalks, 5’ wide at the north end and 8’ in the south are extended to 9’. Bounding the sidewalks at the north end are a 5’ strip of landscaping and one-way cycle track. The south end does not have the 5’ strip to accommodate the ROW reduction.
Parking lanes are provided at the north end but terminate before reaching Santa Ana-North Street. A 5’ landscaped buffer is installed between the bicycle and parking lanes that tapers to 4’ at the end of the parking lane. Landscaped center medians are provided with left-turn pockets to allow driveway access along San Felipe Road and the number of thru lanes is reduced to one in each direction. A crosswalk is installed at the east leg of the Maple Avenue intersection.
Figure 7: San Felipe Rd between Maple Ave and Santa Ana Rd-North St (North), #1
Figure 8: San Felipe Rd between Maple Ave and Santa Ana Rd-North St (South), #1

Downtown Traffic Corridor Study, City of Hollister
Page | 17
Between Santa Ana Road-North Street and 1st Street The existing sidewalks, 10’ wide in the northbound direction and 6’ in the southbound direction, become 9’ in both directions. One-way cycle tracks with a 4’ landscaped buffer for separation from vehicular traffic are installed, a landscaped center median is provided to divide opposing traffic flows, and the number of thru lanes is reduced to one in each direction. Left-turn pockets are provided at all study intersection approaches along San Benito Street. High visibility crosswalks are installed at all legs and corners of the Santa Ana Road-North Street intersection.
Figure 9: San Benito St between Santa Ana Rd-North St and 1st St, #1

Downtown Traffic Corridor Study, City of Hollister
Page | 18
Between 1st Street and 4th Street The existing sidewalks, 12’ wide in the northbound direction, 12’ in the southbound direction at the north end and 10’ at the south, become 9’ in both directions. One-way cycle tracks with a 3’ landscaped buffer for separation from vehicular traffic and the southbound parking lane are installed, a landscaped center median is provided to divide opposing traffic flows, and the number of thru lanes is reduced to one in each direction.
Left-turn pockets are provided at all major intersection approaches along San Benito Street and at the southbound approach of the 2nd Street intersection. High visibility crosswalks are installed at the south and west legs of the 1st Street intersection and the east leg of the 2nd Street intersection.
Primary gateways are installed at the 3rd Street and South Street intersections with secondary gateways located at the 1st Street and Hawkins Street intersections per the Hollister Downtown Plan.
Figure 10: San Benito St between 1st St and 4th St, #1

Downtown Traffic Corridor Study, City of Hollister
Page | 19
Between 4th Street and South Street (Convertible Street) The segment between 4th Street and South Street is designed as a convertible street involving colored pavers for the vehicular roadway and sidewalks with the provision of rolled curbs. The existing sidewalks, 13’ wide in the north and south directions, become 10’ wide with a 3’ landscaped buffer for separation from vehicular traffic. Existing parking is retained with no reduction in spaces.
Class III shared lanes and a landscaped center median are provided, and the number of thru lanes is reduced to one in each direction. The median will be divided at the midpoint of each block by a mid-block crosswalk paved with tumbled glass aggregate per the Hollister Downtown Plan. Left-turn pockets are provided at all intersection approaches along San Benito Street and high visibility crosswalks are installed at all legs.
Figure 11: San Benito St between 4th St and South St, #1

Downtown Traffic Corridor Study, City of Hollister
Page | 20
Between South Street and Hawkins Street The existing sidewalks, 14’ wide in the northbound direction and 13’ in the southbound direction, become 11’ and 10’ in the north and south directions respectively with a 3’ landscaped buffer for separation from vehicular traffic. Class III shared lanes and a landscaped center median are provided along the segment, and the number of thru lanes remains as existing. Existing parking is retained, left-turn pockets are provided at intersection approaches along San Benito Street, and high visibility crosswalks are installed at all legs.
Primary gateways are installed at the 3rd Street and South Street intersections with secondary gateways located at the 1st Street and Hawkins Street intersections per the Hollister Downtown Plan.
Figure 12: San Benito St between South St and Hawkins St, #1
Downtown Traffic Corridor Study, City of Hollister
Page | 21
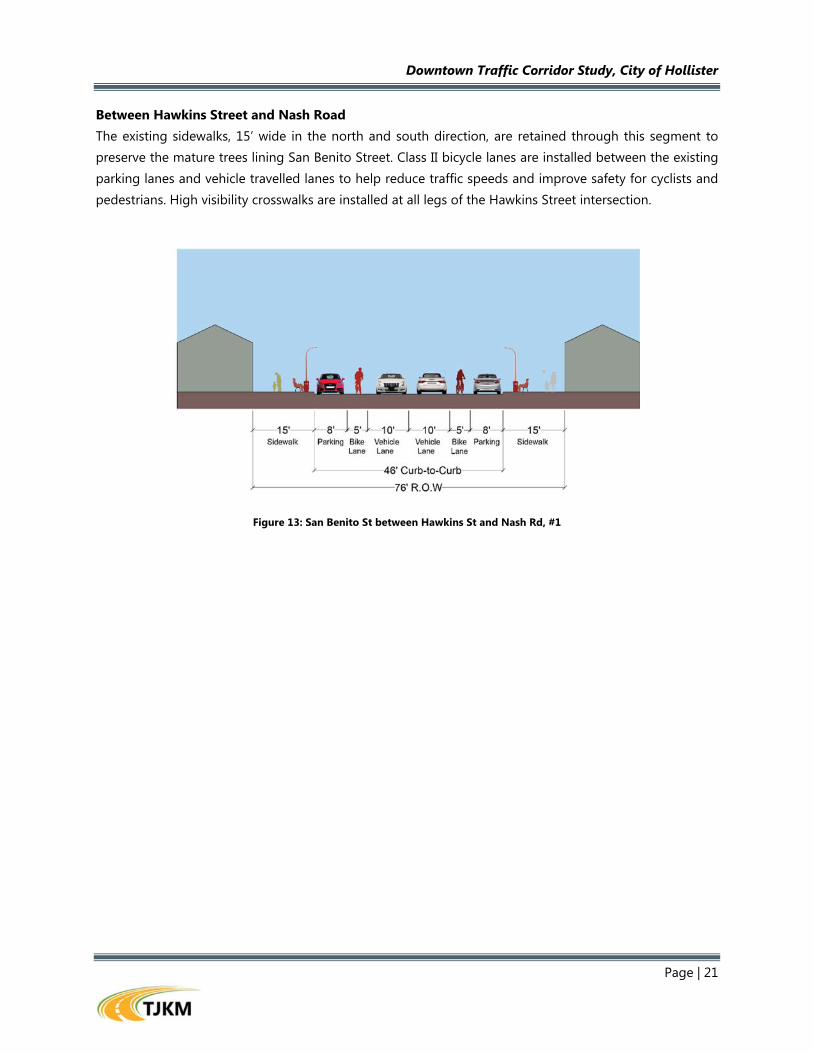
Between Hawkins Street and Nash Road The existing sidewalks, 15’ wide in the north and south direction, are retained through this segment to preserve the mature trees lining San Benito Street. Class II bicycle lanes are installed between the existing parking lanes and vehicle travelled lanes to help reduce traffic speeds and improve safety for cyclists and pedestrians. High visibility crosswalks are installed at all legs of the Hawkins Street intersection.
Figure 13: San Benito St between Hawkins St and Nash Rd, #1

Downtown Traffic Corridor Study, City of Hollister
Page | 22
ALTERNATIVE 2
SUMMARY Alternative 2 generally uses the available curb-to-curb distance to create a new streetscape that helps prioritize pedestrian and bicycle facilities. Reducing impact to the existing facility’s utility systems and cost effectiveness are considered high priority for the design. Sidewalks in Alternative 2 remain at their existing widths through the corridor, one-way cycle tracks are located adjacent to the sidewalks, and a landscaped buffer is proposed to separate cyclists from vehicular traffic. The number of thru lanes is reduced to one in the northbound and southbound directions with landscaped medians separating opposing traffic flows except on the segment from Hawkins Street to Nash Road. Left-turn pockets are proposed at all northbound and southbound approaches for study intersections. The alternative design is found in Appendix A.
Fundamental to Complete Streets policy, exclusive bicycle facilities help improve safety of the transportation network for all modes. Providing buffers to separate cyclists from vehicular traffic also improves safety and helps reduce vehicle-bicycle collisions. The installation of left-turn pockets at the approaches removes vehicles waiting to turn from thru traffic and aids in reducing rear-end crashes.
The intersection of 5th Street and San Benito Street is analyzed with all-way stop control. Located in the center of Downtown, this location experiences heavy pedestrian volumes, which supports all-way stop control to enhance pedestrian safety and ease of travel for all modes. The intersection at Gateway Drive is proposed with a two-lane roundabout. The one-lane roundabout option is also provided in Appendix B.
Parking is proposed at the northern end of the corridor and the alternative has no impact to existing on-street parking conditions through Downtown. The Level of Service Analysis results for Alternative 2 are the same as Alternative 1 for all intersections except Gateway Drive and are summarized in Table 3. The following is a segment-wise breakdown of the alternative to provide a detailed look at the proposed conditions.
PROPOSED SEGMENT IMPROVEMENTS The following is a detailed discussion of the proposed improvements along individual segments throughout the study corridor for Alternative 2.

Downtown Traffic Corridor Study, City of Hollister
Page | 23
Between Pinnacles National Highway-California 25 and Gateway Drive Sidewalks are installed in the north and south directions along with Class II bicycle facilities. The existing lane geometry is retained at the Pinnacles National Highway-California 25 intersection and there is a lane drop approximately 250’ south in the southbound travelled lanes on San Felipe Road while approaching Gateway Drive. The existing median is reconfigured and landscaped to begin the transition towards a Complete Street. A two-lane roundabout is installed at the Gateway Drive intersection and all existing left-turn pockets are retained.
Figure 14: San Felipe Rd between Pinnacles National Hwy-CA 25 and Gateway Dr, #2

Downtown Traffic Corridor Study, City of Hollister
Page | 24
Between Gateway Drive and Flora Avenue Adjacent to the existing sidewalks are one-way cycle tracks with a 5’ landscaped buffer as separation from the angular parking lane. A landscaped center median is provided to divide opposing traffic flows and the number of thru lanes is reduced to one in each direction. All existing left-turn pockets are retained and high visibility crosswalks are installed at all legs of the Gateway Drive intersection.
Figure 15: San Felipe Rd between Gateway Dr and Flora Ave, #2

Downtown Traffic Corridor Study, City of Hollister
Page | 25
Between Flora Avenue and Maple Avenue Adjacent to the existing sidewalks are one-way cycle tracks with a 5’ landscaped buffer as separation from the angular parking lane. A landscaped center median is provided to divide opposing traffic flows and the number of thru lanes is reduced to one in each direction. All existing left-turn pockets are retained and high visibility crosswalks are installed at the south and west legs of the Flora Avenue intersection.
Figure 16: San Felipe Rd between Flora Ave and Maple Ave, #2

Downtown Traffic Corridor Study, City of Hollister
Page | 26
Between Maple Avenue and Santa Ana Road-North Street The ROW at the Maple Avenue intersection is 115’ and 80’ at the Santa Ana Road-North Street intersection. Geometric constraints for the segment resulted in two cross-sections that provide a smooth transition for the roadway. Adjacent to the existing sidewalks are one-way cycle tracks with a landscaped buffer as separation from the angular parking lane. The buffer is wider at the north end than at the south and tapers accordingly with the road.
Parallel parking lanes are provided at the north end but terminate before reaching Santa Ana-North Street. Landscaped center medians are provided with left-turn pockets to allow driveway access along San Felipe Road and the number of thru lanes is reduced to one in each direction. A crosswalk is installed at the east leg of the Maple Avenue intersection.
Figure 17: San Felipe Rd between Maple Ave and Santa Ana Rd-North St (North), #2
Figure 18: San Felipe Rd between Maple Ave and Santa Ana Rd-North St (South), #2

Downtown Traffic Corridor Study, City of Hollister
Page | 27
Between Santa Ana Road-North Street and 1st Street Adjacent to the existing sidewalks are one-way cycle tracks with a 5’ landscaped buffer as separation from the angular parking lane. A landscaped center median is provided to divide opposing traffic flows and the number of thru lanes is reduced to one in each direction. Left-turn pockets are provided at all study intersection approaches along San Benito Street and high visibility crosswalks are installed at all legs of the Santa Ana Road-North Street intersection.
Figure 19: San Benito St between Santa Ana Rd-North St and 1st St, #2

Downtown Traffic Corridor Study, City of Hollister
Page | 28
Between 1st Street and 4th Street Adjacent to the existing sidewalks are one-way cycle tracks with a 3’ landscaped buffer as separation from the angular parking lane. A landscaped center median is provided to divide opposing traffic flows and the number of thru lanes is reduced to one in each direction.
Left-turn pockets are provided at all major intersection approaches along San Benito Street and at the southbound approach of the 2nd Street intersection. High visibility crosswalks are installed at the south and west legs of the 1st Street intersection and the east leg of the 2nd Street intersection.
Primary gateways are installed at the 3rd Street and South Street intersections with secondary gateways located at the 1st Street and Hawkins Street intersections per the Hollister Downtown Plan.
Figure 20: San Benito St between 1st St and 4th St (North), #2
Figure 21: San Benito St between 1st St and 4th St (South), #2

Downtown Traffic Corridor Study, City of Hollister
Page | 29
Between 4th Street and South Street (Convertible Street) The segment between 4th Street and South Street is designed as a convertible street involving colored pavers for the vehicular roadway and sidewalks with the provision of rolled curbs. The existing sidewalks, 13’ wide in the north and south directions, become 10’ wide with a 3’ landscaped buffer for separation from vehicular traffic. Existing parking is retained with no reduction in spaces.
Class III shared lanes and a landscaped center median are provided, and the number of thru lanes is reduced to one in each direction. The median will be divided at the midpoint of each block by a mid-block crosswalk paved with tumbled glass aggregate per the Hollister Downtown Plan. Left-turn pockets are provided at all intersection approaches along San Benito Street and high visibility crosswalks are installed at all legs.
Figure 22: San Benito St between 4th St and South St, #2

Downtown Traffic Corridor Study, City of Hollister
Page | 30
Between South Street and Hawkins Street The existing sidewalks, 14’ wide in the northbound direction and 13’ in the southbound direction, become 11’ and 10’ in the north and south directions respectively with a 3’ landscaped buffer for separation from vehicular traffic. Class III shared lanes and a landscaped center median are provided along the segment, and the number of thru lanes remains as existing. Existing parking is retained, left-turn pockets are provided at intersection approaches along San Benito Street, and high visibility crosswalks are installed at all legs.
Primary gateways are installed at the 3rd Street and South Street intersections with secondary gateways located at the 1st Street and Hawkins Street intersections per the Hollister Downtown Plan.
Figure 23: San Benito St between South St and Hawkins St, #2

Downtown Traffic Corridor Study, City of Hollister
Page | 31
Between Hawkins Street and Nash Road The existing sidewalks, 15’ wide in the north and south direction, are retained through this segment to preserve the mature trees lining San Benito Street. The existing vehicular lanes are converted to Class III shared lanes. This segment is located in a residential neighborhood directly south of the Downtown and the addition of Sharrows will help increase driver awareness to cyclists improve safety for all modes of transportation. High visibility crosswalks are installed at all legs of the Hawkins Street intersection.
It should be noted that upon City review and community input, this segment will reflect the design description found in the Alternative 1 discussion.
Figure 24: San Benito St between Hawkins St and Nash Rd

Downtown Traffic Corridor Study, City of Hollister
Page | 32
LEVEL OF SERVICE ANALYSIS
EXISTING CONDITIONS Under Existing Conditions, all study intersections operate at acceptable levels of service of LOS C or better except for the intersections of San Felipe Road and Gateway Drive and San Benito Street and 4th Street. The intersection at Gateway Drive operates at LOS F during both peak hours and the 4th Street intersection operates at LOS E and D during the a.m. and p.m. peak hours respectively. Table 2 below summarizes the level of service analysis results for Existing Conditions.
Table 2: Level of Service Analysis for Existing Conditions
ID Intersection AM Peak Hour PM Peak Hour
Delay LOS Delay LOS
1 San Felipe Road at Pinnacles National Highway-California 25
24.1 C 26.3 C
2 San Felipe Road at Gateway Drive 50.3 F 110.2 F
3 San Felipe Road-San Benito Street at North Street-Santa Ana Road
17.5 B 13.8 B
4 San Benito Street at 3rd Street 11.9 B 11.9 B
5 San Benito Street at 4th Street 77.2 E 51.6 D
6 San Benito Street at 5th Street 4.3 A 4.3 A
7 San Benito Street at 6th Street 24.3 C 17.0 C
8 San Benito Street at 7th Street 21.6 C 18.2 C
9 San Benito Street at South Street 9.0 A 9.4 A
Note: Delay is expressed in seconds Source: TJKM, 2014
CUMULATIVE CONDITIONS The analysis for Cumulative Conditions involves projected traffic volumes as determined by a TDM. The Year 2035 link volumes were provided by San Benito County staff and analyzed using TurnsW32 software. This software uses existing turning movement counts, collected at the beginning of the study, and projected link volumes to estimate future turning movement volumes through the Fratar Method. The estimated turning movements are then entered into Synchro files with the existing and proposed scenarios to determine LOS and delay for the study intersections. Results of the Cumulative Conditions analysis are found in Table 3.
The results show that five intersections (six with Gateway Drive as a roundabout) are expected to operate at LOS D or worse under Cumulative plus Project Conditions during at least one peak hour. This is due to the high volumes in Downtown taken from the TDM, which does not incorporate this Complete Streets

Downtown Traffic Corridor Study, City of Hollister
Page | 33
project. The alternatives involve a lane reduction to create a two-lane corridor and the City hopes to divert heavy commuter traffic volumes away from San Benito Street and encourage modal switch to walking, bicycling, and transit use.
Table 3: Level of Service Analysis for Existing, Existing plus Project, Cumulative and Cumulative plus Project Conditions
ID Intersection Control Type
Existing Conditions
Existing plus Project
Conditions
Cumulative Conditions
Cumulative plus Project Conditions
Delay LOS Delay LOS Delay LOS Delay LOS
1 San Felipe Rd/Pinnacles National Hwy-California 25
Signalized 24.1
(26.3) C
(C) 24.1
(26.3) C
(C) 24.1
(26.3) C
(C) 24.1
(26.3) C
(C)
2 San Felipe Rd/Gateway Dr
TWSC 50.3
(110.2)F
(F) - -
173.4 (333.9)
F (F)
- -
Signalized - - - - - - 9.2
(15.4) A (B)
One-Lane Roundabout
- - 31.0
(67.6) D (F)
- - 93.7
(205.3)F
(F)
Two-Lane Roundabout
- - 16.2
(48.8) C (E)
- - 78.5
(176.2)F
(F)
3 San Felipe Rd-San Benito St/North St-Santa Ana Rd
Signalized 17.5
(13.8) B
(B) 30.1
(20.5) C
(C) 11.7
(22.9) B
(C) 25.5
(105.9)C (F)
4 San Benito St/3rd St Signalized 11.9
(11.9) B
(B) 23.7
(23.2) C
(C) 10.1 (9.4)
B (A)
22.9 (18.8)
C (B)
5 San Benito St/4th St Signalized 77.2
(51.6) E
(D) 93.6
(73.2) F
(E) 104.5
(185.2) F
(F) 304.8
(323.6)F
(F)
6 San Benito St/5th St
Signalized 4.3
(4.3) A
(A) 4.7
(4.8) A
(A) 7.9
(10.2) A (B)
15.9 (19.5)
B (B)
AWSC - - 16.8
(22.0) C
(C) - -
172.7 (280.9)
F (F)
7 San Benito St/6th St TWSC 24.3
(17.0) C
(C) 27.1
(21.1) D (C)
25.5 (30.0)
D (D)
78.9 (516.0)
F (F)
8 San Benito St/7th St TWSC 21.6
(18.2) C
(C) 27.3
(21.9) D (C)
29.3 (52.2)
D (F)
66.9 (577.3)
F (F)
9 San Benito St/South St Signalized 9.0
(9.4) A
(A) 9.8
(8.4) A
(A) 7.0
(7.9) A
(A) 7.6
(7.9) A
(A) Note: Delay is expressed in seconds; a.m. and p.m. values are denoted as A.M. (P.M.) Source: TJKM, 2014

Downtown Traffic Corridor Study, City of Hollister
Page | 34
ROUNDABOUT ANALYSIS For an initial planning level study, the number of lanes required for a roundabout can be taken from Table 4. This table relies on vehicular volumes at the intersection where a roundabout feasibility study is desired. If the sum of the entering and conflicting volumes is less than 1000 vehicles per hour (vph), a one-lane roundabout is anticipated to operate at acceptable LOS. A two-lane roundabout may be necessary for volumes greater than 1000 vph.
Table 4: Volume Thresholds for Roundabout Lane Requirements
Volume Range (sum of entering and conflicting
volumes) Number of Lanes Required
0 to 1,000 veh/hr Single-Lane entry likely to be sufficient
1,000 to 1,300 veh/hr Two-Lane entry may be needed Single-Lane may be sufficient based upon more detailed analysis
1,300 to 1,800 veh/hr Two-Lane entry likely to be sufficient
Above 1,800 veh/hr More than two entering lanes may be required A more detailed capacity evaluation should be conducted to verify
lane numbers and arrangements
Based on the existing and cumulative intersection volumes, a two-lane roundabout at the intersection of San Felipe Road and Gateway Drive is preferable.
ALTERNATIVE EVALUATION The alternatives were graded and scored based on the established evaluation criteria. Evaluation of the alternatives shows Alternative 1 as the superior choice of the two due to greater enhancement of the facility and operational impacts. Table 5 below summarizes the evaluation results for both alternatives.
Table 5: Evaluation Criteria Results for Proposed Alternatives
Evaluation Criteria Points
Possible Alternative 1 Alternative 2
Minimum Safety-Related Design Standards for Pedestrians, Bicycles, and Vehicles
20 20 20
Enhancement of Transportation Facility 80 80 66 Collision Reduction Potential 10 10 10 Intersection Operational/Capacity Impacts 10 6.5 5.5 Roadway Segment Capacity Impacts 15 13 13 On-Street Corridor Parking Supply Impacts 10 10 10 Potential for Cut-Through 10 8 8 Aesthetics/Environmental Sustainability 5 5 5 Extent of Downtown Revitalization 5 5 5 Cost-Effectiveness and Implementation 5 0 5
Total 170 157.5 147.5

Downtown Traffic Corridor Study, City of Hollister
Page | 35
ADDITIONAL RECOMMENDATIONS AND DESIGN CONSIDERATIONS
NATIONAL ASSOCIATION OF CITY TRANSPORTATION OFFICIALS The National Association of City Transportation Officials (NACTO) provides two published design guides: Urban Street Design Guide and Urban Bikeway Design Guide. The Urban Street Design Guide (Street Guide) provides guidance on the dimensions of street facilities for the Complete Streets movement and the Urban Bikeway Design Guide (Bikeway Guide) provides guidance for the development of bicycle facilities.
Per the Street Guide, Alternative 1 complies with all recommendations on street facility dimensions. This is due to the extension of sidewalk widths to provide a minimum of 8’ for the pedestrian through zone. Alternative 2 complies with the Street Guide but the lack of sidewalk expansion makes it less favorable than Alternative 1. The Street Guide provides information on development of proposed landscaped buffers throughout the corridor and can be complied with during the design stages. Both alternatives comply with the sections regarding crosswalks and crossings and corner radii at all study intersections and crossings. Signal timings were optimized for the Cumulative and plus Project Conditions analyses per the original scope of work. To be in compliance with the Street Guide, they should be revised to prioritize walking, bicycling, and transit, timed for the intended traffic speed, and include fixed time signals instead of actuated signals within Downtown.
The bicycle facilities in both alternatives fully comply with the Bikeway Guide. The cycle tracks proposed are in accordance with the Bikeway Guide, providing a minimum of 5’ of travelled way with a 3’ buffer. The Class III shared lanes are also in compliance providing the necessary lane markings and not being located on shoulders. Additional items to increase compliance with the Bikeway Guide include implementation of bike boxes, intersection crossing markings, median refuge islands, bicycle signal heads, signal detection and actuation, and actuated warning beacons at unsignalized intersections. These additional measures should be justified by ridership in the area and can be implemented upon reevaluation after project completion.
PARKING Upon review of the Draft Conceptual Alternatives Report (2014), parking was deemed a major concern for the City. The preliminary alternatives reduced the number of available parking spots in Downtown due to the provision of Class II bicycle facilities, which was not desirable. The proposed alternatives presented have no negative impact to the existing parking supply and additional parking is available at the northern end of the corridor. New parallel parking spots generally have 8’x22’ dimensions but are wider (9’ or 13’) where space is available. An 8’ width is per the CA MUTCD and 22’ length is per City request (above CA MUTCD minimum of 20’).
Parking to the south of 1st Street is moved to the southbound direction to prevent an offset in lane striping through the intersections. Angular parking is preferred according to the Hollister Downtown Plan but ROW restrictions prevent implementation in the Downtown area. Angular parking was considered but the resulting number of spaces was not significantly higher compared to the existing parking. Alternative 2 provides angular parking along the northern end of the corridor where space permits.

Downtown Traffic Corridor Study, City of Hollister
Page | 36
SIDEWALK AMENITIES The alternatives propose to include landscaping and street trees, newspaper racks, streetlights, and waste receptacles per the Hollister Downtown Plan. These amenities will help to enhance the pedestrian experience through Downtown. Landscaping improvements are proposed to the south of Hawkins Street to remain consistent with the Downtown.
TRANSIT There are six transit stops located throughout the study corridor. Both alternatives have minimal impact to these locations and improvements are proposed to enhance transit ridership. In Downtown, stops are proposed to have a bus shelter or bench available along with bicycle racks per the Hollister Downtown Plan. Where not present, other transit amenities such as bus schedules, waste receptacles, and newspaper racks are encouraged.

Downtown Traffic Corridor Study, City of Hollister
Page | 37
PUBLIC OUTREACH
Upon City review of the Draft Conceptual Alternatives Report in August 2014, TJKM developed new alternatives for San Benito Corridor. The new alternative designs, discussed within this report, were presented to the Hollister Downtown Association for comment in January 2015. The Association felt the designs were appropriate and would benefit the revitalization of Downtown Hollister. The streetscape improvements were well received and considered to be instrumental in beautifying the corridor. After meeting with the Association, the alternatives were presented to City Council in February 2015 for review and the designs were accepted.
A resolution of the City Council to adopt the Downtown Traffic Corridor Study prepared by TJKM was passed and adopted on February 17, 2015 under Resolution Number 2014-26. It should be noted that “2014-26” is a misprint and should be “2015-26”. A copy of the resolution can be found in Appendix E. After review, Alternative 2 in this report has been chosen for the San Benito Corridor project and will be designed for construction. It should also be noted that Alternative 2 in the following report does not include Class II bicycle lanes from Hawkins Street to Nash Road. Upon consultation with City staff and response from the community, the alternative to be designed shall include exclusive (Class II) bicycle lanes along the final portion of the study corridor as is found in the Alternative 1 description of this report.
Following the adoption of the resolution, an article was published on the San Benito County News website titled “Downtown Hollister traffic plan approved by council.” The writing explains what the project is about and expresses that those in the community and on the Council generally accept the project. A copy of the news article is attached in Appendix F.
Downtown Traffic Corridor Study, City of Hollister
Page | 38
CONCLUSION
ALTERNATIVE COMPARISON The two alternatives presented in this report are similar in most aspects aside from the proposed curb lines. Alternative 2 uses existing curbs whereas Alternative 1 requires curb extensions throughout the corridor. Alternative 1 provides a heavier Complete Streets application and aims at equally prioritizing all modes of transportation. These proposed street configurations are intended to enhance corridor aesthetics and emphasize non-auto transportation through the city. Based on City staff review, community input, and consideration of limited funding, Alternative 2 is the preferred alternative.
LEVEL OF SERVICE The lane reduction along the corridor was expected to cause a degradation in intersection LOS from Existing Conditions. Analysis indicates that under Existing plus Project Conditions, the intersections at Santa Ana Road-North Street, 4th Street, 5th Street, 6th Street, and 7th Street will be impacted during at least one peak hour.
Under Cumulative Conditions, four study intersections are expected to operate at LOS D or worse during at least one peak hour. With proposed lane geometry, five (six including the roundabout option for Gateway Drive) are expected to operate at LOS D or worse during at least one peak hour. The intersections experiencing the worst LOS are located within Downtown, where the City desires speed reduction and traffic calming most.
The intersection at Gateway Drive was analyzed under three scenarios: a one-lane roundabout, two-lane roundabout, and signalized roundabout. The results show the one- and two-lane roundabout options operate at unacceptable LOS during both peak hours and the signalized options operates at LOS B or better under Cumulative plus Project Conditions. A signal at the intersection is preferred based on the analyses.
PARKING Additional parking is supplied with both alternatives without removing existing spaces along the corridor.
CUMULATIVE CONDITIONS The Cumulative Conditions analysis uses results from the San Benito County Travel Demand Model. The outputs from the model do not reflect this project being implemented so high traffic volumes projected along San Benito Street are a conservative estimate. Complete Streets projects have tendency to divert heavy traffic flow due to prioritization of other transportation modes.
The results of the analysis show that six of the ten study intersections are expected to operate at LOS D or below with high delay under Cumulative plus Project Conditions.

Downtown Traffic Corridor Study, City of Hollister
Page | 39
GLOSSARY
Complete Street
Complete Streets are designed and operated to enable safe access for all users. Pedestrians, bicyclists, motorists and transit riders of all ages and abilities must be able to move safely within a complete street. Typical elements that make up these systems include sidewalks, bicycle lanes, appropriate street widths and speeds, transit stops with benches, shelters and access points that comply with Americans with Disabilities Act requirements.
Road Diet
The term “Road Diet” involves reconfiguring an undivided four-lane roadway into a two-lane roadway with a center two-way left turn lane. The lane reduction allows the roadway to be reallocated for other uses such as bicycle lanes, pedestrian crossing islands and parking. Road diets decrease vehicle travel lanes for pedestrians to cross, improve safety for bicycles when bike lanes are added, provide opportunity for on-street parking, reduce rear-end and sideswipe crashes, improve speed limit compliance, and help decrease crash severity.
Convertible Street
The main concept of a convertible street is its ability to convert from a vehicular street to a pedestrian street during special events. According to the Hollister Downtown Plan, the street should be designed with decorative paving materials (similar to sidewalks, bulb-outs and crosswalks) and reconfigured to include rolled curbs instead of existing curbs.

Downtown Traffic Corridor Study, City of Hollister
Page | 40
Roundabout
Roundabouts are circular intersections with specific design and traffic control features. These features include yield control of all entering traffic, channelized approaches, and appropriate geometric curvature to ensure that travel speeds on the circulatory roads are less than 30mph. Single-lane roundabouts are characterized as having a single lane entry at all legs and one circulatory lane. Double-lane roundabouts are characterized as having at least one or more approaches that flare from one to two lanes. Roundabouts direct users through the intersection in a predictable manner and at slow speeds. They provide simple pedestrian crossings and set a tone for cautious driving.
Exclusive Bike Lane (Class II)
Dedicated bicycle lanes are the preferred option to provide for the greatest variety of cyclists on streets with higher volumes and speeds. The most recognizable form of a bicycle lane is a painted arrow and a cyclist icon. Bicycle lanes are the backbone of a complete bicycle network as they visually distinguish bicycle only travel lanes in which a cyclist does not have to maneuver around motor vehicles and vice versa. Bicycle lane widths are usually 4’ to 6’ of pavement. When bicycle lanes adjacent to on-street parking or high-speed streets, the minimum width of a bike lane is 5’.
Marked Shared Lane (Class III)
In streets where bicycle lanes cannot be accommodated, shared lanes provide an attractive alternative. Shared-lane markings are markings that indicate a shared-use lane for motorists and cyclists. Shared-lane markings, also termed as a “Sharrow,” increase the motorists awareness to the presence of cyclists, reduce occurrence of wrong-way bicycling and indicate the position of cyclists in the lane. Marked shared lanes are generally applied to lower speed streets. To maintain high quality of service, “Share the Road” signs or “Bicycles May Use Full Lane” signs should also be added.

Downtown Traffic Corridor Study, City of Hollister
Page | 41
Sidewalk
Sidewalks are the primary mode of pedestrian travel and are a crucial element in any pedestrian network. Sidewalks should be a part of a continuous network, connected with crosswalks and separated from traffic by a buffer. The minimum unobstructed walking space for a sidewalk on a street is 5’, with 6’ or wider applications for high volume, high speed streets.
Buffer
Providing a buffer between pedestrians and traffic is important for providing good quality of service. A buffer is a strip of land that separates vehicular traffic from the sidewalk or other pedestrian facility. Buffers typically are planting strips or hard-scaped amenity zones. For most street types, buffers are planted with trees to provide shade and additional (vertical) buffering. Other elements of Complete Streets can also contribute to a buffer such as bicycle lanes and on-street parking.

Downtown Traffic Corridor Study, City of Hollister
Page | 42
High Visibility Crosswalk
Marked crosswalks guide pedestrians and alert drivers to crossing locations. Crosswalks can be marked in paint or long lasting plastic epoxy material embedded with reflective glass beads. More expensive, long lasting, high-visibility crosswalk marking materials are recommended because they require less maintenance over time. The minimum crosswalk width is 6 feet but it should be wider at crossings that see high pedestrian activity.
According to the Hollister Downtown Plan, crosswalks should utilize concrete pavers similar to the ones on curb bulb-outs and sidewalks or painted as high visibility ladder crosswalks as shown below. Mid-block crosswalks should be raised and implement heavily textured, embedded glass aggregate paving.
Curb Bulb-Out
Curb bulb-outs are extensions of sidewalks that narrow the street, decrease the crossing distance and increase pedestrian visibility. They help in traffic calming, reducing speeds, and improving pedestrian safety. They also serve to protect parallel parking.
According to Hollister Downtown Strategic Plan, bulb-outs should be provided at all intersections and mid-block crossings along San Benito Street and South Street. They should be constructed of colored and scored concrete as shown below. They should include amenities such as seat walls, landscaping and street trees, newspaper racks, streetlights, and waste receptacles.

Downtown Traffic Corridor Study, City of Hollister
Page | 43
Gateway
Gateways are categorized into primary gateways and secondary gateways. Primary gateways are larger and indicate a major transition into the downtown area of the city. Secondary gateways indicate a comparatively subtle transition. Primary gateways incorporate a gateway arch, bulb-outs with seat walls and signage, and distinctive landscaping treatments. Secondary gateways are envisioned with smaller gateway signage at sidewalk corners and distinctive landscaping treatments similar to primary gateways.
Median
A median is the space that separates two opposing lanes of traffic and can have pavement markings or be raised to separate the various road users. Raised medians help in reducing motor vehicle crashes, reducing speeds on roadways, providing space for landscaping within right-of-way, and providing space to install roadway lighting and signage.
Americans with Disabilities Act Requirements
Pedestrian quality of service is especially important for persons with limited mobility. The Americans with Disabilities Act (ADA) requires certain elements, like curb ramps and minimum clearance widths, to make the pedestrian network accessible to all users.