Dover Q1 2021 Earnings Presentation
22
Earnings Conference Call First Quarter 2021 April 20, 2021 – 9:00am CT
Transcript of Dover Q1 2021 Earnings Presentation

Earnings Conference Call First Quarter 2021
April 20, 2021 – 9:00am CT

2
Forward-Looking Statements and Non-GAAP Measures
We want to remind everyone that our comments may contain forward-looking statements that are
inherently subject to uncertainties and risks, including the impacts of the novel coronavirus (COVID-19)
on the global economy and on our customers, suppliers, employees, operations, business, liquidity and
cash flow. We caution everyone to be guided in their analysis of Dover Corporation by referring to the
documents we file from time to time with the SEC, including our Annual Report on Form 10-K for 2020
and Quarterly Reports on Form 10-Q, for a list of factors that could cause our results to differ from those
anticipated in any such forward-looking statements.
We would also direct your attention to our website, dovercorporation.com, where considerably more
information can be found.
In addition to financial measures based on U.S. GAAP, Dover provides supplemental non-GAAP
financial information. Management uses non-GAAP measures in addition to GAAP measures to
understand and compare operating results across periods, make resource allocation decisions, and for
forecasting and other purposes. Management believes these non-GAAP measures reflect results in a
manner that enables, in many instances, more meaningful analysis of trends and facilitates comparison
of results across periods and to those of peer companies. These non-GAAP financial measures have
no standardized meaning presented in U.S. GAAP and may not be comparable to other similarly titled
measures used by other companies due to potential differences between the companies in calculations.
The use of these non-GAAP measures has limitations and they should not be considered as substitutes
for measures of financial performance and financial position as prepared in accordance with U.S.
GAAP. Reconciliations and definitions are included either in this presentation or in Dover’s earnings
release and investor supplement for the first quarter, which are available on Dover’s website.

3
Free Cash Flow(1)
+320 bps Adj. Segment EBIT Margin(1) to 19.1%
+$110M Y-o-Y
+560 bps to 7.8% of Revenue
Q1 2021 Highlights
(1) Non-GAAP measures (definitions and reconciliations in appendix)
(2) See performance measures definitions in appendix
(3) Refer to definition of total segment earnings (EBIT) margin in appendix
Mar-20Mar-19 Mar-21
1.6
1.4
2.2$ Billions
Revenue growth: 10% - 12% (All-in)
EPS: $5.92 - $6.02 (GAAP); $6.75 - $6.85 (Adjusted(1))
Revenue
+27% organic(2)
Book-to-bill(2): 1.25, >1 across all segments
+9% organic(1)
Growth in all segments
Diluted EPS
+30% Adjusted Diluted EPS(1) to $1.81
+13% Y-o-Y at $1.9B
Bookings(2) +31% Y-o-Y to $2.3B
Segment EBIT
Margin(3)+310 bps to 19.0%
+309% Y-o-Y
+33% Y-o-Y to $1.61
Backlog(2) +39% Y-o-Y growth rate
FY ’21 Guidance Revised upward

4
Summary Corporate Q1 Results
Q1 2021 Highlights and Comments
Revenue change
(Y-o-Y)
All-in
Organic(1)
13%
9%
Y-o-Y growth in all segments
Q1 FX impact: +3%; acquisitions (net of divestitures) +1%
Bookings change
(Y-o-Y)
All-in(2)
Organic(2)
+31%
+27%
Q1 book-to-bill(2): 1.25; bookings up Y-o-Y in all five segments
Backlog +39% Y-o-Y; up across all five segments
Segment EBIT margin
improvement (Y-o-Y)
Reported(3)
Adjusted(1)
+310 bps
+320 bps
Accretion driven by volume and productivity initiatives
44% Y-o-Y Adj. EBIT conversion margin(1)
EarningsReported
Adjusted(1)
$233M
$263M
Reported Q1 Y-o-Y change: +32%
Adjusted(1) Q1 Y-o-Y change: +29%
Diluted EPSReported
Adjusted(1)
$1.61
$1.81
Reported Q1 Y-o-Y change: +33%
Adjusted(1) Q1 Y-o-Y change: +30%
Free Cash Flow
(% of)(1)
Revenue
Adj. Earnings
8%
56% Q1 FCF(1) up $110M (+309%) Y-o-Y
Guidance and other activities
2021 revised guidance:
‒ Revenue growth: 10% - 12% (All-in)
‒ EPS: $5.92 - $6.02 (GAAP); $6.75 - $6.85 (Adjusted(1))
(1) Non-GAAP measures (definitions and/or reconciliations in appendix)
(2) See performance measures definitions in appendix
(3) Refer to definition of total segment earnings (EBIT) margin in appendix

5
Segment
Revenue ($M) /
Organic
Change %
Adj. EBIT % /
bps ∆
Y-o-Y
Performance Commentary
DEP$428
+2%
17.0%
+0 bps
Top line strength in vehicle aftermarket, industrial automation, and aerospace & defense
Backlog(2) up $109M Y-o-Y (+24%); book-to-bill(2) 1.23; organic bookings(2) up 25%
driven by strong orders in waste handling and vehicle aftermarket
DFS$390
+3%
17.1%
+180 bps
Strength in NA retail fueling and system business in Europe, improvement in vehicle
wash; continued softness in Asia and fuel transport
Backlog(2) up $27M Y-o-Y (+13%); book-to-bill(2) 1.08; organic bookings(2) up 7% on
activity in NA retail fueling and vehicle wash
DII$284
+4%
20.3%
+10 bps
Solid demand in marking & coding. Textile printing improving, but large printer sales
remain low
Backlog(2) up $28M Y-o-Y (+17%); book-to-bill(2) 1.03; organic bookings(2) slight increase
driven by FMCG and industrial marking & coding orders
DPPS$394
+18%
30.8%
+890 bps
Good growth in biopharma connectors and pumps, coupled with strength in industrial
pumps and polymer processing. Activity in compression stabilized
Backlog(2) up $141M Y-o-Y (+36%); book-to-bill(2) 1.40; organic bookings(2) up 44% on
double-digit growth across all operating units, except precision components
DRFE$372
+18%
10.2%
+450 bps
Strong demand in food retail, heat exchangers, and can making. Gradual improvement in
foodservice equipment, particularly from restaurant chains
Backlog(2) up $321M Y-o-Y (+90%) to $677M, driven by can making and food retail
($269M and $336M as of 3/31/21, respectively); book-to-bill(2) 1.44; organic bookings(2)
up 51% driven by double-digit growth across all four operating units within the segment
Segment Results
Q1 2021(1)
(1) Non-GAAP (definitions and reconciliations in appendix)
(2) See performance measures definitions in appendix

6
Q1 2020
Revenue & Bookings
Q1 2021 RevenueChange in Organic Revenue(1): +$145M, or +8.8%
DII ACQ./
DISP. (2)
DFS DPPS DRFE FX Q1 2021
Q1 2020 ACQ./
DISP. (3)
FXDEP DPPSDFS DII DRFE Q1 2021
Note: $ in millions. Numbers may not add due to rounding
Q1 2021 Bookings(4)
Change in Organic Bookings(4): +$473M, or +26.5%
(1) Non-GAAP measure (definition and reconciliation in appendix)
(2) Acquisitions: $21M, dispositions: $5M
DEP
($M)
1,656 11 51 1,868579 599
($M)
15
27 54 2,332180103 1630 211,785
Q1 2021 % of
Revenue
7%
24%
3%
56%
10%ASIA
OTHER
EUROPE
OTHER AMER.
US
(5)%
20%
13%
3%
7%
Q1 ’21 Organic
Rev Growth(1)
Organic
Organic
(3) Acquisitions: $27M, dispositions: $6M
(4) See performance measure definitions in appendix

7
Q1 2021 Adjusted Segment EBIT and Adjusted Net Earnings
SEGMENT
EBIT
ACQ.
AMORT.
GAIN ON
SALE
CORP.
EXPENSE
GAAP
EARNINGS
RIGHT
SIZING
ADJ.
EARNINGS
INT./TAX
EXPENSE
ADJ.
EARNINGS
ACQ.
AMORT.
RIGHT
SIZING
GAAP
EARNINGS
Change in Adjusted Net Earnings (3)
+$60M
176 6 -5 26 203 94 -14 -21 263 -27
Q1 2020 Q1 2021
($M)
Note: $ in millions. Numbers may not add due to rounding
233-3
DIIADJ. EBIT D&A (1) ADJ. EBITDA DEP DPPSDFS DRFE ADJ. EBITDA D&A (2) ADJ. EBIT
19.9%19.1%
Change in Adjusted Segment EBIT (3)
+$94M
Q1 2021
264 329 64 357 ($M)52
15.9%
Q1 2020
-6812 21
22.7%
42465
(1) Depreciation: $31M, Amortization: $34M
(2) Depreciation: $32M, Amortization: $36M
(3) Non-GAAP measures (definitions and reconciliations in appendix)
12.3%
14.1%
+180 bps
+280 bps

8
Q1 2021 Free Cash Flow
12.3%
(1) Includes stock-based compensation and changes in other current and non-current assets and liabilities
(2) Non-GAAP measures (reconciliations and definitions in appendix)
Note: Numbers may not add due to rounding
$M Q1 ’21 Q1 ’20 ∆
Net earnings 233 176 +57
Adjustment for gain on disposition - (7) +7
D&A 74 69 +5
Change in working capital (128) (122) -6
Change in other(1) (2) (40) +38
Cash flow from operations 177 76 +101
Capex (31) (40) +9
Free cash flow(2) 146 36 +110
FCF % of revenue(2) 7.8% 2.2% +560 bps
FCF % of adj. earnings(2) 56% 18% +3,790 bps

9
Trends and Business Outlook
Segment Comments
DEP
Strength in vehicle aftermarket, industrial automation, and aerospace & defense
Waste handling backlog improved in Q1; shipments levered toward H2 ‘21
Industrial winches trending above expectation but recovery levered toward H2 ‘21
DFS
Sustained strength in NA Retail Fueling, growth in software/systems business in Europe
Recovery in vehicle wash on built-up demand, robust trends in recently-acquired ICS
US EMV becoming a headwind in H2 ‘21
DII Stable growth in marking & coding supported by improving activity in serialization software
Rebound in textile printer demand expected in H2 ’21
DPPS
Strength in biopharma pumps and connectors
Robust outlook for industrial pumps, plastics & polymer improvement on strong bookings and backlog
Recovery in precision components, particularly energy, with robust improvement in China underway
DRFE
Robust food retail demand particularly natural refrigerants, specialty, small format, digital doors; backlog at the
highest level since 2014
Beverage can making fully booked for ’21. Growth in heat exchangers across all geographies and end-markets.
Capacity additions underway in both businesses
Commercial foodservice (<10% of segment) recovering in chains, institutional market recovery in H2 ’21

10
FY2021 Guidance Update
(1) Non-GAAP measure (definition and/or reconciliation in appendix)
Euro/Dollar assumption: 1.18
Initial Guide Revised Guide
All-in Revenue
Growth8-10% 10-12%
EPSGAAP
Adj.(1)
$5.42 - $5.62
$6.25 - $6.45
$5.92 - $6.02
$6.75 - $6.85
Tax rate 21% - 22% No change
Free Cash
Flow(1) % of
Revenue
11% - 13% No change
Capex ~$175 – 200 million No change
+2 ppt
+$0.40 - $0.50

11
2021 Recovery Expected to Result in Solid Through-Cycle Performance
$7.0B$7.1B
$6.7B
18.2%
$7.4 – 7.5B
16.7%14.8%
2018
16.6%
2019 2020 2021E
Adj. Segment EBIT Margin (%) Revenue ($B)
$4.97
$5.93 $5.67
1
2
3
4
5
6
7
8
9
202020192018 2021E
$6.75-$6.85+11% CAGR
(1) Non-GAAP measure (definitions and/or reconciliations in appendix)
(2) Mid-point
Revenue and Adj. Segment EBIT Margin(1) Adj. Earnings Per Share(1)
Prior
guidance(2)
Prior
guidance(2)25-35%
conversion(1)
2021 trajectory on track for multi-year 100+ bps/yr margin expansion plan

12
Appendix

13
Q1 2020 to Q1 2021 Revenue and Bookings Bridges by Segment
Note: Numbers may not add due to rounding
DEP DFS DII DPPS DRFE Total
408 360 257 320 312 1,656
9 11 9 59 57 145
9 10 12 12 8 51
1 9 6 4 (5) 15
428 390 284 394 372 1,868
DEP DFS DII DPPS DRFE Total
415 373 273 369 355 1,785
103 27 0 163 180 473
9 11 11 15 8 54
2 11 10 4 (6) 21
528 423 294 551 537 2,332
($ in millions)
Q1 2020 Revenue
Bookings Bridge by Segment
($ in millions)
Acquisitions / Dispositions
Q1 2021 Revenue
Organic Growth
FX
Revenue Bridge by Segment
FX
Q1 2021 Bookings
Q1 2020 Bookings
Organic Growth
Acquisitions / Dispositions

14
Organic Revenue and Bookings Bridges
Revenue Bookings
2.3% 24.8%
3.0% 7.3%
3.7% 0.1%
18.4% 44.0%
18.3% 50.7%
8.8% 26.5%
1.2% 1.5%
-0.3% -0.3%
3.1% 3.0%
Total 12.8% 30.7%
Geographic Revenue Growth Factors
Q1 2021
6.9%
3.0%
12.7%
19.8%
-4.7%
8.8%
1.2%
-0.3%
3.1%
Total 12.8%
Currency translation
Organic
Refrigeration & Food Equipment
Total Organic
Engineered Products
Pumps & Process Solutions
Fueling Solutions
Imaging & Identification
Q1 2021 Organic Growth
Segment Growth Factors
Acquisitions
Dispositions
Currency translation
Organic
US
Other Americas
Europe
Asia
Other
Total Organic
Acquisitions
Dispositions
Note: Numbers may not add due to rounding

15
Reconciliation of Q1 2021 Net Earnings to Adj. EBIT and Adj.
EBITDA and Calculation of Adj. EBIT Margin and Adj. EBITDA
Margin by Segment
(1) Adjusted depreciation and amortization expense excludes depreciation and amortization included within rightsizing and other costs
DEP DFS DII DPPS DRFE Total
428 390 284 394 372 1,868
- - - - - 233
- - - - - 39
- - - - - 26
- - - - - 56
69 66 57 124 38 354
16.1% 17.1% 20.0% 31.4% 10.2% 19.0%
4 0 1 (2) (0) 3
73 67 58 122 38 357
17.0% 17.1% 20.3% 30.8% 10.2% 19.1%
11 19 9 17 12 68
83 86 67 139 50 424
19.5% 22.0% 23.5% 35.1% 13.4% 22.7%
Q1 2021
($ in millions)
Revenue
Net earnings
Add back:
Adjusted EBITDA - Segment
Adjusted EBITDA %
Income tax expense
Segment earnings (EBIT)
EBIT %
Adjustments:
Rightsizing and other costs
Corporate expense
Adjusted EBIT %
Adjusted depreciation and amortization expense(1)
Interest expense, net
Adjusted EBIT - Segment
Note: Numbers may not add due to rounding
16
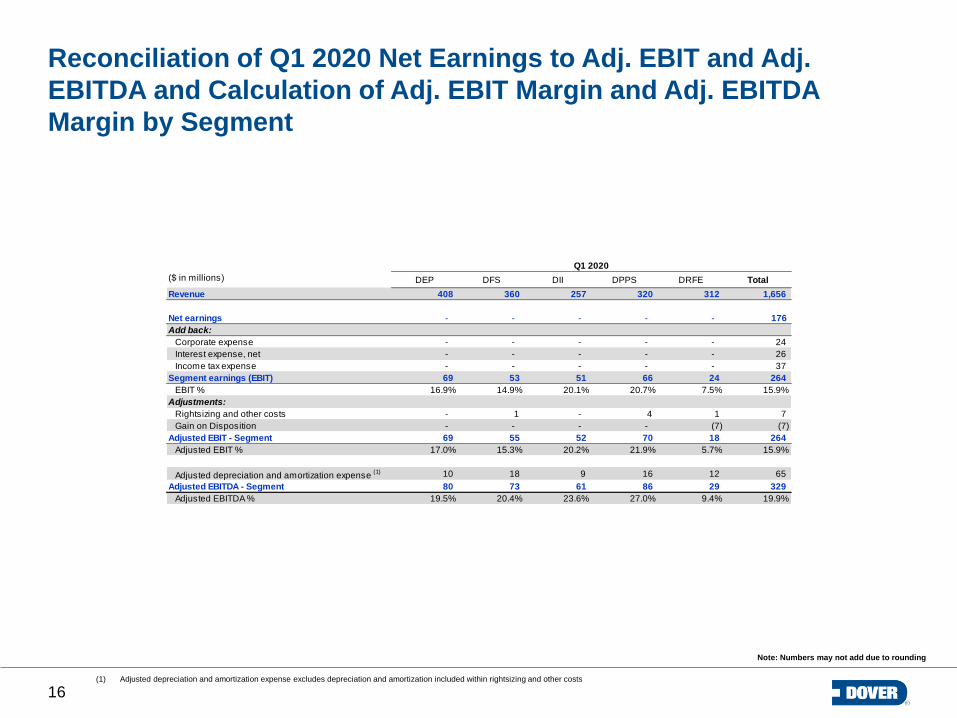
Reconciliation of Q1 2020 Net Earnings to Adj. EBIT and Adj.
EBITDA and Calculation of Adj. EBIT Margin and Adj. EBITDA
Margin by Segment
DEP DFS DII DPPS DRFE Total
408 360 257 320 312 1,656
- - - - - 176
- - - - - 24
- - - - - 26
- - - - - 37
69 53 51 66 24 264
16.9% 14.9% 20.1% 20.7% 7.5% 15.9%
- 1 - 4 1 7
- - - - (7) (7)
69 55 52 70 18 264
17.0% 15.3% 20.2% 21.9% 5.7% 15.9%
10 18 9 16 12 65
80 73 61 86 29 329
19.5% 20.4% 23.6% 27.0% 9.4% 19.9%
Corporate expense
Adjusted EBIT - Segment
Adjusted EBIT %
Adjusted depreciation and amortization expense (1)
Interest expense, net
Gain on Disposition
Q1 2020
($ in millions)
Revenue
Net earnings
Add back:
Adjusted EBITDA - Segment
Adjusted EBITDA %
Income tax expense
Segment earnings (EBIT)
EBIT %
Adjustments:
Rightsizing and other costs
(1) Adjusted depreciation and amortization expense excludes depreciation and amortization included within rightsizing and other costs
Note: Numbers may not add due to rounding

17
Reconciliation of Adjusted Net Earnings to Net Earnings and
Calculation of Adjusted Diluted EPS under U.S. GAAP
Note: Numbers may not add due to rounding
($ in millions, except per share data) Q1 2021 Q1 2020 FY 2020 FY 2019 FY 2018
Net earnings from continuing operations ($) 233 176 683 678 591
Acquisition-related amortization, pre tax 36 34 139 138 146
Acquisition-related amortization, tax impact (9) (8) (34) (35) (37)
Rightsizing and other costs, pre tax 4 8 51 32 73
Rightsizing and other costs, tax impact (1) (2) (11) (7) (15)
Gain on disposition, pre tax - (7) (5) - -
Gain on disposition, tax impact - 2 1 - -
Loss on extinguishment of debt, pre-tax - - - 24 -
Loss on extinguishment of debt, tax impact - - - (5) -
Loss on assets held for sale - - - 47 -
Tax Cuts and Jobs Act - - - - (3)
Adjusted net earnings from continuing operations ($) 263 203 824 872 756
Adjusted net earnings margin 14.1% 12.3% 12.3% 12.2% 10.8%
Weighted average shares outstanding – diluted 145 146 145 147 152
Diluted EPS from continuing operations ($) 1.61 1.21 4.70 4.61 3.89
Acquisition-related amortization, pre tax 0.25 0.23 0.95 0.94 0.96
Acquisition-related amortization, tax impact (0.06) (0.06) (0.24) (0.24) (0.24)
Rightsizing and other costs, pre tax 0.03 0.05 0.35 0.22 0.48
Rightsizing and other costs, tax impact (0.01) (0.01) (0.07) (0.06) (0.10)
Gain on disposition, pre tax - (0.04) (0.03) - -
Gain on disposition, tax impact - 0.01 0.01 - -
Loss on extinguishment of debt, pre-tax - - - 0.16 -
Loss on extinguishment of debt, tax impact - - - (0.04) -
Loss on assets held for sale - - - 0.32 -
Tax Cuts and Jobs Act - - - - (0.02)
Adjusted diluted EPS from continuing operations ($) 1.81 1.39 5.67 5.93 4.97

18
Reconciliation of FY 2020, FY 2019, and FY 2018 Earnings from
Continuing Operations to Adj. Segment EBIT and Calculation of Adj.
EBIT Margin
FY 2020 FY 2019 FY 2018
6,684 7,136 6,992
683 678 591
127 124 130
108 121 122
158 165 134
Loss on extinguishment of debt - 24 -
1,077 1,112 977
16.1% 15.6% 14.0%
44 27 59
(5.0) - -
- 47 -
1,116 1,186 1,036
16.7% 16.6% 14.8%
Loss on sale of Finder
Adjusted EBIT - Segment
Adjusted EBIT %
Income tax expense
Segment earnings (EBIT)
EBIT %
Adjustments:
Rightsizing and other costs
Gain on AMS Chino
($ in millions)
Revenue
Earnings from continuing operations
Add back:
Corporate expense
Interest expense, net

19
Reconciliation of Free Cash Flow, EPS to Adjusted EPS, and
Adjusted EBIT Conversion Margin
Range
2021 Guidance for Earnings per Share (GAAP) $5.92 $6.02
Acquisition-related amortization, net $0.73
Rightsizing and other costs, net $0.10
2021 Guidance for Adjusted Earnings per Share (Non-GAAP) $6.75 $6.85
Note: Numbers may not add due to rounding
($ millions) Q1 2021 Q1 2020
Net Cash Provided by Operating Activities 177 76
Capital Expenditures (31) (40)
Free Cash Flow 146 36
Free Cash Flow as a % of Earnings 62.7% 20.2%
Free Cash Flow as a % of Adjusted Earnings 55.5% 17.6%185.4%
Free Cash Flow as a % of Revenue 7.8% 2.2%185.4%
Free Cash Flow
($ in millions) Q1 2021 Q1 2020 ∆
Revenue 1,868 1,656 212
Adjusted EBIT - Segment 357 264 93
EBIT Conversion Margin 44%
EBIT Conversion Margin

20
Non-GAAP Definitions
Definitions of Non-GAAP Measures:
Adjusted Net Earnings: is defined as net earnings adjusted for the effect of acquisition-related amortization, rightsizing and other costs, and gain on dispositions.
Adjusted Net Earnings Margin: is defined as adjusted net earnings divided by revenue.
Adjusted Diluted Net Earnings Per Share: is defined as adjusted net earnings divided by average diluted shares.
Total Segment Earnings (EBIT): is defined as net earnings before income taxes, net interest expense and corporate expenses.
Total Segment Earnings (EBIT) Margin: is defined as total segment earnings (EBIT) divided by revenue.
Adjusted EBIT by Segment: is defined as net earnings before income taxes, net interest expense, corporate expenses, rightsizing and other costs, and gain on dispositions
Adjusted EBIT Margin by Segment: is defined as adjusted EBIT by segment divided by segment revenue. The bps change Y-o-Y is calculated as the difference between
adjusted EBIT margin for the current period and the prior period.
Adjusted EBITDA by Segment: is defined as adjusted EBIT by segment plus depreciation and amortization, excluding depreciation and amortization included within rightsizing
and other costs.
Adjusted EBITDA Margin by Segment: is defined as adjusted EBITDA by segment divided by segment revenue.
Adjusted EBIT Conversion Margin: is defined as the change in total adjusted segment earnings (EBIT) divided by the change in revenue.
Free Cash Flow: is defined as net cash provided by operating activities minus capital expenditures. Free cash flow as a percentage of revenue equals free cash flow divided by
revenue. Free cash flow as a percentage of net earnings equals free cash flow divided by net earnings. Free cash flow as a percentage of adjusted net earnings equals free cash
flow divided by adjusted net earnings.
Organic Revenue Growth: is defined as revenue growth excluding the impact of foreign currency exchange rates and the impact of acquisitions and dispositions.
The tables included in this presentation provide reconciliations of the non-GAAP measures used in this presentation to the most directly comparable U.S. GAAP measures.
Further information regarding management’s use of these non-GAAP measures is included in Dover’s earnings release and investor supplement for the first quarter.

21
Performance Measure Definitions
Definitions of Performance Measures:
Bookings represent total orders received from customers in the current reporting period. This metric is an important measure of performance and an indicator of revenue order
trends.
Organic Bookings represent total orders received from customers in the current reporting period excluding the impact of foreign currency exchange rates and the impact of
acquisitions and dispositions. This metric is an important measure of performance and an indicator of revenue order trends.
Backlog represents an estimate of the total remaining bookings at a point in time for which performance obligations have not yet been satisfied. This metric is useful as it
represents the aggregate amount we expect to recognize as revenue in the future.
Book-to-Bill is a ratio of the amount of bookings received from customers during a period divided by the amount of revenue recorded during that same period. This metric is a
useful indicator of demand.
We use the above operational metrics in monitoring the performance of the business. We believe the operational metrics are useful to investors and other users of our financial
information in assessing the performance of our segments.