DNB GROUP Fourth quarter 2013 results update · PDF fileFourth quarter 2013 results update...
26
4 Fourth quarter 2013 results update Paris, 5 March 2014 Trond Bentestuen, Head of Personal Banking Per Sagbakken, Head of IR/Long term funding DNB GROUP
Transcript of DNB GROUP Fourth quarter 2013 results update · PDF fileFourth quarter 2013 results update...

4 Fourth quarter 2013 results update Paris, 5 March 2014 Trond Bentestuen, Head of Personal Banking
Per Sagbakken, Head of IR/Long term funding
DNB GROUP

Full year 2013 – PTP before impairment NOK 24.7bn (NOK 21.0bn)
EPS and proposed DPS (in NOK)
10.76 (8.48) and 2.70 (2.10)
Cost/income ratio (in per cent)
45.7 (49.1)
ROE (in per cent)
13.2 (11.7)
CET1- capital ratio according to transitional rules and Basel III (in per cent)
11.8 (10.7) and 13.6 (12.1) Figures in parentheses refer to 2012
2 06.02.2014
5.3 (4.6)
Leverage ratio according to Basel III (in per cent)

Stong profit trend in 2013 vs. 2012 driven by: - higher NII and fee income, lower costs and lower loan losses
06.02.2014 3
Full year Full year
Amounts in NOK million 4Q13 3Q13 2Q13 1Q13 4Q12 2013 2012
Net interest income 7 940 7 915 7 480 6 857 7 101 30 192 27 216
Net commissions and fees, core business 1 989 2 057 2 142 1 851 1 896 8 040 7 511
Net financial items 2 329 2 060 2 167 1 831 2 165 8 387 6 990
Net other operating income, total 4 318 4 117 4 310 3 682 4 061 16 427 14 501
Total income 12 258 12 032 11 790 10 539 11 162 46 619 41 717
Operating expenses 5 163 4 987 5 010 5 026 5 220 20 186 20 375
Restructuring costs and non-recurring effects (212) 236 650 8 33 682 98
Expenses relating to debt-financed structured products 0 0 0 450 0 450 0
Impairment losses for goodwill and intangible assets 557 0 0 0 202 557 287
Pre-tax operating profit before impairment 6 750 6 809 6 130 5 054 5 707 24 744 20 957
Net gains on fixed and intangible assets 153 2 (9) 4 (65) 151 (1)
Impairment of loans and guarantees 36 475 937 737 1 190 2 185 3 179
Pre-tax operating profit 6 868 6 337 5 184 4 321 4 453 22 709 17 776
Taxes 1 212 1 448 1 379 1 149 614 5 188 4 081
Profit from operations held for sale, after taxes 9 (7) (7) 10 4 4 96
Profit for the period 5 665 4 881 3 798 3 181 3 843 17 526 13 792
+11%
+7%
+6% ex BS&Nets
+7% ex BS&Nets
+9% ex BS&Nets
-0.9%
+13%exBS&Nets
-30%
+21%exBS&Nets
+27%

Development in loans and deposits
06.02.2014
NOK billion
4
1 2851 309
1 3071 298
1 3151 330 1 333 1 341
1 2851 302
1 309 1 306
1 312 1 314 1 314 1 315
31March
30June
30Sept.
31Dec.
31March
30June
30Sept.
31Dec.
2012 2013
Loans at end of period
Loans adjusted for exchange rate movements
806
854
843811
889
996
925
868
806
850
845
816
886
979
908
845
749
784 785797
810
849831
854
31March
30June
30Sept.
31Dec.
31March
30June
30Sept.
31Dec.
2012 2013
Deposits at end of period Deposits adjusted for exchange rate movements
Deposits adjusted for short-term money market investments
Lending growth YOY +3.3%, FX adj. +0.6% Deposits growth YOY +7.2%
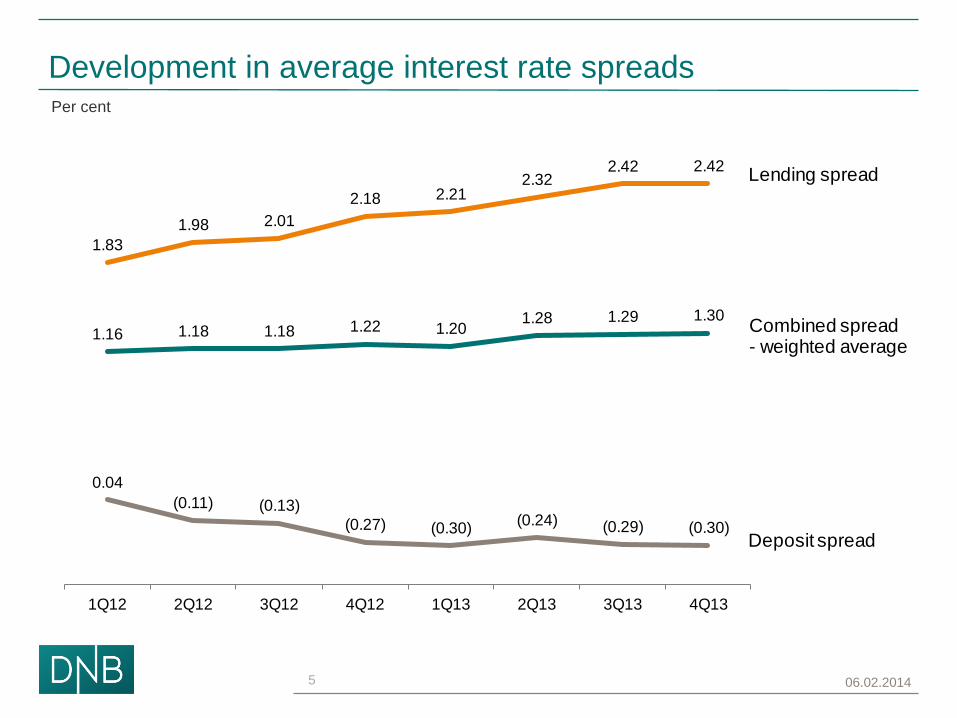
Development in average interest rate spreads
06.02.2014
Per cent
5
1.83
1.98 2.01
2.18 2.212.32
2.42 2.42
0.04
(0.11) (0.13)
(0.27) (0.30)(0.24) (0.29) (0.30)
1.16 1.18 1.18 1.22 1.201.28 1.29 1.30
1Q12 2Q12 3Q12 4Q12 1Q13 2Q13 3Q13 4Q13
Lending spread
Deposit spread
Combined spread- weighted average

Local access for
> 75% of Norwegian
population
Real-time
response from
our customers
Easy access to
basic banking
services
Over 80% of all
new home-
buyers
Only Norwegian
bank with 24/7
customer service
Extensive customer reach – A foundation for future growth
Online & mobile Call centres Branches Real estate
Points of entry
Weekly visits
Customer reach per channel
In-store banking
6

2.2
2.4
2.5
DNB Nordic upper quartile DNB target
Great potential in leveraging our existing customer base – Key profitability driver
7 Source: Finalta – Nordic Sales Effectiveness Benchmarking 2013
Products per customer Benchmarking Study, average number of products
Opportunities to improve other income
• Non-life insurance products: ~10 per cent of customer base
• Mutual funds: ~ 20 per cent of customer base
• Life insurance/pension funds: ~ 20 per cent of customer base
• Credit cards: ~ 45 per cent of customer base
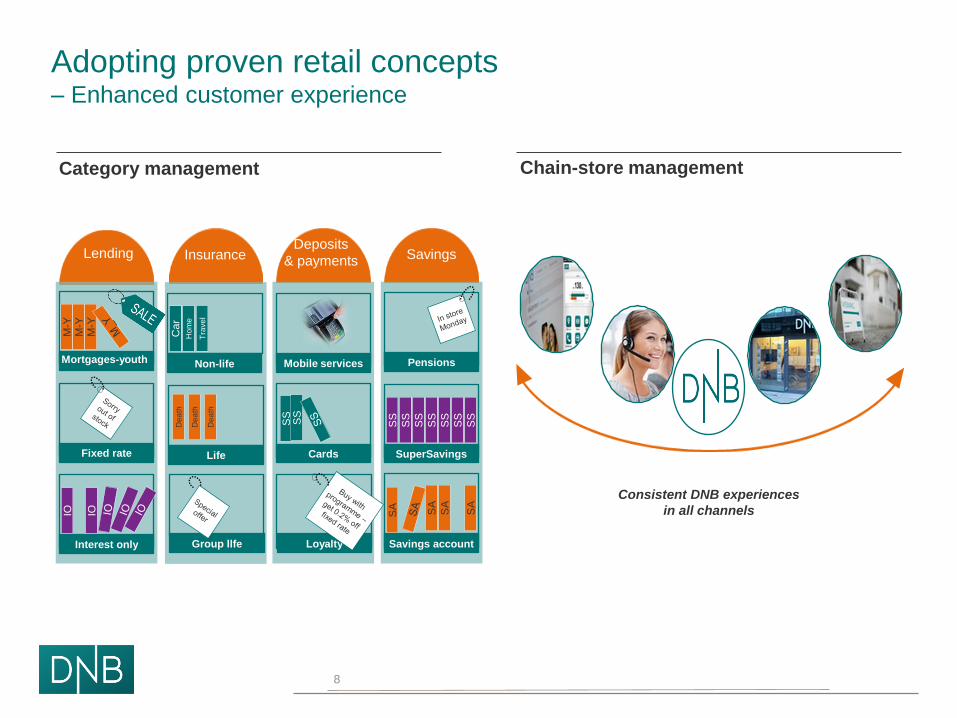
Adopting proven retail concepts – Enhanced customer experience
Category management Chain-store management
Deposits
& payments Lending Savings Insurance
Mortgages-youth
Fixed rate
Interest only
M-Y
M
-Y
M-Y
IO
IO
SuperSavings
SS
SS
SS
SS
SS
SS
SS
Pensions
Savings account
SA
SA
SA
SA
Mobile services
Cards
Loyalty
SS
S
S
Non-life
Life
Group llfe
Dea
th
Car
Hom
e
Tra
ve
l D
ea
th
Dea
th
Consistent DNB experiences
in all channels
8
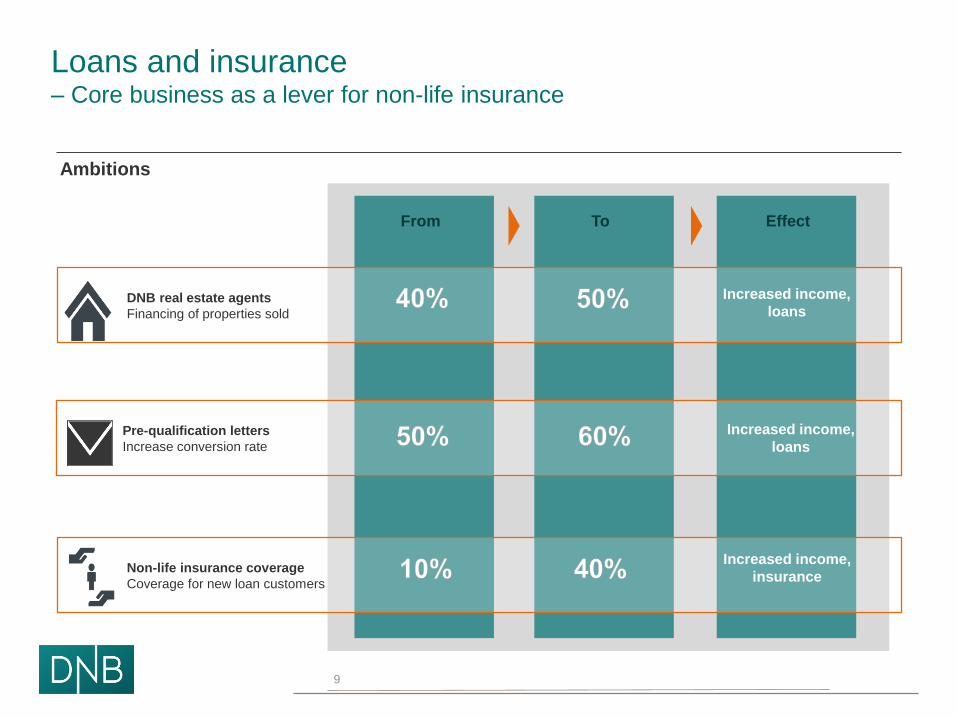
Loans and insurance – Core business as a lever for non-life insurance
Ambitions
Ambitions
To Effect From
Increased income,
insurance
Increased income,
loans
Increased income,
loans
Non-life insurance coverage
Coverage for new loan customers
9
DNB real estate agents
Financing of properties sold
Pre-qualification letters
Increase conversion rate

Savings – Growth driven by the national pension reform
Ambitions
To Effect From
Increased income,
savings
Increased income,
deposits/savings
Cost reductions
& efficient sales
10
Pension schemes
Percentage of customers
with pension schemes
Monthly savings schemes
Percentage of customers
with savings schemes
Consolidation
Number of savings products

Banking services – Focus on efficiency and loyalty programmes
Ambitions
To Effect From
Customer
satisfaction &
effectiveness
Payment cards Loyalty cards
with added value Customer loyalty
Cost reductions
11
Loyalty programmes
Consolidation
Number of products and services
Active mobile bank users
In % of active customers

30
35
40
45
50
55
60
2600
3100
3600
4100
4600
5100
5600
6100
1Q12 2Q12 3Q12 4Q12 1Q13 2Q13 3Q13 4Q13 2015guiding
2016
Total operating expenses excluding non-recurring effects Non-recurring effects Cost/income ratio - trailing 12 months
Total operating expenses excluding non-recurring effects NOK million, per cent
< 45
Flat average nominal cost (excluding restructuring costs) towards 2016
Cost/income ratio below 45 per cent towards 2016
Continued cost focus to stay
in line with guiding
Cost guiding maintained
12

Reduction in number of FTEs ahead of schedule
13
1) The estimate presented on the CMD was 12 000 full-time positions at year-end 2014.
13,592
12 016
30 June 12 3Q12 4Q12 1Q13 2Q13 3Q13 4Q13 31 Dec. 13
Full-time positions Reduction in full-time positions
1)

NPLs1) down with sale of shipping assets
14
19.118.4 18.9
16.114.5
19.520.3
19.3 19.6 19.7 19.9
23.3 22.9
20.7
1.711.55 1.56
1.311.14
1.50 1.561.45 1.47 1.50 1.48
1.71 1.70
1.38
1.050.88 0.93
0.69 0.63
1.10 1.181.09 1.09 1.16 1.10
1.37 1.39
1.10
31 Dec. 31 Dec. 31 March 30 June 30 Sept. 31 Dec. 31 March 30 June 30 Sept. 31 Dec. 31 March 30 June 30 Sept. 31 Dec.
2009 2010 2011 2012 2013
Baltics and Poland
DNB Group excl. Baltics and Poland
As a percentage of net loans
As a percentage of net loans excl. Baltics and Poland
Per cent
NOK billion
1) Includes non-performing commitments and commitments subjectto individual impairment. Accumulated individual impairment is deducted.

Impairment of loans and guarantees
15
Full year Full year
Amounts in NOK million 4Q13 3Q13 2Q13 1Q13 4Q12 2013 2012
Individual impairment:
Personal customers
- Mortgage loans 36 15 17 9 7 77 111
- Consumer finance 1) 37 38 121 88 74 284 332
Small and medium-sized enterprises 1) 207 119 156 82 221 564 540
Large corporates and international customers
- Nordic Corporates Division 67 32 61 (24) 27 136 (21)
- International Corporates Divison 86 51 82 8 (18) 228 142
- Shipping, Offshore and Logistics Division (271) 225 198 347 315 500 945
- Energy Division 1) (17) 2 66 1 192 52 230
- Baltics, Russia and Poland 93 189 83 105 133 471 635
- Other units (3) 1 6 0 (2) 4 0
Total individual impairment 236 674 791 616 949 2 318 2 915
Collective impairment:
DNB excl. Baltics, Russia and Poland (171) (174) 173 159 280 (13) 436
Baltics, Russia and Poland (29) (25) (27) (38) (39) (119) (171)
Total collective impairment of loans (200) (199) 146 121 241 (133) 265
Impairment of loans and guarantees 36 475 937 737 1 190 2 185 3 179
1) Impairment for the fourth quarter of 2013 reflects redistributions between the segments in previous quarters in 2013. Impairment figures for Personal
customers, Small and medium-sized enterprises and Large corporates and international customers segments have thus been reduced by NOK 54 million,
increased by NOK 70 million and reduced by NOK 16 million, respectively, in the fourth quarter

50
100
150
200
250
300
1985 1990 1995 2000 2005 2010
Norwegian Real Home Prices, 1985=100 Selected deflators
CPI Disp. Income
Source: EFF/finn.no/EV/SN/DNB Markets
House price growth can be explained by fundamentals
16
* Disposible income per capita deflated house prices
*
Nominal house prices 2000-2013
Norway Sweden UK US Denmark
2000 2002 2004 2006 2008 2010 2012 2013

Housing market: Real demand exceeding supply for several years Annual Figures. 2002-2013 1)
17

The Norwegian residential mortgage market
Source: Finance Norway - FNO
18

Housing market in Norway – turnover and forecast
Estimated for house price inflation
* Norway Statistics. ** Estimate DNB Markets
Year Growth
2011 * +9,0%
2012 * +7,7%
2013 * +4,9%
2014E ** -4,0%
2015E ** -2,5%
2016E ** -1,0%
Residential Properties turnover for DNB
0
500
1000
1500
2000
2500
-0.6
-0.4
-0.2
0
0.2
0.4
0.6
0.8
Q406 Q308 Q210 Q112 Q413
Turnover per month (rhs) Growth YoY (lhs)
19
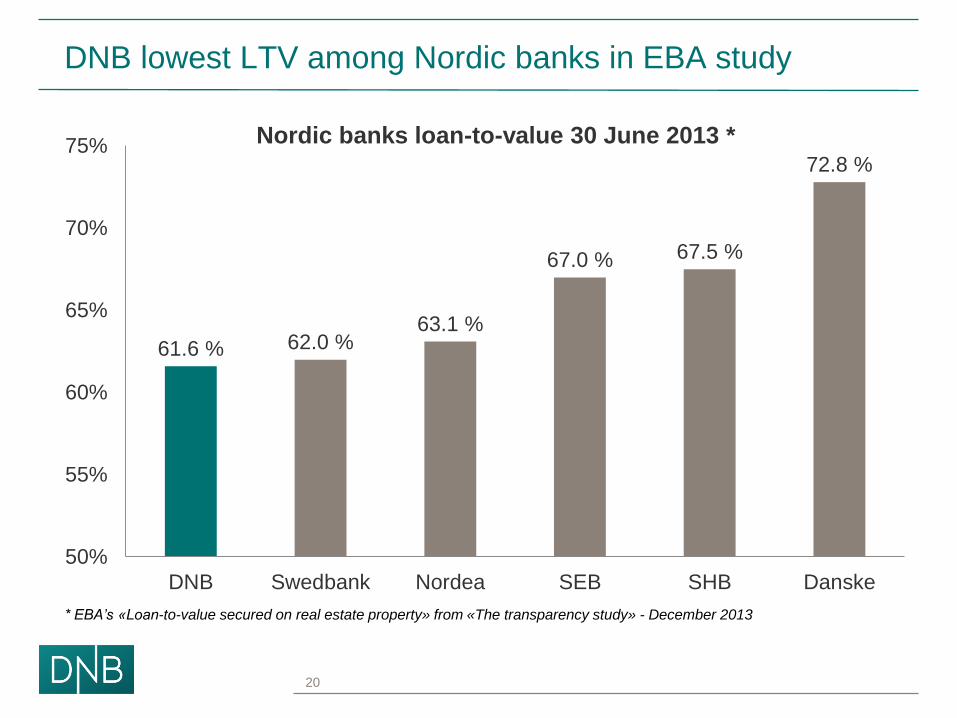
DNB lowest LTV among Nordic banks in EBA study
61.6 % 62.0 % 63.1 %
67.0 % 67.5 %
72.8 %
50%
55%
60%
65%
70%
75%
DNB Swedbank Nordea SEB SHB Danske
Nordic banks loan-to-value 30 June 2013 *
* EBA’s «Loan-to-value secured on real estate property» from «The transparency study» - December 2013
20
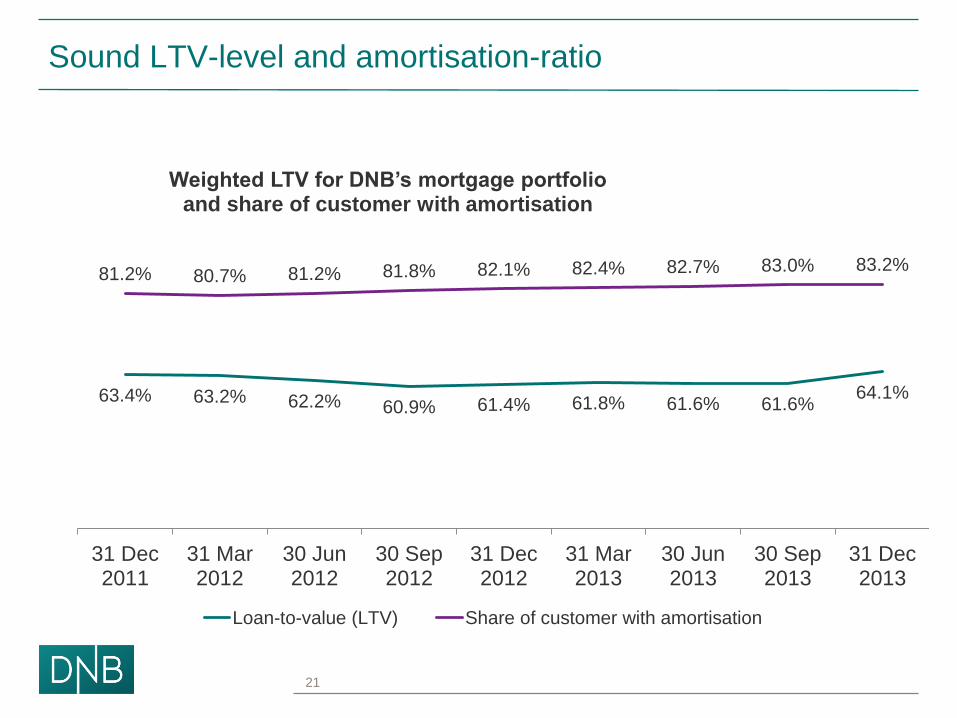
Sound LTV-level and amortisation-ratio
63.4% 63.2% 62.2% 60.9% 61.4% 61.8% 61.6% 61.6% 64.1%
81.2% 80.7% 81.2% 81.8% 82.1% 82.4% 82.7% 83.0% 83.2%
31 Dec2011
31 Mar2012
30 Jun2012
30 Sep2012
31 Dec2012
31 Mar2013
30 Jun2013
30 Sep2013
31 Dec2013
Weighted LTV for DNB’s mortgage portfolio and share of customer with amortisation
Loan-to-value (LTV) Share of customer with amortisation
21

22
DNB is well prepared for a potential negative house price correction
Mortgages are solid:
• All mortgage lending based on cash flow
Low unemployment and good social
benefit schemes makes cash flows robust
LTV levels are robust, average LTV in Cover
pool was 56.3% as of 31 December
Norway has the willingness and ability to
implement counter cyclical policies:
• A Norwegian recession would be softer due
to a likely fiscal stimulus by the Norwegian
Government (as in 2009)
Norway has net financial assets of above
180% of GDP
0.0 %
5.0 %
10.0 %
15.0 %
20.0 %
25.0 %
30.0 %
35.0 %
40.0 %
0-40 40-60 60-75 75-85 >85
LTV
Loan to value bucket
Percentage of
Mortgage book
31 Dec 2013

56.3%
62% 70%
79%
Sensitivity in DNB Boligkreditt for lower house prices
Loan-to-value Stress-scenario (LTV)Potential negative development
in house prices and potential
impact on LTV
Loan-to-value DNB Boligkreditt 2010 - 2013
Robust portfolio in DNB Boligkreditt
37% 33% 27%
17%
30-Nov-10
31-May-11
30-Nov-11
30-Jun-12
31-Dec-12
30-Jun-13
31-Dec-13
-10% -20% -30%
Regulatory overcollateralization (OC) 2010-2013
Potential negative impact
house prices and development
in regulatory OC
23

Expected capital requirements: - CET1=13.5%-14% and Total Capital=17%-18%
24
CET 1 ratio requirements
Per cent
11.8
14.0
12.5
17.0 – 18.0
Total Capital Ratio
31 Dec 2013
Transitional rules
CET1 11.8
Total capital ratio requirements
Per cent

89.6
128.1
8.5% 9.2% 9.4% 10.7% 11.8%
2009 2010 2011 2012 2013
Annual capital accumulationCET 1 capitalCET 1 capital ratio
On track towards reaching our above 12% ROE-target
above 12 per cent
Return on equity
CET1 capital ratio
13.5-14.0 per cent
Requirement
Target
Return on equity Per cent
Capital accumulation and
CET 1 capital ratio (trans.rules) NOK billion
10.6
13.6
11.4 11.7 13.2
2009 2010 2011 2012 2013
25

4 Q&A
DNB GROUP