Interim Financial Statements Q4 2015 · Financial performance - Q4 2015 The group's pre-tax profit...
32
Transcript of Interim Financial Statements Q4 2015 · Financial performance - Q4 2015 The group's pre-tax profit...


SpareBank 1 SR-Bank Group Unaudited 2
Interim Financial Statements Q4 2015 Key figures ............................................................................................................... 3
Report of the board of directors ................................................................................... 4
Income Statement ................................................................................................... 15
Balance Sheet ......................................................................................................... 16
Statement of Changes in Equity ................................................................................ 17
Cash Flow Statement ............................................................................................... 18
Notes to the Financial Statements ......................................................................... 19-29
Note 1 Accounting policies ..................................................................................... 19
Note 2 Impairment losses on loans and guarantees recognised in the income statement . 20
Note 3 Impairment losses on loans and guarantees recognised in the balance sheet ..... 20
Note 4 Non-performing and impaired loans .............................................................. 20
Note 5 Other assets .............................................................................................. 21
Note 6 Other liabilities .......................................................................................... 21
Note 7 Customer deposits by sector and industry ...................................................... 21
Note 8 Customer loans by sector and industry .......................................................... 22
Note 9 Capital adequacy ........................................................................................ 22
Note 10 Financial derivatives ................................................................................. 24
Note 11 Securities issued and subordinated loan capital ............................................. 24
Note 12 Segment reporting .................................................................................... 25
Note 13 Net income/losses from financial instruments ............................................... 26
Note 14 Pensions ................................................................................................. 27
Note 15 Sale of loans ............................................................................................ 28
Note 16 Liquidity risk ............................................................................................ 28
Note 17 Information about fair value ....................................................................... 28
Note 18 Events after the balance sheet date ........................................................... 29
Results from the Interim Financial Statements ............................................................. 30
Contact information and 2016 financial calendar .......................................................... 32

SpareBank 1 SR-Bank Group Unaudited 3
Key figures SpareBank 1 SR-Bank Group
MAIN FIGURES MNOK % MNOK %
Net interest income 2.593 1,42 2.404 1,45Net commission and other income 1.532 0,84 1.732 1,04
Net income on financial investments 304 0,17 778 0,47
Total income 4.429 2,42 4.914 2,96
Total operating costs 1.863 1,02 2.056 1,24
Operating profit before impairment losses 2.566 1,40 2.858 1,72
Impairment losses on loans and guarantees 420 0,23 257 0,15
Pre-tax profit 2.146 1,17 2.601 1,57
Tax expense 400 0,22 506 0,30
Profit after tax 1.746 0,96 2.095 1,26
31.12.15 31.12.14
PROFITABILITY
Return on equity 1) 10,8 % 14,2 %
Cost ratio 2) 42,1 % 41,8 %
Combined weighted total average spread for lending and deposits 3) 1,42 % 1,45 %
BALANCE SHEET
Gross loans to customers 155.190 141.620
Gross loans to customers including SB1 Boligkreditt og Næringskreditt 183.896 174.492
Growth in loans 4) 9,6 % 17,7 %
Growth in loans incl SB1 Boligkreditt and Næringskreditt 5,4 % 4,7 %
Deposits from customers 89.444 81.489
Growth in deposits 9,8 % 13,7 %
Total assets 192.049 174.926
Average total assets 182.768 166.017
LOSSES AND NON-PERFORMING COMMITMENTS
Impairment losses ratio, annualized 5) 0,28 % 0,20 %
Non-performing commitments as a percentage of gross loans 0,55 % 0,30 %
Other doubtful commitments as a percentage of gross loans 0,35 % 0,36 %
SOLIDITY
Common equity Tier 1 capital ratio 13,3 % 11,5 %
Tier 1 capital ratio 14,2 % 12,3 %
Capital ratio 16,7 % 14,5 %
Tier 1 capital 16.882 14.828
Risk weighted balance 119.124 120.189
Leverage ratio 6,3 % 6,1 %
LiquidityLiquidity Coverage Ratio (LCR) 6) 128 % 94,0 %
Deposit-to-loan ratio 57,6 % 57,5 %
BRANCHES AND STAFF
Number of branches 49 50
Number of employees (annualised) 1.161 1.106
SpareBank 1 SR-Bank share 31.12.15 31.12.14 31.12.13 31.12.12 31.12.11
Market price 39,30 52,50 60,25 37,20 40,70
Market capitalisation 10.051 13.427 15.409 9.514 5.182
Book equity per share(including dividends) (group) 66,14 60,28 55,00 49,48 48,75
Earnings per share, NOK 6,83 8,20 7,28 5,33 5,42
Dividends per share 1,50 2,00 1,60 1,50 1,50
Price / Earnings per share 5,75 6,40 8,28 6,98 7,51
Price / Book equity (group) 0,59 0,87 1,10 0,75 0,83
Effective return 7) -21,3 % -10,2 % 66,0 % -4,9 % -23,8 %1) Operating result as a percentage of av erage equity2) Total operating costs as a percentage of total operating income3) Net interest income as a percentage of av erage total assets4) High grow th in loans in 2014 is attributable to a buy -back of loans from SpareBank 1 Boligkreditt AS5) Impairment losses on loans as a percentage of av erage gross loans, annualised6) High quality liquid assets div ided by total net cash outflow s in a 30-day , serious stress scenario7) Percentage change in the market price in the last period, including paid share div idend
01.01.14 - 31.12.1401.01.15 - 31.12.15

SpareBank 1 SR-Bank Group Unaudited 4
Good results, good cost control, moderate losses and improved financial strength Q4 2015
Pre-tax profit: NOK 477 million (NOK 553 million) Net profit for the period: NOK 442 million (NOK 448 million) Return on equity after tax: 10.6% (11.7%) Earnings per share: NOK 1.73 (NOK 1.75) Net interest income: NOK 678 million (NOK 655 million) Net commissions and other operating income: NOK 372 million (NOK 405 million) Net income from financial investments: NOK -13 million (NOK 116 million) Operating costs: NOK 368 million (NOK 530 million) Impairment losses on loans: NOK 192 million (NOK 93 million)
(Figures for Q4 2014 are shown in brackets) Preliminary annual result for 2015
Pre-tax profit: NOK 2,146 million (NOK 2,601 million) Net profit for the period: NOK 1,746 million (NOK 2,095 million) Return on equity after tax: 10.8% (14.2%) Earnings per share: NOK 6.83 (NOK 8.20) The board proposes a dividend of NOK 1.50 (NOK 2.00) Net interest income: NOK 2,593 million (NOK 2,404 million) Net commissions and other operating income: NOK 1,532 million (NOK 1,732 million) Net income from financial investments: NOK 304 million (NOK 778 million) Operating costs: NOK 1,863 million (NOK 2,056 million) Impairment losses on loans: NOK 420 million (NOK 257 million) Total lending growth over last 12 months: 5.4% (4.7%) Growth in deposits over last 12 months: 9.8% (13.7%) Common equity tier 1 capital ratio: 13.3% (11.5%) Tier 1 capital ratio: 14.2% (12.3%)
(As at 31 December 2014 in brackets)
Financial performance - Q4 2015 The group's pre-tax profit was NOK 477 million (NOK 553 million), NOK 12 million lower than in the third quarter of 2015. The return on equity after tax for the quarter was 10.6% (11.7%) compared with 9.3% in the third quarter of 2015. The reduction in profit from the third quarter of 2015 was attributable to a number of factors. The main ones were a NOK 96 million increase in loan loss provision and further impairment losses on financial instruments, which rose by NOK 57 million compared with the third quarter of 2015. The negative effect of these items was countered by a non-recurring NOK 163 million reduction in pension costs (curtailment). The results from underlying operations were solid. Both net interest income and net commissions and other operating income increased, while the normalised growth in costs was low.
Net interest income totalled NOK 678 million (NOK 655 million) compared with NOK 649 million in the third quarter of 2015. The average interest margin (net interest income as a percentage of average total assets) was 1.40% in the fourth quarter of 2015 (1.51%) compared with 1.39% in the third quarter of 2015. Net commissions and other operating income was NOK 372 million (NOK 405 million) compared with NOK 353 million in the third quarter of 2015. Commissions from SpareBank 1 Boligkreditt and SpareBank 1 Næringskreditt amounted to NOK 53 million (NOK 90 million), NOK 2 million lower than in the third quarter of 2015. Income from estate agency was also stable. It decreased by NOK 2 million from the third quarter

SpareBank 1 SR-Bank Group Unaudited 5
of 2015 to NOK 82 million in the fourth quarter of 2015. Other commissions increased by NOK 22 million due to a rise in arrangement fees and other income. Net income from financial investments was NOK -13 million (NOK 116 million) compared with NOK 12 million in the third quarter of 2015. Income from ownership interests increased by NOK 32 million compared with the previous quarter, while dividend receipts were unchanged from the third quarter of 2015. Capital losses on financial instruments increased by NOK 57 million in the fourth quarter of 2015 due in part to losses on derivatives, including the introduction of provisions for the counterparty risk associated with derivatives in line with IFRS 13. Operating costs totalled NOK 368 million (NOK 530 million), a reduction of NOK 61 million compared with the third quarter of 2015. The reduction in operating costs compared with the third quarter of 2015 is primarily attributable to the NOK 107 million reduction in personnel costs, mainly due to reduced pension costs. The effect was partly countered by increased personnel costs in new operations, Sparebank 1 Regnskapshuset SR. Pension costs were reduced by NOK 163 million in the fourth quarter due to the non-recurring effect (curtailment) resulting from all of the employees still in a defined benefit scheme being transferred to a defined contribution scheme from 1 January 2016. The corresponding reduction in pension costs in the third quarter was NOK 63 million. Provisions of NOK 20 million were made in the fourth quarter of 2015 for ongoing restructuring costs. Other operating costs rose by NOK 46 million from the third quarter of 2015, in part due to higher ICT costs and an extraordinary VAT correction of NOK 11 million. Impairment losses on loans amounted to NOK 192 million (NOK 93 million) compared with NOK 96 million in the third quarter of 2015. NOK 51 million of this was due to collective impairment losses in the fourth quarter of 2015. The increase in impairment losses on loans in the fourth quarter of 2015 was primarily attributable to impairment losses within oil related activities and higher collective impairment losses. Collective impairment losses rose in the fourth quarter because of the increased risk in a market with lasting low oil prices and greater uncertainty. Preliminary annual result for 2015 The group's pre-tax profit for 2015 was NOK 2,146 million (NOK 2,601 million), down NOK 455 million compared with 2014. The return on equity for the year
dropped to 10.8% (14.2%) and the cost/income ratio was 42.1% at year-end 2015, compared with 41.8% in 2014. The reduction in profit can largely be attributed to net income from financial investments. 2014 included a profit of NOK 202 million from the realisation of shares in Net Holding AS, which explains part of the lower results in 2015. In 2015, a weak securities market resulted in a drop in income from financial investments, exclusive of the Nets effect, of NOK 272 million. In addition to this, impairment losses on loans and guarantees increased by NOK 163 million compared with 2014. These negative effects on the result were countered by a non-recurring reduction in pension costs (curtailment) totalling NOK 226 million linked to the transition from a defined benefit scheme to a defined contribution agreement from 1 January 2016. Underlying this is a solid result for 2015 with stable operating income and low growth in costs. Net interest income The group's net interest income amounted to NOK 2,593 million in 2015 (NOK 2,404 million). Net interest income must be viewed in the context of commissions and profit contributions from SpareBank 1 Boligkreditt and SpareBank 1 Næringskreditt. Commissions from these companies amounted to NOK 258 million in 2015 (NOK 468 million), whilst profit contributions before tax were NOK 157 million (NOK 111 million). The increase in profit contributions was primarily attributable to SpareBank 1 Boligkreditt, which recognised the positive effects of basis swaps linked to borrowing in 2015. The group's share of this was NOK 94 million. Net interest income, commissions, and profit contributions before tax increased by a total of NOK 25 million in 2015 compared with 2014.
The average net interest margin was 1.42% in 2015 compared with 1.45% in 2014.

SpareBank 1 SR-Bank Group Unaudited 6
Net commissions and other operating income Net commissions and other operating income totalled NOK 1,532 million in 2015 (NOK 1,732 million). NOK 210 million of the NOK 201 million year-on-year reduction is attributable to lower commissions from SpareBank 1 Boligkreditt and SpareBank 1 Næringskreditt. The reduction was due to the group buying back NOK 17.6 billion in loans from the mortgage companies in 2014 and 2015. Other commissions increased by 0.7% from year-end 2014. The growth primarily came from income from accounting services in SpareBank 1 Regnskapshuset SR, although management fees, insurance income and guarantee commissions also made positive contributions. Income from estate agency dropped by NOK 51 million in 2015 due to the weak housing market in the Stavanger region, especially in the second half of 2015. Net income from financial investments Net income from financial investments was NOK 304 million in 2015 (NOK 778 million). The capital losses on securities amounted to NOK 224 million (capital gains of NOK 181 million) and were primarily attributable to capital losses of NOK 275 million in the interest portfolio, of which NOK 74 million was linked to the group's trading portfolio and NOK 201 million to the group's liquidity portfolio. The latter was countered by positive effects from hedging instruments totalling NOK 91 million. The capital losses in the interest portfolio were largely due to a drop in the estimated value of covered bonds held as a liquidity reserve and the estimated value of high-interest bonds in the bank's trading portfolio. The portfolio of equities and equity certificates experienced capital losses of NOK 40 million (capital gains of NOK 232 million, inclusive of the Nets effect of NOK 202 million). Write-downs in the portfolio of SR-Investering accounted for NOK 24 million of these capital losses. The group has recognised NOK 95 million in comprehensive income (against equity) due to the sale of Visa Europe Ltd to Visa Inc. For further information, see note 17. The capital gains from interest and currency trading amounted to NOK 89 million (NOK 55 million). Included in these capital gains were costs totalling NOK 66 million (NOK 0 million) due in part to losses on derivatives, including the introduction of provisions for the counterparty risk associated with derivatives in
line with IFRS 13, while NOK 88 million in income (NOK 12 million) was due to the positive effects of basis swaps linked to borrowing, of which NOK 37 million were realised in 2015. Dividends amounted to NOK 17 million (NOK 36 million), while income from ownership interests decreased by NOK 84 million from NOK 506 million in 2014 to NOK 422 million in 2015.
The profit contribution after tax from SpareBank 1 Gruppen fell by NOK 105 million compared with 2014. This was primarily due to higher compensation payouts for natural disasters and lower profit prior years in the P&C insurance company, as well as lower financial income. The profit contribution after tax from SpareBank 1 Boligkreditt increased by NOK 42 million compared with 2014. This was due to SpareBank 1 Boligkreditt recognising the positive effects of basis swaps linked to borrowing in 2015, which totalled NOK 467 million for the company. The group's share of this was NOK 94 million. BN Bank's profit contribution after tax was NOK 37 million lower than in 2014. The reduction in profit is partly explained by extra provisions totalling almost NOK 38 million in 2015 linked to restructuring costs for the corporate market portfolio in the third quarter of 2015. The group's share of these restructuring costs was NOK 9 million. The share of the net profit from SpareBank 1 Næringskreditt increased by NOK 18 million compared with 2014. The company was established in 2014 and 2015 was the company's first full year of operations. Operating costs The group's operating costs amounted to NOK 1,863 million in 2015, a reduction of NOK 193 million (-9.4%) compared with 2014. Personnel costs were reduced by NOK 257 million (-21.4%) to NOK 945
Table 1, The share of net profit
The share of net profit after tax 31.12.15 31.12.14SpareBank 1 Gruppen 251 356SpareBank 1 Boligkreditt 91 49SpareBank 1 Næringskreditt 24 32BN Bank 29 66SpareBank 1 Kredittkort 20 2Other 7 1Total income from ownership interests 422 506

SpareBank 1 SR-Bank Group Unaudited 7
million, whilst other costs increased by NOK 64 million (7.5%) to NOK 918 million. The reduction in personnel costs was primarily attributable to a NOK 226 million reduction in pension costs due to a non-recurring reduction in costs (curtailment) resulting from all of the employees still in a defined benefit scheme being transferred to a defined contribution scheme from 1 January 2016. Provisions of NOK 20 million were made in the fourth quarter of 2015 for ongoing restructuring costs. Other costs in the group increased by NOK 64 million in the last year. A large proportion of this increase was due to ICT costs and costs associated with developing international cash management in the corporate market division, as well as further development of the automated response management system and customer care model. These are considered as priority areas to allow us to offer customers ever more relevant and timely advice. The group's normalised total growth in costs for continued business amounted to NOK 3 million (0.1%). The group's cost growth is under control and it is constantly increasing efficiency in order to keep costs at a satisfactorily low level. The group's cost/income ratio, costs measured as a percentage of income, was 42.1% (41.8%) for 2015. In 2014, the financial statements included income of NOK 202 million linked to the write-up of the shares in Nets Holding AS. Adjusted for this income, the cost/income ratio was 43.6% in 2014. Impairment losses on loans and non-performance In 2015, the group recognised net impairment losses on loans totalling NOK 420 million (NOK 257 million). This corresponds to impairments as a percentage of gross loans of 0.28% (0.20%). The increase in impairment losses on loans in 2015 was largely attributable to impairment losses within oil related activities and higher collective impairment losses. Impairments on groups of loans increased by NOK 140 million in 2015. This increase was based on continued low oil prices, higher unemployment and a weak house price trend in the group's market area, combined with uncertainty about the expected future development of local and national economic conditions. Closely monitoring customers and preventive work are important tools for maintaining this good credit
quality, and contribute to the continued moderate impairment losses on loans. Gross non-performing commitments amounted to NOK 853 million at year-end 2015 (NOK 427 million). This corresponds to 0.55% (0.30%) of gross loans. NOK 528 million of this amount was due to the bankruptcy of a single customer. The portfolio of impaired (not non-performing) loans totalled NOK 548 million (NOK 513 million). This corresponded to 0.35% (0.36%) of gross loans. Total non-performing and impaired loans at year-end 2015 came to NOK 1,401 million (NOK 940 million). In terms of gross loans, this represents an increase over the last 12 months from 0.66% to 0.90%.
The loan loss provision ratios, measured as individual write-downs as a percentage of non-performing and impaired loans, were 12% (22%) and 40% (45%) at year-end 2015. In the last 12 months, collective impairment losses have increased by a total of NOK 140 million, and the loan loss provision ratio, measured as collective impairment losses as a percentage of gross loans, inclusive of the volume sold to SpareBank 1 Boligkreditt and SpareBank 1 Næringskreditt, increased to 0.28% at year-end 2015 (0.22%).

SpareBank 1 SR-Bank Group Unaudited 8
Loans to and deposits from customers Gross loans at year-end 2015 amounted to NOK 155.2 billion (NOK 141.6 billion). Including loans totalling NOK 28.7 billion (NOK 32.9 billion) sold to SpareBank 1 Boligkreditt and SpareBank 1 Næringskreditt, gross loans amounted to NOK 183.9 billion at year-end 2015 (NOK 174.5 billion). Gross lending growth over the last 12 months was 5.4% (4.7%). The growth was higher in the first half of 2015. The gross lending growth in the second half of 2015 was only 1.4%, and the effect of exchange rate fluctuations accounted for 0.8%. The effect of exchange rate fluctuations accounted for NOK 1.7 billion (1.0%) of the NOK 9.4 billion growth in gross loans over the last 12 months. Loans to the retail market accounted for 62.7% (63.0%) of total loans (including loans sold to SpareBank 1 Boligkreditt and SpareBank 1 Næringskreditt) at year-end 2015.
The group's total loan exposure of NOK 183.9 billion included a majority of commitments with a probability of default of less than 0.5%. These commitments represented 59% of the portfolio. The total lending portfolio primarily consisted of commitments of less than NOK 10 million. These accounted for around 68% of loan exposure and approximately 98% of customers. 18.7% of the total loan exposure was to customers who had loans in excess of NOK 100 million. All of the commitments involving loan exposure of more than NOK 100 million are corporate market commitments and the credit quality in this portfolio was better than in the rest of the corporate market portfolio.
1 The interest on intercompany receivables for the retail market division and the corporate market division is determined on the basis of expected observable market interest rates (NIBOR) plus expected additional costs in connection with the group's long-term funding (credit
Deposits from customers rose by 9.8% in 2015 (13.7%) to NOK 89.4 billion (NOK 81.5 billion). Deposits from the corporate market and public sector accounted for 52.9% (52.5%) of the group's customer deposits at year-end 2015. In addition to good growth in ordinary customer deposits, the group also increased the capital under management in alternative investment products from NOK 15.5 billion to NOK 17.1 billion at year-end 2015. This management is primarily performed by SR-Forvaltning AS and ODIN Forvaltning AS. The deposit coverage ratio at year-end 2015, measured as deposits as a percentage of gross loans, was 57.6% (57.5%). The group continued its policy of maintaining a high proportion of long-term funding in 2015, and the Financial Supervisory Authority of Norway's Funding Indicator 1 (ratio of illiquid assets financed by debt with a duration of more than 1 year) is 108.1% for the parent bank and 109.8% on a consolidated basis. Business areas SpareBank 1 SR-Bank's financial management is based on different business areas that are defined on the basis of their form of distribution, products and customers. The reporting format is based on the risk and return profile of the assets and is split into the retail market (including the self-employed), corporate market, capital market and subsidiaries of significant importance. Retail market division1 The retail market division's contribution before impairment losses on loans amounted to NOK 1,214 million in 2015. The result was NOK 156 million lower than in 2014 due to lower net interest income. Commissions increased by 6%. The growth was greatest within insurance. The growth in digital channels has continued. Two out of three digital logins are now made via the mobile bank and the number of sales in digital channels rose by 70% compared with 2014. The strongest growth was seen in personal insurance and savings products. The purchase of mCASH and further digital ventures through the SpareBank 1 alliance will increase traffic and transaction volumes even more going forward.
premium). Differences between the group's actual funding costs and the interest applied on intercompany receivables are eliminated at the group level.

SpareBank 1 SR-Bank Group Unaudited 9
Total lending growth in the retail market increased by 4.8% in the retail market in 2015, while the volume of deposits grew by 5.0%. The growth in lending was strongest in Hordaland with greater market shares and good growth due to the group’s. focus in this market. The growth in Agder was good, while in Rogaland it was affected by strong competition in a market with weaker growth. The quality of the retail market portfolio is considered to be very good with a low risk of losses. The proportion of loan exposure (including the portfolio in SpareBank 1 Boligkreditt) within a loan-to-collateral value ratio of 85% amounted to 89.6% (91.3%) at year-end 2015. The IRB risk weighting for home mortgages was 22.8% (16.3%) at year-end 2015, which reflects a solid, stable portfolio. The risk weightings increased in the first quarter due to the Financial Supervisory Authority of Norway's stricter rules for home mortgage models. Impairment losses on loans remain low and the percentage of the bank's customers with payment remarks on their records is still small. Proportion of non-performing commitments over 30 days was 0.27% of total lending at year-end 2015 (0.29%). Corporate market division 1 2 The corporate market division's contribution before impairment losses on loans was NOK 1,086 million in 2015, NOK 4 million higher than in 2014. The division's lending increased by 7.2% in 2015. The increase in volume due to exchange rate fluctuations amounted to NOK 1.2 billion. Underlying growth in the last 12 months was 4.9%. The growth occurred in both the existing customer base and through the inflow of new customers, especially in focus areas in Hordaland. The division has not lost any key customers in the last 12 months. Most of the growth largely came in the first half of 2015. The second half of the year saw negative growth of 0.2% and the underlying weight corrected for the effect of exchange rates was -2.4%. The division has a strong focus on growth in deposits and has in the last 12 months enjoyed 16.8% growth here. The quality of the corporate market portfolio is considered to be good. The average probability of default has developed positively over time, largely due to the stronger risk profile of the existing customer
2 The capital market division serves customers throughout the group and customer income is now recognised, in its entirety, in the business area to which the customer belongs.
base. The proportion of commitments with a probability of default of less than 2.5% was 76.1% (73.3%) of the portfolio at year-end 2015. The property sector portfolio represents the group's largest concentration in a single sector and accounted for 15.0% (15.6%) of total loan exposure, including retail customers. A large portion of this portfolio consisted of financing commercial properties for leasing. The portfolio is characterised by long-term leases and financially solid tenants. Net individual impairment losses of NOK 242 million were recognised in 2015 compared with NOK 164 million in individual impairment losses in 2014. Collective impairment losses were increased by NOK 130 million during 2015 due to the higher risk in a market with lasting low oil prices and greater uncertainty. The division's ordinary pre-tax profit (after losses) was NOK 142 million lower than in 2014. Balanced, profitable volume growth, good customer relations, and a well-developed range of products are priority areas for the division, as is closely monitoring the development of risk in the portfolio. Capital market division2 Securities activities are organised under the SR-Bank Markets brand and include customer and own account trading in fixed income instruments, foreign exchange and equities, analysis and corporate finance services. SR-Bank Markets's pre-tax profit was NOK 2 million in 2015, NOK 17 million lower than in 2014. The income generated is recognised as income in the business areas to which the customers are assigned, primarily the corporate market division. Prior to the allocation of customer income to other business areas, SR-Bank Markets had achieved operating income of NOK 111 million in 2015. This represents a decrease of NOK 32 million from 2014 and is primarily attributable to a drop in the value of the bank's bond portfolio, as well as less income from interest and currency instruments. The pre-tax profit before the allocation of customer income amounted to NOK 31 million in 2015, a reduction of NOK 39 million from 2014. The bulk of this income came from customer trading in fixed income and foreign exchange instruments. The

SpareBank 1 SR-Bank Group Unaudited 10
value of the bank's trading portfolio dropped by NOK 74 million in 2015. At year-end 2015, this portfolio was valued at NOK 410 million. Income from sales of equities and bonds was relatively stable in 2015.
Subsidiaries and associated companies EiendomsMegler 1 SR-Eiendom AS The company's pre-tax profit amounted to NOK 29.6 million in 2015 (NOK 55.5 million). The substantial drop in the result reflects the weak housing market in the Stavanger region in 2015, which saw a lower number of sales, especially in the second half of 2015. In 2015, 6,551 (7,540) properties were sold with a total value of around NOK 20 billion. The supply of new assignments was satisfactory given the market situation, but overall it was around 12% lower than in the year before. There have been and still are, significant differences in the regional markets, both with respect to price and turnover times. The housing market in Bergen was very good, with turnover times of fewer than 20 days and a price rise of 6.0% in 2015. The housing market in the Stavanger region in the second half of 2015 was impacted by downsizing and a fall in the level of activity within the oil industry. Prices have fallen 5.3% in the last 12 months and a continued weak downwards trend is expected going forward. The turnover time for used housing is now almost 60 days. The housing market in Kristiansand has been significantly energised in the last 12 months after many years of stagnation. This good development has continued and prices rose by around 3.6% in 2015. The turnover time is now around 60 days. The overall market saw growth in both Hordaland and Agder, but the opposite was the case in Rogaland. Significantly fewer homes were sold here in 2015 than in 2014. The supply of new homes is good, but turnover figures have been lower than wished for. The new homes market is sensitive to economic cycles and the situation in oil-oriented activities is having a negative impact on sales of new homes, especially in the Stavanger region. The market for new homes is expected to remain difficult in Rogaland in the coming period. There was a good supply of commercial property for both lease and sale. The vacancy rate for office premises has risen significantly in the last 12 months
in the Stavanger region and a steadily increasing number of tenants are looking for premises suitable for the expected level of activity going forward. The levels of activity in Bergen are still very good within both the sale and leasing of commercial properties and the company has established itself as a leading player in commercial estate agency in the Bergen region. The company expects continued good activity in the housing market in both Agder and Hordaland, but here too there is some uncertainty concerning developments since both of these counties are home to significant activities within the oil sector. The housing market is Rogaland is already being impacted by weak price growth and the poorer development of the overall market. This trend is expected to continue in the first half of 2016, with a gradual improvement during the second half of the year. SpareBank 1 SR-Finans AS The company's main products are lease financing for the business sector and car loans for retail customers. SpareBank 1 SR-Finans is the leading leasing company in Rogaland with total assets of NOK 6.9 billion. SpareBank 1 SR-Finans achieved a profit before losses of NOK 190.1 million in 2015 (NOK 155.1 million). The improvement in the result is primarily attributable to higher net interest income due to both a higher lending volume and higher interest margin compared with 2014. The company once again maintained its low cost/income ratio in 2015 and continuously focuses on efficiency and digitalisation. Net losses amounted to NOK 39.7 million in 2015 (NOK 9.2 million). This is a substantial increase compared with 2014 and is due to the fact that NOK 20.2 million was recognised in individual impairment losses in 2014, while individual impairment losses have increased by NOK 9.8 million in 2015. This increases the isolated losses by NOK 30.0 million in 2015. Given the uncertainty that characterised the market in 2015, losses are regarded as being at an acceptable level. The pre-tax profit was NOK 150.4 million in 2015 (NOK 145.9 million). Net lending has increased by 1.9% in the last 12 months and at year-end 2015 it amounted to NOK 6,903 million (NOK 6,771 million). 7,482 new contracts were established in 2015 (6,907 contracts) with a total volume of NOK 2,444 million (NOK 2,569 million).

SpareBank 1 SR-Bank Group Unaudited 11
In 2015, the business sector in the company's market area has been characterised by falls in oil prices, cost cutting and downsizing. Because of this, lower is growth is expected within lease financing for the corporate market going forward. Continued growth is expected in car loans for retail customers. SpareBank 1 Regnskapshuset SR AS The company was established in the first quarter of 2015 in connection with the purchase of the Rogaland's branch of SpareBank 1 Regnskapshuset Østlandet AS, which comprised three accounting offices in Stavanger, Sandnes and Ålgård. ODB Regnskap AS in Sotra was acquired at the end of the second quarter of 2015 and in the fourth quarter an agreement was signed to acquire Advis AS, which has branches in Stavanger and Haugesund. The company's acquisitions in 2015 have provided it with a solid foothold in Southern and Western Norway, and it has built up a good foundation for further growth in the bank's market area. At the end of 2015, the company had 50 employees. The accounting firm venture will enable the group to satisfy customers' total needs better by being able to offer customers in the region accounting services and advice. The company has drawn up an aggressive growth strategy for the coming 3-year period. This will be realised through both organic growth and further acquisitions. The company will focus on developing new advice services and will, by developing its expertise well and utilising relationships and its network, become Southern and Western Norway's leading actor in the sector. The establishment of the company was well received in the market. SpareBank 1 Regnskapshuset achieved a pre-tax profit of NOK 0.6 million in 2015, which includes NOK 0.8 million in depreciation of intangible assets. The company's result was in line with the expectations for its start-up year. SR-Boligkreditt AS SR-Boligkreditt is a wholly owned subsidiary and was established in the second quarter of 2015. The purpose of the company is to purchase home mortgages from SpareBank 1 SR-Bank and it funds this by issuing covered bonds. SR-Boligkreditt enables SpareBank 1 SR-Bank to diversify and optimise its funding. Moody's has given SR-Boligkreditt its best rating, Aaa. The company issued its first bond in June 2015 and it has, as at year-end 2015, two covered bonds in the Norwegian market worth a combined NOK 4.6 billion
and one international covered bond worth EUR 500 million. SR-Boligkreditt had purchased loans equivalent to NOK 9.9 billion from SpareBank 1 SR-Bank by year-end 2015. In 2015, SR-Boligkreditt achieved a pre-tax profit of NOK 39.3 million, which is in line with the company's business plan. SpareBank 1 Gruppen AS SpareBank 1 Gruppen is a holding company that develops and delivers common IT/mobile solutions, brands and marketing concepts, business concepts, products and services, expertise, analyses, processes, best practice solutions and purchases for the banks in the SpareBank 1 Alliance. Its subsidiaries produce, deliver and distribute SpareBank 1 Gruppen products within P&C insurance, life insurance, fund management, factoring, debt collection and long-term monitoring. SpareBank 1 Gruppen achieved a net profit of NOK 1,287 million in 2015 (NOK 1,849 million). The lower profit in 2015 was primarily due to higher compensation payouts for natural disasters and lower profit prior years in the P&C insurance company, as well as lower financial income. SpareBank 1 SR-Bank's stake in SpareBank 1 Gruppen was stable at 19.5% at year-end 2015. SpareBank 1 Boligkreditt AS and SpareBank 1 Næringskreditt AS SpareBank 1 Boligkreditt and SpareBank 1 Næringskreditt are licensed mortgage companies that issue covered bonds secured by home mortgage loan or commercial real estate portfolios sold by the owner banks. The companies are owned by the savings banks that make up the SpareBank 1 Alliance and help ensure the owner banks have access to stable, long-term funding at competitive rates. SpareBank 1 Boligkreditt's total lending volume at year-end 2015 amounted to NOK 166.2 billion, NOK 28.2 billion (NOK 32.3 billion) of which were home mortgages bought from SpareBank 1 SR-Bank. The bank owned a 16.7% stake in the company at year-end 2015. This is normally updated at the end of each year in line with the volume sold. SpareBank 1 Næringskreditt's total lending volume at year-end 2015 amounted to NOK 14.4 billion, NOK 0.5 billion (NOK 0.6 billion) of which were loans bought

SpareBank 1 SR-Bank Group Unaudited 12
from SpareBank 1 SR-Bank. The bank owned a 26.8% stake in the company. Funding
SpareBank 1 SR-Bank's access to market funding has been very good. The risk premium the bank pays above the money market rate for senior unsecured debt increased during the second half of 2015. This had an insignificant impact on SpareBank 1 SR-Bank's funding costs. SpareBank 1 SR-Bank had good liquidity at year-end 2015 and believes it will continue to have good access to long-term funding at competitive prices. The group strives to achieve an even maturity structure for funding and believes it is important to have good relations with Norwegian and international investors and banks. The liquidity buffer3 amounted to NOK 21.3 billion at year-end 2015. NOK 12.6 billion of the bank's external funding will fall due in the next 12 months. In addition to the liquidity buffer, the bank has NOK 24.3 billion in home mortgages ready for covered bond funding. Capital adequacy At year-end 2015, the common equity tier 1 capital ratio was 13.3%, up from 11.5% at the same time in 2014. The tier 1 capital ratio was 14.2% (12.3%), while the total capital ratio rose from 14.5% to 16.7%.
All capital adequacy figures are based on the transitional rule (Basel I floor) that states that the capital requirement for using internal methods cannot be less than 80% of the capital requirement according to the Basel I regulations.
3 Liquidity buffer: cash, short-term investments, and drawing rights in Norges Bank (bonds including covered bonds).
The common equity tier 1 capital ratio requirement, inclusive of the countercyclical capital buffer, is 11.0% and the capital ratio requirement is 14.5%. SpareBank 1 SR-Bank therefore fulfils the requirements by a good margin. There is a countercyclical capital buffer requirement in Norway in the range of 0-2.5% in the form of common equity tier 1 capital. On 18 June 2015, on the advice of Norges Bank, the Ministry of Finance set the buffer at 1 percentage point from 30 June 2015. At the same time, the Ministry of Finance decided to increase the buffer requirement to 1.5 percentage points from 30 June 2016. The formal requirement for common equity tier 1 capital will then be 11.5% for non-systemically important financial institutions and 13.5% for systemically important financial institutions. On 12 May 2014, the Ministry of Finance issued regulations concerning systemically important financial institutions (SIFI). Institutions with total assets of at least 10% of Mainland Norway's GDP, or at least a 5% share of the market for loans, will be covered by this definition. Upon implementation, DNB, Nordea Bank Norway and Kommunalbanken Norway were defined as systemically important. The three SIFI banks will thus be subject to a special capital buffer requirement from 1 July 2015. From 1 July 2016, when the new capital requirements have been fully implemented, the systemically important institutions must satisfy a minimum requirement for their common equity tier 1 capital ratio of 12%, while the minimum requirement for other institutions will be 10%. The countercyclical capital buffer comes on top of this. SpareBank 1 SR-Bank is close to the SIFI requirement concerning market share and takes account of this in its capital planning. In February 2015, SpareBank 1 SR-Bank received permission to use Advanced IRB to calculate regulatory capital requirements for credit risk for the corporate market. Based on this permission the bank uses internal models for calculating the necessary requirements for compulsory savings. This in turn means that the regulatory capital requirements will better suit the actual credit risk the bank is bearing in its overall loan portfolio. The Financial Supervisory Authority of Norway will set an individual Pillar 2 premium for Norwegian banks in
Assuming deposits and lending remain unchanged, and no new borrowing during the period.

SpareBank 1 SR-Bank Group Unaudited 13
2016. The Pillar 2 premium is intended to ensure that the banks have adequate capital to cover the risk associated with operations, including risks not covered by the regulatory minimum requirement. The Pillar 2 premium will be implemented as an addition to the regulatory minimum requirement and include buffers for the individual banks. The Financial Supervisory Authority of Norway has yet to communicate the size of the Pillar 2 premium for SpareBank 1 SR-Bank. SpareBank 1 SR-Bank's common equity tier 1 capital target for year-end 2016 is minimum 14.0% and for 2017 it is 14.5%. These targets will be achieved through good profitability, moderate dividends, zero growth in the risk-weighted balance sheet and runoff of BN Banks’s corporate portfolio. The bank's shares
The share price for the bank's shares (SRBANK) was NOK 39.30 at year-end 2015. This represents a decrease of 25.1% since year-end 2014. The main Oslo Stock Exchange index rose by 5.9% in the same period. 3.4% (7.7%) of outstanding SRBANK shares were traded in the fourth quarter of 2015. There were 10,153 (10,422) shareholders of SRBANK at year-end 2015. The proportion owned by foreign companies and individuals was 17.3%, whilst 49.8% were owned by residents of Rogaland, the Agder counties and Hordaland. The 20 largest shareholders owned a combined 63.9% of the shares. The bank holds 25,398 treasury shares, while group employees owned 1.8%. The table below shows the 20 largest shareholders as at 31 December 2015:
Accounting policies Please refer to note 1 for a description of the accounting policies applied in the parent company's and consolidated financial statements. The same accounting policies are applied in interim and annual financial statements. Events after the balance sheet date No material events have been registered after 31 December 2015 that affect the interim financial statements as prepared. Future prospects Oil prices fell heavily in the second half of 2014 and continued to drop in 2015 from USD 55 a barrel to USD 36 a barrel by year-end. The drop in oil prices has resulted in greater uncertainty, especially in the petroleum sector. Oil investments decreased by 12% in 2015 compared with 2014. A further reduction of around 12-14% in relation to 2015 is expected in the petroleum sector in 2016. Both oil companies and the supplier industry are in the process of rationalising operations and reducing costs. The risk of lower growth in the Norwegian economy has consequently increased. There are now clear signs of lower levels of activity in the Stavanger region in the building and construction sector, as well as in some commodity segments. The unemployment rate in Rogaland was 4.9% at the end of January 2016. This is higher than the rate of
Table 2, 20 largest shareholders Number of shares (1,000) %
Sparebankstiftelsen SR-Bank 72.419 28,3 %Gjensidige Forsikring ASA 26.808 10,5 %State Street Bank and Trust Co, U.S.A. 9.671 3,8 %Vpf Nordea Norge Verdi 8.268 3,2 %SpareBank 1-stiftinga Kvinnherad 6.227 2,4 %Wimoh Invest AS 5.761 2,3 %Odin Norge 5.382 2,1 %Pareto Aksje Norge 3.944 1,5 %Danske Invest Norske Instit. II 3.028 1,2 %State Street Bank and Trust Co, U.S.A. 2.990 1,2 %Clipper AS 2.565 1,0 %The Bank of New York Mellon, U.S.A. 2.542 1,0 %State Street Bank and Trust Co, U.S.A. 2.182 0,9 %State Street Bank and Trust Co, U.S.A. 1.890 0,7 %Danske Invest Norske Aksjer Inst. 1.675 0,7 %Vpf Nordea Kapital 1.653 0,6 %Pareto AS 1.641 0,6 %Vpf Nordea Avkastning 1.630 0,6 %Westco 1.578 0,6 %The Northern Trust Co, U.K. 1.512 0,6 %Total 20 largest 163.367 63,9 %

SpareBank 1 SR-Bank Group Unaudited 14
2.8% at the end of January 2015. The unemployment rate was somewhat higher than the national average, which was 3.4%. The unemployment rate in Agder was 4.4% (3.5%) at the end of January 2016, while the unemployment rate in Hordaland was 3.5% (2.6%) in January 2016. The unemployment rate in our market area, and particular in Rogaland, is expected to increase further during 2016. The banking market is highly competitive, especially with respect to new home mortgage customers. The group therefore lowered home mortgage rates on three occasions in 2015. The negative effect on the group's lending margin will partly be counteracted by the terms for deposits being adjusted at the same time, as well as falling costs for the group's external funding. Continued strong competition for home mortgage customers is expected going forward. In the last year, the Stavanger region has experienced a weaker house price trend than the rest of the country with a drop in prices of 5.3% compared with the national average of a 7.2% rise in prices. The volume of sales is also dropping and 15.9% fewer homes were sold than in 2014. This development must be seen in the context of house prices having grown much more in recent years in Stavanger and Rogaland than in the rest of the country. In the Kristiansand region, there has been a 3.6% rise in prices over the last 12 months, while the Bergen region has experienced a rise in prices of 6.0%. A higher degree of uncertainty about how the economy will develop will
contribute to dampening the demand for loans, while lower interest rates have the opposite effect. Non-performing commitments are expected to rise somewhat in 2016. The level of impairment losses is expected to be around NOK 500-700 million in 2016. The board would like to stress that a certain level of uncertainty is associated with assessments of future conditions. SpareBank 1 SR-Bank is a solid, profitable group, but must, like other banks, continue to strengthen its solidity in line with the authorities' new capital requirements. Because of its good earnings from a business model with breadth and efficient operations, the group well positioned to implement the necessary build-up of capital, while ensuring strong competitiveness. As a consequence of technological developments, changes in customer behaviour and the lower activity in the region, the group will implement further cost-reducing measures that ensure its competitiveness. The group will focus on strict capital management in order to achieve its target of minimum 14% for common equity tier 1 capital by year-end 2016. This also entails lower lending growth, a stronger focus on risk pricing and a moderate level of dividends.
Stavanger, 3 February 2016 The Board of Directors of SpareBank 1 SR-Bank ASA

SpareBank 1 SR-Bank Group Unaudited 15
Income statement
Note
Q4 2014 Q4 201501.01.14 -
31.12.1401.01.15 -
31.12.15 Income statement (MNOK)01.01.15 -
31.12.1501.01.14 -
31.12.14 Q4 2015 Q4 2014
1.530 1.285 5.918 5.399 Interest income 5.752 6.137 1.408 1.588932 702 3.736 3.113 Interest expense 3.159 3.733 730 933
598 583 2.182 2.286 Net interest income 2.593 2.404 678 655
311 271 1.319 1.126 Commission income * 1.605 1.804 388 42318 16 73 70 Commission expenses 78 78 17 19
1 2 6 6 Other operating income * 5 6 1 1
294 257 1.252 1.062 Net commission and other income 1.532 1.732 372 405
0 0 24 15 Dividend income 17 36 1 130 0 473 530 Income from investment in associates 422 506 110 138
-55 -139 125 -173 Net gains/losses on financial instruments 13 -135 236 -124 -23
-25 -139 622 372 Net income on financial investments 304 778 -13 116
867 701 4.056 3.720 Total income 4.429 4.914 1.037 1.176
226 56 900 669 Personnel expenses 14 945 1.202 114 308114 114 412 422 Administrative expenses 480 468 125 12864 80 244 287 Other operating costs 438 386 129 94
404 250 1.556 1.378 Total operating costs 1.863 2.056 368 530
463 451 2.500 2.342 Operating profit before impairment losses 2.566 2.858 669 646
86 167 248 380 Impairment losses on loans and guarantees 2, 3 and 4 420 257 192 93
377 284 2.252 1.962 Pre-tax profit 12 2.146 2.601 477 553
94 24 446 340 Tax expense 400 506 35 105
283 260 1.806 1.622 Profit after tax 1.746 2.095 442 448
Other comprehensive income
-149 23 -415 187 Unrecognised actuarial gains and losses 200 -444 28 -16640 -6 112 -46 Deferred tax concerning changed estimates/pension plan changes -50 120 -7 45
-109 17 -303 141 Total items not reclassified through profit or loss 150 -324 21 -1210 -17 0 -21 Tax change actuarial gains/losses -21 0 0 00 95 0 95 Change in value of financial assets available for sale 95 0 95 00 0 0 0 Share of profit associated companies and joint ventures 32 5 1 -110 78 0 74 Total items reclassified through profit or loss 106 5 96 -11
-109 95 -303 215 Other comprehensive income 256 -319 117 -132
174 355 1.503 1.837 Total comprehensive income 2.002 1.776 559 316
Earnings per share (group) 6,83 8,20 1,73 1,75
* From and including the first quarter of 2015, income from real estate sales has been transferred from other operating income to commissions. The historicalfigures have been correspondingly restated.
Parent bank Group

SpareBank 1 SR-Bank Group Unaudited 16
Balance sheet
Note
31.12.14 31.12.15 Balance sheet (MNOK) 31.12.15 31.12.14
1.847 931 Cash and balances with central banks 931 1.8478.117 8.813 Balances with credit institutions 2.984 2.222
134.158 137.506 Loans to customers 3, 8 154.357 140.92015.248 20.314 Certificates, bonds and other fixed-income securities 19.533 15.261
7.344 6.133 Financial derivatives 10 6.135 7.340477 300 Shares, ownership stakes and other securities 17 441 626
22 168 Business available for sale 168 223.250 3.172 Investment in associates 4.792 4.7271.226 2.698 Investment in subsidiaries 0 01.605 2.307 Other assets 5 2.708 1.961
173.294 182.342 Total assets 12 192.049 174.926
6.145 6.005 Balances with credit institutions 5.296 6.13981.723 89.632 Deposits from customers 7 89.444 81.48963.253 63.338 Listed debt securities 11 71.979 63.253
3.317 2.879 Financial derivatives 10 2.786 3.3172.095 1.895 Other liabilities 6 2.171 2.3612.964 3.459 Subordinated loan capital 11 3.459 2.964
159.497 167.208 Total liabilities 175.135 159.523
6.394 6.394 Share capital 6.394 6.3941.587 1.587 Premium reserve 1.587 1.587
512 384 Proposed dividend 384 51259 163 Fund for unrealised gains 163 59
5.245 6.606 Other equity 8.386 6.851
13.797 15.134 Total equity 16.914 15.403
173.294 182.342 Total liabilities and equity 12 192.049 174.926
Parent bank Group

SpareBank 1 SR-Bank Group Unaudited 17
Statement of changes in equity
Reserve
Share- Premium Other for unrealised Total
SpareBank 1 SR-Bank Group (Amounts in NOK million) capital reserve equity gains equity
Equity as of 31.12.2013 6.394 1.587 5.913 162 14.056
Profit after tax 2.198 -103 2.095
Unrecognised actuarial gains and losses after tax -324 -324
Share of profit associated companies and joint ventures 5 5
Total items not reclassified through profit or loss 1.879 -103 1.776
Adjusted equity accosiates -19 -19
Dividend 2013, resolved in 2014 -409 -409
Purchase/sale of own shares -1 -1
Items reclassified through profit or loss 0 0 -410 0 -410
Equity as of 31.12.2014 6.394 1.587 7.363 59 15.403
Profit after tax 1.737 9 1.746
Unrecognised actuarial gains and losses after tax 129 129
Change in value of financial assets available for sale 95 95
Share of profit associated companies and joint ventures 32 32
Total items not reclassified through profit or loss 1.898 104 2.002
Adjusted equity accosiates 9 9
Dividend 2014, resolved in 2015 -512 -512
Purchase/sale of own shares 12 12
Items reclassified through profit or loss 0 0 -500 0 -500
Equity as of 31.12.2015 6.394 1.587 8.770 163 16.914
SpareBank 1 SR-Bank Group Unaudited 18
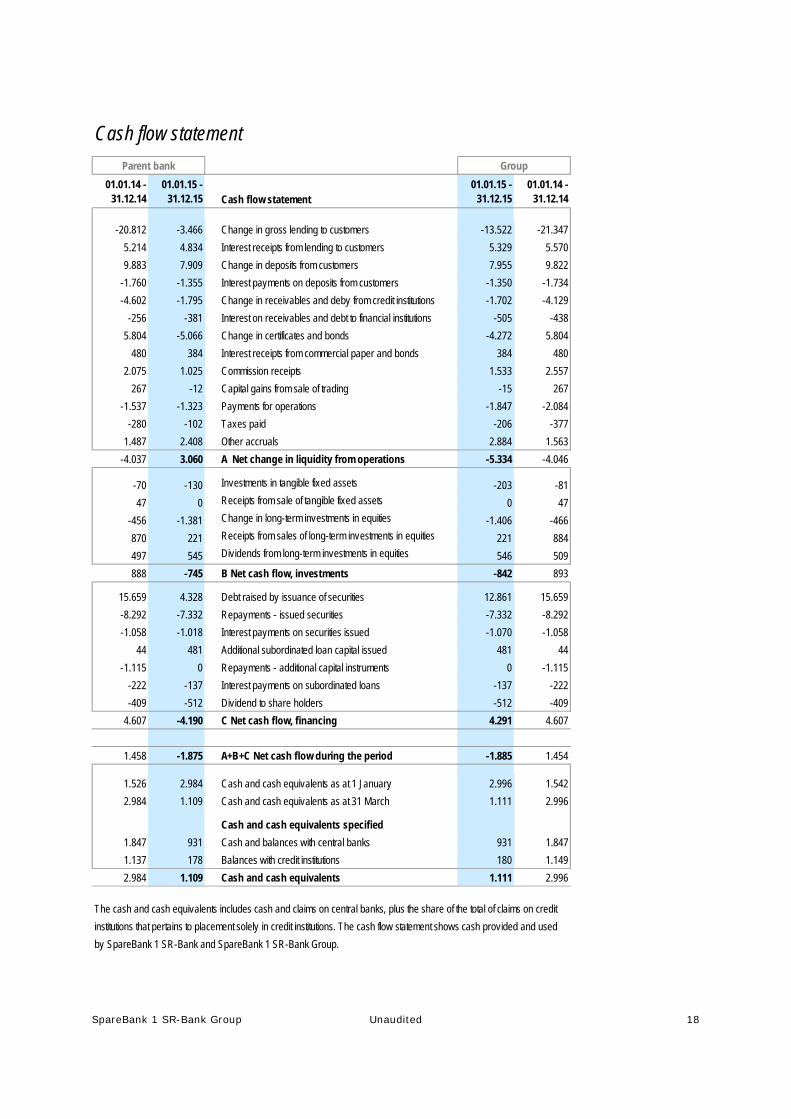
Cash flow statement
01.01.14 - 31.12.14
01.01.15 - 31.12.15 Cash flow statement
01.01.15 - 31.12.15
01.01.14 - 31.12.14
-20.812 -3.466 Change in gross lending to customers -13.522 -21.347
5.214 4.834 Interest receipts from lending to customers 5.329 5.570
9.883 7.909 Change in deposits from customers 7.955 9.822
-1.760 -1.355 Interest payments on deposits from customers -1.350 -1.734
-4.602 -1.795 Change in receivables and deby from credit institutions -1.702 -4.129
-256 -381 Interest on receivables and debt to financial institutions -505 -438
5.804 -5.066 Change in certificates and bonds -4.272 5.804
480 384 Interest receipts from commercial paper and bonds 384 480
2.075 1.025 Commission receipts 1.533 2.557
267 -12 Capital gains from sale of trading -15 267
-1.537 -1.323 Payments for operations -1.847 -2.084
-280 -102 Taxes paid -206 -377
1.487 2.408 Other accruals 2.884 1.563
-4.037 3.060 A Net change in liquidity from operations -5.334 -4.046
-70 -130 Investments in tangible fixed assets -203 -81
47 0 Receipts from sale of tangible fixed assets 0 47
-456 -1.381 Change in long-term investments in equities -1.406 -466
870 221 Receipts from sales of long-term investments in equities 221 884
497 545 Dividends from long-term investments in equities 546 509
888 -745 B Net cash flow, investments -842 893
15.659 4.328 Debt raised by issuance of securities 12.861 15.659
-8.292 -7.332 Repayments - issued securities -7.332 -8.292
-1.058 -1.018 Interest payments on securities issued -1.070 -1.058
44 481 Additional subordinated loan capital issued 481 44
-1.115 0 Repayments - additional capital instruments 0 -1.115
-222 -137 Interest payments on subordinated loans -137 -222
-409 -512 Dividend to share holders -512 -409
4.607 -4.190 C Net cash flow, financing 4.291 4.607
1.458 -1.875 A+B+C Net cash flow during the period -1.885 1.454
1.526 2.984 Cash and cash equivalents as at 1 January 2.996 1.542
2.984 1.109 Cash and cash equivalents as at 31 March 1.111 2.996
Cash and cash equivalents specified
1.847 931 Cash and balances with central banks 931 1.847
1.137 178 Balances with credit institutions 180 1.149
2.984 1.109 Cash and cash equivalents 1.111 2.996
The cash and cash equivalents includes cash and claims on central banks, plus the share of the total of claims on credit
institutions that pertains to placement solely in credit institutions. The cash flow statement shows cash provided and used
by SpareBank 1 SR-Bank and SpareBank 1 SR-Bank Group.
Parent bank Group

SpareBank 1 SR-Bank Group Unaudited 19
Notes to the financial statements(in MNOK)
Note 1 Accounting policies
1.1 Basis of preparationThese interim financial statements for SpareBank 1 SR-Bank ASA cover the period 1 January - 31 December 2015. The interim financial statements were
prepared in accordance with IAS 34 Interim Financial Reporting. The interim financial statements are unaudited. These interim financial statements
were prepared in accordance with the applicable IFRS standards and IFRIC interpretations.
The interim financial statements do not include all the information required for full annual financial statements and should be read in conjunction with the
annual financial statements for 2014.
Effects of applying IFRIC 21 for reporting in the fourth quarter of 2015
IFRIC 21 Levies regulates the recognition of obligations to pay levies that fall within the scope of IAS 37 Provisions. The interpretation deals with what
events trigger levies being recognised as a liability.
Following the introduction of the standard, there has been some debate about whether or not the annual charge for the Norwegian Banks Guarantee
Fund for 2015 should have been charged as a cost in its entirety in the first quarter of 2015. The charge for the Norwegian Banks Guarantee Fund is
normally based on the average guaranteed deposit and average basis for calculation for previous quarters. The extent to which a withdrawal from the
scheme would entail a repayment of any overpaid charge has not been regulated. The practice has been a pro-rata charge upon enrolment. The
practice and the principle of equal treatment indicate pro-rata upon disenrollment. The Ministry of Finance will determine this through individual decisions.
This is of significance when recognising the charge in the accounts. The Financial Supervisory Authority of Norway has in its circular entitled
"Finanstilsynets kontroll med finansiell rapportering i 2015" of 19 November 2015 concluded that the charge for the guarantee fund must be recognised as
a cost, in its entirety, in the first quarter every year and it expects banks to change their practices from the first quarter of 2016. SpareBank 1 SR-Bank
continued its previous practice in the fourth quarter of periodising the charge on a monthly basis and the cost amounted to NOK 63 million as at the fourth
quarter of 2015.
New standards and interpretations that have not been adopted yet
A number of new standards, amendments to standards and interpretations will be compulsory in future annual financial statements. Among those the
group has chosen not to apply early are the two most important standards, IFRS 9 Financial Instruments and IFRS 15 Revenue from Contracts with
Customers. The group is currently assessing the effects of these standards.
There are no other standards or interpretations which are not currently in effect and would be expected to have a material effect on the consolidated
financial statements.
1.2 Critical accounting estimates and judgementsThe preparation of the consolidated financial statements entails the group executive management making estimates, judgements and assumptions that
affect the effect of the application of the accounting policies and thus the amounts recognised for assets, liabilities, income and costs. Note 3 of the annual
financial statements for 2014 explains in more detail the use of critical estimates and judgements when applying the accounting policies.

SpareBank 1 SR-Bank Group Unaudited 20
Note 2 Impairment losses on loans and guarantees recognised in the income statement
01.01.14 - 31.12.14
01.01.15 - 31.12.15
01.01.15 - 31.12.15
01.01.14 - 31.12.14
-103 -14 Change in individual impairment losses provisions for the period -4 -12469 135 Change in collective impairment loss provisions for the period 140 7511 7 Amortised cost 7 11
217 71 Actual loan losses on commitments for which provisions have been made 78 22860 201 Actual loan losses on commitments for which no provision has been made 223 74
0 1 Change in assets taken over for the period 1 0-6 -21 Recoveries on commitments previously written-off -25 -7
248 380 The period's net losses / (reversals) on loans and advances 420 257
Note 3 Impairment losses on loans and guarantees recognised in the balance sheet
31.12.14 31.12.15 31.12.15 31.12.14
405 302 Provisions for Individual impairment losses at start of period 322 44642 65 Increases in previous provisions for individual impairment losses 65 42
-35 -102 Reversal of provisions from previous periods -107 -54109 96 New provisions for individual impairment losses 118 118
-2 -2 Amortised cost -2 -2
-217 -71 -78 -228
302 288 Provisions for individual impairment losses at period end 318 322277 272 Net losses 301 302
Note 4 Non-performing and impaired loans
31.12.14 31.12.15 31.12.15 31.12.14
Non-performing loans and advances395 829 Gross non-performing loans above 90 days 853 427
91 98 Provisions for Individual impairment losses 100 93
304 731 Net non-performing loans and advances 753 334
23 % 12 % Loan loss provision ratio 12 % 22 %
Other problem commitments481 493 Problem commitments 548 513211 190 Provisions for Individual impairment losses 218 229
270 303 Net other problem commitments 330 284
44 % 39 % Loan loss provision ratio 40 % 45 %
Group
Parent bank Group
Parent bank Group
Actual loan losses during the period for which provisions for individual impairment losses have been made previously
Parent bank

SpareBank 1 SR-Bank Group Unaudited 21
Note 5 Other assets
31.12.14 31.12.15 31.12.15 31.12.14
0 2 Intangible assets 61 20295 342 Tangible fixed assets 404 327
29 15 Income earned but not received from SpareBank 1 Bolig- and Næringskreditt 15 2916 25 Prepaid expences 29 1735 35 Capital contribution SR-Pensjonskasse 35 35
1.053 1.756 Unsettled trades 1.756 1.053177 132 Other assets 408 480
1.605 2.307 Total other assets 2.708 1.961
Note 6 Other liabilities
31.12.14 31.12.15 31.12.15 31.12.14
264 239 Accrued expenses and prepaid revenue 322 363855 643 Deferred tax 654 821625 238 Pension liabilities 263 674
1 3 Other specified provisions 3 1102 544 Taxes payable 637 206
0 0 Unsettled trades 0 0248 228 Other liabilities 292 296
2.095 1.895 Total other liabilities 2.171 2.361
Note 7 Customer deposits by sector and industry
31.12.14 31.12.15 31.12.15 31.12.14
1.121 1.146 Agriculture/forestry 1.146 1.121252 351 Fishing/Fish farming 351 252
2.135 2.529 Mining/extraction 2.529 2.1351.403 1.426 Industry 1.426 1.4032.030 2.090 Power and water supply/building and construction 2.090 2.0302.210 2.599 Retail trade, hotels and restaurants 2.599 2.2101.369 1.662 Foreign trade shipping, pipeline transport and other transport activities 1.662 1.3696.883 7.078 Real estate 7.078 6.8839.730 12.431 Service industry 12.243 9.496
15.043 16.217 Public sector and financial services 16.217 15.04342.176 47.529 Total corporate sector 47.341 41.94239.545 42.101 Retail customers 42.101 39.545
2 2 Accrued interests corporate sector and retail customers 2 2
81.723 89.632 Deposits from customers 89.444 81.489
Parent bank Group
Parent bank Group
Parent bank Group
SpareBank 1 SR-Bank Group Unaudited 22
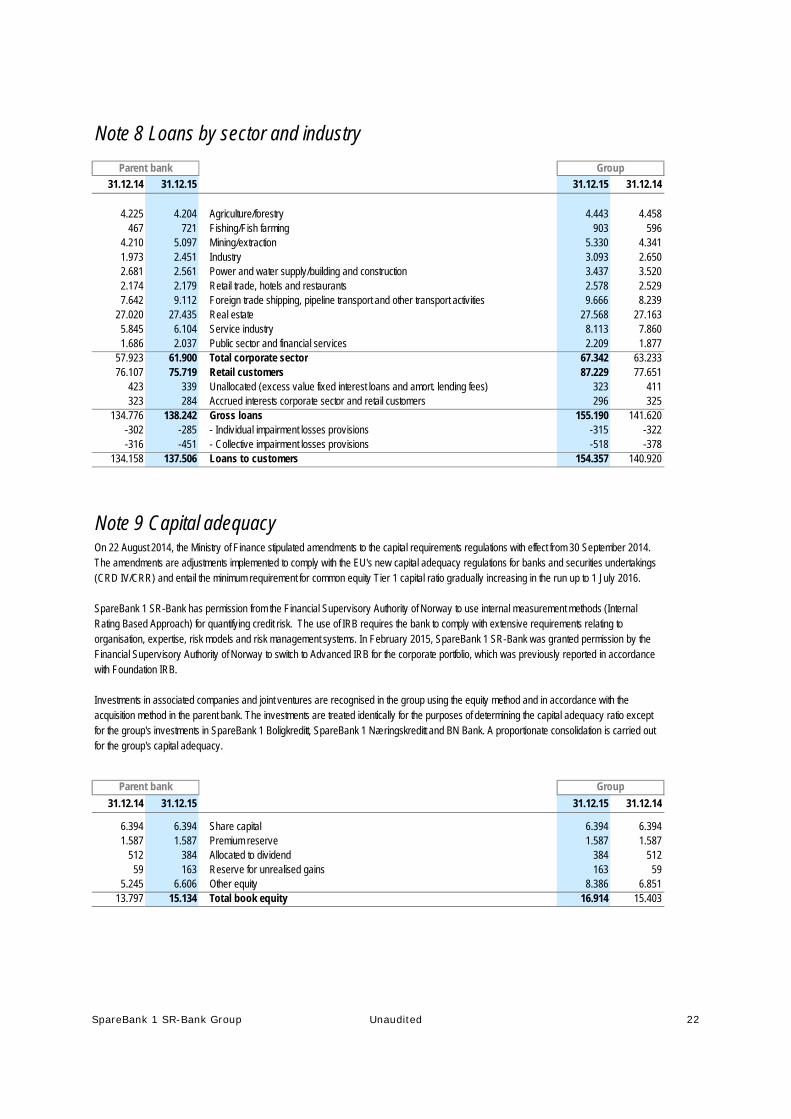
Note 8 Loans by sector and industry
31.12.14 31.12.15 31.12.15 31.12.14
4.225 4.204 Agriculture/forestry 4.443 4.458467 721 Fishing/Fish farming 903 596
4.210 5.097 Mining/extraction 5.330 4.3411.973 2.451 Industry 3.093 2.6502.681 2.561 Power and water supply/building and construction 3.437 3.5202.174 2.179 Retail trade, hotels and restaurants 2.578 2.5297.642 9.112 Foreign trade shipping, pipeline transport and other transport activities 9.666 8.239
27.020 27.435 Real estate 27.568 27.1635.845 6.104 Service industry 8.113 7.8601.686 2.037 Public sector and financial services 2.209 1.877
57.923 61.900 Total corporate sector 67.342 63.23376.107 75.719 Retail customers 87.229 77.651
423 339 Unallocated (excess value fixed interest loans and amort. lending fees) 323 411323 284 Accrued interests corporate sector and retail customers 296 325
134.776 138.242 Gross loans 155.190 141.620-302 -285 - Individual impairment losses provisions -315 -322-316 -451 - Collective impairment losses provisions -518 -378
134.158 137.506 Loans to customers 154.357 140.920
Note 9 Capital adequacyOn 22 August 2014, the Ministry of Finance stipulated amendments to the capital requirements regulations with effect from 30 September 2014.The amendments are adjustments implemented to comply with the EU's new capital adequacy regulations for banks and securities undertakings(CRD IV/CRR) and entail the minimum requirement for common equity Tier 1 capital ratio gradually increasing in the run up to 1 July 2016.
SpareBank 1 SR-Bank has permission from the Financial Supervisory Authority of Norway to use internal measurement methods (InternalRating Based Approach) for quantifying credit risk. The use of IRB requires the bank to comply with extensive requirements relating toorganisation, expertise, risk models and risk management systems. In February 2015, SpareBank 1 SR-Bank was granted permission by theFinancial Supervisory Authority of Norway to switch to Advanced IRB for the corporate portfolio, which was previously reported in accordancewith Foundation IRB.
Investments in associated companies and joint ventures are recognised in the group using the equity method and in accordance with theacquisition method in the parent bank. The investments are treated identically for the purposes of determining the capital adequacy ratio exceptfor the group's investments in SpareBank 1 Boligkreditt, SpareBank 1 Næringskreditt and BN Bank. A proportionate consolidation is carried outfor the group's capital adequacy.
31.12.14 31.12.15 31.12.15 31.12.14
6.394 6.394 Share capital 6.394 6.3941.587 1.587 Premium reserve 1.587 1.587
512 384 Allocated to dividend 384 51259 163 Reserve for unrealised gains 163 59
5.245 6.606 Other equity 8.386 6.85113.797 15.134 Total book equity 16.914 15.403
Group
Parent bank Group
Parent bank

SpareBank 1 SR-Bank Group Unaudited 23
Note 9 Capital adequacy (continued)
31.12.14 31.12.15 31.12.15 31.12.14Tier 1 capital
0 -2 Deferred taxes, goodwill and other intangible assets -67 -24-512 -384 Deduction for allocated dividends -384 -512-622 -380 Deduction for expected losses on IRB, net of write-downs -421 -676
0 0 Deduction for common equity Tier 1 capital in essential investments in financial institutions -191 -326-35 -39 Value of derivative liabilities at fair value -57 -48
12.628 14.329 Total Common equity Tier 1 capital 15.794 13.817794 794 Tier 1 capital instruments 1.088 1.011
13.422 15.123 Total Tier 1 capital 16.882 14.828
Tier 2 capital 2.069 2.536 Term subordinated loan capital 3.111 2.697
-60 -60 Deduction for essential investments in financial institutions -60 -602.009 2.476 Total Tier 2 capital 3.051 2.637
15.431 17.599 Net primary capital 19.933 17.465
Credit risk Basel I I21.786 14.820 SME 14.822 21.78930.354 20.445 Specialised enterprises 22.148 32.685
8.429 6.316 Other corporations 6.830 8.7891.011 1.092 Mass market SME 1.236 1.144
14.468 20.024 Mass market - mortgage on real estate 27.170 20.661823 928 Other mass market 950 845
6.944 7.802 Equity positions 0 083.815 71.427 Total credit and counterparty risk IRB 73.156 85.913
72 70 States and central banks 70 726 116 Local and regional authorities, state-owned enterprises 191 150
5.126 5.628 Institutions 5.985 5.8722.157 2.075 Enterprises 6.886 6.642
116 121 Mass market 1.386 1.2580 0 Mass market - mortgage on real estate 4.114 5.612
1.051 1.228 Covered bonds 1.205 1.1012.995 4.600 Equity positions 4.661 3.6421.639 1.507 Other assets 1.840 1.981
13.162 15.345 Total credit and counterparty risk standard method 26.338 26.330
598 0 Position risk for equity instruments 0 598524 499 Credit value adjustment risk (CVA) 1.050 1.127
4.760 5.295 Operational risk 6.794 6.2200 1.429 Transitional scheme 11.786 0
102.859 93.995 Risk weighted balance 119.124 120.189
4.629 4.230 Minimum requirement for common equtiy Tier 1 capital ratio 4,5 % 5.361 5.409Buffer requirement
2.571 2.350 Capital conservation buffer 2,5 % 2.978 3.0053.086 2.820 Systemic risk buffer 3 % 3.574 3.606
940 Countercyclical capital buffer 1 % 1.1915.657 6.110 Total buffer requirement to common equity Tier 1 capital ratio 7.743 6.6102.342 3.990 Available common equity Tier 1 capital ratio after buffer requirement 2.690 1.798
15,00 % 18,72 % Capital ratio 16,73 % 14,53 %13,05 % 16,09 % Tier 1 capital ratio 14,17 % 12,34 %
1,95 % 2,63 % Tier 2 capital ratio 2,56 % 2,19 %12,28 % 15,24 % Common equity Tier 1 capital ratio 13,26 % 11,50 %15,00 % 19,01 % Capital ratio, IRB 18,57 % 14,53 %13,05 % 16,34 % Tier 1 capital ratio, IRB 15,73 % 12,34 %12,28 % 15,48 % Common equity Tier 1 capital ratio, IRB 14,71 % 11,50 %
7,30 % 7,67 % Leverage Ratio 6,30 % 6,11 %
Parent bank Group

SpareBank 1 SR-Bank Group Unaudited 24
Note 10 Financial derivativesGroup
Contract amountAt fair value through profit and loss 31.12.15 Assets LiabilitiesCurrency instrumentsCurrency forward contracts 2.891 239 27Currency swaps 44.129 1.104 323Currency options 0 0 0Total currency instruments 47.020 1.343 350
Interest rate instrumentsInterest rate swaps(including cross-currency) 66.073 1.687 2.068Other interest rate contracts 164 2 2Total interest rate instruments 66.237 1.689 2.070
Hedging / Interest rate instrumentsInterest rate swaps (including cross currency) 53.512 2.318 93Total hedging / Interest rate instruments 53.512 2.318 93
Accrued interestsAccrued interests 785 273Total accrued interests 785 273
Total currency and interest rate instrumentsTotal currency instruments 47.020 1.343 350Total interest rate instruments 119.749 4.007 2.163Total accrued interests 785 273Total financial derivatives 166.769 6.135 2.786
Counterparty risk associated with derivatives is reduced via ISDA agreements and CSA supplements. The CSA supplement regulates thecounterparty risk through payments of margins in relation to exposure limits. The contract sum and effect of reinvestment costs covered by offsetting
agreements amounted to NOK 146.9 billion and NOK 3.2 billion as of the fourth quarter of 2015.
Note 11 Issuance of unsecured debt and additional capital instrumentsGroup
Balance as at31.12.15 31.12.14
Bonds and certificates, nominal val 68.935 12.866 -7.332 3.459 59.942Adjustments 2.242 -226 2.468Accrued interests 802 -41 843Total debt raised through issuance of securities 71.979 12.866 -7.332 3.192 63.253
Balance as at31.12.15 31.12.14
Term subordinated loan capital, nominal amount 2.550 0 2.069Perpetual subordinated loan capital, nominal amount 0 0Tier 1 capital instruments, nominal amount 795 794Adjustments 102 13 89Accrued interests 12 0 12Total additional Tier 1 and Tier 2 capital instruments 3.459 0 0 13 2.964
The nominal value of the net outstanding covered bonds in SR-Boligkreditt is NOK 8,540 million.
Fair value at 31.12.15
Issued/ sale own 2015
Past due/ redeemed 2015
Change in debt raised through issuance of securities
Issued/ sale own 2015
Past due/ redeemed 2015
FX rate- and other changes
2015
FX rate- and other changes
2015Change in additional Tier 1 and Tier 2 capital instruments

SpareBank 1 SR-Bank Group Unaudited 25
Note 12 Segment reporting
Retail Corporate Capital Eiendoms- SR- Other
Income statement (MNOK) Market Market Market 1) Megler 1 Finans activities
Interest income 1.855 1.679 1.168 822 3 390 2 -166 5.752
Interest expense 775 607 1.096 710 0 136 0 -164 3.159
Net interest income 1) 1.080 1.072 72 112 3 254 2 -2 2.593
Commission income 1) 744 333 36 15 383 4 141 -49 1.605
Commission expenses 38 25 5 3 0 23 33 -48 78
Other operating income 1 0 0 5 0 0 1 -2 5
706 308 31 17 383 -19 109 -3 1.532
Dividend income 3 0 1 11 0 0 1 0 17
Income from investment in associates 0 40 0 490 0 0 0 -108 422
Net gains/losses on financial instruments 1) 12 -91 -22 -74 0 0 -30 70 -135
Net income on investment securities 15 -51 -21 427 0 0 -29 -38 304
Personnel expenses 383 179 57 49 216 24 39 -3 945
Administrative expenses 103 30 13 276 41 9 7 0 480
Other operating expenses 101 34 10 150 99 12 35 -3 438
Total operating expenses 587 243 80 475 356 45 81 -6 1.863
Operating profit before losses 1.214 1.086 2 81 30 190 2 -37 2.566
Change in individual write-downs in the period 3 242 0 0 0 35 0 0 280Change in group write-downs in the period 5 130 0 0 0 5 0 140
1.206 713 2 81 30 150 2 -37 2.146
Net interest income 1)
External net interest income 1.080 1.072 72 112 0 390 2 -135 2.593
Internal net interest income 0 0 0 0 3 -136 0 133 0
Net interest income 1.080 1.072 72 112 3 254 2 -2 2.593
0
Balance sheet (MNOK) 0
Loans to customers 89.133 55.852 698 2.509 0 7.000 0 -2 155.190
Individual loss provisions -66 -219 0 0 0 -30 0 0 -315
Group loss provisions -45 -406 0 0 0 -67 0 0 -518
Certificates/bonds/financial derivatives 0 0 6.022 20.520 0 1 17 -893 25.668
Other assets 55 962 142 17.937 168 105 572 -7.917 12.024
Total assets 89.077 56.190 6.862 40.966 168 7.008 589 -8.811 192.049
Deposits from customers 46.910 38.359 3.699 664 0 0 0 -188 89.444
Other debt and equity 2) 42.167 17.830 3.164 40.302 168 7.008 589 -8.623 102.605
Total debt and equity 89.077 56.190 6.862 40.966 168 7.008 589 -8.811 192.049
28.168 538 28.706
1) The capital market division serves customers throughout the group. Previously, most of the income this division generates was recognised in the division. From the 1
January 2014, the internal income recognition policy was changed and income is now recognised, in its entirety, in the business area to which the customer belongs. Historical
accounting figures have not been changed as the effect on the accounts are considered to have an insignificant effect.
2) Other liabilities contain allocated arrangements between the segments. Interest on intercompany receivables for the retail market division and the corporate market division is
determined based on expected observable market interest rates (NIBOR) plus expected additional costs in connection with the group's long term financing (credit premium).
Deviations between the group's actual financing costs and the applied interest on intercompany receivables are eliminated at the group level.
Loans sold to SpareBank 1 Boligkreditt and SpareBank 1 Næringskreditt
Elimi-nations
SpareBank 1 SR-Bank Group 01.01.15 - 31.12.15
Own account trading/support
Total
Management has assessed which segments are reportable based on the form of distribution, products and customers. The primary reporting format is based on the risk and returnprofile of the assets, and it is divided between the retail market (including self-employed people), the corporate market, the capital market and subsidiaries of considerable siginificance.The Bank's own investment activities are not a separate reportable segment and they appear under the item "Other activities" together with activities that cannot be allocated to the retailmarket, corporate market, capital market or subisidiaries of considerable significance. Own account trading/support/staff parent bank concists of administration, management, investmentservices, strategy and ownership, treasury and finance function. SR-Boligkreditt AS was established in the second quarter of 2015. The activities in SR-Boligkreditt AS are divided between the retail market and own account trading/staff/support in the parent bank segments. Commision income from SpareBank 1 Boligkreditt and SpareBank 1 Næringskreditt are included under "Net commission and other income".
Net commission and other income
Pre-tax profit
SpareBank 1 SR-Bank Group Unaudited 26
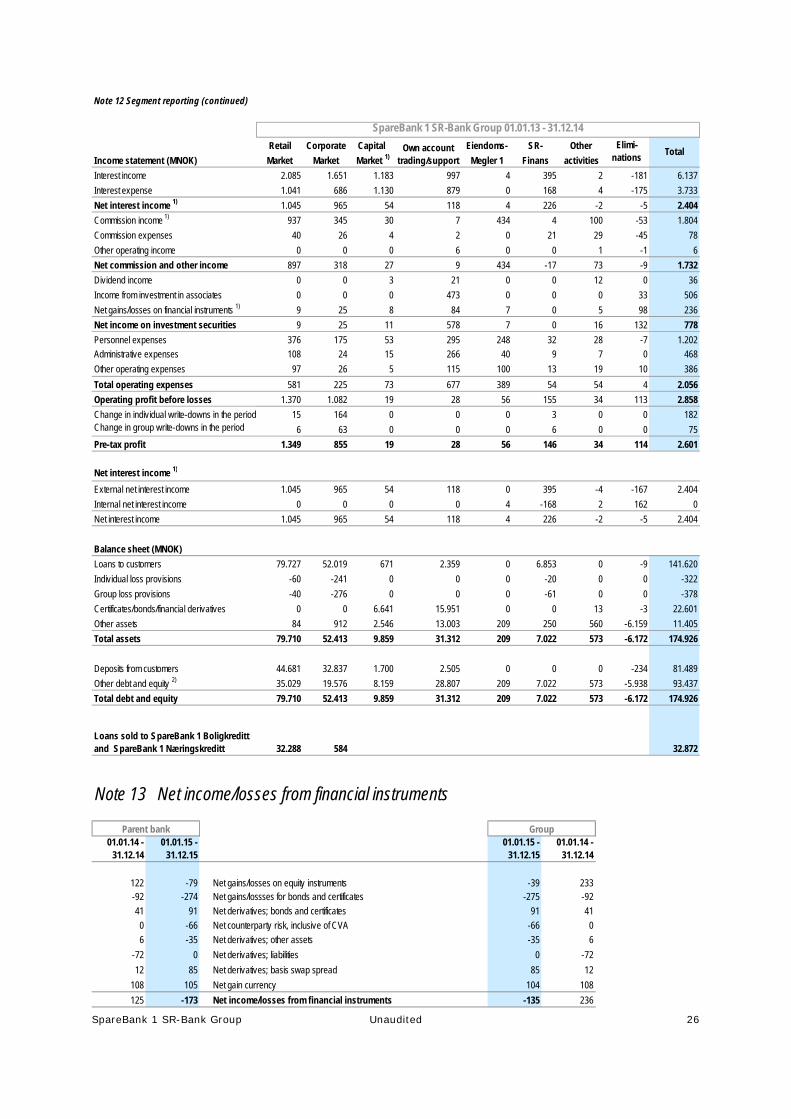
Note 13 Net income/losses from financial instruments
01.01.14 - 31.12.14
01.01.15 - 31.12.15
01.01.15 - 31.12.15
01.01.14 - 31.12.14
122 -79 Net gains/losses on equity instruments -39 233-92 -274 Net gains/lossses for bonds and certificates -275 -92
41 91 Net derivatives; bonds and certificates 91 41
0 -66 Net counterparty risk, inclusive of CVA -66 0
6 -35 Net derivatives; other assets -35 6
-72 0 Net derivatives; liabilities 0 -72
12 85 Net derivatives; basis swap spread 85 12
108 105 Net gain currency 104 108
125 -173 Net income/losses from financial instruments -135 236
Parent bank Group
Note 12 Segment reporting (continued)
Retail Corporate Capital Eiendoms- SR- Other
Income statement (MNOK) Market Market Market 1) Megler 1 Finans activities
Interest income 2.085 1.651 1.183 997 4 395 2 -181 6.137
Interest expense 1.041 686 1.130 879 0 168 4 -175 3.733
Net interest income 1) 1.045 965 54 118 4 226 -2 -5 2.404
Commission income 1) 937 345 30 7 434 4 100 -53 1.804
Commission expenses 40 26 4 2 0 21 29 -45 78
Other operating income 0 0 0 6 0 0 1 -1 6
897 318 27 9 434 -17 73 -9 1.732
Dividend income 0 0 3 21 0 0 12 0 36
Income from investment in associates 0 0 0 473 0 0 0 33 506
Net gains/losses on financial instruments 1) 9 25 8 84 7 0 5 98 236
Net income on investment securities 9 25 11 578 7 0 16 132 778
Personnel expenses 376 175 53 295 248 32 28 -7 1.202
Administrative expenses 108 24 15 266 40 9 7 0 468
Other operating expenses 97 26 5 115 100 13 19 10 386
Total operating expenses 581 225 73 677 389 54 54 4 2.056
Operating profit before losses 1.370 1.082 19 28 56 155 34 113 2.858
Change in individual write-downs in the period 15 164 0 0 0 3 0 0 182Change in group write-downs in the period 6 63 0 0 0 6 0 0 75
1.349 855 19 28 56 146 34 114 2.601
Net interest income 1)
External net interest income 1.045 965 54 118 0 395 -4 -167 2.404
Internal net interest income 0 0 0 0 4 -168 2 162 0
Net interest income 1.045 965 54 118 4 226 -2 -5 2.404
Balance sheet (MNOK)
Loans to customers 79.727 52.019 671 2.359 0 6.853 0 -9 141.620
Individual loss provisions -60 -241 0 0 0 -20 0 0 -322
Group loss provisions -40 -276 0 0 0 -61 0 0 -378
Certificates/bonds/financial derivatives 0 0 6.641 15.951 0 0 13 -3 22.601
Other assets 84 912 2.546 13.003 209 250 560 -6.159 11.405
Total assets 79.710 52.413 9.859 31.312 209 7.022 573 -6.172 174.926
Deposits from customers 44.681 32.837 1.700 2.505 0 0 0 -234 81.489
Other debt and equity 2) 35.029 19.576 8.159 28.807 209 7.022 573 -5.938 93.437
Total debt and equity 79.710 52.413 9.859 31.312 209 7.022 573 -6.172 174.926
32.288 584 32.872
Net commission and other income
Elimi-nations
SpareBank 1 SR-Bank Group 01.01.13 - 31.12.14
Own account trading/support
Total
Loans sold to SpareBank 1 Boligkreditt and SpareBank 1 Næringskreditt
Pre-tax profit

SpareBank 1 SR-Bank Group Unaudited 27
Note 14 Pensions
The SpareBank 1 SR-Bank group has two types of pension scheme: defined benefit-based and contribution benefit-based pension schemes. For more
information about the accounting treatment of the schemes see note 1 above and note 24 to the annual financial statements for 2014.
A decision was taken at the board meeting in June 2015 that employees who are members of the defined benefit scheme must transfer to a defined
contribution pension scheme from 1 January 2016. Upon transitioning to a contribution based pension scheme from 1 January 2016, employees who
were in the defined benefit scheme will receive a paid-up policy for their earned rights from the defined benefit scheme. Paid-up policies will be managed
by the pension fund, which from 1 January 2016 will become a paid-up fund. A framework agreement has been established between SpareBank 1
SR-Bank and the pension fund that covers things such as financing, capital management, etc. Because of the responsibilities SpareBank 1 SR-Bank ASA
still has, future liabilities will have to be incorporated in the financial statements. The board of the pension fund must consist of representatives of the group
and pension scheme participants in accordance with the pension fund's articles of association. The change has reduced pension liabilities.
The consequenses recognised in the financial statements for the third and fourth quarter of 2015 are:
Q3 2015 Q4 201501.01.15 -
31.12.1501.01.15 -
31.12.15 Q4 2015 Q3 2015
-60 -153 -213 Curtailments included in the income statement -226 -163 -63
The following economic assumptions have been used to calculate the obligations for the defined benefit-based pension scheme:
Q4 2014 Q1 2015 Q2 2015 Q3 2015 Q4 2015 Parent bank and group2,30 % 2,40 % 2,80 % 2,60 % 2,70 % Discount rate
2,30 % 2,40 % 2,80 % 2,60 % 2,70 % Expected return on assets
2,75 % 2,75 % 2,75 % 2,50 % 2,50 % Forecast salary increase
2,50 % 2,50 % 2,50 % 2,25 % 2,25 % National Insurance scheme's basic amount
2,00 % 2,00 % 2,00 % 2,00 % 1,60%/2,00% Pension adjustment/paid-up policy adjustment
Change in pension obligations (NOK million):
Q4 2014 Q4 201501.01.14 -
31.12.1401.01.15 -
31.12.1501.01.15 -
31.12.1501.01.14 -
31.12.14 Q4 2015Q4
2014
480 398 223 625 Net obligations opening balance 674 242 437 512
149 -23 415 -187Actuarial liabilities and losses recognised in comprehensive income -200 444 -28 166
22 19 83 88 Net pension cost 95 88 23 22-23 0 -79 -66 Company contributions -71 -82 -1 -23
-3 -3 -12 -9 Payments from operations -9 -13 -5 -30 -153 -5 -213 Curtailments included in the income statement -226 -5 -163 0
625 238 625 238 Net pension obligations closing balance 263 674 263 674
Parent bank Group

SpareBank 1 SR-Bank Group Unaudited 28
Note 15 Sale of loans
In the 3rd quarter of 2010, in association with the other owners of Sparebank 1 Boligkreditt, Sparebank 1 SR-Bank entered into an agreement to establish a liquidity
facility for SpareBank 1 Boligkreditt. This implies that the banks undertake to buy mortgage bonds limited to a total value equal to 12 months' maturities in SpareBank 1
Boligkreditt. Each owner is primarily liable for its share of the need, secondarily for twice the amount of the primary liability under the same agreement. The bonds
can be deposited with Norges Bank and represent, therefore, no significant increase in the bank's inherent risk.
The bank has concluded agreements concerning the sale of loans with good security and collateral in real estate to SpareBank 1 Boligkreditt and SpareBank 1
Næringskreditt. For more information about the accounting treatment of the agreements see note 2 and note 9 in the 2014 annual financial statements.
SpareBank 1 SR-Bank has also concluded an agreement concerning the sale of loans with good security and collateral in real estate from SpareBank 1 SR-Bank to
SR-Boligkreditt. Such loans are derecognised from the parent bank's balance sheet, but are recognised in the consolidated financial statements.
Note 16 Liquidity risk
Liquidity risk is the risk that the group is not able to refinance its debt or is not able to finance an increase in assets. The bank's framework for managing liquidity risk shall
reflect the bank's conservative risk profile. The board has adopted internal limits such that the bank has as balanced a maturity structure for its borrowing as possible.
Stress testing is conducted for the various terms of maturity for bank-specific crises, system crises and combinations of these. A contingency plan has also been put in
place to manage liquidity crises. The average remaining term to maturity in the portfolio of senior bond funding and covered bonds was 3.1 years at the end of the
fourth quarter of 2015. The total LCR was 128% at the end of the fourth quarter and the average total LCR was 140% in the quarter. The LCR in NOK and EUR at
the end of the quarter was 74% and 688% , respectively.
Note 17 Information about fair value
GroupThe table below shows financial instruments at fair value according to their valuation method. The different levels are defined as follows:
Fair value 31.12.15 Level 1 Level 2 Level 3 Total
Assets
Net lending to customers 10.565 10.565
Commercial paper and bonds at fair value 15.109 4.424 19.533
Financial derivatives 6.135 6.135
Equities, units and other equity interests 186 18 236 440
Operations that will be sold 168 168
Liabilities
Financial derivatives 2.786 2.786
No transfers between levels 1 and 2
Fair value 31.12.14 Level 1 Level 2 Level 3 Total
Assets
Net lending to customers 9.994 9.994
Commercial paper and bonds at fair value 14.203 1.058 15.261
Financial derivatives 7.340 7.340
Equities, units and other equity interests 217 118 288 623
Operations that will be sold 22 22
Liabilities
Financial derivatives 3.317 3.317
No transfers between levels 1 and 2
for the asset or liability.
Level 2: Valuation based on observable factors other than listed price (used in level 1) either direct (price) or indirect (deduced from prices)
Level 1: Listed price in an active market for an identical asset or liability.
Level 3: Valuation based on factors not obtained from observable markets (non-observable assumptions).

SpareBank 1 SR-Bank Group Unaudited 29
Note 17 Information about fair value (continued)
Change in holding during the financial year of assets valued on the basis of factors other than observable market data
Group
Balance 01.01 9.994 288 22
Additions 3.985 25 137
Disposals -3.319 -145
Transferred from or to measurement according to prices in an active market or observable market data
Change in value 1)-95 68 9
Balance 31.12 10.565 236 168
Nominal value/cost price 10.145 180 107
Fair value adjustment 420 56 61
Balance 31.12 10.565 236 168
The stake in Bank 1 Oslo Akershus is valued every quarter by SpareBank 1 Gruppen and distributed to all of the alliance banks. In 2015, Sparebanken Hedmark
exercised its option to purchase the remaining shares in Bank 1 Oslo Akershus and the transaction is expected to be finally completed in the first quarter of 2016.
Valuation of the stake in Bank 1 Oslo Akershus is based on an average of five different methods in which the last known transaction price, earnings per share,
dividends per share and EBITDA are inputs for the valuation.
A contract on the sale of the stakes in Nets Holding was signed in the first quarter of 2014. The value according to the sales contract was used in the interim financialstatements and resulted in income of NOK 202 million in the first quarter of 2014.
SpareBank 1 SR-Bank is a member of Visa Norge FLI. Visa Norge FLI is, as a group member of Visa Europe, also a shareholder in Visa Europe Ltd. On 2 November
2015, an agreement was announced concerning the sale of Visa Europe Ltd to Visa Inc. The transaction, which is expected to be completed in the second quarter of
2016, will considerably increase the equity in Visa Norge IFS. SpareBank 1 SR-Bank's ownership interests in Visa Norge IFS are considered a financial asset in the
available for sale category (AFS investment) and must therefore be recognised at fair value as long as this can be reliably measured. The remuneration consists of
assets in Visa Inc., a cash settlement and contingent remuneration. Visa Europe Ltd has estimated the value of the shares in Visa Inc. The fair value of the shares in
Visa Inc was arrived at using the price of the shares and exchange rate on 31 December 2015, with deductions for the liquidity discount priced in the acquisition
analysis and liquidity discount estimated by SpareBank 1 SR- Bank. The cash remuneration is indicated by Visa Europe Ltd. SpareBank 1 SR-Bank has used its share
of the voting rights in Visa Norge IFS, 3.1% , to calculate its proportion of the total estimated value. The estimated fair value was used in the interim financial statements
and resulted in income of NOK 95.2 million in the fourth quarter of 2015.
Other assets are measured using various methods such as last known transaction price, earnings per share, dividend per share, EBITDA and discounted cash flows.
Fixed-rate loans are measured on the basis of the interest rate agreed with the customer. Loans are discounted using the applicable interest curve, having taken into
account a market premium, which is adjusted for the profit margin. The conducted sensitivity analyses indicate an increase in the discount rate of 10 basis points would
have a negative effect on the result amounting to NOK 32 million.
1) Value changes are recognised in net income from financial instruments
Note 18 Events after the balance sheet date
No material events that have influence on the prepared interim financial statements have been registered after 31 December 2015.
Business available
for saleLoans to customers Shares, ownership stakes and
other securities

SpareBank 1 SR-Bank Group Unaudited 30
QUARTERLY INCOME STATEMENTSpareBank 1 SR-Bank Group, MNOK Q4 Q3 Q2 Q1 Q4 Q3 Q2 Q1 Q4
2015 2015 2015 2015 2014 2014 2014 2014 2013
Interest income 1.408 1.431 1.436 1.477 1.588 1.568 1.543 1.438 1.466
Interest expense 730 782 797 850 933 947 962 891 892
Net interest income 678 649 639 627 655 621 581 547 574
Commission income 388 372 418 427 423 421 462 498 500
Commission expenses 17 21 20 20 19 20 19 20 12
Other operating income 1 2 1 1 1 2 1 2 1
Net commission and other income 372 353 399 408 405 403 444 480 489
Dividend income 1 1 8 7 1 10 7 18 -2
Income from investment in associates 110 78 101 133 138 150 137 81 95
Net gains/losses on financial instrument -124 -67 -15 71 -23 -18 57 220 102
Net income on financial investments -13 12 94 211 116 142 201 319 195
Total income 1.037 1.014 1.132 1.246 1.176 1.166 1.226 1.346 1.258
Personnel expenses 114 221 300 310 308 307 293 294 323
Administrative expenses 125 114 122 119 128 114 120 106 109
Other operating costs 129 94 114 101 94 99 88 105 102
Total operating cost 368 429 536 530 530 520 501 505 534
Operating profit before impairment losses 669 585 596 716 646 646 725 841 724
Impairment losses on loans and guarantees 192 96 44 88 93 69 41 54 50
Pre-tax profit 477 489 552 628 553 577 684 787 674
Tax expense 35 112 121 132 105 123 150 128 107
Profit after tax 442 377 431 496 448 454 534 659 567
ProfitabilityReturn on equity per quarter 1) 10,6 % 9,3 % 10,8 % 12,7 % 11,7 % 12,2 % 14,5 % 18,4 % 16,2 %
Cost percentage 2) 35,5 % 42,3 % 47,3 % 42,5 % 45,1 % 44,6 % 40,9 % 37,5 % 42,4 %
Combined weighted total average spread for lending and deposits 3) 1,40 % 1,39 % 1,44 % 1,45 % 1,51 % 1,48 % 1,41 % 1,40 % 1,46 %
Balance sheet figures from quarterly accountsGross loans to customers 155.190 151.911 150.245 144.686 141.620 137.343 135.335 121.723 120.273
Gross loans to customers including SB1 Boligkreditt og Næringskreditt 183.896 182.940 181.440 178.750 174.492 170.270 168.624 166.593 166.662
Growth in loans over last 12 months 4) 9,6 % 10,6 % 11,0 % 18,9 % 17,7 % 17,7 % 17,5 % 8,4 % -16,8 %
Growth in loans incl SB1 Boligkreditt and Næringskreditt 5,4 % 7,4 % 7,6 % 7,3 % 4,7 % 3,5 % 3,6 % 3,8 % 5,3 %
Deposits from customers 89.444 88.980 90.788 85.984 81.489 81.228 81.728 74.440 71.667
Deposit-to-loan ratio 57,6 % 58,6 % 60,4 % 59,4 % 57,5 % 59,1 % 60,4 % 61,2 % 59,6 %
Growth in deposits over last 12 months 9,8 % 9,5 % 11,1 % 15,5 % 13,7 % 14,9 % 11,5 % 8,5 % 6,0 %
Total assets 192.049 191.500 181.889 176.913 174.926 168.310 167.273 157.752 156.985
Average total assets 192.315 185.459 177.861 175.938 172.179 166.894 164.949 158.867 155.489
Losses and non-performing commitmentsImpairment losses ratio, annualized 5) 0,50 % 0,25 % 0,12 % 0,25 % 0,27 % 0,20 % 0,13 % 0,18 % 0,17 %
Non-performing commitments as a percentage of total loans 0,55 % 0,23 % 0,27 % 0,31 % 0,30 % 0,38 % 0,40 % 0,52 % 0,69 %
Other doubtful commitments as a percentage of total loans 0,35 % 0,45 % 0,51 % 0,50 % 0,36 % 0,39 % 0,41 % 0,38 % 0,37 %
SolidityCommon equity Tier 1 capital ratio 13,3 % 12,2 % 12,3 % 12,1 % 11,5 % 11,3 % 11,4 % 11,2 % 11,1 %
Tier 1 capital ratio 14,2 % 13,1 % 13,1 % 12,9 % 12,3 % 13,1 % 13,2 % 13,0 % 12,8 %
Capital ratio 16,7 % 15,2 % 15,3 % 15,2 % 14,5 % 15,4 % 14,6 % 14,5 % 14,1 %
Tier 1 capital 16.882 16.063 15.771 15.206 14.828 15.304 14.978 14.691 14.511
Net primary capital 19.933 18.635 18.403 17.838 17.465 18.037 16.584 16.407 15.915
Risk weighted balance 119.124 122.380 120.363 117.589 120.189 117.278 113.725 113.413 113.075
Leverage ratio 6,3 % 5,9 % 6,3 % 6,1 % 6,1 %
LiquidityLiquidity Coverage Ratio (LCR) 6) 128 % 164 % 111 % 113 % 94 %
Deposit-to-loan ratio 57,6 % 58,6 % 60,4 % 59,4 % 57,5 % 59,1 % 60,4 % 61,2 % 59,6 %
Se next page for definition of key figures

SpareBank 1 SR-Bank Group Unaudited 31
Q4 Q3 Q2 Q1 Q4 Q3 Q2 Q1 Q4
SpareBank 1 SR-Bank share 2015 2015 2015 2015 2014 2014 2014 2014 2013
Market price at end of quarter 39,30 42,40 52,25 56,25 52,50 61,00 59,75 60,75 60,25
Market capitalisation 10.051 10.844 13.363 14.386 13.427 15.601 15.281 15.537 15.409
Number of shares issued, millions 255,75 255,75 255,75 255,75 255,75 255,75 255,75 255,75 255,75
Book equity per share(including dividends) 66,14 64,02 62,56 62,40 60,28 59,21 57,63 57,45 55,00
Earnings per share, NOK (annualised) 1,73 1,47 1,69 1,94 1,75 1,78 2,09 2,58 2,22
Price/earnings per share 5,68 7,21 7,73 7,25 7,50 8,57 7,15 5,89 6,78
Price / Book equity (group) 0,59 0,66 0,84 0,90 0,87 1,03 1,04 1,06 1,10
Annualised turnover rate in quarter 7) 3,4 % 5,1 % 5,6 % 7,4 % 7,7 % 3,0 % 5,5 % 7,6 % 6,3 %
Effective return 8) -7,3 % -18,9 % -3,6 % 7,1 % -13,9 % 2,1 % 1,0 % 0,8 % 26,3 %
Key figure definitions1) Operating result as a percentage of average equity2) Total operating costs as a percentage of total operating income3) Net interest income as a percentage of average total assets4) High growth in loans in 2014 is attributable to a buy-back of loans from SpareBank 1 Boligkreditt AS5) Impairment losses on loans as a percentage of average gross loans, annualised6) High quality liquid assets divided by total net cash outflows in a 30-day, serious stress scenario7) Annualised turnover of the share during the period, measured as a percentage of the number of outstanding shares8) Percentage change in the market price in the last period, including paid share dividend

SpareBank 1 SR-Bank Group Unaudited 32
Contact Information Address
Bjergsted Terasse 1 Postboks 250 N-4066 Stavanger Tel. (+47) 915 02 002 www.sr-bank.no
Executive Management
Arne Austreid, CEO Tel. (+47) 900 77 334 Email: [email protected] Inge Reinertsen, CFO Tel. (+47) 909 95 033 Email: [email protected]
Investor Relations Stian Helgøy, Vice President Investor Relations Tel. (+47) 906 52 173 Email: [email protected]
2016 Financial Calendar Preliminary annual results for 2015 Thursday 4 February Annual General Meeting Wednesday 27 April Ex-dividend Thursday 28 April Q1 2016 Wednesday 27 April Q2 2016 Wednesday 10 August Q3 2016 Wednesday 26 October