DN Ku, DP Giddens, CK Zarins and S Glagov...
11
1524-4636 Copyright © 1985 American Heart Association. All rights reserved. Print ISSN: 1079-5642. Online ISSN: 7272 Greenville Avenue, Dallas, TX 72514 Arteriosclerosis, Thrombosis, and Vascular Biology is published by the American Heart Association. 1985;5;293-302 Arterioscler. Thromb. Vasc. Biol. DN Ku, DP Giddens, CK Zarins and S Glagov correlation between plaque location and low oscillating shear stress Pulsatile flow and atherosclerosis in the human carotid bifurcation. Positive http://atvb.ahajournals.org located on the World Wide Web at: The online version of this article, along with updated information and services, is http://www.lww.com/reprints Reprints: Information about reprints can be found online at [email protected] 410-528-8550. E-mail: Kluwer Health, 351 West Camden Street, Baltimore, MD 21202-2436. Phone: 410-528-4050. Fax: Permissions: Permissions & Rights Desk, Lippincott Williams & Wilkins, a division of Wolters http://atvb.ahajournals.org/subscriptions/ is online at Subscriptions: Information about subscribing to Arteriosclerosis, Thrombosis, and Vascular Biology at STANFORD UNIV MEDICAL CENTER on August 8, 2007 atvb.ahajournals.org Downloaded from
Transcript of DN Ku, DP Giddens, CK Zarins and S Glagov...

1524-4636 Copyright © 1985 American Heart Association. All rights reserved. Print ISSN: 1079-5642. Online ISSN:
7272 Greenville Avenue, Dallas, TX 72514Arteriosclerosis, Thrombosis, and Vascular Biology is published by the American Heart Association.
1985;5;293-302 Arterioscler. Thromb. Vasc. Biol.DN Ku, DP Giddens, CK Zarins and S Glagov
correlation between plaque location and low oscillating shear stressPulsatile flow and atherosclerosis in the human carotid bifurcation. Positive
http://atvb.ahajournals.orglocated on the World Wide Web at:
The online version of this article, along with updated information and services, is
http://www.lww.com/reprintsReprints: Information about reprints can be found online at
[email protected]. E-mail: Kluwer Health, 351 West Camden Street, Baltimore, MD 21202-2436. Phone: 410-528-4050. Fax: Permissions: Permissions & Rights Desk, Lippincott Williams & Wilkins, a division of Wolters
http://atvb.ahajournals.org/subscriptions/is online at Subscriptions: Information about subscribing to Arteriosclerosis, Thrombosis, and Vascular Biology
at STANFORD UNIV MEDICAL CENTER on August 8, 2007 atvb.ahajournals.orgDownloaded from

Pulsatile Flow and Atherosclerosisin the Human Carotid Bifurcation
Positive Correlation between Plaque Locationand Low and Oscillating Shear Stress
David N. Ku, Don P. Giddens, Christopher K. Zarins, and Seymour Glagov
Fluid velocities were measured by laser Doppler velocimetry under conditions ofpulsatile flow in a scale model of the human carotid bifurcation. Flow velocity and wallshear stress at five axial and four circumferential positions were compared withintimal plaque thickness at corresponding locations in carotid bifurcations obtainedfrom cadavers. Velocities and wall shear stresses during diastole were similar tothose found previously under steady flow conditions, but these quantities oscillatedin both magnitude and direction during the systolic phase. At the inner wall of theinternal carotid sinus, in the region of the flow divider, wall shear stress was highest(systole = 41 dynes/cm2, diastole = 10 dynes/cm2, mean = 17 dynes/cm2) and re-mained unidirectional during systole. Intimal thickening in this location was minimal.At the outer wall of the carotid sinus where intimal plaques were thickest, mean shearstress was low (-0.5 dynes/cm2) but the instantaneous shear stress oscillated be-tween - 7 and +4 dynes/cm2. Along the side walls of the sinus, intimal plaque thick-ness was greater than in the region of the flow divider and circumferential oscillationsof shear stress were prominent. With all 20 axial and circumferential measurementlocations considered, strong correlations were found between intimal thickness andthe reciprocal of maximum shear stress (r = 0.90, p < 0.0005) or the reciprocal ofmean shear stress (r = 0.82, p < 0.001). An index which takes into account oscillationsof wall shear also correlated strongly with intimal thickness (r - 0.82, p < 0.001).When only the inner wall and outer wall positions were taken into account, correla-tions of lesion thickness with the inverse of maximum wall shear and mean wall shearwere 0.94 (p < 0.001) and 0.95 (p < 0.001), respectively, and with the oscillatory shearindex, 0.93 (p < 0.001). These studies confirm earlier findings under steady flowconditions that plaques tend to form in areas of low, rather than high, shear stress, butindicate in addition that marked oscillations in the direction of wall shear may en-hance atherogenesis. (Arteriosclerosis 5:293-302, May/June 1985)
The role of specific hemodynamic variables in theinitiation and development of atherosclerotic
plaques in human arteries can be assessed by corre-lating flow field measurements with the distribution ofintimal lesions about branch ostia and bifurcations.At present, noninvasive methods for determining
From the School of Aerospace Engineering, Georgia Institute ofTechnology, and the Departments of Surgery and Pathology, Uni-versity of Chicago, Chicago, Illinois.
Don P. Giddens is at the Georgia Institute of Technology; DavidN. Ku and Christopher K. Zarins are at the Department of Surgeryand Seymour Glagov is at the Department of Pathology at theUniversity of Chicago.
The work was supported by NSF Grant CME 7921551 andpartly by NHLBI Grant 15062.
Address for reprints: David N. Ku, Department of Surgery, Box129, The University of Chicago, 5841 South Maryland Avenue,Chicago, Illinois 60637.
Received July 2 1984; revision accepted February 4, 1985.
flow velocity profiles in situ do not provide sufficientspatial resolution to describe the complex flow pat-terns at such locations, nor are current imaging tech-niques adequate for precise localization of early non-stenosing lesions. With the use of appropriategeometric and scaling parameters, rigid glass orplastic models can be used to visualize flow profilesand measure flow velocities representative of thoseoccurring in human vessels.
Postmortem human arteries are suitable for deter-minations of corresponding plaque location and sizeif appropriate pressure-fixation procedures are used.Previous comparison of steady flow measurementsin scale models of the human carotid bifurcation withplaque deposition in a corresponding series of au-topsy specimens1 revealed that early lesions oc-curred principally in regions of flow separation, lowwall shear stress, and departure from unidirectional
293
at STANFORD UNIV MEDICAL CENTER on August 8, 2007 atvb.ahajournals.orgDownloaded from

294 ARTERIOSCLEROSIS VOL 5, No 3, MAY/JUNE 1985
flow. Specifically, plaque formation was maximal atthe outer wall of the carotid sinus where flow separa-tion and low wall shear occurred in the model stud-ies, and it was minimal near the flow divider (innerwall) where shear stress was high and flow stream-lines were mainly axially oriented. At the side wallswhere circumferential velocity components werepresent, intimal thickening was intermediate be-tween that formed at the outer and inner walls.
To explore the effects of pulsatile flow on hemody-namic forces acting on the endothelial surface, weobserved flow patterns in a glass carotid bifurcationmodel utilizing a pulsatile flow system that producedsystolic and diastolic intervals and a pulse wave formsimilar to that which prevails in normal young adults.In contrast to steady flow conditions, pulsatile flowcreated a cyclically varying region of separation andreversal at the outer wall of the sinus and helicalpatterns which changed markedly in magnitude anddirection.2 We have now measured flow velocity in aPlexiglas model of the bifurcation at several axialand circumferential stations using laser Dopplervelocimetry, and we used the near wall velocity gra-dients to calculate values for wall shear stress.Comparisons of the pulsatile fluid dynamic measure-ments with the human specimens revealed a goodcorrelation between reciprocals of maximum andmean wall shear stress and intimal plaque deposi-tion. In addition, oscillations in wall shear stress am-plitude and direction occurring mainly in systole cor-related strongly with plaque thickness.
Methods
Comparisons were made between data obtainedfrom pulsatile flow studies in a Plexiglas model andthe circumferential distribution of intimal plaquethickness at five standard sampling levels in humancarotid bifurcations. The five standard axial locationsat which flow velocity determinations were made inthe model and intimal thicknesses were measured inthe specimens are shown in Figure 1.
The Plexiglas bifurcation model used for the fluiddynamic studies was constructed from measure-ments obtained from biplanar angiograms of 57 pa-tients ranging from 34 to 77 years of age. The detailsof construction are provided elsewhere.3 The dimen-sions of the model were scaled upward 125 times byvolume to permit flow velocity measurements usinglaser Doppler anemometry with a resolution morethan 1000 times greater than that typically obtainedby in vivo Doppler ultrasound measurements. Themodel diameters at the axial levels corresponding tothe five standard axial sampling sites of the humanvessels were: A. common carotid, 31.0 mm; B. proxi-mal internal carotid, 32.3 mm; C. mid-carotid sinus,34.4 mm; D. distal internal carotid, 22.0 mm; E. proxi-mal external carotid, 17.6 mm. The bifurcation anglewas 50°.
The carotid bifurcation specimens used to quanti-tate lesion location and thickness were obtained at
autopsy from patients aged 27 to 73 years (mean, 53years) with no history of symptomatic cerebrovascu-lar disease.' The common carotid, internal carotid,and external carotid were excised as a unit. Eachtransected vessel was then cannulated and the in-tact bifurcation was distended with warm (37° C),buffered formalin (3.8%) at an intraluminal pressureof 100 mm Hg. Fixation was continued for 1 hour withthe distended vessels immersed in fixative. On thebasis of subsequent angiograms, the first 12 speci-mens without stenoses were selected for sectioningat the standard axial levels. Angiograms of the fixedspecimens revealed mean diameters of 6.1 mm forthe standard common carotid (A); 6.0 mm for theproximal internal carotid (B); 6.2 mm for the midpointof the sinus (C); 3.5 mm for the distal internal carotid(D); and 4.0 mm for the external carotid (E) axiallevels. The mean bulb length was 13.9 mm and themean bifurcation angle, 46°. When the dimensions ofthe Plexiglas model are scaled to a 6.1 mm commoncarotid diameter, the resulting model values are 6.3,6.8,4.2, and 4.2 mm for levels B, C, D and E, respec-tively. These compare favorably with the corre-sponding dimensions obtained from the cadaverspecimens.
At each standard axial level, measurements weremade at the outer, inner, and side walls in both themodels and specimens. The circumferential loca-tions were designated in polar coordinates with 0°
Internal Carotid
External Carotid
180*
Common Carotid
Figure 1 . Schematic representation of the axial levels atwhich wall shear stress measurements from the model andintimal thickness data from human carotid arteries werecompared. The orientation for the polar coordinate de-scription of the circumferential sites studied is shown toreach level. For the proximal (B), midsinus (C), and distal(D) internal carotid levels, and for the external carotid level(E), the 0° location is defined by the center of the flowdivider wall. For the common carotid level (A), the 0° loca-tion is on the side corresponding to the origin of the exter-nal carotid.
at STANFORD UNIV MEDICAL CENTER on August 8, 2007 atvb.ahajournals.orgDownloaded from

SHEAR STRESS AND CAROTID ATHEROSCLEROSIS Ku et al. 295
corresponding to the inner wall or flow divider, 180°corresponding to the outer wall opposite the flowdivider, and 90° or 270° corresponding to the sidewall locations. For the common carotid arteries (Lev-el A), the side corresponding to the external carotidartery was taken as the 0° index point. Because ofthe symmetry of the model in the plane of the bifurca-tion, conditions at 90° and 270° were similar. Wallshear stress and intimal thickness were thereforedetermined at a total of 20 sites.
Pulsatile Flow Conditions and Fluid DynamicMeasurements
The working fluid was a mixture of water and glyc-erin adjusted to yield an absolute viscosity of 0.14g/cm/sec and a kinematic viscosity of 0.12 cm2/sec.The fluid was pumped from an upstream tankthrough an electronically controlled shaker valve intoa straight tube 3 meters long to achieve fully devel-oped pulsatile laminar flow at the entrance to thebifurcation. The servo-driven valve directed fluid ei-ther through the test section or through a bypasstube to create the pulsatile wave form. The pumpingsystem could be programmed to reproduce a widerange of wave forms and had a linear frequency re-sponse up to 15 Hz. The pulsatile wave form used forthe present study was a replica of a carotid flowpattern obtained by noninvasive ultrasound Dopplervelocimetry in a 22-year-old man with no angio-graphic evidence of arterial stenosis.4 Fluid leavingthe internal carotid branch of the model flowed di-rectly into a low resistance, constant-head tank to berecycled, while fluid in the external carotid branchflowed into a 0.94 cm collapsible tube enclosed in apressure chamber. The tube diameter could be con-trolled by varying the chamber pressure, therebypermitting adjustment of the flow division betweeninternal and external carotid branches.
For the present study, the collapsible tube cham-ber was adjusted to provide 45% mass flow in theexternal carotid artery during peak systole and 30%mean flow over the pulsatile cycle. Electromagneticflow meters monitored flow continuously in eachbranch. The wave form and amplitude were adjustedto correspond to a mean flow of 5 ml/sec (Re = 300)and a peak flow of 13 ml/sec at a Reynold's numberof 800, typical conditions for a normal adult humancarotid.5 The Reynolds number, Re = VD/v, wasderived for a common carotid artery diameter of 6.1mm and a blood viscosity of 0.035 cm2/sec. The totalmass flows for the common, internal, and externalcarotid arteries are illustrated in Figure 2, scaled forthe in vivo conditions previously described.
Flow Velocity
Flow velocity was measured with a DISA 55L MarkII laser Doppler anemometer system with a samplevolume of 1.08 mm in length and 0.12 mm in diame-ter as described in detail elsewhere.6 This method ofvelocity detection is noninvasive and can distinguish
14-
12-
8 io-CO
i 8-
~ 6-O 4 -
u.2-0^
systole '
A
L\diastole '
• ~ ^ » ^ - y- Common Carotid
*- Internal Carotid
"""~"^"-— ^ f x t e r n g l Carotid
90 180 270Pulse Cycle (degrees)
360
Figure 2. The volume flow rate, as a function of phaseangle within the pulse cycle, for the common, internal, andexternal carotid arteries of the model. The cardiac cycle isdivided into 360° for phase representation, and systoleoccupies 0° to 130° of the full cycle. The values for flow arenot the actual flow rates in the apparatus, but have beenscaled to the conditions appropriate to human vesselsusing fluid dynamics similarity principles.
between negative and positive velocities. Two veloc-ity components (axial and circumferential) weremeasured both in the plane of the bifurcation andperpendicular to this plane. At the walls, the two ve-locity components were combined to yield the mag-nitude and direction of velocity parallel to the wall,i.e., the velocity that induces wall shear stress. Thevelocity measurements indicated that the circumfer-ential velocity component very near the walls in theplane of the bifurcation, i.e., the inner (6 = 0°) andouter (0 = 180°) walls, was negligible; and hence thewall shear stress vectors at these locations weredefined by the axial components.
Wall Shear Stress
Stress was calculated as a function of time duringthe cycle at each location using a least-squares fit ofthree radial stations measured very close to the wallaccording to the defining relationship:
Tw = fJ.A VAr
(1)
where T*W is the wall shear stress, fj. is the absoluteviscosity, V is the velocity parallel to the wall, and r isthe radial distance from the wall. From this result forT*W, it was possible to determine various shear stressindices such as maximum, minimum, and mean wallshear stress. To correlate the excursion of shearstress over the cardiac cycle with lesion thickness,pulse shear stress, defined as maximum-minimumshear stress, was also calculated for each axial andpolar location. Previous studies in steady flowshowed that the method for estimating wall shearstress from the measured velocity profiles gave val-ues within 15% of the theoretical Poiseuille result inthe common carotid artery proximal to the bifurca-tion.6
at STANFORD UNIV MEDICAL CENTER on August 8, 2007 atvb.ahajournals.orgDownloaded from

296 ARTERIOSCLEROSIS VOL 5, No 3, MAY/JUNE 1985
Oscillatory Shear Index
An oscillatory shear index (OSI) was formulated toaccount for the cyclic departure of the wall shearstress vector from its predominant axial alignment(see Appendix A). The rationale for development ofthe OSI is as follows. In the common carotid artery,flow velocity near the wall, while pulsatile, is contin-ually directed forward or cephalad, resulting ir, wallshear stress that acts in the positive axial direction.This is also true along the inner wall (0°) at the flowdivider, although the magnitude of the shear stressat this level is much higher than at the common carot-id level. A different wall.shear stress behavior was,however, observed at the outer (180°) and side (90°,270°) walls of the bifurcation branches, particularly inthe internal carotid sinus. At the 180° position forexample, the near wall velocity in the sinus wasfound to be negative during segments of the cycle,leading to a wall shear stress vector that transientlyalternated between the positive and negative axialdirections.
At the side walls of the branches (90° and 270°),helical flow patterns developed and resulted in astress vector in which the direction changed withtime. Thus, to provide an index which describes thedegree of deviation of the wall shear stress from itsaverage direction, we defined the OSI as follows:
270°
OSI =dt
dt(2)
where T is the duration of the cycle, x*w is the total,instantaneous wall shear stress vector and T* is thestress component acting in the direction opposite tothat of the temporal mean shear stress for the inner(0°) and outer (180°) walls, and the component act-ing at 90° to the angular orientation of this meanshear stress vector for the side walls (0 = 90°, 270°).This index represents a measure of the shear stressacting on the luminal surface due to either "cross-flow" or reverse flow velocity components occurringduring pulsatile flow.
Quantitatlon of Intimal Plaque Thickness inHuman Specimens and Comparison with ShearStress Data
Before sectioning the arteries at the standard axiallevels, sutures were sewn into the adventitia over thefull length of the specimen to mark the location of thecenter of the flow divider and the center of the medialside wall.1 This established the 0° and 90° circumfer-ential positions for polar coordinate mapping of le-sion thickness on histologic sections (Figure 3).Transverse rings were then removed at the standardlevels and processed for light microscopy. Paraffin-embedded tissues were sectioned at 7 /urn and werestained with hematoxylin and eosin. The Gomoritrichrome-aldehyde fuchsin method was used to
Figure 3. A typical transverse section through the mid-sinus region of the internal carotid surgery (Level C). Polarcoordinates corresponding to the circumferential points atwhich intimal thickness was measured are indicated. Notethe eccentric localization of plaque along outer wall (180°)of the carotid sinus and the minimal intimal thickeningalong the inner wall of the sinus (0°). The lumen was filledwith the contrast medium-gelatin mixture used to obtainangiograms and maintain vessel configuration during pro-cessing. Gomuri trichrome stain, x 16.
stain connective tissue fibers. Images of the histo-logical sections were projected onto a digitizing tab-let and the contours of the lumen, the internal elasticlamina, and the outer limit of the media were tracedas described previously. The resulting data werestored and processed in a microcomputer and theintimal thickness at the four circumferential locations(0°, 90°, 180°, 270°) was computed for each section.Correlations were calculated between intimal thick-ness at each standard location in the cadaver bifur-cations and the measured and computed hemody-namic variables in the model carotid bifurcations.Statistical analysis of the correlations was performedusing the method of least squares with a two-sided ttest for significance levels.
ResultsCommon Carotid Artery
Wall shear stress in the common carotid artery(Level A) ranged from 3 to 28 dynes/cm2 with a meanof 7 dynes/cm2 and was the same at all points aboutthe circumference (Table 1). The shear stress vectorwas aligned in the forward axial direction throughoutthe pulse cycle, and the oscillatory shear index waszero. Intimal thickness ranged from 0.10 ± 0.02 mmto 0.15 ± 0.03 mm with no differences in thicknessamong the four measurement sites about the circum-ference.
at STANFORD UNIV MEDICAL CENTER on August 8, 2007 atvb.ahajournals.orgDownloaded from
SHEAR STRESS AND CAROTID ATHEROSCLEROSIS Ku et al. 297
Table 1. Pulsatile Shear Stress and Intimal Dimensions at the Carotid Bifurcation
A.
B.
C.
D.
E.
Level
Common carotid
Proximal internal carotid
Midpoint carotid sinus
Distal internal carotid
External carotid
Polarposition
00
90180270
090
180270
090
180270
090
180270
090
180270
Model flow results
Pulsatile shear stress(dynes/cm2)
Max
29282828
50114
11
41306
30
109704970
56733573
Min
3333
171
- 71
105
- 1 35
35231623
450.35
Mean
8777
263
-0.53
178
-0.78
45292029
14176
17
OSI*
0000
00.070.320.07
00.040.350.04
00.0100.01
00.0300.03
Intimalthickness
(mm)
0.10 + 0.020.15 ±0.030.12 ±0.030.10 ±0.02
0.14±0.050.47±0.130.63±0.170.37±0.10
0.19±0.070.24 ±0.050.49±0.100.31 ±0.07
0.07 ±0.020.06 ±0.010.08 ±0.040.09 ±0.04
0.27 + 0.150.08 ±0.020.12±0.050.15±0.05
*OSI = oscillatory shear index; see text.
Proximal Internal Carotid
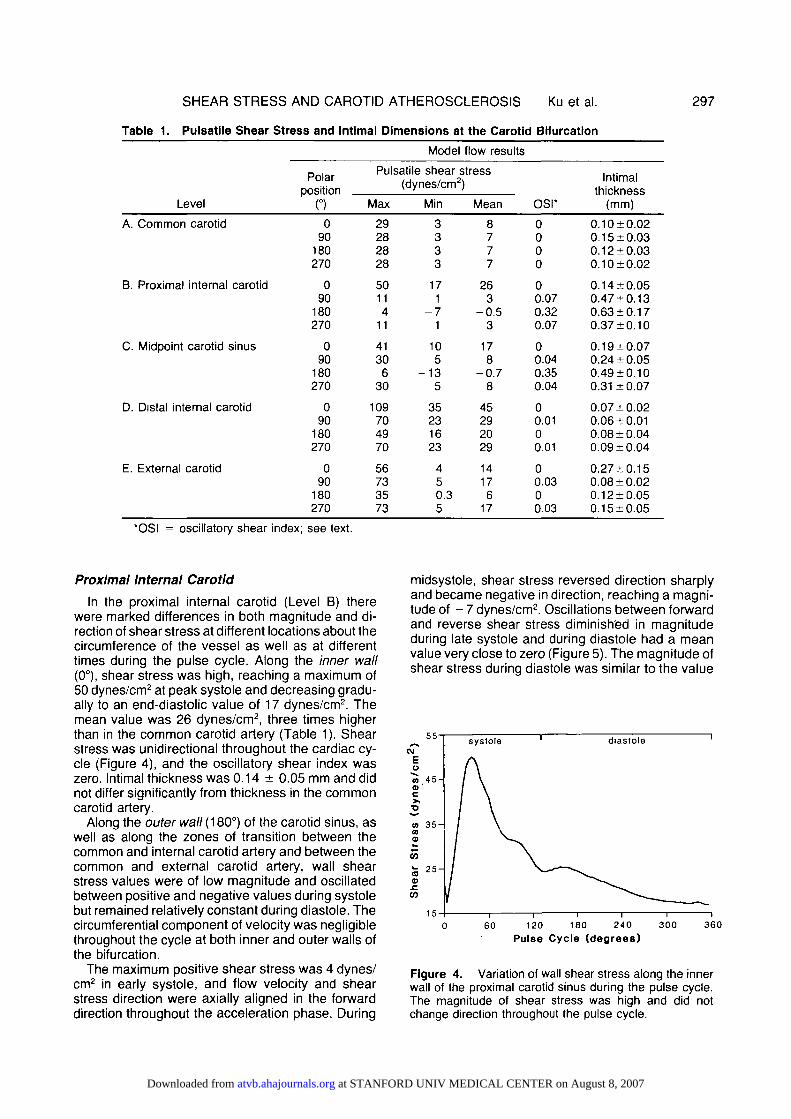
In the proximal internal carotid (Level B) therewere marked differences in both magnitude and di-rection of shear stress at different locations about thecircumference of the vessel as well as at differenttimes during the pulse cycle. Along the inner wall(0°), shear stress was high, reaching a maximum of50 dynes/cm2 at peak systole and decreasing gradu-ally to an end-diastolic value of 17 dynes/cm2. Themean value was 26 dynes/cm2, three times higherthan in the common carotid artery (Table 1). Shearstress was unidirectional throughout the cardiac cy-cle (Figure 4), and the oscillatory shear index waszero. Intimal thickness was 0.14 ± 0.05 mm and didnot differ significantly from thickness in the commoncarotid artery.
Along the outer wall (180°) of the carotid sinus, aswell as along the zones of transition between thecommon and internal carotid artery and between thecommon and external carotid artery, wall shearstress values were of low magnitude and oscillatedbetween positive and negative values during systolebut remained relatively constant during diastole. Thecircumferential component of velocity was negligiblethroughout the cycle at both inner and outer walls ofthe bifurcation.
The maximum positive shear stress was 4 dynes/cm2 in early systole, and flow velocity and shearstress direction were axially aligned in the forwarddirection throughout the acceleration phase. During
midsystole, shear stress reversed direction sharplyand became negative in direction, reaching a magni-tude of - 7 dynes/cm2. Oscillations between forwardand reverse shear stress diminished in magnitudeduring late systole and during diastole had a meanvalue very close to zero (Figure 5). The magnitude ofshear stress during diastole was similar to the value
15 -r60
-i r120 180 240
Pulse Cycle (degrees)300 360
Figure 4. Variation of wall shear stress along the innerwall of the proximal carotid sinus during the pulse cycle.The magnitude of shear stress was high and did notchange direction throughout the pulse cycle.
at STANFORD UNIV MEDICAL CENTER on August 8, 2007 atvb.ahajournals.orgDownloaded from

298 ARTERIOSCLEROSIS VOL 5, No 3, MAY/JUNE 1985
60 120 180 240Pulse Cycle (degrees)
300 360
Figure 5. The wall shear stress at the outer wall of thecarotid sinus (Level B). This curve was derived from near-wall velocity data such as that shown in Figure 6. Theshear stress oscillation from positive to negative valuessystole is characteristic of locations along the outer wall ofthe sinus.
oCDCO
—.Eo
ro
o
-2
systole diastole
60 120 180 240Pulse Cycle (degrees)
300 360
Figure 6. The axial velocity component measured verynear (1.5 mm) to the outer wall of the proximal internalcarotid sinus (Level B) in the model. The velocity duringearly systole was initially forward. During the time for whichthe flow in the common carotid and its branches was high,however, the near-wall velocity shown here reversedsharply. During diastole, the velocity at the outer wall wasvery nearly zero.
in this location previously reported for steady flow ata comparable Reynolds number (0 dynes/cm2).6 Thecorresponding variation in flow velocity during thepulse cycle at a luminal position 1.5 mm from theouter wall of the model proximal carotid sinus isshown in Figure 6. The oscillatory shear index washigh (0.32) at this location as was intimal thickness(0.63 ± 0.17 mm) (Table 1).
Shear stress at the side wall (90° and 270° withrespect to the flow divider) exhibited a complex pat-tern of directional changes reflecting the evolvingvortex structures in the flow field described earlier.2
The wall shear stress vector rotated through 70° ofarc during systole as shown in Figure 7. The vectorwas inclined 15° to the longitudinal axis in early sys-tole, but rotated to a position nearly perpendicular tothis axis at the peak of systole. During diastole, theshear stress vector stabilized at a mean value in-clined approximately 33° to the axis. The magnitudeof shear stress at the side walls was less than alongthe inner wall and changed during the pulse cyclefrom a maximum of 11 dynes/cm2 to a minimum of 1dyne/cm2 with a mean of 3 dynes/cm2. The oscilla-tory shear index was 0.07 and intimal thickness wasgreater than at the inner wall or in the common carot-id artery (Table 1).
Midpoint of Carotid Sinus
Measurements of shear stress at the midpoint ofthe internal carotid sinus (Level C) revealed a morelimited range of variation in direction and magnitudebut showed characteristics similar to those at theproximal internal carotid level (Level B). At the innerwall (0°), shear stress at the mid-sinus level variedbetween 10 and 41 dynes/cm2 with mean of 17dynes/cm2. The oscillatory shear index was zero,and intimal thickness was no different from the thick-ness in the common carotid artery. Along the outer
mw<D
CO(0©
. cCO
Eo
[dyn
es/
tude
iiagn
1 £.-
8 -
4-
0-
.systole '
Adiastole '
, — ,-. • -In . f
3 60-co
Q
70 °of 180 240 300 360
60 120 180 240 300
Pulse Cycle (degrees)360
Figure 7. The shear stress vector at the side walls of thecarotid sinus (Level B) changed in both magnitude anddirection during the flow cycle. The upper curve illustratesthe rapid increase and decrease in the magnitude of thewall shear stress occurring with each systole, and the rela-tively constant value during diastole. The lower curve givesthe variation in the shear stress vector direction. 0° is takento be aligned along the axis of the internal carotid artery.The vector changed direction sharply during systole over arange from 15° to 82° before attaining a constant angleduring the latter half of the cycle.
at STANFORD UNIV MEDICAL CENTER on August 8, 2007 atvb.ahajournals.orgDownloaded from

SHEAR STRESS AND CAROTID ATHEROSCLEROSIS Ku et al. 299
wall, shear stress was low, ranging between + 6 and-13 dynes/cm2 during systole before returning to anend-diastolic value of -0 .7 dynes/cm2. The oscilla-tory shear index was high (0.35) and the intima wasthickened (0.49 ± 0.10 mm) compared to the innerwall and common carotid. The orientation of the sidewall shear stress vector alternated over a range of40° with an average angle of 46° with respect to thelongitudinal axis of the internal carotid artery.
Distal Internal Carotid
Shear stress increased markedly in the distal inter-nal carotid (Level D) at all points about the circumfer-ence as flow accelerated into the smaller diametervessel from larger carotid sinus. Shear stressreached a maximum value of 109 dynes/cm2 at theinner wall and had a mean value over the cycle of 45dynes/cm2. At the outer wall, shear also increased toa maximum of 49 dynes/cm2 with a mean value of 20dynes/cm2. Flow was unidirectional, flow distur-bances were absent or minimal, and intimal thick-ness was minimal, ranging from 0.06 ± 0.01 mm to0.09 ± 0.04 mm.
External Carotid
The external carotid (Level E) was also a site ofhigh, unidirectional wall shear stresses, but changesduring the cycle were not large. There was a sugges-tion of increased intimal thickness along the innerwall relative to the outer wall, but this was not statisti-cally significant (Table 1).
Correlation of Shear Stress With IntimalThickness
When all 20 measurement locations were consid-ered, intimal thickness bore an inverse relationshipto both maximum shear stress (r = - 0.69) and mini-mum shear stress (r = -0.63), but these resultswere not statistically significant. Intimal thickeningdid, however, correlate strongly with the reciprocal ofthe maximum shear stress attained during the cycle(r = 0.90, p < 0.0005) and with the reciprocal of themean shear stress averaged over the cycle (r =0.82, p < 0.001), indicating that intimal thickeningdoes not occur in areas of high wall shear stress butdevelops in regions with a very low magnitude ofmaximum shear or time-averaged mean shear (Ta-ble 2). Pulse shear stress (maximum-minimumshear) had an inverse relationship with lesion thick-ness (r = -0.61), but the result was not statisticallysignificant. The oscillatory shear index, however,yielded a significant correlation with intimal thickness(r = 0.82, p < 0.001). When only the inner and outerwall measurement locations were considered, i.e.,the locations where lesions were maximal and mini-mal (Table 2), correlations between intimal thicknessand the reciprocals of wall shear were especiallystriking: reciprocal of maximum shear stress, r =0.94 (p < 0.001); reciprocal of mean shear stress,r = 0.95 (p < 0.001); oscillatory shear index, r =
0.93 (p < 0.001). The close correspondence amongintimal thickness, 1/maximum shear, 1/mean shearand oscillatory shear index is represented graphical-ly in Figure 8.
Table 2. Correlation of Shear Stress Variables withIntimal Thickness at the Human Carotid Bifurcation*
Hemodynamic variable
All data points (n = 20)Maximum shearMean shear1/Maximum shear1/Mean shearPulse shearOscillatory shear index (OSI)
Outer and inner wall only1/Maximum shear1Mean shearOscillatory shear index (OSI)
r
-0.69-0.63
0.900.82
-0.610.82
0.940.950.93
P
NSNS
<0.0005<0.001
NS<0.001
<0.001<0.001<0.001
'The correlation technique used here assumes a linearassociation and normally distributed variables. To studythese assumptions, a residual analysis was performed.The information obtained from scatter plots of residualsversus the independent variables and from normal prob-ability plots indicate that the above assumptions are valid.Plots of intimal thickness versus each of the independentvariables also support the assumptions. Therefore, a cor-relation analysis appears to be appropriate for these ex-perimental data. Since the correlations are based on aver-ages, the strength of associations could be overestimated.
thickening
Shear
Shear
Oscillatory Shear Index
Common ProximalCarotid
Mid Distal
INTERNAL CAROTID
ExternalCarotid
Figure 8. Graphical representation of the relativechanges in intimal thickness of the internal carotid arteryalong the outer wall of the carotid bifurcation comparedwith the relative changes in the hemodynamic variables of1/maximum shear stress, 1/mean shear stress, and oscil-latory shear index at the five levels of the section as de-fined in Figure 1. All values were normalized to the maxi-mum value as measured at the proximal internal carotidouter wall.
at STANFORD UNIV MEDICAL CENTER on August 8, 2007 atvb.ahajournals.orgDownloaded from

300 ARTERIOSCLEROSIS VOL 5, No 3, MAY/JUNE 1985
Discussion
Under conditions of pulsatile flow, the inner wall ofthe carotid bifurcation in the region of the flow dividerand the distal internal carotid artery are subjected,on the average, to relatively high shear stress, whilethe outer wall of the carotid sinus is a region of rela-tively low shear stress. The side walls of the sinus, aswell as of the common carotid artery, are exposed tointermediate levels of shear stress magnitude, butthe carotid bulb shows large regions with helical flowpatterns and oscillations in shear stress direction.Although the distribution of mean wall shear stressunder conditions of pulsatile flow is consistent withexpectations extrapolated from previous steady flowstudies,6 pulsatile flow results in unsteady fluid dy-namic behavior that may be important in atherogene-sis. For example, pulsatility generates a changingregion of flow reversal and separation that disap-pears during early systole but redevelops during latesystole into a separation region larger than that pre-dicted by steady flow modeling. The magnitudes ofwall shear stresses measured late in diastole are inagreement with those measured under conditions ofsteady flow at corresponding Reynolds numbers.During systole, however, pulsatile flow causes sig-nificant fluctuations in the magnitude of wall shearstress. Maximum shear stress in the common carotidartery during the peak of systole was approximatelytwice as large as that measured during steady flow atRe = 800, due in large part to the fact that unsteadyvelocity profiles under these flow conditions arecharacteristically blunt during acceleration. Althoughthe mean shear was low at the outer wall of the sinus,the pulsatile maximum wall shear stress at this loca-tion was considerably greater than with steady flow,transiently reaching the same magnitude as themean wall shear stress in the common carotid artery.
Our finding that intimal thickness bears an inverserelationship to the magnitude of shear stress is con-sistent with our previous studies in the carotid bifur-cation using steady flow as well as with studies byFriedman, et al,7 of the human aortic bifurcationusing pulsatile flow. These authors measured axialvelocity in a cast of a human aortoiliac bifurcationand found a negative correlation between intimalthickness and maximum, mean, and pulse shearwith correlation coefficients ranging from -0.628and -0.685. These values compare well with ournegative correlations of -0.61 to -0.69 for thesame measures of shear. Our finding of a muchstronger correlation between intimal thickness andthe reciprocal of maximum and mean shear sug-gests that a threshold value of shear stress magni-tude may be important in plaque development.
The quantitative measurements reported herehelp to explain some of the features of pulsatile flowdemonstrated in our previous qualitative studies.2
Visualization of flow in a glass model by means ofhydrogen bubbles showed strong variations in theextent of the separation region and sharp changes in
the vortex structures within the sinus. Bubbles at theouter wall of the sinus tended to remain in this loca-tion for several cycles, indicating an increased fluidresidence time. The present laser Doppler veloci-meter studies in the Plexiglas model indicate that theincreased residence time of bubbles at the outer wallis caused by the oscillation of fluid velocity about amean value close to zero, thereby delaying the con-vection of fluid and trapping fluid elements near theouter wall for several cycles despite the absence of aregion of stasis or permanent boundary layer sepa-ration.
The outer wall, where atherosclerosis is mostprominent initially, is thus a site of low, time-aver-aged, mean shear stress and oscillatory shearstress. Both low mean shear stress and oscillatoryshear stress contribute to an increased fluid resi-dence time in the carotid sinus. The increased fluidresidence time may result in modification of the masstransport of atherogenic substances between lumenand wall or in interference with endothelial metabo-lism by mechanisms suggested by Caro et al.8 andRobertson.9 In addition, blood-borne cellular ele-ments such as platelets and macrophages, said toplay a role in atherogenesis, would be expected tohave an increased probability of deposition or adhe-sion in regions of increased residence time.10
The oscillating shear stress pattern in areas dis-tant from the flow divider in the carotid sinus may initself cause an increased ingress of plasma constitu-ents through the endothelial monolayer by effects onthe stability of intercellular junctions. Since endothe-lial cells normally align with assumed unidirectionalflows1112 in an overlapping arrangement,13 in-creases in permeability with changing shear stressmay be caused by cyclic shifts in the relationshipsbetween shear stress direction and the orientation ofintercellular overlapping borders. This hypothesisagrees well with reports of increased permeability ofcultured, confluent endothelial cells subjected tochanges in shear stress12 and increased Evans bluedye staining in relation to differences in endothelialorganization14 that may be attributable to changingflow patterns.
There are at least two differences between in vivoblood flow and conditions in the Plexiglas modelused in these experiments. First, the bifurcationmodel is rigid, while blood vessels are viscoelastic.Although the deformable nature of the vessel may beimportant in wave reflection and propagation, theeffects of vessel compliance on local velocity profilesare very much smaller than the effects of branchangle, flow pulse shape, and flow partition ratio.15
Second, the fluid used in the model experiments isNewtonian as compared with the non-Newtonianproperties of blood. Since the diameter of a typicalmedium-sized artery is 1000 times that of the redblood cell and the transient shear rates are sufficient-ly high to disrupt rouleaux formation, the use of aNewtonian fluid would not contribute to a misinter-pretation of the major findings. The 125:1 scaling of
at STANFORD UNIV MEDICAL CENTER on August 8, 2007 atvb.ahajournals.orgDownloaded from

SHEAR STRESS AND CAROTID ATHEROSCLEROSIS Ku et al. 301
our model assured sufficient accuracy of the shearstress estimations since the ratio of velocity mea-surement volume to tube diameter was small.Changes in flow partitioning between the two branchvessels during the cardiac cycle, a factor that hasbeen shown to strongly affect the flow field, was alsoincorporated into our model, and the reproduction inthe carotid model of a physiologic flow pulse wasmade possible through the use of a programmablepump. The recent, noninvasive detection of a tran-sient region of separated, reverse flow in young nor-mal adults gives strong confirmation to the accuracyof the modeled hemodynamics.16
Since our model was based on average dimen-sions of a large number of human carotid bifurca-tions, the data presented here should be more widelyapplicable to further anatomic studies than informa-tion obtained from models of individual artery speci-mens. Individual models may tend to reproduce spe-cial flow characteristics that may not correlate wellwith the usual distribution of atherosclerotic plaquesin the region under study. Nevertheless, several ofthe factors that influence internal carotid velocity pro-files should show marked individual variations thatcould affect both the location and the severity of dis-ease. One variation is the branch angle, whichshowed a large standard deviation around the meanvalue.3 Model studies of flow in idealized branchesindicate that greater angles produce larger separa-tion regions. Thus, carotid bifurcations with relativelylarge branch angles would have larger outer wallareas subjected to nonaxial shear stresses and pos-sibly more extensive intimal plaque formation.
The carotid pulse wave form could also be a sig-nificant contributing factor. Different pulse shapeswould affect the formation and size of the separationregion, the extent of flow reversal, and the size andposition of the zone of increased residence time. Thepulse shape is determined by wave reflections,speed of propagation, anatomic tapering of the bloodvessels, and cardiac output.15
Elevated heart rates should increase exposure ofthe outer and side walls of the sinus to oscillatoryflow fields, for increased heart rate would increasethe relative time spent in systole, as compared todiastole, time during each cardiac cycle. The degreeto which any of these factors could be modified bytherapeutic intervention in order to affect the onsetand progression of carotid bifurcation atheroscleroticdisease remains to be explored.
In conclusion, comparison of detailed pulsatilehemodynamic measurements with quantitative mor-phologic studies of the distribution of atherosclerosisin the human carotid bifurcation revealed that lowmean shear stress and marked oscillations in thedirection of wall shear stress may be critical factors inthe development and localization of atheroscleroticplaques. Since turbulence was not observed withflow visualization2 nor detected in the present veloc-ity measurements, we suggest that turbulence is nota prominent feature at sites of early plaque forma-
tion. Furthermore, the results imply that high unidi-rectional shear stress may exert a protective effectagainst the induction of lesions. Hypotheses regard-ing relationships between shear stress or otherhemodynamic variables and the pathogenesis ofatherosclerosis should be tested in accurate modelsof vessel geometry and corresponding pressure-fixed specimens.
AcknowledgmentsThe authors thank Regina Stankunavicius for assistance with
the statistical analyses, Jacqueline Jordan for technical assis-tance, and Althea Zmuidzmas for preparation of the manuscript
References1. Zarlns CK, Glddens DP, Bharadva] BK, Sottlural VS, Ma-
bo n RF, Glagov S. Carotid bifurcation atherosclerosis-Quantitative correlation of plaque localization with flow veloc-ity profiles and wall shear stress. Circ Res 1983;53:502-514
2. Ku DN, Giddens DP. Pulsatile flow in a model carotid bifurca-tion. Arteriosclerosis 1983;3:31-39
3. Bharadva] BK, Mabon RF, Glddens DP. Steady flow in amodel of human carotid bifurcation- Part I. Flow visualization.J Biomech 1982;15.349-362
4 Ku DN. Hemodynamics and atherogenesis at the human ca-rotid bifurcation [Dissertation]. Atlanta, Georgia: Georgia In-stitute of Technology, 1983
5. Bloch KE. Quantifizierung der Blutstromung im Bereiche derCarotisbifurcation mittels Ultrasctiall [Dissertation]. Zurich.University of Zurich, 1981
6. Bharadvaj BK, Mabon RF, Glddens DP. Steady flow in amodel of the human carotid bifurcation: Part II. Laser Doppleranemometer measurements J Biomech 1982;15-363-378
7. Friedman MH, Hutchlns GM, Bargeron CB, Deters OJ,Mark FM. Correlation between intimal thickness and fluidshear in human arteries. Atherosclerosis 1981 ;39425—436
8. Caro CG, Frtz-Gerald JM, Schroter RC. Atheroma and arte-rial wall shear: Observation, correlation and proposal of ashear dependent mass transfer mechanism for atherogene-sis. Proc R Soc Lond (Biol) 1971 ;117:109-159
9 Robertson AJ Jr. Oxygen requirements of the human arteri-al intima in atherogenesis Prog Biochem Pharmacol 1968;4:305-316
10. Parmentier EM, Morton WA, Petschek HE. Platelet aggre-gate formation in a region of separated blood flow. PhysFluids 1981;20:2012-2021
11. Nerem RM, Levesque MJ, Cornhlll JF. Vascular endothehalmorphology as an indicator of the pattern of blood flow. JBiomech Eng 1981;1O3:171-176
12. Dewey CF, Bussolarl SR, Glmbrone MA, Davles PF. Thedynamic response of vascular endothelial cells to fluid shearstress. J Biomech Eng 1981;103:177-185
13. Clark JM, Glagov S. Luminal surface of distended arteries byscanning electron microscopy. Eliminating configurationalartifacts. Br J Exp Pathol 1976;57:129-135
14. Fry DL. Responses of the arterial wall to certain physicalfactors. Ciba Found Symp 1973; 12:93-125
15. Oddou C, Flaud P, Gelger D. Model of nonlinear viscoelasticwall rheology applied to arterial dynamics. In: Bauer RD,Busse R, eds. The arterial system. Berlin: Springer-Verlag,1978-101
16. Ku DN, Phillips DJ, Giddens DP, Strandness DE. Hemo-dynamics of the normal human carotid bifurcation: in vitro andin vivo studies. Ultrasound Med Biol (in press)
at STANFORD UNIV MEDICAL CENTER on August 8, 2007 atvb.ahajournals.orgDownloaded from

302 ARTERIOSCLEROSIS VOL 5, No 3, MAY/JUNE 1985
Appendix A
Oscillatory Shear Index
The purpose of the oscillatory shear index (OSI) is toprovide a numerical parameter for the shear stress im-posed on the arterial wall in pulsatile flow, and specificallyto provide an index which describes the shear stress actingin directions other than the direction of the temporal meanshear stress vector. In view of the fact that our velocityprofile measurements were taken only at the inner, outer,and side walls (G = 0°, 180° and 90° or 270°, respectively),we defined the OSI by the relation
OSI = fl dt
fl I rw | dt(A-1)
where f*w is the instantaneous wall shear stress vector andr* is either the wall shear stress component acting in thedirection opposite to the temporal mean wall shear stressvector for the case of inner and outer walls or the compo-nent acting at 90° to f*w or the case of the side walls. In thecases we studied, the F* contribution is thus due either toa "locally reversed" wall shear stress direction for 0 = 0°and 180° or to a cross-flow component for G = 90° and270°.
In general, however, a point along the arterial wall mayexperience both reverse and cross-flow shear stress com-ponents simultaneously. For such cases, we propose thatthe appropriate definition of OSI is
OSI = 52(+)'!dt
fl I r» | dt(A-2)
where 4> is defined as the angle between the instantaneouswall shear stress vector f*w and the temporal mean wallshear stress vector, and 5,(4>) and (t>2(4>) are defined by
1 ,0°<<j><180°5,(4>) =
0 , otherwise
, 90°<4><270°
, otherwise
This formula reduces to Equation (A-1) for the specialcases of inner, outer, and side walls, as follows:(1) Inner wall = neither circumferential nor reverse com-
ponents are present so that <j> = 0° for allvalues of time and 52(4>) = 0, yielding OSI= 0
(2) Outer wall = no circumferential components are pres-ent but reverse components exist, so thateither <\> = 0° or 180° and the equationbecomes
OSI = JOT52(4>) coscj) | dt
fl I rw | dt(3) Side walls = no reverse components were present in
our measurements, only cross-flow com-ponents for which | 4> | <90° and theequation becomes
OSI = /o»i(4>) sine)) | dt
fl dt
It should be noted that if the wall shear stress at a point ispurely oscillatory, i.e., equal excursions of | fw | but inopposite directions, the OSI -> Vfe.
Index Terms: atherosclerosisplaque localization
shear stress • shear oscillation • pulsatile flow • carotid
at STANFORD UNIV MEDICAL CENTER on August 8, 2007 atvb.ahajournals.orgDownloaded from