DIVERSIDAD FUNCIONAL Y DIVERSIDAD FILOGENÉTICA EN LOS...
168
TESIS DOCTORAL ELIZABETH GUSMÁN MONTALVÁN DIVERSIDAD FUNCIONAL Y DIVERSIDAD FILOGENÉTICA EN LOS BOSQUES SECOS DEL SUR DEL ECUADOR.
Transcript of DIVERSIDAD FUNCIONAL Y DIVERSIDAD FILOGENÉTICA EN LOS...

TESIS DOCTORAL
ELIZABETH GUSMÁN MONTALVÁN
DIVERSIDAD FUNCIONAL Y DIVERSIDAD
FILOGENÉTICA EN LOS BOSQUES SECOS DEL SUR
DEL ECUADOR.


UNIVERSIDAD POLITÉCNICA DE MADRID
E.T.S.I. AGRONÓMICA, AGROALIMENTARIA Y DE BIOSISTEMAS
DEPARTAMENTO DE BIOTECNOLOGÍA-BIOLOGÍA VEGETAL
TESIS DOCTORAL
DIVERSIDAD FUNCIONAL Y DIVERSIDAD FILOGENÉTICA EN LOS BOSQUES
SECOS DEL SUR DEL ECUADOR.
Autor: Elizabeth del Carmen Gusmán Montalván1.
Directores: Dr. Marcelino De la Cruz Rot2. Doctor en Ciencias Biológicas
Dr. Adrián Escudero Alcantara2. Doctor en Ciencias Biológicas
1Departamento de Ciencias Naturales, Universidad Técnica Particular de Loja. Ecuador.
2Área de Biodiversidad y Conservación. Departamento de Biología y Geología, ESCET,
Universidad Rey Juan Carlos.
Madrid, 2015


I
Marcelino de la Cruz Rot, y Adrián Escudero Alcántara, Profesores Titulares del
Departamento de Biología y Geología de la Universidad Rey Juan Carlos
CERTIFICAN:
Que los trabajos de investigación desarrollados en la memoria de la tesis doctoral
“Diversidad funcional y Diversidad filogenética en los Bosques Secos del Sur del
Ecuador”, son aptos para ser presentados por Elizabeth Gusmán Montalván ante el tribunal
que en su día se consigne, para aspirar al Grado de Doctor por la Universidad Politécnica de
Madrid.
Vo.Bo. Director de Tesis VoBo Co-Director de Tesis
Dr. Marcelino de la Cruz Rot Dr. Adrián Escudero Alcántara

II

III
Tribunal nombrado por el Mgfco. y Exmo. Sr. Rector de la Universidad Politécnica de
Madrid, el día ………………. de ……………………………………………….2015.
Presidente: ……………………………………………………………………………………
Secretario: ……………………………………………………………………………………
Vocal: …………………………………………………………………………………………
Vocal: …………………………………………………………………………………………
Vocal: …………………………………………………………………………………………
Suplente: ……………………………………………………………………………………...
Suplente: ……………………………………………………………………………………...
Realizado el acto de defensa y lectura de Tesis el día………….……de
……………………...de 2015 en la E.T.S.I. Ingenieros Agrónomos.
Calificación …………………………………………………………………………………...
……………………………..
EL PRESIDENTE
………………………………..
LOS VOCALES
……………………………….
EL SECRETARIO

IV

V
A mis Padres y hermanos por ser la razón de mi vida.

VI

RESUMEN ........................................................................................................... 1
ABSTRACT ....................................................................................................... 7
INTRODUCCIÓN GENERAL........................................................................ 11
2.1. REGLAS DE ENSAMBLAJE EN LA COMUNIDAD ......................... 13
2.2. OBJETIVOS ............................................................................................ 20
2.3. ÁREA DE ESTUDIO Y METODOLOGÍA GENERAL ....................... 23
CAPÍTULO 1 ..................................................................................................... 36
Environmental variation mediates habitat filtering and limiting similarity in a
Dry Neotropical forest. .................................................................................... 36
CAPÍTULO 2 ..................................................................................................... 66
Linking functional and phylogenetic diversities with assembly processes in a
dry neo tropical forest ...................................................................................... 66
CAPÍTULO 3 ..................................................................................................... 95
¿Actúan los mecanismos de ensamblaje a diferentes escalas espaciales en un
Bosque Seco? ................................................................................................... 95
CAPÍTULO 4 ................................................................................................... 121
Mechanisms of community assemblage at level taxonomic, functional and
phylogenetic in a scale spatial......................................................................... 121
CONCLUSIONES GENERALES ................................................................. 147
AGRADECIMIENTOS .................................................................................. 153
ÍNDICE


1
RESUMEN
Valle de Bursera graveolens (palo santo) en época lluviosa (Zapotillo-Ecuador)

2

3
El concepto tradicional de reglas de ensamblaje refleja la idea de que las especies no co-
ocurren al azar sino que están restringidos en su co-ocurrencia por la competencia
interespecífica o por un filtrado ambiental. En está tesis abordé la importancia de los
procesos que determinan el ensamble de la comunidad en la estructuración de los Bosques
Secos en el Sur del Ecuador.
Este estudio se realizó en la región biogeográfica Tumbesina, donde se encuentra la mayor
concentración de bosques secos tropicales bien conservados del sur de Ecuador, y que
constituyen una de las áreas de endemismo más importantes del mundo. El clima se
caracteriza por una estación seca que va desde mayo a diciembre y una estación lluviosa de
enero a abril, su temperatura anual varía entre 20°C y 26°C y una precipitación promedio
anual entre 300 y 700 mm.
Mi primer tema fue orientado a evaluar si la distribución de los rasgos funcionales a nivel
comunitario es compatible con la existencia de un filtro ambiental (filtrado del hábitat) o con
la existencia de un proceso de limitación de la semejanza funcional impuesta por la
competencia inter-específica entre 58 especies de plantas leñosas repartidas en 109 parcelas
(10x50m). Para ello, se analizó la distribución de los valores de cinco rasgos funcionales
(altura máxima, densidad de la madera, área foliar específica, tamaño de la hoja y de masa de
la semilla), resumida mediante varios estadísticos (rango, varianza, kurtosis y la desviación
estándar de la distribución de distancias funcionales a la especies más próxima) y se comparó
con la distribución esperada bajo un modelo nulo con ausencia de competencia. Los
resultados obtenidos apoyan que tanto el filtrado ambiental como la limitación a la semejanza
afectan el ensamble de las comunidades vegetales de los bosques secos Tumbesinos.
Un segundo tema fue identificar si la diversidad funcional está condicionada por los
gradientes ambientales, y en concreto si disminuye en los ambientes más estresantes a causa

4
del filtrado ambiental, y si por el contrario aumenta en los ambientes más benignos donde la
competencia se vuelve más importante, teniendo en cuenta las posibles modificaciones a este
patrón general a causa de las interacciones de facilitación. Para abordar este estudio
analizamos tanto las variaciones en la diversidad funcional (respecto a los de los cinco rasgos
funcionales empleados en el primer capítulo de la tesis) como las variaciones de diversidad
filogenética a lo largo de un gradiente de estrés climático en los bosques tumbesinos, y se
contrastaron frente a las diversidades esperadas bajo un modelo de ensamblaje
completamente aleatorio de la comunidad.
Los análisis mostraron que tan sólo la diversidad de tamaños foliares siguió el patrón de
variación esperado, disminuyendo a medida que aumentó el estrés abiótico mientras que ni el
resto de rasgos funcionales ni la diversidad funcional multivariada ni la diversidad
filogenética mostraron una variación significativa a lo largo del gradiente ambiental.
Un tercer tema fue evaluar si los procesos que organizan la estructura funcional de la
comunidad operan a diferentes escalas espaciales. Para ello cartografié todos los árboles y
arbustos de más de 5 cm de diámetro en una parcela de 9 Ha de bosque seco y caractericé
funcionalmente todas las especies. Dicha parcela fue dividida en subparcelas de diferente
tamaño, obteniéndose subparcelas a seis escalas espaciales distintas. Los resultados muestran
agregación de estrategias funcionales semejantes a escalas pequeñas, lo que sugiere la
existencia bien de filtros ambientales actuando a escala fina o bien de procesos competitivos
que igualan la estrategia óptima a dichas escalas.
Finalmente con la misma información de la parcela permanente de 9 Ha. Nos propusimos
evaluar el efecto y comportamiento de las especies respecto a la organización de la
diversidad taxonómica, funcional y filogenética. Para ello utilicé tres funciones sumario
espaciales: ISAR- para el nivel taxonómico, IFDAR para el nivel funcional y IPSVAR para

5
el nivel filogenética y las contrastamos frente a modelos nulos que describen la distribución
espacial de las especies individuales. Los resultados mostraron que en todas las escalas
espaciales consideradas para ISAR, IFDAR y IPSVAR, la mayoría de las especies se
comportaron como neutras, es decir, que están rodeados por la riqueza de diversidad
semejante a la esperada. Sin embargo, algunas especies aparecieron como acumuladoras de
diversidad funcional y filogenética, lo que sugiere su implicación en procesos competitivos
de limitación de la semejanza. Una pequeña proporción de las especies apareció como
repelente de la diversidad funcional y filogenética, lo que sugiere su implicación en un
proceso de filtrado de hábitat. En este estudio pone de relieve cómo el análisis de las
dimensiones alternativas de la biodiversidad, como la diversidad funcional y filogenética,
puede ayudarnos a entender la co-ocurrencia de especies en diversos ensambles de
comunidad.
Todos los resultados de este estudio aportan nuevas evidencias de los procesos de ensamblaje
de la comunidad de los Bosques Estacionalmente secos y como las variables ambientales y la
competencia juegan un papel importante en la estructuración de la comunidad.

6

7
ABSTRACT
The traditional concept of the rules assembly for species communities reflects the idea that
species do not co-occur at random but are restricted in their co-occurrence by interspecific
competition or an environmental filter. In this thesis, I addressed the importance of the se
processes in the assembly of plant communities in the dry forests of southern Ecuador.
This study was conducted in the biogeographic region of Tumbesina has the largest
concentration of well-conserved tropical dry forests of southern Ecuador, and is recognized
as one of the most important areas of endemism in the world. The climate is characterized by
a dry season from May to December and a rainy season from January to April. The annual
temperature varies between 20 ° C and 26 ° C and an average annual rainfall between 300
and 700 mm.
I first assessed whether the distribution of functional traits at the level of the community is
compatible with the existence of an environmental filter (imposed by habitat) or the existence
of a limitation on functional similarity imposed by interspecific competition. This analysis
was conducted for 58 species of woody plants spread over 109 plots of 10 x 50 m.
Specifically, I compared the distribution of values of five functional traits (maximum height,
wood density, specific leaf area, leaf size and mass of the seed), via selected statistical
properties (range, variance, kurtosis and analyzed the standard deviation of the distribution of
the closest functional species) distances and compared with a expected distribution under a
null model of no competition. The results support that both environmental filtering and a
limitation on trait similarity affect the assembly of plant communities in dry forests
Tumbesina.

8
My second chapter evaluated whether variation in functional diversity is conditioned by
environmental gradients. In particular, I tested whether it decreases in the most stressful
environments because of environmental filters, or if, on the contrary, functional diversity is
greater in more benign environments where competition becomes more important
(notwithstanding possible changes to this general pattern due to facilitation). To address this
theme I analyzed changes in both the functional diversity (maximum height, wood density,
specific leaf area, leaf size and mass of the seed) and the phylogenetic diversity, along a
gradient of climatic stress in Tumbes forests. The observed patterns of variation were
contrasted against the diversity expected under a completely random null model of
community assembly.
Only the diversity of leaf sizes followed the hypothesis decreasing in as trait variation abiotic
stress increased, while the other functional traits multivariate functional diversity and
phylogenetic diversity no showed significant variation along the environmental gradient.
The third theme assess whether the processes that organize the functional structure of the
community operate at different spatial scales. To do this I mapped all the trees and shrubs of
more than 5 cm in diameter within a plot of 9 hectares of dry forest and functionally
classified each species. The plot was divided into subplots of different sizes, obtaining
subplots of six different spatial scales. I found aggregation of similar functional strategies at
small scales, which may indicate the existence of environmental filters or competitive
processes that correspond to the optimal strategy for these fine scales.
Finally, with the same information from the permanent plot of 9 ha, I evaluated the effect and
behavior of individual species on the organization of the taxonomic, functional and
phylogenetic diversity. The analysis comprised three spatial summary functions: ISAR- for
taxonomic level analysis, IFDAR for functional level analysis, and IPSVAR for phylogenetic

9
level analysis, in each case the pattern of diversity was contrasted against null models that
randomly reallocate describe the spatial distribution of individual species and their traits. For
all spatial scales considering ISAR, IFDAR and IPSVAR, most species behaved as neutral,
i.e. they are surrounded by the diversity of other traits similar to that expected under a null
model. However, some species appeared as accumulator of functional and phylogenetic
diversity, suggesting that they may play a role in competitive processes that limiting
similarity. A small proportion of the species appeared as repellent of functional and
phylogenetic diversity, suggesting their involvement in a process of habitat filtering. These
analysis highlights that the analysis of alternative dimensions of biodiversity, such as
functional and phylogenetic diversity, can help us understand the co-occurrence of species in
the assembly of biotic communities.
All results of this study provide further evidence of the processes of assembly of the
community of the seasonally dry forests as environmental variables and competition play an
important role in structuring the community.

10

Diversidad funcional y filogenética en los Bosques Secos del Sur del Ecuador
11
INTRODUCCIÓN GENERAL
Valle de Bursera graveolens (palo santo) en época seca (Zapotillo-Ecuador)

Diversidad funcional y filogenética en los Bosques Secos del Sur del Ecuador
12

Diversidad funcional y filogenética en los Bosques Secos del Sur del Ecuador
13
2.1. REGLAS DE ENSAMBLAJE EN LA COMUNIDAD
La identificación de los factores que determinan la distribución de las especies y los
mecanismos que regulan su organización en ensambles de la comunidad son un objetivo
central en la ecología vegetal (Crawley 1986), los científicos han buscado reglas o normas
generales que expliquen la distribución de las especies en todas las regiones biogeográficas
(Götzenberger et al 2012). La teoría de biogeografía de islas fue una de las primeras teorías
ecológicas basadas en la idea de que el conjunto de especies en las comunidades están
controladas por normas ecológicas (MacArthur and Wilson 1967). Sin embargo, el término
"regla o norma de ensamblaje" fue presentado por primera vez por Jared Diamond (1975) que
llegó a la conclusión de que las interacciones inter-específicas, y en particular la
competencia, conducen a patrones de co-ocurrencia no aleatoria de las especies, desde
entonces el concepto de estás normas de ensamblaje han sido un tema central en la ecología y
se aplica a una variedad de fenómenos y organismos (Weiher and Keddy 1995).
Según Keddy (1992) un enfoque dominante para estudiar el ensamble de la comunidad es el
análisis de cómo los rasgos funcionales se distribuyen, generalmente los rasgos funcionales
(o traits en inglés) son características morfológicas, fisiológicas y/o fenológicas medibles de
un organismo, y son consideradas funcionales si tiene un impacto en el crecimiento,
reproducción y supervivencia del individuo (Lavorel and Garnier 2002; Cornelissen et ál.
2003; McGill et al. 2006; Violle et al. 2007). Dentro de este enfoque se han propuesto dos
mecanismos principales para explicar el papel de los rasgos funcionales de las plantas,
primero Filtrado de hábitat- selecciona un conjunto de especies con rasgos funcionales
similares este proceso de filtrado conduce a una escasa dispersión en los valores de los rasgos
dentro de las comunidades, es decir, estos filtros abióticos llevan a una distribución de

Diversidad funcional y filogenética en los Bosques Secos del Sur del Ecuador
14
caracteres convergentes o de 'baja dispersión' (Weiher et al. 1995; Cornwell et al. 2006;
Grime 2006).
Segundo el Límite de similitud o diferenciación de nicho impide que las especies que
coexisten sean ecológicamente demasiado similares y conduce a un exceso de dispersión de
los valores de los rasgos dentro de las comunidades (MacArthur y Levin 1967; Weiher y
Keddy 1.995; Grime 2006). Se espera que la competencia pueda crear una distribución
divergente o 'sobre dispersión' de los valores del rasgo entre las especies localmente
concurrentes (MacArthur and Levin 1967).
De acuerdo con una está línea de razonamiento, se espera que los patrones más fuertes de
filtrado en los rasgos funcionales se de en condiciones muy duras (por ejemplo frío o seco),
debido a la fuerte filtrado abiótico (Weiher and Keddy 1995; Cornwell et al. 2006), mientras
que la alta divergencia del rasgo se espera en los hábitats más competitivos y productivos de
acuerdo a la hipótesis de limite de similitud (MacArthur and Levin 1967; Wilson and Stubbs
2012).
Entre la gran cantidad de rasgos medibles sobre un individuo, los de interés para la ecología
funcional deben cumplir al menos cuatro condiciones (Lavorel et al., 2007). Ellos deben: (i)
tener alguna relación con la función de la planta; (ii) ser relativamente fáciles de observar y
rápidos de cuantificar, (iii) ser medibles utilizando protocolos estandarizados; y (iv) tener una
clasificación coherente (Garnier et al, 2001a; Cornelissen et al, 2003a; Mokany et al. 2008).
La mayoría de los rasgos medidos en esta tesis están directamente relacionados con procesos
en el crecimiento, funcionamiento de la planta (McGill et al 2006; Lavorel et al., 2007; Violle
et al 2007) o de su entorno (Lavorel and Garnier 2002).

Diversidad funcional y filogenética en los Bosques Secos del Sur del Ecuador
15
Debido a los vínculos directos entre los rasgos y el funcionamiento de los organismos, la
distribución de rasgos ofrecen una visión de gran alcance en cómo las comunidades se
ensamblan y cómo influyen en los procesos de los ecosistemas (Cornwell y Ackerly 2009,
Díaz et al. 2001). Dado que los rasgos fundamentales que determinan el ensamble de la
comunidad y los procesos de los ecosistemas pueden ser compartidos entre las comunidades
de todo el mundo (Díaz et al. 2004). Entre los más utilizados en los estudios del ensamble de
comunidades tenemos la altura máxima, la densidad de la madera, tamaño de la hoja, área
foliar específica y masa seca de la semilla.
Desde una perspectiva basada en el rasgo, una comunidad puede estar caracterizada por la
distribución de los rasgos funcionales de los individuos que la componen (Ackerly 2003).
Debido a los vínculos directos entre los rasgos y el funcionamiento de los organismos, la
distribución de caracteres ofrecen una visión a gran alcance en ¿cómo las comunidades se
ensamblan y cómo influyen en los procesos de los ecosistemas? (Cornwell y Ackerly 2009,
Díaz et al. 2001). Dado que los rasgos fundamentales que determinan el ensamble de la
comunidad y procesos de los ecosistemas pueden ser compartidos entre las comunidades de
todo el mundo (Díaz et al. 2004), el conocimiento obtenido a través de los enfoques basados
en los rasgos puede ayudar a entender y (McGill et al. 2006), de mejor manera la ecología de
las comunidades.
Enfoques basados en el rasgo en ecología de comunidades vegetales han cobrado impulso en
los últimos 15 años, y se han hecho muchos progresos como el desarrollo de listas de rasgos
funcionales claves que definen aspectos independientes de las estrategias de las plantas
(Weiher et al. 1999), la medición de los rasgos de un gran número de especies y la
compilación de bases de datos de rasgos globales (Kattge et al. 2011), que documentan los
cambios en la distribución de caracteres funcionales a través de gradientes ambientales en el

Diversidad funcional y filogenética en los Bosques Secos del Sur del Ecuador
16
espacio y el tiempo (Fonseca et al. 2000; Wright et al. 2004; Garnier et al. 2004; Kraft et al.
2008).
Aproximaciones actuales en Bosque Seco
A pesar del interés de los estudios basados en los rasgos funcionales en la ecología, la
mayoría de los estos hacen hincapié en los patrones de rasgos en los ecosistemas de bosques
húmedos templados o tropicales. Existiendo pocos estudios relacionados con los patrones de
diversidad con un enfoque en rasgos funcionales en los Bosques tropicales estacionalmente
secos (BTES) u otros ecosistemas limitados por la disponibilidad agua (Chaturvedi et al.
2011, Hulshof et al 2013). La disponibilidad de agua sin lugar a dudas es uno de los factores
limitantes más importantes en los BTES, siendo crítica para el establecimiento, supervivencia
y desarrollo de las plantas (Ruthemberg 1980), condicionando tanto los gradientes espaciales
(Balvanera et al. 2011, Espinosa et al. 2011), procesos ecológicos básicos y las interacciones
bióticas que se establecen en cada bosque (Martínez-Yrizar et al. 1992; Mooney et al. 1993).
Además de la disponibilidad absoluta, la estacionalidad y la variación interanual de la
precipitación marcan la dinámica de las comunidades vegetales y la estructura florística en
los estos bosques secos (Blain and Kellman 1991; Murphy and Lugo 1995; Sampaio 1995).
El éxito de las especies en ocupar diferentes nichos dependerá de la capacidad para tolerar el
estrés hídrico y competir por el agua durante la sequía (Engelbrecht and Kursar 2003).
Mi investigación se oriento en identificar los procesos de ensamblaje de la comunidad
basados en rasgos funcionales en los Bosques Secos del Sur del Ecuador, con el fin principal
de Entender los diferentes procesos que intervienen en la estructuración de la comunidad de
Bosque Seco y conocer como estos procesos influyen en la diversidad funcional y
filogenética de estos bosques.

Diversidad funcional y filogenética en los Bosques Secos del Sur del Ecuador
17
El primer capítulo fue orientado a la teoría del ensamble de la comunidad que considera que
la distribución de los valores de los rasgos funcionales dentro de una comunidad están
condicionados por un “Filtrado” dado por las condiciones ambientales que restringe el rango
de estrategias viables en una comunidad, y que puede también estar dado por un reparto de
micro-sitios y recursos, que condiciona un limite, restringiendo la semejanza funcional de las
especies coexistentes (Cornwell y Ackerly 2009). Nosotros nos hemos propuesto responder si
la distribución de los valores de los rasgos funcionales en los Bosques Secos del Sur del
Ecuador puede tomarse como evidencia de un rango limitado (filtrado por el hábitat) y/o de
un espaciado regular (limite a la semejanza) predicho por la teoría del ensamblaje de las
comunidades, mediante el empleo de modelos nulos e identificando cual es la variable
ambiental predominante con la variación de los rasgos funcionales.
En el segundo capítulo nos hemos centrado en el estudio de la relación entre la diversidad
funcional y filogenética basado en la suposición razonable de que la diversificación evolutiva
ha generado la diversificación de rasgos (Webb 2000). Especies relacionadas (es decir, un
mismo género) son funcionalmente y ecológicamente más similares que especies alejadas
(Webb 2002). Si el filtrado de hábitat es el proceso comunitario las especies deberían ser
filogenéticamente mas relacionadas de lo esperado por azar (Webb et al. 2002; Cavender-
Bares et al. 2004; Losos 2008). Sin embargo, si la divergencia del rasgo es debido a los
procesos de limite de similitud entre las plantas, esto conduce a la predicción de una
estructura filogenético más dispersas, es decir especies que interactúan deben ser menos
relacionado filogenéticamente de lo esperado por azar (Webb et al 2002; Cavender-Bares et
al. 2004; Kraft et al. 2007). Se espera que la importancia de estos procesos opuestos, filtrado
de hábitat y el limitante de similitud, varíen a lo largo de gradientes ambientales, afectando el
conjunto de la comunidad. (Freschet et al. 2011; Violle et al 2012).

Diversidad funcional y filogenética en los Bosques Secos del Sur del Ecuador
18
Con base en estos supuestos, una expectativa generalizada es que la diversidad funcional
disminuye bajo fuerte estrés biótico y aumenta en los habitas más leves (por ejemplo Weither
y Keddy 1995), y que filogenéticamente estén mas agrupado bajo fuerte estrés (por ejemplo
Webb 2000). Aunque estos dos son uno de los principales procesos de la asamblea de la
comunidad hay otros procesos que también puede afectar a la diversidad funcional de la
comunidad y la estructura filogenética (Valiente-Banuet and Verdú 2007; Mayfield and
Levine 2010; Weiher et al. 2011) Por un parte tenemos la facilitación a menudo permite la
coexistencia de especies (Callaway et al. 2002; Brooker et al. 2008; Butterfield 2009) con
diferentes rasgos funcionales (Callaway 2007) y / o filogenéticamente distantes (Valiente-
Banuet et al. 2006) aumento la diversidad funcional y la dispersión filogenético. Y por otra la
competencia puede aumentar la similitud de los rasgos entre las especies ocasionando que
pueden competir relativamente igual (Chesson 2000). Este proceso puede reducir la
diversidad funcional (Chesson 2000; Spasojevic and Suding 2012) y aumentar la dispersión
de las especies en la filogenia.
Bajo estas premisas hemos explorado la diversidad de los bosques tropicales secos del sur de
Ecuador a lo largo de un gradiente ambiental. Tenemos la intención de determinar si la
facilitación modifica la respuesta esperada de ambos procesos mediante la adición de
especies filogenéticamente distantes y funcionalmente a la comunidad a nivel de estrés.
El tercer capítulo fue orientado a cuantificar la dispersión de los rasgo funcionales a lo largo
de una escala espacial a nivel funcional y filogenético. Swenson and Enquist (2009) aplicaron
ambos enfoques en un Bosque Seco Neotropical y encontraron que la combinación del
estudio la diversidad funcional y filogenética y la escala espacial permite un mejor
entendimiento en la estructuración de la comunidad (Kraft y Ackerly 2010). La flexibilidad
del rasgo y los análisis filogenéticos para cuantificar patrones en múltiples escalas espaciales

Diversidad funcional y filogenética en los Bosques Secos del Sur del Ecuador
19
los hace ideales para abordar la cuestión de la dependencia de la escala en la ecología de la
comunidad (por ejemplo, Cavender-Bares et al. 2006; Swenson et al. 2006). Se ha
documentado que la diversidad de especies es promovida y mantenido por los procesos
ecológicos y evolutivos que operan en los rasgos de las especies a través del espacio y el
tiempo.
De modo semejante a lo que pretendemos con el capítulo 2, aplicaremos una aproximación
conjunta (funcional y filogenética) al estudio de una parcela de Bosque Seco de 9 Ha en la
que hemos cartografiado e identificado todos los individuos arbóreos y arbustivos. Esto nos
permitirá conocer como actúan los procesos de ensamblaje de la comunidad a escala espacial
fina y determinar que escalas espaciales resultan más importantes (Kraft y Ackerly 2010). En
este enfoque utilizamos rasgos funcionales, individuales y en combinación (Westoby 1998;
Westoby et al. 2002; Westoby and Wright 2006) cuantificamos la relación entre la dispersión
del rasgo frente a la riqueza de especies en diversas escalas espaciales.
En nuestro últimos capítulos nos proponemos analizar la estructuración de la comunidad bajo
tres dimensiones taxonómica, funcional y filogenética en una parcela de Bosque Seco de 9
hectáreas, con un enfoque espacialmente explícito. Recientemente, los ecologistas han pasado
de la medición de la diversidad como la riqueza de especies y la uniformidad, a la utilización
de rasgos funcionales y la filogenia de la especies para estimar la similitud ecológica de las
especies con el fin de probar las hipótesis del ensamble de la comunidad (Swenson 2013).
Se han desarrollado análisis estadístico novedosos para el estudio de la diversidad vegetal,
mediante el uso de patrones espaciales, como es el uso del ISAR (Su relación individual de
especies-área) propuesto por Wiegand et al. (2007), donde calcula la riqueza de especies en
los barrios locales alrededor de los individuos de una especie clave dentro de una comunidad.
Como consecuencia de ello una especie en particular pueden ser identificada como

Diversidad funcional y filogenética en los Bosques Secos del Sur del Ecuador
20
acumulador o repelente de diversidad, o como neutral. A pesar del claro impacto del enfoque
desarrollado por Wiegand et al. 2007, es limitado, ya que trata a todas las especies
ecológicamente idéntico y evolutivamente independiente (CO Webb et al. 2002, Yang et al.
2013). Así, un objetivo clave en la ecología de la comunidad ha sido ampliar el enfoque
multi-escala de Wiegand et al. 2007) donde se incluya a otros ejes de la biodiversidad, como
el funcional (DF) y filogenético (PD). porque están convencidos de que pueden ser mejores
predictores de la productividad y de la estabilidad de la comunidad (Tilman et al. 1997,
Cadotte et al. 2009; Flynn et al. 2011; Helmus and Ives 2012). El objetivo de este capitulo
fue evaluar el comportamiento de las especies en las tres dimensiones en el caso de la
diversidad taxonómica usamos ISAR, IFDAR para el nivel funcional y IPSVAR para la
diversidad filogenética Nosotros probamos estos patrones en la parcela de 9 Ha de un bosque
seco neotropical ubicado en la Reserva Ecológica Arenillas (REA), este ecosistema es
especialmente interesante porque se somete periódicamente a un fuerte estrés abiótico, lo que
ha llevado a las especies desarrollan patrones y adaptaciones morfofuncionales. Algunos
estudios han demostrado que en este ecosistema, la facilitación es más fuerte en condiciones
de estrés y se reduce cuando las condiciones mejoran (por ejemplo, Espinosa et al. 2014,
2011).
2.2. OBJETIVOS
- Está tesis ha sido estructurada en cuatro capítulos que cubren aspectos como: la estructura
de la comunidad dado por las reglas de ensamblaje, la diversidad funcional y filogenética
medida por un gradiente de estrés, la relación dispersión funcional y filogenética medida
por la riqueza de especie a diferentes tamaños de escala espacial y finalmente la
diversidad de la comunidad en tres dimensiones (taxonómica, funcional y filogenética)
mediante un enfoque espacial.

Diversidad funcional y filogenética en los Bosques Secos del Sur del Ecuador
21
El objetivo principal es:
- Identificar los procesos de ensamblaje de la comunidad basados en rasgos funcionales en
los Bosques Secos del Sur del Ecuador, un tipo de ecosistema de gran diversidad.
Los objetivos específicos son:
- Evaluar si la distribución de los rasgos funcionales a nivel comunitario es compatible
con la existencia del filtrado del hábitat o el límite de similitud en un bosque neotropical
seco.
Se considera que la distribución de los valores que pueden tomar los rasgos funcionales
dentro de una comunidad está condicionada por dos tipos principales de procesos de
ensamblaje. En primer lugar un “Filtrado por el hábitat” que restringe el rango de estrategias
viables en una comunidad .En segundo lugar el reparto de micro-sitios y recursos, que
condiciona un limite que restringe la semejanza funcional de las especies coexistentes. La
magnitud de ambos procesos puede depender de las condiciones de una localidad y puede
cambiar a lo largo de un gradiente abiótico.
- Identificar si existe vinculación de la diversidades funcional y filogenética con los
procesos de ensamblaje en bosque seco a través de un gradiente de estrés .
Hoy en día, algunas investigaciones en ecología implican además de los métodos basados en
el estudio de los rasgos funcionales otras aproximaciones como el estudio de la diversidad
funcional y filogenética en los proceso de la estructuran las comunidades, ya que
proporcionan mayor información de los diferentes procesos que se realizan en la
estructuración de la comunidad.
- Cuantificar la dispersión funcional y filogenética a lo largo de una escala espacial.

Diversidad funcional y filogenética en los Bosques Secos del Sur del Ecuador
22
Es ampliamente reconocido que los patrones y procesos ecológicos son espacialmente
estructurado y dependiente de la escala, la comprensión de cómo se organiza la diversidad en
el espacio es un foco importante en la ecología de la comunidad. Análisis previos han
demostrado la utilizando de procesos estocásticos, filtros abióticos y bióticos, para cuantificar
la co-ocurrencia de las especies en el ensamble de las comunidades. Con fin de obtener una
visión más profunda de los mecanismos que promueven el ensamble de comunidades,
nosotros evaluamos si el rol de los rasgos funcionales de las plantas en la estructura de la
comunidad es dependiente de la escala espacial a la cual se evalúa.
- Analizar el conjunto de mecanismos de la comunidad a escala espacial local; mediante
un enfoque taxonómico, funcional y filogenética
Los ecologistas han pasado de medir la diversidad de especies solo con la riqueza y la
uniformidad, a la utilización de medidas que reflejan diferencias ecológicas como el uso de la
diversidad funcional y filogenética de las especies, debido a evidencias que apuntaban a
considerar los rasgos funcionales como mejores predictores de la diversidad. Nosotros
proponemos analizar la estructuración de la comunidad en una parcela de 9 Ha. de Bosque
Seco, a nivel taxonómico, funcional y filogenético, para conocer si en una comunidad hay
especies que favorecen la acumulación al o repulsión de la diversidad funcional, y a qué
escala espacial se ejercen estos procesos.

Diversidad funcional y filogenética en los Bosques Secos del Sur del Ecuador
23
2.3. ÁREA DE ESTUDIO Y METODOLOGÍA GENERAL
Área de estudio
La presente tesis se llevó a cabo en los bosques estacionalmente secos del suroccidente de
Ecuador, ubicados en la región Pacífico Ecuatorial (Espinosa et al. 2012). Estos bosques
forman parte de la región biogeográfica Tumbesina, que abarca territorios del suroeste de
Ecuador y noroeste de Perú, en un rango altitudinal que va desde el nivel del mar hasta los
2000 m s.n.m., aproximadamente (Best and Kessler 1995; Espinosa et al. 2011). Estos
bosques son muy ricos en especies y refugio de una extraordinaria diversidad de endemismos
de muy diferentes grupos taxonómicos (Best and Kessler 1995). La región Tumbesina abarca
una gran variedad de climas, como resultado de la posición geográfica y la topografía variada
(Best y Kessler 1995). La precipitación es el factor climático más variable, y por ende, el más
importante para la definición de la vegetación a lo largo de la región (Best y Kessler 1995).
Esta región es reconocida como un centro de endemismo para diferentes taxones (Best y
Kessler 1995), así como por ser uno de los hotspots más amenazados del mundo (Dinerstein
et al. 1995, Espinosa et al. 2012). El clima se caracteriza por una estación seca que va de
mayo a noviembre y una estación lluviosa que se extiende desde diciembre a abril (Aguirre
and Kvist 2005). Para toda esta zona se estima una temperatura promedio anual entre 20° y
26°C y una precipitación promedio anual entre 300 y 700 mm (Aguirre y Kvist 2005).
En el capítulo 1 y 2 del presente trabajo abarcó la vegetación leñosa de toda el área de
bosques secos de la región suroccidente de Ecuador, en la provincia de Loja (cantones
Zapotillo, Macará, Celica; 120-2640 m s.n.m.) en uno de los remanentes más grandes y mejor
conservados de los bosques secos Tumbesinos (Aguirre y Kvist 2005), entre las latitudes
3°3’11’’ y 4°37’28’’ S, y entre las longitudes 79°14’37’’ y 80°25’46’’ O. Se registra una

Diversidad funcional y filogenética en los Bosques Secos del Sur del Ecuador
24
temperatura media anual en la región de unos 24°C (rango: 10-33°C) y con una precipitación
media anual de 500 mm / año (Espinosa et al 20011).
Los capítulos 3 y 4 se desarrollaron dentro de la Reserva Ecológica Arenillas (REA),
localizada en el extremo sur del Ecuador, provincia de El Oro, entre las ciudades de Arenillas
y Huaquillas, y cubre un área de 131,7 Km2
(Decreto Ejecutivo No. 787) (03° 34’ 15,44’’S;
80° 08’ 46,15’’E, altitud 30 m). La REA fue incluida dentro del Patrimonio de Áreas
Naturales del Estado (PANE) en el año 2001 y ha estado protegida de actividades de
extracción por aproximadamente 60 años (BirdLife International 2013). Su clima se
caracteriza por una estación de lluvias de cuatro meses con una precipitación media anual de
515 mm a partir de enero a abril y de 152 mm durante la estación seca. La temperatura media
es de 25.2°C tienen una variación máxima de 3.4 º C entre los meses más fríos y más cálidos.
Metodología general
Para realizar los capítulos 1y 2 utilizamos las 109 parcelas (10x50m) previamente
establecidas en el sur del Ecuador en el área de estudio. Estas parcelas estuvieron establecidas
en 48 parches de bosque seco con un diseño estratificado, tratando de cubrir el rango total de
condiciones físicas del área (Espinosa et al. 2011).
Para cumplir con los objetivos planteados en los capítulos 3 y 4, se estableció una parcela
permanente de 9 ha en la Reserva Ecológica Arenillas (REA). Esta parcela se ubicó en una de
las zonas mejor conservadas de la REA, que posee una formación vegetal de transición entre
bosque tropical seco y matorral seco de tierras bajas. Todas las plantas leñosas con DAP >5
cm han sido inventariadas y georeferenciadas desde el año 2009.

Diversidad funcional y filogenética en los Bosques Secos del Sur del Ecuador
25
Para colectar los rasgos funcionales dentro de nuestra investigación, tomamos en cuenta los
mas importantes en la literatura y seguimos los protocolos establecidos por Cornelissen et al
(2003) y Pérez-Harguindeguy et al. (2013).
La Altura máxima de la planta como se la conoce en varios estudios, se asocia con el vigor
competitivo, la fecundidad, y la tolerancia frente a condiciones de estrés. Altura de la planta
es la distancia más corta entre el límite superior de los principales tejidos fotosintéticos
(excluyendo inflorescencias) en una planta y el nivel del suelo, expresada en metros (Pérez-
Harguindeguy et al. 2013). En el caso de Densidad de la madera está estrechamente
vinculado al soporte mecánico, el transporte de agua y la capacidad de almacenamiento. En
consecuencia la densidad de la madera juega un papel central en las estrategias de historia de
vida de las especies. Las especies con un baja densidad cuenta con altas tasas de crecimiento
de diámetro y altura (Poorter 2008, Chave et al. 2009) mientras que las especies con una alta
densidad de la madera tiene tasas de crecimiento lento, pero sobreviven mejor a la sequía
(Alvarez and Kitajima 2007, Poorter and Markesteijn 2008).
El Tamaño de la hoja es importante para el equilibrio de la energía y el funcionamiento
hidráulico, hojas más pequeñas por lo general se encuentran en hábitats más secos y más
expuestas (Ackerly et al. 2002; Cornwell and Ackerly 2009). Se conoce como tamaño de la
hoja, al área de la superficie proyectada de un solo lado (envés) correspondiente a una sola
hoja, expresada en mm2 (Cornelissen et al. 2003). El tamaño de la hoja es importante para el
equilibrio de la energía y el funcionamiento hidráulico de la planta (Cornwell and Ackerly
2009). En el caso del Área foliar específica está definida como el área superficial de captura
de luz por unidad de biomasa seca, refleja un compromiso entre la captura y conservación de
los recursos (Poorter et al. 2009) tiene una fuerte relación positiva con la concentración de
nutrientes en la hoja, conductancia en los estomas, la tasa de fotosíntesis, el uso eficiente del

Diversidad funcional y filogenética en los Bosques Secos del Sur del Ecuador
26
agua (Hoffmann et al., 2005), longevidad de la hoja, tasa relativa de crecimiento, densidad de
la madera, y la capacidad competitiva (Reich et al. 1997). Área foliar específica se cree que
variará con la fenología de la hoja, especies caducifolias tienen mayor área foliar específica,
especies de hoja perenne tienen valores más bajos de Área foliar específica (Reich et al.
1997). Finalmente la Masa seca de la semilla esta relacionada con todos los aspectos de la
ecología de las plantas, incluyendo la dispersión, establecimiento de plántulas y la
persistencia en el ecosistema (Westoby, 1998; Weiher et al.1999).

Diversidad funcional y filogenética en los Bosques Secos del Sur del Ecuador
27
Referencias
Ackerly, D., Knight, C., Weiss, S., Barton, K., and Starmer, K. (2002). Leaf size, specific leaf area
and microhabitat distribution of chaparral woody plants: contrasting patterns in species level and
community level analyses. Oecologia,130(3), 449-457.
Ackerly, D. D. (2003). Community assembly, niche conservatism, and adaptive evolution in changing
environments. International Journal of Plant Sciences, 164(S3), S165-S184.
Aguirre, Z. and L. P. Kvist. (2005). Composición florística y estado de conservación de los bosques
secos del sur-occidente del Ecuador. Lyonia 8(2):41-67.
Aguirre, Z., Kvist, L. P., and Sánchez, O. (2006). Bosques secos en Ecuador y su diversidad. Botánica
Económica de los Andes Centrales, 162-187.
Alvarez-Clare, S., and Kitajima, K. (2007). Physical defence traits enhance seedling survival of
neotropical tree species. Functional Ecology, 21(6), 1044-1054.
Balvanera, P., Quijas, S., and Pérez-Jiménez, A. (2011). Distribution patterns of tropical dry forest
trees along a mesoscale water availability gradient.Biotropica, 43(4), 414-422.
Best, B. and M. Kessler. 2005. Biodiversity and Conservation in Tumbesian Ecuador and Peru.
Cambridge, UK. Birdlife Internacional.
BirdLife International. 2013. Important Bird Areas factsheet: Reserva Ecológica Arenillas.
Downloaded from http://www.birdlife.org on 12/03/2013
Blain, D., and Kellman, M. (1991). The effect of water supply on tree seed germination and seedling
survival in a tropical seasonal forest in Veracruz, Mexico. Journal of Tropical Ecology, 7(01), 69-
83.
Brooker, R. W., Maestre, F. T., Callaway, R. M., Lortie, C. L., Cavieres, L. A., Kunstler, G., ... and
Michalet, R. (2008). Facilitation in plant communities: the past, the present, and the future. Journal
of Ecology, 96(1), 18-34.
Butterfield, B. J. (2009). Effects of facilitation on community stability and dynamics: synthesis and
future directions. Journal of Ecology, 97(6), 1192-1201.
Cadotte, M. W., Cavender-Bares, J., Tilman, D., and Oakley, T. H. (2009). Using phylogenetic,
functional and trait diversity to understand patterns of plant community productivity. PLoS
One, 4(5), e5695.

Diversidad funcional y filogenética en los Bosques Secos del Sur del Ecuador
28
Callaway, R. M. 2007. Positive Interactions and Interdependence in Plant Communities. Page 415
Library. Springer Netherlands. doi: 10.1007/978-1-4020-6224-7.
Callaway, R. M., Brooker, R. W., Choler, P., Kikvidze, Z., Lortie, C. J., Michalet, R., ... and Cook, B.
J. (2002). Positive interactions among alpine plants increase with stress. Nature, 417(6891), 844-
848.
Cavender-Bares, J., Keen, A., and Miles, B. (2006). Phylogenetic structure of Floridian plant
communities depends on taxonomic and spatial scale. Ecology,87(sp7), S109-S122.
Cavender-Bares, J., Kitajima, K., and Bazzaz, F. A. (2004). Multiple trait associations in relation to
habitat differentiation among 17 Floridian oak species. Ecological Monographs, 74(4), 635-662.
Chase, J. M. (2014). Spatial scale resolves the niche versus neutral theory debate. Journal of
vegetation science, 25(2), 319-322.
Chaturvedi, R. K., Raghubanshi, A. S., and Singh, J. S. (2011). Plant functional traits with particular
reference to tropical deciduous forests: A review. Journal of biosciences, 36(5), 963-981.
Chesson, P. (2000). Mechanisms of maintenance of species diversity. Annual review of Ecology and
Systematics, 343-366.
Cornelissen, J. H. C., Lavorel, S., Garnier, E., Diaz, S., Buchmann, N., Gurvich, D. E., ... and Poorter,
H. (2003). A handbook of protocols for standardised and easy measurement of plant functional
traits worldwide. Australian journal of Botany, 51(4), 335-380.
Cornwell, W. K., and Ackerly, D. D. (2009). Community assembly and shifts in plant trait
distributions across an environmental gradient in coastal California.Ecological Monographs, 79(1),
109-126.
Cornwell, W. K., Schwilk, D. W., and Ackerly, D. D. (2006). A trait-based test for habitat filtering:
convex hull volume. Ecology, 87(6), 1465-1471.
Crawley, M. J., Kornberg, H., Lawton, J. H., Usher, M. B., Southwood, R., O'Connor, R. J., and
Gibbs, A. (1986). The population biology of invaders [and discussion]. Philosophical Transactions
of the Royal Society B: Biological Sciences, 314(1167), 711-731.
Diamond, J. M. (1975). Assembly of species communities. Pages342-444 in ML Cody and JM
Diamond, editors. Ecologyand evolution of communities.
Diaz, S., Cabido, M., and Casanoves, F. (1998). Plant functional traits and environmental filters at a
regional scale. Journal of Vegetation Science, 9(1), 113-122.

Diversidad funcional y filogenética en los Bosques Secos del Sur del Ecuador
29
Diaz, S., Hodgson, J. G., Thompson, K., Cabido, M., Cornelissen, J. H. C., Jalili, A., ... and Zak, M.
R. (2004). The plant traits that drive ecosystems: evidence from three continents. Journal of
vegetation science, 15(3), 295-304.
Díaz, S., Noy-Meir, I., and Cabido, M. (2001). Can grazing response of herbaceous plants be
predicted from simple vegetative traits?. Journal of Applied Ecology, 38(3), 497-508.
Dinerstein, E., Olson, D. M., Graham, D. J., Webster, A. L., Primm, S. A., Bookbinder, M. P., and
Ledec, G. Una evaluación del estado de conservación de las eco-regiones terrestres de América
Latina y el Caribe.(ISBN 0-8213-3296-1.).
Engelbrecht, B. M., and Kursar, T. A. (2003). Comparative drought-resistance of seedlings of 28
species of co-occurring tropical woody plants. Oecologia,136(3), 383-393.
Espinosa C, Cabrera O, Luzuriaga A, Escudero A. What Factors Affect Diversity and Species
Composition of Endangered Tumbesian Dry Forests in Southern Ecuador. Biotrópica. 2011; 43:
15–22.
Espinosa, C. I., De la Cruz, M., Luzuriaga, A. L., and Escudero, A. (2012). Bosques tropicales secos
de la región Pacífico Ecuatorial: diversidad, estructura, funcionamiento e implicaciones para la
conservación. Revista Ecosistemas, 21(1-2).
Flynn, D. F., Mirotchnick, N., Jain, M., Palmer, M. I., and Naeem, S. (2011). Functional and
phylogenetic diversity as predictors of biodiversity-ecosystem-function relationships. Ecology,
92(8), 1573-1581.
Fonseca, C. R., Overton, J. M., Collins, B., and Westoby, M. (2000). Shifts in trait‐ combinations
along rainfall and phosphorus gradients. Journal of Ecology,88(6), 964-977.
Freschet, G. T., Dias, A. T., Ackerly, D. D., Aerts, R., van Bodegom, P. M., Cornwell, W. K., ... and
Cornelissen, J. H. (2011). Global to community scale differences in the prevalence of convergent
over divergent leaf trait distributions in plant assemblages. Global Ecology and
Biogeography, 20(5), 755-765.
Garnier, E., Cortez, J., Billès, G., Navas, M. L., Roumet, C., Debussche, M., ... and Toussaint, J. P.
(2004). Plant functional markers capture ecosystem properties during secondary
succession. Ecology, 85(9), 2630-2637.
Garnier, E., Shipley, B., Roumet, C., and Laurent, G. (2001). A standardized protocol for the
determination of specific leaf area and leaf dry matter content.Functional ecology, 15(5), 688-695.

Diversidad funcional y filogenética en los Bosques Secos del Sur del Ecuador
30
Götzenberger, L., de Bello, F., Bråthen, K. A., Davison, J., Dubuis, A., Guisan, A., ... and Zobel, M.
(2012). Ecological assembly rules in plant communities—approaches, patterns and
prospects. Biological Reviews, 87(1), 111-127.
Grime, J. P. (2006). Trait convergence and trait divergence in herbaceous plant communities:
mechanisms and consequences. Journal of Vegetation Science,17(2), 255-260.
Helmus, M. R., and Ives, A. R. (2012). Phylogenetic diversity-area curves.Ecology, 93(sp8), S31-S43.
Hoffmann, W. A., Franco, A. C., Moreira, M. Z., and Haridasan, M. (2005). Specific leaf area
explains differences in leaf traits between congeneric savanna and forest trees. Functional
Ecology, 19(6), 932-940.
Hulshof, C. M., Martínez-Yrízar, A., Burquez, A., Boyle, B., and Enquist, B. J. (2013). Plant
functional trait variation in tropical dry forests: a review and synthesis. Tropical dry forests in the
Americas: ecology, conservation, and management. CRC Press, Boca Raton, 129-140.
Kattge, J., Diaz, S., Lavorel, S., Prentice, I. C., Leadley, P., Bönisch, G., ... and Ford, H. (2011).
TRY–a global database of plant traits. Global change biology,17(9), 2905-2935.
Keddy, P. A. (1992). Assembly and response rules: two goals for predictive community
ecology. Journal of Vegetation Science, 3(2), 157-164.
Kraft, N. J., and Ackerly, D. D. (2010). Functional trait and phylogenetic tests of community
assembly across spatial scales in an Amazonian forest. Ecological Monographs, 80(3), 401-422.
Kraft, N. J., Cornwell, W. K., Webb, C. O., and Ackerly, D. D. (2007). Trait evolution, community
assembly, and the phylogenetic structure of ecological communities. The American
Naturalist, 170(2), 271-283.
Kraft, N. J., Valencia, R., and Ackerly, D. D. (2008). Functional traits and niche-based tree
community assembly in an Amazonian forest. Science, 322(5901), 580-582.
Lavorel, S., and Garnier, E. (2002). Predicting changes in community composition and ecosystem
functioning from plant traits: revisiting the Holy Grail. Functional ecology, 16(5), 545-556.
Lavorel, S., Díaz, S., Cornelissen, J. H. C., Garnier, E., Harrison, S. P., McIntyre, S., ... and Urcelay,
C. (2007). Plant functional types: are we getting any closer to the Holy Grail?. In Terrestrial
ecosystems in a changing world (pp. 149-164). Springer Berlin Heidelberg.

Diversidad funcional y filogenética en los Bosques Secos del Sur del Ecuador
31
Losos, J. B. (2008). Phylogenetic niche conservatism, phylogenetic signal and the relationship
between phylogenetic relatedness and ecological similarity among species. Ecology letters, 11(10),
995-1003.
MacArthur, R. H., and Wilson, E. O. (1967). The theory of island biogeography(Vol. 1). Princeton
University Press.
MacArthur, R., and Levins, R. (1967). The limiting similarity, convergence, and divergence of
coexisting species. American naturalist, 377-385.
Martinez-Yrizar, A., Sarukhan, J., Perez-Jimenez, A., Rincon, E., Maass, J. M., Solis-Magallanes, A.,
and Cervantes, L. (1992). Above-ground phytomass of a tropical deciduous forest on the coast of
Jalisco, Mexico. Journal of Tropical Ecology, 8(01), 87-96.
McGill, B. J., Enquist, B. J., Weiher, E., and Westoby, M. (2006). Rebuilding community ecology
from functional traits. Trends in ecology and evolution, 21(4), 178-185.
Méndez-Alonzo R, Pineda García-F, H Paz, Rosell JA, ME Olson (2013) Hoja fenología se asocia
con la disponibilidad de agua del suelo y características del xilema en un bosque seco tropical.
Árboles 27: 745-754.
Mokany, K., Ash, J., and Roxburgh, S. (2008). Functional identity is more important than diversity in
influencing ecosystem processes in a temperate native grassland. Journal of Ecology, 96(5), 884-
893.
Mooney, H. A., Fuentes, E. R., and Kronberg, B. I. (Eds.). (1993). Earth system responses to global
change: contrasts between North and South America. Academic Press.
Murphy, P. G., and A. E. Lugo. 1995. Dry forests of Central America and the Caribbean. Pages 9- 34
in S. H. Bullock, H. A. Mooney, and E. Medina, editors. Seasonally dry tropical forests.
Cambridge University Press.
Pérez-Harguindeguy, N., Díaz, S., Garnier, E., Lavorel, S., Poorter, H., Jaureguiberry, P., ... and
Cornelissen, J. H. C. (2013). New handbook for standardised measurement of plant functional
traits worldwide. Australian Journal of Botany, 61(3), 167-234.
Pineda García-F, H Paz, Meinzer FC (2013). Resistencia a la sequía en especies de sucesión
secundaria temprana y tardía de un bosque seco tropical: la interacción entre la resistencia xilema a
una embolia, el almacenamiento de agua albura y hoja derramamiento. Planta, Celular y del Medio
Ambiente 36:. 405 a 418

Diversidad funcional y filogenética en los Bosques Secos del Sur del Ecuador
32
Poorter, H., Niinemets, Ü., Poorter, L., Wright, I. J., and Villar, R. (2009). Causes and consequences
of variation in leaf mass per area (LMA): a meta‐ analysis.New Phytologist, 182(3), 565-588.
Poorter, L., and Markesteijn, L. (2008). Seedling traits determine drought tolerance of tropical tree
species. Biotropica, 40(3), 321-331.
Poorter, L., Wright, S. J., Paz, H., Ackerly, D. D., Condit, R., Ibarra-Manríquez, G., ... and Wright, I.
J. (2008). Are functional traits good predictors of demographic rates? Evidence from five
neotropical forests. Ecology, 89(7), 1908-1920.
Reich, P. B., Walters, M. B., and Ellsworth, D. S. (1997). From tropics to tundra: global convergence
in plant functioning. Proceedings of the National Academy of Sciences, 94(25), 13730-13734.
Sampaio, E. 1995. Overview of the Brazilian caatinga. Pages Pages 35–63 in H. Bullock, H. A.
Mooney, and E. Medina, editors. Seasonally dry tropical forests. Island Press, Cambridge
University.
Spasojevic, M. J., and Suding, K. N. (2012). Inferring community assembly mechanisms from
functional diversity patterns: the importance of multiple assembly processes. Journal of
Ecology, 100(3), 652-661.
Swenson, N. G. (2013). The assembly of tropical tree communities–the advances and shortcomings of
phylogenetic and functional trait analyses.Ecography, 36(3), 264-276.
Swenson, N. G., and Enquist, B. J. (2009). Opposing assembly mechanisms in a Neotropical dry
forest: implications for phylogenetic and functional community ecology. Ecology, 90(8), 2161-
2170.
Swenson, N. G., Enquist, B. J., Pither, J., Thompson, J., and Zimmerman, J. K. (2006). The problem
and promise of scale dependency in community phylogenetics. Ecology, 87(10), 2418-2424.
Tilman, D., Knops, J., Wedin, D., Reich, P., Ritchie, M., and Siemann, E. (1997). The influence of
functional diversity and composition on ecosystem processes.Science, 277(5330), 1300-1302.
Valiente-Banuet, A., Rumebe, A. V., Verdú, M., and Callaway, R. M. (2006). Modern Quaternary
plant lineages promote diversity through facilitation of ancient Tertiary lineages. Proceedings of
the National Academy of Sciences,103(45), 16812-16817.
Valiente‐ Banuet, A., and Verdú, M. (2007). Facilitation can increase the phylogenetic diversity of
plant communities. Ecology Letters, 10(11), 1029-1036.

Diversidad funcional y filogenética en los Bosques Secos del Sur del Ecuador
33
Violle, C., Enquist, B. J., McGill, B. J., Jiang, L., Albert, C. H., Hulshof, C., ... and Messier, J. (2012).
The return of the variance: intraspecific variability in community ecology. Trends in ecology and
evolution, 27(4), 244-252.
Violle, C., Navas, M. L., Vile, D., Kazakou, E., Fortunel, C., Hummel, I., and Garnier, E. (2007). Let
the concept of trait be functional!. Oikos, 116(5), 882-892.
Webb, C. O. (2000). Exploring the phylogenetic structure of ecological communities: an example for
rain forest trees. The American Naturalist, 156(2), 145-155.
Webb, C. O., Ackerly, D. D., McPeek, M. A., and Donoghue, M. J. (2002). Phylogenies and
community ecology. Annual review of ecology and systematics, 475-505.
Weiher, E., and Keddy, P. A. (1995). Assembly rules, null models, and trait dispersion: new questions
from old patterns. Oikos, 159-164.
Weiher, E., Freund, D., Bunton, T., Stefanski, A., Lee, T., and Bentivenga, S. (2011). Advances,
challenges and a developing synthesis of ecological community assembly theory. Philosophical
Transactions of the Royal Society B: Biological Sciences, 366(1576), 2403-2413.
Weiher, E., Werf, A., Thompson, K., Roderick, M., Garnier, E., and Eriksson, O. (1999). Challenging
Theophrastus: a common core list of plant traits for functional ecology. Journal of vegetation
science, 10(5), 609-620.
Westoby, M. (1998). A leaf-height-seed (LHS) plant ecology strategy scheme.Plant and soil, 199(2),
213-227.
Westoby, M., and Wright, I. J. (2006). Land-plant ecology on the basis of functional traits. Trends in
Ecology and Evolution, 21(5), 261-268.
Westoby, M., Falster, D. S., Moles, A. T., Vesk, P. A., and Wright, I. J. (2002). Plant ecological
strategies: some leading dimensions of variation between species. Annual review of ecology and
systematics, 125-159.
Wiegand, T., Gunatilleke, C. S., Gunatilleke, I. N., and Huth, A. (2007). How individual species
structure diversity in tropical forests. Proceedings of the National Academy of Sciences, 104(48),
19029-19033.
Wilson, J. B., and Stubbs, W. J. (2012). Evidence for assembly rules: limiting similarity within a
saltmarsh. Journal of Ecology, 100(1), 210-221.

Diversidad funcional y filogenética en los Bosques Secos del Sur del Ecuador
34
Wright, I. J., Reich, P. B., Westoby, M., Ackerly, D. D., Baruch, Z., Bongers, F., ... and Villar, R.
(2004). The worldwide leaf economics spectrum. Nature,428(6985), 821-827.
Yang, J., Swenson, N. G., Cao, M., Chuyong, G. B., Ewango, C. E., Howe, R., ... and Lin, L. (2013).
A phylogenetic perspective on the individual species-area relationship in temperate and tropical
tree communities.

Diversidad funcional y filogenética en los Bosques Secos del Sur del Ecuador
35

Diversidad funcional y filogenética en los Bosques Secos del Sur del Ecuador
36
CAPÍTULO 1
Environmental variation mediates habitat filtering and
limiting similarity in a Dry Neotropical forest.

Diversidad funcional y filogenética en los Bosques Secos del Sur del Ecuador
37

Diversidad funcional y filogenética en los Bosques Secos del Sur del Ecuador
38
Abstract
According to Community Assembly Theory (sensu Diamond) abiotic constraints and biotic
interactions combine to form assembly rules that determine which species from the local pool
will coexist. Although, this theory has generally been studied with data on taxonomic
diversity, it may be more informative to consider the functional traits of species. Two main
mechanisms have been proposed to explain the role of functional traits in the assembly of
plant communities; a habitat filter that restricts the range of viable strategies and second, a
partitioning of resources limits the similarity of traits amongst coexisting species.
We compare the distribution of values for five traits (maximum height, wood density,
specific leaf area, leaf size and seed mass) in 58 woody plant species from 109 dry forest
plots. Specifically, we examined the within-community mean, range, variance, kurtosis and
the standard deviation of this distribution of neighbor distances (sdND). The range and
variance of maximum height, specific leaf area and seed mass were smaller than would be
expected from a lottery model of community assembly in most plots. We also found evidence
of limiting similarity for leaf size in the kurtosis, and seed mass in sdND.
These results support the existence of both habitat filtering and a limiting similarity affect in
assembly of plant communities of Tumbesian dry forests. Habitat filtering is evident along
the precipitation gradient with functional trait configurations in drier sites of high specific
leaf size, high wood density, high maximum height, and low seed mass. We also confirmed
that the climate gradient modifies the strength of the limiting similarity with a shortage of the
allowed functional strategies and an increase of the effects of competition (a more even
distribution of trait values), for most traits, as the conditions become harder (i.e., drier).

Diversidad funcional y filogenética en los Bosques Secos del Sur del Ecuador
39
Introduction
Detection of patterns in the ecosystems and inference of their causal processes were basic
topics in the development of community ecology [1,2]. One of the most impacting theoretical
contributions in this context was formulated by Diamond [3] as the Community Assembly
Theory. In a very synthetic way it points out that coexistence is possible due to differences in
resource use among species. According to this theory, the combined effect of abiotic
constraints (environmental conditions) and biotic interactions conform certain assembly rules
determining which species from the local pool will coexist at fine spatial and time scales in
the realized assemblages. Tests for this theory have traditionally focused on the taxonomic
identity and diversity, but a complementary and more informative approach is to consider the
functional features of species (functional traits) inhabiting these communities [4]. Plant
functional traits, i.e., any morphological, physiological or phenological feature that affects
plant growth, reproduction or survival, constitute a direct link between plant fitness and the
environment and are useful for answering relevant questions in ecology [5]. Indeed, plant
functional traits offer the best available approach for achieve a general predictive
understanding of communities [6] and investigate ecosystem functioning [7].
Two main mechanisms have been proposed to explain the role of plant functional traits in the
construction of realized assemblages: i) habitat filtering, which implies that the environment
selects (i.e., "filters") the range of suitable trait values within a community and, ii) limiting
similarity, which means that only species differing in their traits and therefore having
different resource requirements can thrive together, avoiding or minimizing inter–specific
competition [4]. Thus it is reasonable to test whether variation in the traits of coexisting
species is larger than expected by chance, with trait divergence being interpreted as evidence
of limiting similarity [8]. On the contrary, if habitat filtering were operating we would expect

Diversidad funcional y filogenética en los Bosques Secos del Sur del Ecuador
40
a convergence of species trait values, i.e. less variation at the community level than expected
by chance [4].
Although the prevalence of these two mechanisms in natural communities is far from being
known, it has been hypothesized that the prevailing assembly mechanism in realized
assemblages could shift along environmental gradients from limiting similarity (and
functional divergence) at more productive and milder sites to habitat filtering (and
convergence) at the more stressful conditions [9]. In fact, the effect of environmental
gradients on the strength and direction of plant-plant interactions has been extensively
documented and has confirmed these expectations in many cases [10,11,12,13]. The shifts in
trait values across sites along and environmental gradient is usually related to species
turnover, and could be assessed by comparing community trait means [14,15].
Keeping this in mind, we have evaluated the role of habitat filtering and limiting similarity on
the assembly of neotropical Tumbesian dry forests, one of the less studied tropical forest
ecosystems in the world, despite evidences of extreme threats and forest losses are
accumulating quickly [16]. Understanding the mechanisms that determine community
assembly in these forests is critical for their proper management and conservation [17] and
also to complete the knowledge about the prevalence of these functional mechanisms in
tropical dry forests [18].
In previous works we found that both the composition and the structure of Tumbesian forests
greatly shift as climatic conditions (mainly annual precipitation) change along its distribution
area [19]. Our main objective here is to test whether the paradigm about the prevalence of
these assembly mechanisms remains valid in the Tumbesian forest, with e.g., limiting
similarity prevailing in the wetter and milder places occupied by the Tumbesian forest, close
to montane forests, and habitat filtering prevailing in the harsh full areas in contact with the

Diversidad funcional y filogenética en los Bosques Secos del Sur del Ecuador
41
dry shrublands [20]. More specifically we intended to answer the following questions: (1) Is
there any evidence for a restricted distribution (habitat filtering) or even spacing (limitation
of similarity) of trait values in the Tumbesian forests? (2) Does the relative importance of
habitat similarity or habitat filtering with respect to different traits change across the climatic
gradient?
Methods
Natural history of the Tumbesian dry forests
Tumbesian dry forests extend on a narrow fringe territory comprising 87,000 km2 along the
Pacific coast from the southwestern tip of Ecuador, to the northwestern of Peru [21]. Our
study area covers nearly 2000 km2 in the province of Loja (Zapotillo, Macará and Celica
districts) in the southernmost tip of Ecuador, covering an altitude range from 120 to 2,600 m.
This territory encompasses one of the largest and best conserved remnants of the Tumbesian
dry forests in Ecuador [22,19]. We surveyed only well-conserved stands without evidences of
recent anthropogenic perturbations. All survey and collection was authorized under the
scientific investigation permit numbered 18-2012-IC-FLO-DPL-MA, issued by the
Ecuadorian Government Ministry of Environment. Average annual temperature in the region
is ca 24 ºC (range: 10–33 ºC). Mean annual precipitation is ca 500 mm/yr (range: 270–1284
mm/yr).
These forests are very rich in tree and shrub species [19] and are dominated by Bursera
graveolens, Acacia macracantha and Capparis scabrida. It is also the habitat of several
endangered species including Juglans neotropica, Siparuna eggersii [23,24].
Field data
We placed 109 rectangular plots (10 x 50 m) on 48 homogeneous forest stands following a
stratified sampling design based on the available preliminary landscape maps in the territory.

Diversidad funcional y filogenética en los Bosques Secos del Sur del Ecuador
42
In each plot we counted the number of individuals of all standing perennial species see details
[19]. From the Worldclim database [25], we annotated for each plot the value of the mean
annual precipitation, as this variable has been shown to be one the main predictor of species
turnover and is correlated to the variation of community composition and structure in the area
[19].
Plant functional trait selection and measurements
We selected a set of plant functional traits, which are known for being tightly related to
important processes in trees and shrubs [26]. Leaf size (LS) plays a particularly important
role in carbon assimilation, water relations and energy balance [27]. Plant growth and
survival are strongly connected to specific leaf area (SLA, leaf area per unit mass). This trait
represents an "economic" axis of variation that ranges from species typical of resource-rich
habitats, which have a rapid tissue turnover and high metabolic rates and whose attributes
enhance the rapid acquisition of photosynthetic carbon (high SLA), to species tolerating
resource-limited habitats which tend to show opposite attributes [28]. SLA and LS decrease
along gradients of declining moisture and/or nutrient availability [27,29,30,31,32,33,34,35].
LS is important for energy balance and hydraulic functioning, with smaller leaves generally
found in drier and more exposed habitats [36]. WD is related to water efficiency and
transport [36]. Although the variation of this trait is considered to be orthogonal to the leaf
economic one [37], it is also related to growth and survival. Low WD is usually a surrogate
of high stem growth rates [38], whereas high WD are related to low growth rates and to the
development of thick cell walls [39], which makes stems more resistant to breakage [40] and
to fungi and pathogen attacks [41]. Hmax is related to access to light [42,43]. Higher plants
intercept on average more light and therefore have potentially faster growth rates [44]. SM is
a crucial feature for dispersion and regeneration and is related to the competition-colonization

Diversidad funcional y filogenética en los Bosques Secos del Sur del Ecuador
43
trade-off [45]. Large seeds provide reserves for successful seedling establishment in poor
light or intense competitive conditions [46]. By contrast, small-seeded species produce more
seeds per unit of reproductive effort [47] and are better colonizers [48].
We selected all woody species appearing in at least 4 of the studied plots. Three traits (LS,
SLA and SM) were measured in the field and/or the laboratory, following standardized
protocols [26]. In the case Hmax were taken from the literature [49,50,51,52] and WD [S2]
For each species, we collected 10 leaves from each of 10 randomly chosen trees, covering all
the environmental range of each species in our data set. LS, was measured with the program
Image J [53] from scanned (300 dpi) fresh leafs. Leaf mass (for calculation of SLA) was
measured after 3 days drying at 60 ºC. Seeds were also collected from at least 10 fruits taken
from different individuals of each species. We also used seed accessions from the Germplasm
Bank of Universidad Técnica Particular de Loja. Seed mass was obtained after 48 hours
drying at 80 °C [26]. SM of ten species, which could not be collected in the field, were
approximated by the average SM of congeneric species recorded in the Kew Millennium
Seed database (Royal Botanic Gardens Kew [54].
Data analysis
We first calculated the Spearman rank correlation coefficients between trait values of species
and between mean species trait values by plot. For subsequent analyses, we log-transformed
Hmax, LS, SLA and MS values. WD showed a normal distribution and was not transformed.
The effects of habitat filtering can be seen as a reduction in the variety of successful trait
values that occur within a community [2,55,56]. To detect such a reduction, we measured the
range and the variance of trait values within each community. If habitat filtering is operating
on a specific plant trait, then the observed range of values for the plant trait should be lower

Diversidad funcional y filogenética en los Bosques Secos del Sur del Ecuador
44
than expected if communities were assembled independently with respect to that trait. As the
range is susceptible to extreme values that could be due to mass effects [57] or measurement
error, we measured also the variance of trait values in these communities as a more efficient
metric of convergence [36]. In fact, these two metrics have been shown as good predictors of
habitat filtering [58]
In order to analyze the possible existence of a limiting similarity mechanism, we followed
three complementary approaches. First, we computed the kurtosis of the distribution of trait
values within plots, since it has been suggested that platykurtic distributions (i.e., low
kurtosis values) are expected when a process (i.e., limiting similarity) spreads species traits
within a realized community [36]. Secondly, we checked for large variances in the
distribution of trait values, as this is also a robust indicator of character divergence [58].
Additionally, we quantified the even distribution of trait values within plots. For this, within
each plot, we ordered species with respect to their trait values and computed differences in
trait values among neighbor species ("neighbor distances"). The standard deviation of this
distribution of neighbor distances (sdND) was used as a measure of even spacing. If a
limiting similarity process would be ruling the assembly process, sdND should be low or, in
any case, lower than the sdND of a completely random process [36].
Inference about the significance of the observed range, variance and kurtosis was based on a
lottery null model, with equal probability of assembling any of the recorded species in each
null community [36]. As we considered each of the surveyed plots as a community unit, we
conducted 9999 random draws for each plot with the same richness as the observed plot. We
compared the range, and kurtosis of observed trait values in the plot to the median of the
range and kurtosis of traits in the simulated communities with one-tailed Wilcoxon paired-
sample tests. In the case of variance we compared observed and expected values with two-

Diversidad funcional y filogenética en los Bosques Secos del Sur del Ecuador
45
tailed tests. As the presence of a strong habitat filter effect could generate false positives
when testing for even spacing with lottery models (due to the existence of extreme trait
values in the species pool, [36], inference about the distribution of sdND's was based on a
two-step null model which accounts for possible habitat filtering [36]. In a first step, for each
plot, we identified among the 58 species those species whose niche breadth (relative to
annual precipitation) comprised the abiotic conditions found in the plot (i.e., "potential
community members").
Niche breadth was estimated as the range of annual precipitation values among the plots
where the species appeared in the whole study. In the second step, we conducted 9999
random draws with the same richness of each plot choosing among the set of potential
community members. We computed the sdND's of each random community and built a
distribution of sdND's under our null model. We then compared the observed sdND's with the
median of the randomized SND's with a one-tailed Wilcoxon paired-sample test.
In order to test whether species turnover along the gradient has any effect on the distribution
of traits, we also computed correlations between the mean value of each trait in each plot and
the values of the mean annual precipitation in each plot.
Finally, to test whether assembly mechanisms shift along the precipitation gradient, we
calculated Spearman rank correlations between the annual precipitation and the range,
variance, kurtosis and sdND's for each trait in each plot. All analyses including null models
testing were performed using R version 3.1.1 [59].
Result
We found 102 species (73 trees and 29 shrubs). Maximum richness per plot was 14 species,
with a median of 4 species per plot. We selected the 58 species (30 deciduous, 13 semi–

Diversidad funcional y filogenética en los Bosques Secos del Sur del Ecuador
46
deciduous and 15 evergreens) that appeared in at least four of the studied plots (S1).
Plant functional traits showed appreciable variation between species. Hmax varied from 4 m
(Annona sp, LS ranged between 287.00 ± 60.22 cm2 in Piscidia carthaginensis and 8.46 ±
2.52 cm2 in Prosopis juliflora. SLA values varied between 46.63 cm
2/g and 2.9 cm
2/g in
Urera sp. and Fulcaldea laurifolia, respectively. WD ranged between 1.00 g.cm–3
(Tabebuia
chrysantha) and 0.19 g.cm–3
(Erythroxylum glaucum). Finally, SM ranged from 0.01 g in
Vernonanthura patens and Ficus insipida to 137.92 g in Geoffroea spinosa (S1).
We did not find intraspecific trait correlations except for the case of Hmax and LS (Table 1).
Table 1. Spearman rank correlation coefficients for 58 species trait values. Significant correlations (p
< 0.05) are shown in bold.
WD LS SLA SM
LS –0.23
SLA –0.10 0.10
SM 0.20 0.04 0.04
Hmax –0.03 0.30 (p=0.02) –0.01 0.20
WD – wood density; LS – leaf size; SLA – specific leaf area; SM – seed mass; Hmax – maximum height.
The mean trait values, per plot were significantly correlated for some traits. LS was positive
correlated with SLA and Hmax, and negative correlated with SM; whereas WD showed
positive correlation with SLA and SM. Finally SLA had a positive correlation with Hmax
(Table 2).
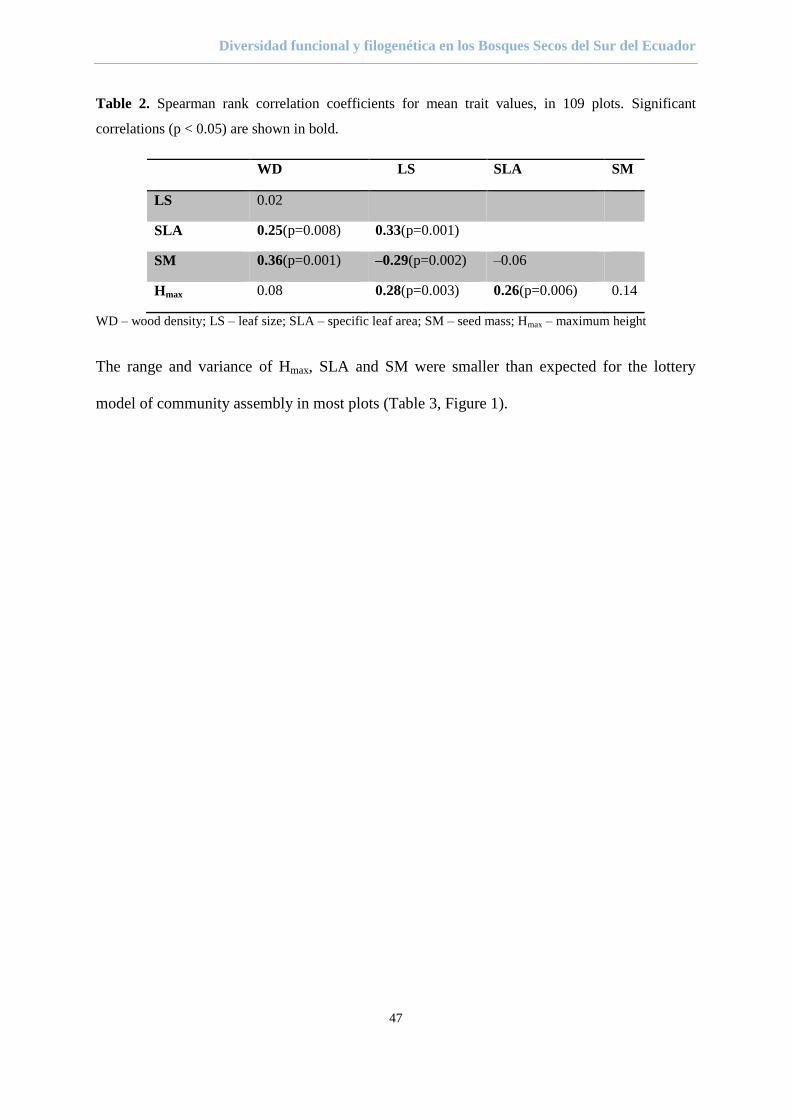
Diversidad funcional y filogenética en los Bosques Secos del Sur del Ecuador
47
Table 2. Spearman rank correlation coefficients for mean trait values, in 109 plots. Significant
correlations (p < 0.05) are shown in bold.
WD LS SLA SM
LS 0.02
SLA 0.25(p=0.008) 0.33(p=0.001)
SM 0.36(p=0.001) –0.29(p=0.002) –0.06
Hmax 0.08 0.28(p=0.003) 0.26(p=0.006) 0.14
WD – wood density; LS – leaf size; SLA – specific leaf area; SM – seed mass; Hmax – maximum height
The range and variance of Hmax, SLA and SM were smaller than expected for the lottery
model of community assembly in most plots (Table 3, Figure 1).

Diversidad funcional y filogenética en los Bosques Secos del Sur del Ecuador
48
0.0
0.5
1.0
1.5
2.0log(maximum height)
0.0
0.2
0.4
0.6
0.8
Wood density
0.0
0.5
1.0
1.5
2.0
2.5
3.0
3.5log(Leaf size)
ran
ge
in
tra
it v
alu
es
2 4 6 8 10 12 14
0.0
0.5
1.0
1.5
2.0
2.5log(Specific leaf area)
Species richness
2 4 6 8 10 12 14
0
2
4
6
8
log(seed mass)
Species richness
Figure 1. The community–wide range of values of five traits at different levels of species richness.
Open circles show the observed values for 109 plots; solid squares show the mean of 9999 null model
trials at each of the corresponding levels of species richness. See Table 3 for a description of the traits
and a synthesis of results; note that data have been log–transformed except for wood density. Wood
density showed an approximately normal distribution and was not transformed.
☐ Observed values
Null expectation

Diversidad funcional y filogenética en los Bosques Secos del Sur del Ecuador
49
Table 3: The range and variance of trait values within a site: deviations from the lottery model of
habitat filtering. Figures show the number of plots where the range or variance observed for the
distribution of values of each trait was smaller than the range or variance expected according to the
lottery null model.
Range Variance
Trait No. plots < Wilcoxon P No. plots < Wilcoxon P
expectation expectation
Hmax 62 out of 109 0.002 70 out of 109 <0.001
WD 34 out of 109 1 33 out of 109 <0.001
LS 59 out of 109 0.06 54 out of 109 0.65
SLA 77 out of 109 <0.001 70 out of 109 <0.001
SM 81 out of 109 <0.001 85 out of 109 <0.001
Hmax – maximum height; WD – wood density; LS – leaf size; SLA – specific leaf area; SM – seed mass. P – p-
value
On the other hand, the kurtosis of trait values within plots was significantly lower than
expected only for LS (Table 4). The standard deviation of the distribution of neighbor
distances among trait values within plots (sdND) was significantly lower than expected only
for SM (Table 4). Remarkably, the variance of WD was smaller than expected only in a few
plots, (Table 3).
Table 4: The kurtosis of trait values per plot, and the standard deviation of the distribution per plot of
"neighbor distances" (sdND), i.e., functional distances among neighbors in the list of species ordered
according to their trait values. Figures show the number of plots where the kurtosis or sdND observed
for the values of each trait was smaller than the kurtosis or sdND expected according to a lottery null
model (kurtosis) or to a two–step model accounting for habitat filtering (sdND).

Diversidad funcional y filogenética en los Bosques Secos del Sur del Ecuador
50
Kurtosis sdND
Trait No. plots < Wilcoxon
P
No. plots < Wilcoxon
P expectation Expectation
Hmax 55 out of 109 0.72 66 out of 109 0.61
WD 53 out of 109 0.80 47 out of 109 0.95
LS 62 out of 109 0.05 52 out of 109 0.84
SLA 54 out of 109 0.39 50 out of 109 0.06
SM 40 out of 109 0.99 66 out of 109 0.01
Hmax – maximum height; WD – wood density; LS – leaf size; SLA – specific leaf area; SM – seed mass. P – p-
value
Average values (per plot) for four traits showed correlation with annual precipitation.
Average Hmax, WD and SLA decreased as annual precipitation increased, while SM increased
with precipitation (Table 5). In parallel, range and variance of Hmax, SM and SLA values per
plot increased with precipitation. Kurtosis of Hmax and SM were also positively correlated
with annual precipitation (Table 5). The sdND of LS and WD showed respectively positive
and negative correlations with annual precipitation (Table 5).
Table 5: Spearman rank correlation coefficients between plot value, range, variance, kurtosis,
standard deviation of nearest distance (sdND) and mean for plant functional traits and annual
precipitation. Bold values indicate correlations with p<0.05
Trait Range Variance Kurtosis sdND Mean
Hmax 0.38 (p=<0.001) 0.34(p=0.0002) 0.31(p=0.001) 0.01 –0.23(p=0.002)
WD 0.08 0.01 0.06 –0.28(p= 0.006) –0.47(p=0.001)
LS 0.18 0.05 0.03 0.30(p= 0.0004) –0.05
SLA 0.46(p=<0.001) 0.46(p=<0.001) 0.18 0.08 –0.32(p=0.0007)
SM 0.34(p=0.0002) 0.26(p=0.005) 0.35(p=0.0002) 0.12 0.38(p=0.001)
Hmax – maximum height; WD – wood density; LS – leaf size; SLA – specific leaf area; SM – seed mass.

Diversidad funcional y filogenética en los Bosques Secos del Sur del Ecuador
51
Discussion
Although numerous functional trait-based studies have shown functional patterns from
temperate to Mediterranean and tropical moist forest ecosystems, there are relatively few
studies addressing patterns of functional trait diversity in tropical dry forests (TDFs) or other
extensive water-limited ecosystems [18,60,61,62].
The distributions of trait values within the Tumbesian TDFs were clearly nonrandom,
suggesting that the studied plant traits play an important role in determining the success or
failure of each species in each particular site. We did not find intra-specific trait correlations
(except for the case of Hmax and LS, Table 1), which implies that the potential response of
the studied traits to habitat filtering and competition could be considered independent.
We found signal of habitat filtering (smaller than expected range and variance of trait values)
for three traits: SLA, Hmax, and SM (Table 3). We found also evidence for limiting
similarity (lower kurtosis or lower sdND values than expected, respectively) for LS and SM,
and a lower variance for WD (Table 4). These results support the idea that both habitat
filtering and limiting similarity, which are considered sometimes as competing models of
community assembly, act simultaneously in the South Ecuadorian dry forests and,
sometimes, even act over the same trait (e.g., over SM).
The platykurtic distribution of LS and the trend towards large variance of WD within
communities are probably related to competition for water. Being water the main limiting
resource in the Tumbesian forests [19], a niche partition around water use efficiency, which
is closely related to LS [27,63, 64] and WD [65], would promote coexistence within the
community.
The even spacing of SM values could be interpreted under the same framework of niche
partition, i.e., as the result of the dispersion of different regeneration strategies associated to
microsite variability within plots (i.e., very fine spatial scale). This is congruent with the

Diversidad funcional y filogenética en los Bosques Secos del Sur del Ecuador
52
known relationship between seed size and the competition-colonization trade-off [47,66] and
similar results have been found in other ecosystems, such as the Great Basin pine
communities [67] or the California Chaparral [36]
Another sign of the mediation of the environment in trait-based community assembly is the
variation of average community trait values through the environmental gradient. In fact,
environmental gradients can generate species turnover [68] caused by the gradient filtering
different species at different environmental conditions [36], which, in turn modify
community mean trait values along the gradient. We confirmed the existence of shifts in
mean community values along the precipitation gradient for most traits. For example,
community SLA increased as the climate became drier. Although this finding may seem
counterintuitive and contrary to what has been found in a number of studies [36,69,70], SLA
was not significantly related to climatic parameters in a global study reported by Ordoñez
[71]. The usual decline of SLA along gradients of decreasing moisture is usually mediated by
a transition from thin, large-leaved, deciduous plants to thick, small-leaved, perennial species
[36]. In the Tumbesian forests however, most species are deciduous [19,72], and must build a
new foliar system each wet season. As the duration of the wet season is related to annual
precipitation in the Tumbesian region [73], faster foliar development (and therefore higher
SLA, [74,75,76]) would be favored at the driest sites.
The variation of WD along the precipitation gradient was consistent with the lower stem-
growth rates expected in the drier sites. High WD are related to low growth rates and to the
development of thick cell walls [39], which additionally enable stems to resist embolism
while maintaining highly negative water potentials [77].
The average Hmax per plot increased with declining annual precipitation. This is surprising
as the dispersion of Hmax values within plots showed symptoms of habitat filtering (i.e.,
lower range and variance than expected according to null models), which suggest that drier

Diversidad funcional y filogenética en los Bosques Secos del Sur del Ecuador
53
conditions favor the establishment of species with potentially larger height. We think that in
this case the convergence in trait values is not caused by habitat filtering but instead is the
result of the competitive processes for light [78]. In fact, larger Hmax is positively related to
faster growth rates in tropical trees [44], as access to light increases exponentially with height
in forest canopies [43]. This, in combination with their larger LS (LS is correlated with Hmax
at species level; Table 1) would make Tumbesian species with larger potential height grow
faster than the smaller ones. In the drier sites, where the growing season is shorter, a faster
growth rate (i.e. a larger potential height) should be a competitive advantage.
Average SM per plot decreased with declining annual precipitation. This is not surprising as
high SM provides a competitive advantage for seedlings in the most competitive extreme
(i.e., the humid extreme) of the precipitation gradient [47,79,80,81]. In fact, larger seeds
provide the emerging seedlings with larger reserves and make them succeed size-dependent
competition, and to recover easily from damage caused, e.g., by herbivory or falling debris
[82], processes more important in the most productive (i.e., humid) extreme of the gradient.
On the contrary, small seed species are better colonizers of sites where conditions for
establishment are ephemeral both in time and space [48,83].
Finally, the influence of the environment on the processes mediating community assembly
could be confirmed by assessing the existence of shifts in the distribution of trait values
within communities along the environmental gradient. We confirmed that the distributions of
some traits shifted also along the gradient of precipitation. For example, the range and
variance of SLA, Hmax and SM decreased with declining precipitation. This means a
shortage of the allowed functional strategies for these traits as the environmental conditions
become harder. This result is contrary to recent views that expect convergence to occur in
more productive sites [76,78,84], and instead agrees with the traditional niche differentiation
theory, which expects these convergences to occur in the more stressful sites [85]

Diversidad funcional y filogenética en los Bosques Secos del Sur del Ecuador
54
The kurtosis of Hmax and SM decreased with declining precipitation, as did the sdND of LS.
This means that, within communities, the spread of values for these traits increased as
precipitation decreased. This result points to an increase of the effects of competition, as the
environmental conditions become harder [86,87,88].
In the case of wood density, we found that sdND increased as precipitation declined, which
means that the spread of WD values was less even in dry sites, i.e., that the effects of
competition (or limiting similarity) on this trait decrease as the climate becomes harder. This
shows that the selective pressures for this trait and those for Hmax and SM are operating
along different resource axes.
In conclusion, we confirmed the influence of both habitat filtering and limiting similarity on
the assembly of the Tumbesian forests. The existence of a neat trend for plot mean trait
values across the precipitation gradient is consistent with the idea of habitat filtering: within
each sampled habitat, only species inside of the viable range of trait values will be included.
The results of the correlation analysis suggest that in the drier sites, the successful functional
strategy consist of high SLA, high WD, high Hmax and low SM (Table 5). We confirmed
that the gradient also modifies the strength of the limiting similarity and the habitat filtering
processes, with a shortage of the allowed functional strategies (i.e., a decrease of the range of
trait values) and an increase of the effects of competition (a more even distribution of trait
values), for most traits, as the conditions become drier.
Diversidad funcional y filogenética en los Bosques Secos del Sur del Ecuador
55
References
1. Grime JP. Evidence for the existence of three primary strategies in plants and its relevance to
ecological and evolutionary theory. The American Naturalist.1977; 111: 1169–1194.
2. Keddy PA. A pragmatic approach to functional ecology. Functional Ecology.1992; 6: 621–
626.
3. Diamond JM. Assembly of species communities. In: Cody, M.L., Diamond, J.M. (Eds.),
Ecology and Evolution of Communities. Belknap Press, Harvard University Press, Cambridge. 1975;
342–444.
4. Gotzenberger LF, de Bello KA, Bråthen J, Davison A, Dubuis A, et al. Ecological assembly
rules in plant communities–approaches, patterns and prospects. Biological Reviews. 2012; 87: 111–
127.
5. Violle C, Navas ML, Vile D, Kazakou E, Fortunel C. et al. Let the concept of trait be
functional! Oikos. 2007; 116: 882–892.
6. Cadotte MW, Cavender-Bares J, Tilman D, Oakley TH. Using phylogenetic, functional and
trait diversity to understand patterns of plant community productivity. PLoS One. 2009; 4(5), e5695.
7. Adler PB, Salguero-Gómez R, Compagnoni A, Hsu JS, Ray-Mukherjee J. Functional traits
explain variation in plant life history strategies. Proceedings of the National Academy of Sciences.
2014; 111: 740–745.
8. Watkins AJ, Wilson JB. Local texture convergence: a new approach to seeking assembly
rules. Oikos. 2003; 102: 525–532.
9. Weiher E, Keddy P. Ecological assembly rules: perspectives, advances, retreats. Cambridge
University Press. 2001.
10. Brooker RW, Callaghan. The balance between positive and negative plant interactions and its
relationship to environmental gradients: a model. Oikos.1998; 81: 196–207.
11. Choler P, Michalet R, Callaway RM. Facilitation and competition on gradients in alpine plant
communities. Ecology. 2001; 82: 3295–3308.
12. Callaway RM, Brooker RW, Choler P, Kikvidze Z, Lortie CJ, et al. Positive interactions
among alpine plants increases with stress. Nature. 2002; 417: 844–848.
13. Brooker RW. Plant–plant interactions and environmental change. New Phytologist 2006; 171:
271–284.
14. Wright IJ, Reich PB, Westoby M. Strategy shifts in leaf physiology, structure and nutrient
content between species of high- and low-rainfall and high- and low-nutrient habitats. Functional.
Ecology. 2001; 15, 423–434.
15. Cavender‐ Bares J, Ackerly DD, Baum DA, Bazzaz FA. Phylogenetic overdispersion in
Floridian oak communities. The American Naturalist. 2004; 163(6), 823-843.

Diversidad funcional y filogenética en los Bosques Secos del Sur del Ecuador
56
16. Best BJ, Kessler M. Biodiversity and conservation in Tumbesian Ecuador and Peru. BirdLife
International, Cambridge, UK. 1995.
17. Sánchez-Azofeifa GA, Quesada M, Rodríguez JP, Nassar JM, Stoner KE, et al. Research
Priorities for Neotropical Dry Forests1. Biotropica. 2005; 37: 477–485.
18. Hulshof CM, Martínez-Yrízar A, Burquez A, Boyle B, Enquist BJ. Plant functional trait
variation in tropical dry forests: a review and synthesis. Tropical dry forests in the Americas: ecology,
conservation, and management CRC Press, Boca Raton. 2013; 129–140.
19. Espinosa C, Cabrera O, Luzuriaga A, Escudero A. What Factors Affect Diversity and Species
Composition of Endangered Tumbesian Dry Forests in Southern Ecuador. Biotrópica. 2011; 43: 15–
22
20. Espinosa CI, Luzuriaga A, de la Cruz M, Escudero A. Climate and grazing control nurse
effects in an Ecuadorian dry shrubby community. Journal of Tropical Ecology. 2013; 30 23–32
21. Dinerstein E, Olson DM, Gram DJ, Webster AL, Primn SA, et al. Una evaluación del estado
de conservación de las eco-regiones de América Latina y Caribe. Banco Internacional de
Reconstrucción y Fomento/Banco Mundial, Washington, DC. 1995.
22. Aguirre Z, Kvist L. Floristic composition and conservation status of the dry forests in
Ecuador. Lyonia. 2005; 8: 41–67.
23. Joergensen PM, Leon-Yanez S. Catalogue of the vascular plants of Ecuador. Monographs of
Systematic Botany of the Missouri Botanical Garden. 1999; 75: 1–1182.
24. Valencia R, Pitman N, León–Yánez S, Jergensen PM. Libro rojo de las plantas endémicas del
Ecuador. Herbario QCA, Pontificia Universidad Católica del Ecuador. Quito. 2000.
25. Hijmans RJ, Cameron SE, Parra JL, Jones PG, Jarvis A. Very high resolution interpolated
climate surfaces for global land areas. International journal of climatology. 2005; 25: 1965–1978.
26. Cornelissen JHC, Lavorel S, Garnier E, Diaz S, Buchmann et al. A handbook of protocols for
standardised and easy measurement of plant functional traits worldwide. Australian journal of Botany.
2003; 51: 335–380.
27. Ackerly DD, Knight C, Weiss S, Barton K, Starmer K. Leaf size, specific leaf area and
microhabitat distribution of chaparral woody plants: contrasting patterns in species level and
community level analyses. Oecologia. 2002; 130: 449–457.
28. Poorter L, Bongers F. Leaf traits are good predictors of plant performance across 53 rain
forest species. Ecology. 2006; 87: 1733–1743.
29. Schimper AFW, Fisher WR, Groom P, Balfour IB.1903. Plant geography upon a
physiological basis. Clarendon Press. Oxford. 1903; 839
30. Hamann O. On climatic conditions, vegetation types, and leaf size in the Galápagos Islands.
Biotropica. 1979; 11: 101–122

Diversidad funcional y filogenética en los Bosques Secos del Sur del Ecuador
57
31. Dolph, G. E. and Dilcher, D. L. Variation in leaf size with respect to climate in the tropics of
the Western Hemisphere. Bulletin of the Torrey Botanical Club. 1980; 107: 154–162.
32. Givnish, T. J. Leaf and canopy adaptations in tropical forests. In Physiological ecology of
plants of the wet tropics. 1984; 12: 51–84.
33. Skarpe, C. Plant functional types and climate in a southern African savanna. Journal of
Vegetation Science. 1996; 7: 397–404
34. Cunningham SA, Summerhayes B, Westoby, M. Evolutionary divergences in leaf structure
and chemistry, comparing rainfall and soil nutrient gradients. Ecological Monographs. 1999; 69: 569–
588.
35. Fonseca CR, Overton JM, Collins B, Westoby M. Shifts in trait‐ combinations along rainfall
and phosphorus gradients. Journal of Ecology. 2000; 88: 964–977.
36. Cornwell WK, Ackerly DD. Community assembly and shifts in plant trait distributions across
an environmental gradient in coastal California. Ecological Monographs. 2009; 79: 109–126.
37. Ackerly DD. Functional strategies of chaparral shrubs in relation to seasonal water deficit and
disturbance. Ecological Monographs. 2004; 74: 25–44.
38. King DA, Davies SJ, Noor NSM. Growth and mortality are related to adult tree size in a
Malaysian mixed dipterocarp forest. Forest Ecology and Management. 2006; 223: 152–158.
39. Castro-Díez P, Puyravaud JP, Cornelissen J, Villar-Salvador P. Stem anatomy and relative
growth rate in seedlings of a wide range of woody plant species and types. Oecologia. 1998; 116: 57–
66.
40. van Gelder HA, Poorter L, Sterck FJ. Wood mechanics, allometry, and life‐ history variation
in a tropical rain forest tree community. New Phytologist. 2006; 171: 367–378.
41. Augspurger CK. Seedling survival of tropical tree species: interactions of dispersal distance,
light-gaps, and pathogens. Ecology. 1984; 65: 1705–1712.
42. Westoby, M. A leaf-height-seed (LHS) plant ecology strategy scheme. Plant Soil. 1998; 199:
213–227.
43. Poorter L, Bongers F, Sterck FJ, Woell H. Beyond the regeneration phase: differentiation of
height–light trajectories among tropical tree species. Journal of ecology. 2005; 93: 256–267.
44. Poorter L, Paz H, Wright SJ, Ackerly DD, Condit R. et al. Are functional traits good
predictors of demographic rates? Evidence from five neotropical forests. Ecology. 2008; 89: 1908–
1920.
45. Coomes DA, Grubb PJ. Colonization, tolerance, competition and seed–size variation within
functional groups. Trends in Ecology and Evolution. 2003; 18: 283–291
46. Kitajima K. Do shade-tolerant tropical tree seedlings depend longer on seed reserves?
Functional growth analysis of three Bignoniaceae species. Functional Ecology. 2002; 16: 433– 444.

Diversidad funcional y filogenética en los Bosques Secos del Sur del Ecuador
58
47. Moles AT, Westoby M. Seed size and plant strategy across the whole life cycle. Oikos. 2006;
113: 91–105.
48. Dalling JW, Hubbell SP, Silvera K. Seed dispersal, seedling establishment and gap
partitioning among tropical pioneer trees. Journal of Ecology. 1998; 86: 674–689.
49. Whaley OQ, Orellana A, Pérez E, Tenorio M, Quinteros F,et al. Plantas y Vegetación de Ica,
Perú – Un recurso para su restauración y conservación. Royal Botanic Gardens, Kew. 2010.
50. Aguirre Z, Cueva E, Merino E, Quizhpe W, Valverde A. Evaluación ecológica rápida de la
vegetación en los bosques secos de La Ceiba y Cordillera Arañitas, provincia de Loja, Ecuador. Pp.
15-35. En M.A. Vásquez, M. Larrea, L. Suárez and P. Ojeda (eds.). Biodiversidad en los Bosques
Secos del Sur-Occidente de la Provincia de Loja. EcoCiencia, Ministerio del Ambiente, Herbario
LOJA y Proyecto Bosque Seco. 2001; Quito. Ecuador.
51. Aguirre Z, Zofhre H. Especies forestales de los bosques secos del Ecuador. Guia
dendrológica. 2012; 392.
52. Zanne AE, Lopez-Gonzalez G, Coomes DA, Ilic J, Jansen S et al. Global wood density
database. 2009; Dryad. Identifier: http://hdl.handle.net/10255/dryad.235.
53. Kraft NJ, Ackerly DD. Functional trait and phylogenetic tests of community assembly across
spatial scales in an Amazonian forest. Ecological Monographs. 2010; 80: 401–422.
54. Royal Botanic Gardens Kew. Seed Information Database (SID). Versión 7.1. Available from.
October 2013; http://data.kew.org/sid/
55. van der Valk, A. G. Succession in wetlands: a Gleasonian approach. Ecology. 1981; 62: 688–
696.
56. Weiher E, Keddy PA. Assembly rules, null models, and trait dispersion: new questions from
old patterns. Oikos. 1995; 74: 159–164.
57. Shmida A, Wilson MV. Biological determinants of species–diversity. Journal of
Biogeography. 1985; 12: 1–20
58. Aiba M, Katabuchi M, Takafumi H, Matsuzaki SIS, Sasaki T, et al. Robustness of trait
distribution metrics for community assembly studies under the uncertainties of assembly processes.
Ecology. 2013; 94: 2873–2885.
59. R Development Core Team. R: A Language and Environment for Statistical Computing.
Vienna. 2014; R Foundation for Statistical Computing.
60. Chaturvedi RK, Raghubanshi AS, Singh JS. Leaf attributes and tree growth in a tropical dry
forest. Journal of Vegetation Science. 2011; 22: 917–931.
61. Markesteijn L, Poorter L, Bongers F, Paz H, Sack L. Hydraulics and life history of tropical
dry forest tree species: coordination of species’ drought and shade tolerance. New Phytolgist. 2011;
191, 480–495.

Diversidad funcional y filogenética en los Bosques Secos del Sur del Ecuador
59
62. Markesteijn L, Poorter L, Paz H, Sack L, Bongers F. Ecological differentiation in xylem
cavitation resistance is associated with stem and leaf structural traits. Plant Cell Environmental.
2011b; 34, 137–148.
63. Parkhurst DF, Loucks OL. Optimal leaf size in relation to environment. The Journal of
Ecology. 1972; 60: 505–537.
64. Givnish TJ, Vermeij GJ. Sizes and shapes of liane leaves. American Naturalist. 1976; 110:
743–778.
65. Mendivelso HA, Camarero JJ, Royo Obregón O, Gutiérrez E, Toledo M. Differential Growth
Responses to Water Balance of Coexisting Deciduous Tree Species Are Linked to Wood Density in a
Bolivian Tropical Dry Forest. PLoS ONE. 2013; 8: 73855.
66. Jakobsson A, Eriksson O. A comparative study of seed number, seed size, seedling size and
recruitment in grassland plants. Oikos. 2000; 88: 494–502.
67. Veech JA. Predator–mediated interactions among the seeds of desert plants. Oecologia. 2000;
124: 402–407.
68. Whittaker RH. Vegetation of the Great Smoky, Mountains. Ecological Monographs. 1956;
26: 1–69.
69. May F, Giladi I, Ristow M, Ziv Y, Jeltsch F. Plant functional traits and community assembly
along interacting gradients of productivity and fragmentation. Perspectives in Plant Ecology,
Evolution and Systematics. 2013; 15: 304–318.
70. Roa-Fuentes LL, Templer PH, Campo J. Effects of precipitation regime and soil nitrogen on
leaf traits in seasonally dry tropical forests of the Yucatan Peninsula, Mexico. Oecologia. 2015; 1–13.
71. Ordoñez JC, Van Bodegom PM, Witte JPM, Wright IJ, Reich PB, et al. A global study of
relationships between leaf traits, climate and soil measures of nutrient fertility. Global Ecology and
Biogeography. 2009; 18: 137–149.
72. Pringle EG, Adams RI, Broadbent E, Busby PE, Donatti CI, Kurten EL, Dirzo R. Distinct
Leaf trait Syndromes of Evergreen and Deciduous Trees in a Seasonally Dry Tropical Forest.
Biotropica. 2011; 43: 299–308.
73. Espinosa CI, De la Cruz M, Luzuriaga A L, Escudero A. Bosques tropicales secos de la
región Pacífico Ecuatorial: diversidad, estructura, funcionamiento e implicaciones para la
conservación. Revista Ecosistemas. 2012; 21(1-2).
74. Reich PB, Ellsworth DS, Walters MB, Vose JM, Gresham C, Volin JC, et al Generality of
leaf trait relationships: a test across six biomes. Ecology. 1999; 80(6), 1955-1969.
75. Westoby M, Falster DS, Moles AT, Vesk PA, Wright IJ. Plant ecological strategies: some
leading dimensions of variation between species. Annual review of ecology and systematics. 2002;
125-159.

Diversidad funcional y filogenética en los Bosques Secos del Sur del Ecuador
60
76. Carboni M, de Bello F, Janeček Š, Doležal J, Horník J, et al. Changes in trait divergence and
convergence along a productivity gradient in wet meadows. Agriculture, Ecosystems and
Environment. 2014 182: 96–105.
77. Hacke UG, Sperry JS, Pockman WT, Davis SD, McCulloh KA. Trends in wood density and
structure are linked to prevention of xylem implosion by negative pressure. Oecologia. 2001; 126:
457–461.
78. Mayfield MM, Levine JM. Opposing effects of competitive exclusion on the phylogenetic
structure of communities. Ecology letters. 2010; 13: 1085–1093.
79. Leishman MR, Wright IJ, Moles AT, Westoby M. The evolutionary ecology of seed size. In:
Fenner, M. (Ed.), Seeds: The Ecology of Regeneration in Plant Communities. CAB International,
Wallingford. 2000; 2: 31–57.
80. Metz J, Liancourt P, Kigel J, Harel D, Sternberg M, et al. Plant survival in relation to seed
size along environmental gradients: a long‐ term study from semi‐ arid and Mediterranean annual
plant communities. Journal of Ecology. 2010; 98: 697–704.
81. Harel D, Holzapfel C, Sternberg M. Seed mass and dormancy of annual plant populations and
communities decreases with aridity and rainfall predictability. Basic and Applied Ecology. 2011; 12:
674–684.
82. Harms KE, Dalling JW. Damage and herbivory tolerance through resprouting as an advantage
of large seed size in tropical trees and lianas. Journal of Tropical Ecology. 1997; 13: 617–621.
83. Cochrane JA, Hoyle GL, Yates C, Wood J, Nicotra AB. Climate warming delays and
decreases seedling emergence in a Mediterranean ecosystem. Oikos. 2015; 124: 150–160.
84. Grime JP. Trait convergence and trait divergence in herbaceous plant communities:
mechanisms and consequences. Journal of Vegetation Science. 2006; 17: 255–260.
85. Weiher E, Keddy PA. The assembly of experimental wetland plant communities. Oikos.1995;
73, 323–335.
86. Davis MA, Wrage KJ, Reich PB. Competition between tree seedlings and herbaceous
vegetation: support for a theory of resource supply and demand. Journal of Ecology.1998; 86: 652–
661
87. Maestre FT, Cortina J. Do positive interactions increase with abiotic stress? A test from a
semi-arid steppe. Proceedings of the Royal Society Series B. 2004. 271: 331–333.
88. Armas C, Pugnaire FI. Plant interactions govern population dynamics in a semi-arid
community. Journal of Ecology. 2005; 93: 978–989.

Diversidad funcional y filogenética en los Bosques Secos del Sur del Ecuador
61
APPENDIX 1.
S1 Table: Mean trait values for 58 species of tropical dry forest. The letters a,b,c, mean the base literature of each trait. Hmax – maximum height; WD –
wood density; LA – leaf area; SLA – specific leaf area; SM – seed mass.
Family Species aHmax (m) bWD (g. cm–3) LS (cm2 ) SLA(cm2. g–1) dSM (g)
Mimosaceae Acacia macracantha Humb. and Bonpl. ex Willd. 12 0.73 28.16±4.6 6.93 3.12
Verbenaceae Aegiphila sp. 8 0.66 66.37±13.4 7.21 1.46
Opiliaceae Agonandra excelsa Griseb. 8 14.44±4.8 13.75 63.23
Annonaceae Annona sp. 4 0.44 124.29±25.6 19.73 20.06
Apocynaceae Aspidosperma sp. 10 0.65 67.09±10 10.42 2.64
Asteraceae Barnadesia arborea Kunth 4 11.62±2.5 15.92 1.43
Nyctaginaceae Bougainvillea peruviana Bonpl. 5 0.56 20.51±7.1 17.09 0.87
Burseraceae Bursera graveolens (Kunth) Triana and Planch 10 0.32 129.97±28.9 7.44 2.28
Caesalpinaceae Caesalpinia glabrata Kunth, Karl (Carl) Segismundo 8 0.95 42.83±9.4 9.95 10.63
Bombacaceae Cavanillesia platanifolia (Bonpl.) Kunth 25 0.60 279.24± 18.09 73.45
Bombacaceae Ceiba trischistandra (A. Gray) Bakh. 22 0.32 123.21±24.5 11.86 8.29
Ulmaceae Celtis iguanaea (Jacq.) Sarg. 6 0.66 48.54±8.8 3.91 15.52
Fabaceae Centrolobium ochroxylum Rose ex Rudd 12 0.69 226.68± 5.52 23.2
Solanaceae Cestrum auriculatum L'Hérit. 5 84.84±15.9 9.45 0.21
Verbenaceae Citarexylum sp 6 0.64 51.94± 16.03 14.21

Diversidad funcional y filogenética en los Bosques Secos del Sur del Ecuador
62
Polygonaceae Coccoloba ruiziana Lindau 6 0.61 48.04±10.9 20.36 1.37
Bixaceae Cochlospermum vitifolium (Willd.) Spreng. 15 0.22 128.08 8.25 1.43
Capparaceae Colicodendron scabridum (Kunth) Seem. 10 0.67 16.17±5.6 4.56 3.33
Boraginaceae Cordia alliodora (Ruiz and Pav.) Oken. 10 0.52 60.17±13.5 7.25 1.65
Boraginaceae Cordia lutea Lam. 7 0.52 52.51±6.5 7.46 10.55
Boraginaceae Cordia macrantha Chodat 15 0.52 140.15±35.0 7.99 3.13
Euphorbiaceae Croton sp. 8 0.46 128.84±26.8 4.43 0.31
Bombacaceae Eriotheca ruizii (K. Schum.) A. Robyns. 15 0.39 177.26±45.8 19.59 1.14
Erythroxylaceae Erythroxylum glaucum OE Schulz 5 0.19 8.97±1.3 12.81 1.16
Fabaceae Erythrina velutina Willd. 12 0.27 175.36± 10.44 13.17
Moraceae Ficus insipida Willd. 15 0.38 115.25±26.1 8.97 0.01
Asteraceae Fulcaldea laurifolia (Bonpl.) Poir. 8 0.46 21.64±45.8 2.9 0.2
Fabaceae Geoffroea spinosa Jacq. 10 0.67 30.23±12.5 11.76 137.92
Sterculiaceae Guazuma ulmifolia Lam. 10 0.51 51.82±12.1 11.97 0.36
Convolvulaceae Ipomoea wolcottiana Rose 8 0.30 125.41±25.14 16.48 4.76
Mimosaceae Leucaena trichodes (Jacq.) Benth. 10 0.65 40.14±13.9 17.84 1.53
Anacardiaceae Loxopterygium huasango Spruce ex Engl. 20 0.73 246.05±54.9 13.77 0.7
Fabaceae Machaerium millei Standl. 9 0.24 82.4±22.4 14.53 33.35
Moraceae Maclura tinctoria (L.) D. Don ex Steud. 15 0.79 22.14±4.5 16.65 1.92
Anacardiaceae Mauria heterophylla Kunth 10 0.31 246.18 16.43 NA
Mimosaceae Mimosa pigra L. 4 0.73 31.63±10 5.79 0.63

Diversidad funcional y filogenética en los Bosques Secos del Sur del Ecuador
63
Myrtaceae Myrcia fallax (Rich.) DC. 5 0.82 29.74±6.0 4.43 26.09
Piperaceae Piper sp. 3 0.39 106.58±22.1 21.27 0.51
Fabaceae Piscidia carthagenensis Jacq. 15 0.8 287.2 15.77 3.23
Nyctaginaceae Pisonia aculeata L. 8 0.58 23.24±6.2 4.82 1.82
Mimosaceae Pithecellobium excelsum (Kunth) Mart. 5 0.52 21.99±6.9 15.93 8.27
Flacourtiaceae Prockia crucis P. Browne ex L. 4 0.58 46.31±9.5 22.48 NA
Mimosaceae Prosopis juliflora (Sw.) DC. 10 0.79 8.46±2.5 20.14 1.79
Myrtaceae Psidium guayava Raddi 5 0.71 38.32±10.4 5.97 0.37
Rubiaceae Randia armata (Sw.) DC. 5 0.67 27.34±6.6 15.71 1.33
Sapindaceae Sapindus saponaria L. 8 0.67 96.1±23.4 12.63 69.79
Caesalpinaceae Senna mollissima (Humb. and Bonpl. ex Willd.) H.S. Irwin
and Barneby
6 0.56 152.48 7.18 3.6
Caesalpinaceae Senna spectabilis (DC.) H.S. Irwin and Barneby 8 0.56 268.34 24.99 1.62
Rubiaceae Simira ecuadorensis (Standl.) Steyerm. 8 0.8 194.43±44.3 11.84 3.88
Solanaceae Solanum albidum Dunal 5 0.42 152.49±31.3 14.22 0.02
Styracaceae Styrax sp 6 0.38 84.2±11.9 15.89 10.74
Bignoniaceae Tabebuia chrysantha (Jacq.) G. Nicholson 15 1 213.85±52.2 19.84 1.23
Bignoniaceae Tecoma castaneifolia (D.Don) Melch. 6 0.79 41.85±6.7 5.95 0.18
Combretaceae Terminalia valverdeae AH Gentry 10 0.70 62.37 6.17 2.1
Polygonaceae Triplaris cumingiana Fisch. Y CA Mey. 9 0.52 194.1±56.1 3.98 3.95
Urticaceae Urera sp. 7 0.21 43.63±7.2 46.41 0.05

Diversidad funcional y filogenética en los Bosques Secos del Sur del Ecuador
64
Asteraceae Vernonanthura patens (Kunth) H. Rob. 5 0.54 70.08± 9.27 0.01
Rhamnaceae Ziziphus thyrsiflora Benth. 8 0.88 34.89± 30.47 75.64
Symbol shows the averages of values the data for wood density and seed mass of the genus for each species
Symbol shows the averages of values the data for wood density and seed mass of the family for each species.
a Whaley OQ, Orellana A, Pérez E, Tenorio M, Quinteros F, et al. Plantas y Vegetación de Ica, Perú – Un recurso para su restauración y conservación. Royal Botanic
Gardens, Kew. 2010. a Aguirre Z, Cueva E, Merino E, Quizhpe W, Valverde A. Evaluación ecológica rápida de la vegetación en los bosques secos de La Ceiba y Cordillera Arañitas, provincia de
Loja, Ecuador. Pp. 15-35. En M.A. Vásquez, M. Larrea, L. Suárez and P. Ojeda (eds.). Biodiversidad en los Bosques Secos del Sur-Occidente de la Provincia de Loja.
EcoCiencia, Ministerio del Ambiente, Herbario LOJA y Proyecto Bosque Seco. 2001; Quito. Ecuador. aAguirre Z, Zofhre H. Especies forestales de los bosques secos del Ecuador. Guia dendrológica. 2012; 392.
bZanne AE., Lopez-Gonzalez G*, Coomes DA, Ilic J, Jansen S, et al. Global wood density database. 2009; Dryad. Identifier: http://hdl.handle.net/10255/dryad.235.
bChave J, Coomes D, Jansen S, Lewis SL, Swenson NG, Zanne AE. Towards a worldwide wood economics spectrum. Ecology letters. 2009; 12: 351–366.
c Royal Botanic Gardens Kew. Seed Information Database (SID). Versión 7.1. Available from. October 2013; http://data.kew.org/sid/

Diversidad funcional y filogenética en los Bosques Secos del Sur del Ecuador
65

Diversidad funcional y filogenética en los Bosques Secos del Sur del Ecuador
66
CAPÍTULO 2
Linking functional and phylogenetic diversities with assembly
processes in a dry neo tropical forest

Diversidad funcional y filogenética en los Bosques Secos del Sur del Ecuador
67

Diversidad funcional y filogenética en los Bosques Secos del Sur del Ecuador
68
ABSTRACT
One of the most important challenges for ecologist is to understand the assemblage
mechanisms of plant communities. One compelling community assembly model predicts that
environmental filtering will be more important in structuring communities in stressful
environments, while competitive interactions will be more important in benign environments
These focus ignores the importance of other assembly processes such as equalizing fitness
processes and facilitation important in the community assembly.
We intended to determine whether facilitation under the highest level of stress modifies the
expected response for habitat filtering and limiting similarity by adding phylogenetically and
functionally distinct species to the community. In the present work we evaluated the
functional structure of five important plant functional traits along a climatic stress gradient.
We compared the observed trait distribution in the community with a null model that assumes
random community assembly.
Our results suggest evidences of habitat filtering in the values taken by most traits along the
stress gradient (measured as CWN), no evidence that functional diversity shifted along the
environmental gradient was found for any trait except for leaf size. The usual decline of LS at
along gradients of decreasing moisture is usually mediated by a transition from thin, large-
leaved, deciduous plants to thick, small-leaved, perennial species. Other factor is the
increased leaf nitrogen in arid environments, as an adaptation to prevent water loss by
allowing stomata to remain closed for longer periods of time

Diversidad funcional y filogenética en los Bosques Secos del Sur del Ecuador
69
INTRODUCTION
One of the most important challenges for ecologist is to understand the assemblage
mechanisms of plant communities (Keddy 1992; Weiher and Keddy 1995; Chesson 2000;
Ackerly 2003; Götzenberger et al. 2012; Price et al. 2012). A promising approach for
disentangle these mechanisms is the use of functional and phylogenetic diversities (McGill et
al. 2006; Kraft et al. 2008; Mayfield and Levine 2010; Wiens et al. 2011; Paine et al. 2011;
Katabuchi et al. 2012; Shipley et al. 2012). A complete theoretical framework has been built
to describe how the environmental conditions affect the values taken by these two community
attributes during the assemblage of plant communities (Lavorel and Garnier, 2002; McGill et
al. 2006; Jeltsch et al. 2008).
Two potentially opposing processes can structure the distribution of functional diversity
along environmental gradients. Firstly, abiotic limitations increase the species functional
similarity, because the co-occurring species needs to be functionally adapted to the same
abiotic envelope (May et al. 2013). This process is known as "habitat filtering" (Cornwell and
Ackerly, 2009). Secondly, under more productive conditions prevalence of competition
would predict a limit in the similarity of coexisting species (MacArthur and Levins 1967;
Pacala and Tilman 1994). Since that species with similar functional traits may have a
substantial overlap niche, it is expected that co-occurring species show divergence of traits
(MacArthur and Levins 1967; Stubbs and Wilson 2004; Kraft et al. 2008). This process is
known as “limiting similarity” (Cornwell and Ackerly 2009). Thus, while the habitat filtering
reduces the functional diversity (Weiher and Keddy 1995; Weiher et al. 2011), the limiting
similarity increases the functional diversity among coexisting species (Cornwell and Ackerly
2009; Weiher et al. 2011). If these niche and functional differences matter they should shift

Diversidad funcional y filogenética en los Bosques Secos del Sur del Ecuador
70
along gradients simply because their prevalence appears associated to stressful conditions
(Bernard-Verdier et al. 2012)
The relationship between functional and phylogenetic diversity is rooted in the reasonable
assumption that evolutionary diversification has generated traits diversification, which in turn
may result in greater niche complementarity and similarity associated to relatedness (Webb
2000). Thus, related species (i.e. same genus) are functionally and ecologically more similar
than distantly related species (Webb et al. 2002). This framework allows inferring the
potential mechanisms that underlie phylogenetic structure of a community when compared
with null expectation generated by drawing species at random from a regional pool of
potential colonists (Webb 2000; Cornwell et al. 2006). In the same way that functional
diversity, the phylogenetic diversity can be affected for “habitat filtering” and “limiting
similarity” (i.e. competitive exclusion). If the habitat filtering is the assembly community
process and plants exhibit evolutionary niche conservatism, then closely related species with
similar traits should coexist within a community more commonly than expected and the
species would be clustered in the phylogeny (Webb et al. 2002; Cavender-Bares et al. 2004;
Losos 2008). Alternatively, if competitive exclusion is a primary driver of community
composition, this should limit coexistence of closely related species with similar niches, and
species would be overdispersed in the phylogeny (Webb et al. 2002; Cavender-Bares et al.
2004; Kraft et al. 2007).
It is expected that the importance of these opposing processes, habitat filtering and limiting
similarity, vary along environmental gradients, affecting the community assemblage.
(Freschet et al. 2011; Violle et al. 2012). Based on these assumptions, a widespread
expectation is that functional diversity decreases under strong biotic stress and it increases in
milder habitats (e.g. Weither and Keddy 1995; Spasojevic and Suding 2012) and that

Diversidad funcional y filogenética en los Bosques Secos del Sur del Ecuador
71
phylogenetic diversity is clustered under strong biotic stress and shows overdispersion in
mesic habitats (e.g. Webb et al. 2002; Swenson and Enquist 2009).
Although these two are among the main processes in the community assembly there other
processes that can also affect the functional diversity of community and phylogenetic
structure (Valiente-Banuet and Verdú 2007, Mayfield and Levine 2010; Weiher et al. 2011).
Even if niche differentiation prevents coexisting of similar species (i.e. limiting similarity)
competition may increases similarity among species (Chesson 2000). Under some conditions
species with similar traits may compete relatively equally, thus excluding competitors with
unfit traits (i.e. equalizing fitness processes Chesson 2000; Grime 2006). This process may
reduce functional diversity (Chesson 2000, Spasojevic and Suding 2012) and increase species
dispersion in the phylogeny. On the other hand, in stressful environments, facilitation often
allows the coexistence of species (Callaway et al 2002; Brooker et al. 2008; Butterfield 2009)
with different functional traits (Callaway 2007) and/or phylogenetically distant (Valiente-
Banuet et al. 2006) increasing the functional and phylogenetic diversity.
Under these limitations to know when and where both diversities run in parallel remains as a
challenge. In order to build a more general framework for disentangling the signatures of
habitat filtering and limiting similarity in community assembly left on functional and
phylogenetic diversities we have explored the diversities of dry tropical forests of southern
Ecuador along a large environmental gradient. Some works carried out in this ecosystem
have recognized the prevalence of facilitation and have shown that the strength of this
interaction increases with stress (Espinosa et al. 2011; 2013). We intended to determine
whether facilitation under the highest level of stress modifies the expected response for
habitat filtering and limiting similarity by adding phylogenetically and functionally distinct
species to the community.

Diversidad funcional y filogenética en los Bosques Secos del Sur del Ecuador
72
In the present work we evaluated the functional structure of five important plant functional
traits along a climatic stress gradient. We compared the observed trait distribution in the
community with a null model that assumes random community assembly. Based on this
approach, we want to answer the following specific questions: i) does functional and
phylogenetic diversity shift along abiotic stress gradients from lower values at the stressful
conditions to higher values at the more benign habitats?., and ii) does facilitation increase
functional and phylogenetic diversity in stressful environments?
Methods
Natural history of the Tumbesian dry forest
Tumbesian dry forests extend on a narrow fringe territory comprising 87,000 km2 along the
Pacific coast from the southwestern tip of Ecuador, to the northwestern of Peru (Dinerstein et
al. 1995). Our study area covers nearly 2000 km2 in the province of Loja (Zapotillo, Macará
and Celica districts) in the southernmost fringe of Ecuador, covering an altitude range from
120 to 2600 m. This territory encompasses one of the largest and best conserved remnants of
the Tumbesian dry forests in Ecuador (Aguirre and Kvist 2005; Espinosa et al. 2011). We
surveyed only well-conserved stands without evidences of recent anthropogenic
perturbations. Average annual temperature in the region is ca 24 ºC (range: 10–33 ºC). Mean
annual precipitation is ca 500 mm/yr (range: 270–1284 mm/yr) in average.
These forests are very rich in tree and shrub species (Espinosa et al. 2011) and are dominated
by Bursera graveolens, Acacia macracantha and Capparis scabrida. It is also the habitat of
several endangered tree species including Juglans neotropica, Siparuna eggersii (Joergensen
and León-Yánez 1999; Valencia et al. 2000).

Diversidad funcional y filogenética en los Bosques Secos del Sur del Ecuador
73
Field data
We placed 109 rectangular plots (10 x 50 m) on 48 homogeneous forest stands following a
stratified sampling design based on the available preliminary landscape maps in the territory.
In each plot we counted the number of individuals of all standing perennial species (see
details in Espinosa et al. 2011). From the Worldclim database (Hijmans et al. 2005), we
annotated for each plot the value of the mean annual precipitation, as this variable has been
shown to be one the main predictor of species turnover and is correlated to the variation of
community composition and structure in the area (Espinosa et al. 2011).
Plant functional trait selection and measurements
We selected a set of plant functional traits, which are known for being tightly related to
important processes in trees and shrubs. Leaf size (LS) plays a particularly important role in
carbon assimilation, water relations and energy balance (Ackerly et al. 2002). Plant growth
and survival are strongly connected to specific leaf area (SLA, leaf area per unit mass). This
trait represents an "economic" axis of variation that ranges from species typical of resource-
rich habitats, which have a rapid tissue turnover and high metabolic rates and whose
attributes enhance the rapid acquisition of photosynthetic carbon (high SLA), to species
tolerating resource-limited habitats which tend to show opposite attributes (Poorter and
Bongers 2006). SLA and LS decrease along gradients of declining moisture and/or nutrient
availability (Schimper et al. 1903; Hamann 1979; Dolph and Dilcher 1980; Givnish 1984;
Skarpe 1996; Cunningham et al. 1999; Fonseca et al. 2000; Ackerly et al. 2002).
LS is important for energy balance and hydraulic functioning, with smaller leaves generally
found in drier and more exposed habitats (Cornwell and Ackerly 2009). Wood density (WD)
is related to water efficiency and transport (Cornwell and Ackerly 2009). Although the

Diversidad funcional y filogenética en los Bosques Secos del Sur del Ecuador
74
variation of this trait is considered to be orthogonal to the leaf economic one (Ackerly 2004),
it is also related to growth and survival. Low WD is usually a surrogate of high stem growth
rates (King et al. 2006), whereas high WD are related to low growth rates and to the
development of thick cell walls (Castro-Díez et al. 1998), which makes stems more resistant
to breakage (van Gelder et al. 2006) and to fungi and pathogen attacks (Augspurger 1984).
Height maximum (Hmax) is related to access to light (Westoby 1998; Poorter et al. 2005).
Higher plants intercept on average more light and therefore have potentially faster growth
rates (Poorter et al. 2008). Seed mass (SM) is a crucial feature for dispersion and regeneration
and is related to the competition-colonization trade-off (Coomes and Grubb 2003). Large
seeds provide reserves for successful seedling establishment in poor light or intense
competitive conditions (Kitajima 2002). By contrast, small-seeded species produce more
seeds per unit of reproductive effort (Moles and Westoby 2006) and are better colonizers
(Dalling et al. 1998).
We selected all woody species appearing in at least 4 of the studied plots. Three traits (LS,
SLA and SM) were measured in the field and/or the laboratory, following standardized
protocols (Cornelissen et al. 2003). The rest (wood density and maximum height) were taken
from the literature.
For each species, we collected 10 leaves from each of 10 randomly chosen trees, covering all
the environmental range of each species in our data set. LS was measured with the program
Image J (Kraft et al. 2010) from scanned (300 dpi) fresh leafs. Leaf mass (for calculation of
SLA) was measured after 3 days drying at 60 ºC. Seeds were also collected from at least 10
fruits taken from different individuals of each species. We also used seed accessions from the
Germplasm Bank of Universidad Técnica Particular de Loja. SM was obtained after 48 hours
drying at 80 °C (Cornelissen et al. 2003). SM of ten species, which could not be collected in

Diversidad funcional y filogenética en los Bosques Secos del Sur del Ecuador
75
the field, were approximated by the average SM of congeneric species recorded in the Kew
Millennium Seed database (Royal Botanic Gardens Kew 2013).
STATISTICAL ANALYSIS
We conducted a principal components analysis (PCA) with all the recorded climatic and soil
variables using function rda of package vegan (Oksanen et al. 2013. The first PCA axis (PC1)
accounted for 51 % of the environmental variation and was highly correlated to variation in
climatic conditions, so we use plot scores in this axis as a measure of the mean environmental
gradient in subsequent analyses.
Species richness and Simpson’s diversity index was measured in each plot.
To summarize the functional composition of each plot, we used community-weighted means
of trait values (CWM, Garnier et al. 2004). In addition, we computed functional dispersion
(FDis, Laliberté and Legendre 2010) as a measure of functional diversity, using function
fdisp in the package FD (Laliberté and Legendre 2010). We computed CWM and FDis both
for each individual trait and for all the traits in combination. In addition, to describe
variability among communities in functional diversity, we classified the plots in 9 groups of
environmentally similar characteristics and calculated the coefficient of variation of FDis
(CVFDis) or each individual trait and for all the traits in combination. To make the
classification, we calculated the Euclidean distance among plots on the basis of their PC1
scores and computed a hierarchical clustering (Ward's minimum variance method) with the
function hclust of package stats (R Core et al. 2013). We partitioned the hierarchical
clustering into nine groups (varying in size from 9 to 15 plots; Spasojevic and Sunding 2012).
To calculate phylogenetic diversity, we first generated a phylogenetic tree for the 58-recorded
taxa using the program Phylomatic and the megatree version R20130707 (Webb and

Diversidad funcional y filogenética en los Bosques Secos del Sur del Ecuador
76
Donoghue 2005). Branch lengths were calibrated according to Wikström et al. (2001) using
the bladj algorithm of Phylocom (Webb et al. 2008). We then calculated phylogenetic
diversity for each plot as the mean pairwise distance (MPD) among co-occurring species with
function mpd in package picante (kembel 2010). As is usual in this kind of studies (e.g.,
Kembel and Hubbell, 2006; Kraft and Ackerly 2010, Spasojevic and Sunding 2012), to
quantify overall clustering of taxa on the phylogenetic tree, we computed the standardized
version of MPD, net relatedness index (NRI), comparing the observed MPD for each plot
with the expectations (mean and standard deviation) of a null model of community assembly.
A NRI of zero indicates no difference between observed and null values, values greater than
zero indicate phylogenetic overdispersion and values less than zero indicate phylogenetic
underdispersion (Webb et al. 2002).
Inference about FDis and NRI was based on the values of FDis and MPD computed for
communities simulated according to a null model based on GLM with fixed abundance and
richness
To determine how the measured variables (e.g. species diversity, mean Bray–Curtis
dissimilarity trait CWM's, difference in FDis, NRI and CVFDis) changed along the
environmental gradient, we fitted OLS regressions, testing both linear and quadratic
responses to plot scores in the PC1.We selected the best-fit using Akaike Information Criteria
(Crawley 2007). All computations were made in the R environment (R Core Team 2014).
RESULTS
Environmental gradient
The first principal component axis (PC1) accounted for 51 % of the variation in the
environmental data. Variables related to water availability such as altitude, precipitation in

Diversidad funcional y filogenética en los Bosques Secos del Sur del Ecuador
77
the driest month, annual precipitation, soil moisture and also others like pH and slope were
negatively correlated with the PC1 score. Variation in soil organic matter, total nitrogen and
organic carbon were mostly related to PC2, which accounted for an additional 19 % of
environmental variation (Appendix 1).
Species richness
We recorded 58 species in the 109 plots. The most abundant species were Simira
ecuadorensis (Rubiaceae), Tabebuia chrysantha (Bignoniaceae), Eriotheca ruizii
(Malvaceae) and Caesalpinia glabrata (Fabaceae), which appeared in >40 percent of the
plots. On the other hand, most species (54%) appeared in <5 percent of the plots. Maximum
richness per plot was 14 species, with a median of 4 species per plot.
Functional and phylogenetic diversity
We did not find intraspecific trait correlations except for the case of Hmax and LS (r = 0.3, p =
0.02).
Communities at the stressful end of the abiotic gradient (higher PC1 scores) tended to be
significantly higher in stature, with higher wood density. LS and SLA were largest at medium
environmental conditions and decreased to wards both ends of the environmental gradient
(quadratic relationship). Seed mass did not varied along the environmental gradient (Fig. 1).

Diversidad funcional y filogenética en los Bosques Secos del Sur del Ecuador
78
-1.0 -0.5 0.0 0.5 1.0
6
8
10
12
14
Maximum height (m)
-1.0 -0.5 0.0 0.5 1.0
0.4
0.5
0.6
0.7
0.8
Wood density (g/cm3)
-1.0 -0.5 0.0 0.5 1.0
50
100
150
200
Leaf size
Co
mm
unity w
eih
ted m
ea
n
-1.0 -0.5 0.0 0.5 1.0
5
10
15
20
Specific leaf area
Less stressful More stressful
Enviromental gradiente
-1.0 -0.5 0.0 0.5 1.0
0
10
20
30
40
50Seed mass
Less stressful More stressful
Enviromental gradiente
Figure.1. Community-weighted mean (CWM) trait values along the stress–resource environmental gradient
(principal components analysis component 1. Community- weighted Maximum height (m) (a: F11,107 = 6.88, R2
= 0.05, P = 0.01), Wood density (g. cm–3) (e: F1,107 = 19.81, R
2 = 0.15, P<0.001), leaf size (cm
2) (b: F2,106= 5.96,
R2 = 0.08, P = 0.004) Specific leaf area (cm
2. g–
1) (d: F1,106 = 6.83, R
2 = 0.10, P = 0.002).
For all traits, most communities showed functional diversity concordant with the expectations
of the null model of community assembly considered. In some cases, however, some plots
showed overdispersion or underdispersion for some traits. The trait for which most plots
deviated from the expected null FDis was wood density, for which 9% and 15 % of plots

Diversidad funcional y filogenética en los Bosques Secos del Sur del Ecuador
79
(n=10 and n=16) showed respectively over- and under-dispersion. Maximum height was the
trait for which there were the least deviations (only six over-dispersed and one under-
dispersed plots) (Fig. 2).
-1.0 -0.5 0.0 0.5 1.0
-0.05
0.00
0.05
0.10
Maximum height
-1.0 -0.5 0.0 0.5 1.0
-0.10
-0.05
0.00
0.05
0.10
0.15
0.20
Wood density
-1.0 -0.5 0.0 0.5 1.0
-0.2
-0.1
0.0
0.1
Leaf size
Fu
nctio
na
l d
ive
rsity
FD
IS o
bs -
Fd
is n
ull
-1.0 -0.5 0.0 0.5 1.0
-0.04
-0.02
0.00
0.02
0.04
0.06
0.08Specific leaf area
Less stressful More stressful
Enviromental gradiente
-1.0 -0.5 0.0 0.5 1.0
0.0
0.1
0.2
0.3
Seed Mass
Less stressful More stressful
Enviromental gradiente
Figure. 2. Functional diversity (FDis) for individual traits along a stress–resource environmental gradient
(principal components analysis component. We represent for each plot the difference between observed
(FDisobs) and the expected (FDisnull) functional diversity according to null model based on GLM with fixed
abundance and richness of community. The dashed line represents the expected difference whereas values larger

Diversidad funcional y filogenética en los Bosques Secos del Sur del Ecuador
80
and smaller than 0 indicate respectively over- and under-dispersion of FDis in respect to the null model.1).
Functional diversity significantly increased with increasing water stress only for leaf area (a: F1,106 = 3.87, R2 =
0.03, P < 0.05). Black symbols represent communities where functional diversity significantly differed (p <
0.05) from the null expectation; white symbols represent communities where the observed functional diversity
was not significantly different from the null expectation.
When FDis was computed from all traits combined, only five plots showed overdispersion
and eleven underdispersion (Fig. 3). The deviations from the expected FDisNULL occurred
uniformly along the whole environmental gradient for al traits except for leaf size, for which
functional diversity decreased towards the stressful end of the environmental gradient (Fig.2).
As in the case of the combined FDis, there were more underdispersed (14) than overdispersed
(5) cases among the plots that deviated from the expected phylogenetic diversity (as
estimated by NRI; Fig 3). Similarly, these deviations occurred along the whole environmental
gradient.
Fig. 3. Multivariate functional diversity (FDis) (principal components analysis component 1) and phylogenetic
diversity [net relatedness index (NRI)] did not change along the stress–resource environmental gradient than
null model. Black points represent plots where functional or phylogenetic diversity were significantly different
from the null model. The dashed line represents null functional diversity where negatives values indicate greater
functional diversity than null and positive values indicate less functional diversity than null.
-1.0 -0.5 0.0 0.5 1.0
-0.10
-0.05
0.00
0.05
Functional diversity
Environmental gradient
Fu
nct
iona
l div
ers
ity
FD
IS o
bs
- F
dis
null
-1.0 -0.5 0.0 0.5 1.0
-2
-1
0
1
2
3
4
5Phylogenetic diversity
Environmental gradient
NR
I

Diversidad funcional y filogenética en los Bosques Secos del Sur del Ecuador
81
Functional diversity of all traits was highly variable among communities (CVFDis F2,7 = 10.3,
R2 = 0.67, P = 0.008) at the stressful end of the environmental gradient. Variability among
communities diminished (lower CVFDis) towards the less stressful end of the gradient for SLA
(F2,7 = 7.49, R2 = 0.59, P = 0.01). CVFDis did not change over the environmental gradient for
leaf area (F1,9 = 4.14, R2 = 0.24, P = 0.07), wood density (F1,9 = 0.99, R
2 = <-0.001, P = 0.42),
maximum height (F2,8 = 7.49, R2 = 1.39, P = 0.30) and seed mass (F2,8 = 0.22, R
2 = -0.18, P =
0.80).
DISCUSSION
The study of shifting patterns in functional and phylogenetic diversity along environmental
gradients has been used to understand the mechanisms ruling community assembly and in
particular, the role of habitat filtering and limiting similarity (e.g. Spasojevic and Suding
2011; May et al. 2013; Kraft and Ackerly 2010). Robust evidence shows that both functional
diversity and phylogenetic dispersion are usually low under strong abiotic stress, and that
they increase in regions with mesic conditions and more competitive interactions (e.g.
Weiher and Keddy 1995; Corwell and Ackerly 2009). However, some processes such as
facilitation can modify this pattern due to the fact that positive interactions tend to occur
between phylogenetic and functional distant species (Valiente-Banuet and Verdú 2007)
increasing the functional diversity and phylogenetic dispersion and therefore shifting the
expected pattern under the more general theoretical framework. In our tropical dry forest we
found evidences of the more general pattern only with respect to the diversity of leaf size,
which decreased as abiotic stress increased.
On the other hand, when multivariate functional and phylogenetic diversity were evaluated
they did not showed significant variation along the environmental gradient..

Diversidad funcional y filogenética en los Bosques Secos del Sur del Ecuador
82
Changes in community weighted traits.
Interesantly, although functional and phylogenetic diversity showed no variation, the CWM's
for most traits were affected by the environmental gradient. CWM quantifies the dominant
trait values in a community and is consequently closely related to the ‘‘mass ratio
hypothesis’’ (Grime, 1998), which propose that ecosystem processes are mainly determined
by the functional traits of dominant species in a community (i.e. functional identity). The sign
of the CWM-environment relationship for some traits (e.g., Hmax and WD) is the same to the
sign found for the relationship between the unweighted community averages and annual
precipitation in another study (Gusmán et al. in revision) and points to habitat filtering as the
main process governing community assembly around these traits. In the case of SLA, we
found that the CWM decreased with favorable environmental conditions, as in the
unweighted analysis, but was better described by a quadratic relationship, i.e., CWM for SLA
were higher for intermediate environmental conditions and decreased towards both the
stressful and the favorable extremes of the gradient. The same relationship was found for the
CWM of leaf size. In our analyses, the CWM for seed mass was not significantly related to
environmental variation, but excluding two-outlier plots from the analysis, we found the
same relationship that we have reported to the unweighted case. The changes in the CWM
could be due stress tolerance of plants as response to habitat filtering (Weiher and Keddy
1995; Cornwell and Ackerly 2009; Lebrija-Trejos et al. 2010) and/or the equalizing fitness
processes (Spasojevic and Suding 2011).
In the stressfull habitats, leaf size and SLA are reduced probably as a response to low water
availability (Hulshof et al. 2013), i.e, as a consequence of habitat filtering. Although the
reduction of LS and SLA in more benign environmental conditions could be attributed to
some competitive process of equalizing fitness favoring convergence towards hypothetically

Diversidad funcional y filogenética en los Bosques Secos del Sur del Ecuador
83
more competitive small LS and SLA values, this should be accompanied by a decrease in
functional diversity of these traits, which does not happen (in fact there is a significant
increase of FDis for leaf size towards the more benign end of the environmental gradient). A
more plausible explanation for this decrease of CWM values for LS and SLA at the less
stressful in the case of leaf area our results showed effects of habitat filtering, the functional
diversity was low in the stressful habitats and the mean leaf area was smaller in drier sites, a
result consistent with other studies at local and regional scales (Parsons 1976; Wilf et al.
1998; Fonseca et al. 2000). The functional significance of leaf area is not entirely clear
(Corwell and Ackerly 2009). Leaf area can influence the thermal conductance of the leaf.
High leaf area serve to keep leaves with low temperature through evaporative cooling, this
mechanism is efficient under high water availability (Corwell and Ackerly 2009). At dry
sites, where limited soil water may lead to stomatal closure on a daily basis, closed stomata
and large leaves could lead to high and potentially damaging leaf temperatures (Givnish and
Vermeij 1976).
Changes in functional and phylogenetic diversity.
Functional diversity is regarded as key to understanding ecosystem processes and their
response to environmental stress (Norberg et al. 2001; Suding et al. 2008; Cadotte et al. 2009;
Flynn et al. 2011). Although we found evidences for habitat filtering in the average values
taken by most traits along the stress gradient (measured as CWN), no evidence that functional
diversity shifted along the environmental gradient was found for any trait except for leaf size.
The prevalence of environmental filtering in stressed communities should cause decreased
functional diversity (Mouchet et al. 2010) and phylogenetic clustering (this one in case that
traits related to abiotic stress are phylogenetically conserved, as is usually assumed (Webb et
al. 2002, Kembel 2009). This hypothesis ignores facilitation or assumes that its effects will be

Diversidad funcional y filogenética en los Bosques Secos del Sur del Ecuador
84
minor compared with the influence of environmental filtering in stressed communities
(Mason et al. 2013). However, there exists evidence about the dominant role played by in
structuring communities in stressful habitats (McAuliffe 1988; Tirado and Pugnaire 2005;
Valiente-Banuet et al. 2006). Espinosa et al. (2013, 2015) showed that in the interandean dry
shrublands and tropical dry forest facilitation shifts along environmental gradients, with an
increase of its effects towards more stressful conditions. Facilitation often allows the
coexistence of species (Callaway et al 2002; Brooker et al. 2008; Butterfield 2009) with
different functional traits (Callaway 2007) and/or phylogenetically distant (Valiente-Banuet
et al. 2006), which can increase phylogenetic dispersion and the functional diversity in the
stressful end of the gradient.
CONCLUSIONS
The assumption that habitat filtering reduced the functional diversity (Weiher and Keddy
1995; Cornwell and Ackerly 2009) and phylogenetic dispersion (Webb et al. 2002; Cavender-
Bares et al. 2004; Kraft et al. 2007) in stressful environments, and that limiting similarity
prevents coexisting of too similar species by competition, in more productive environments
(MacArthur and Levins 1967; Chesson 2000) ignores the importance of other alternative
mechanisms (i.e. facilitation, functional redundancy) operating on multiple niche axes. We
found evidences of habitat filtering in the values taken by most traits along the stress gradient
(measured as CWN), no evidence that functional diversity shifted along the environmental
gradient was found for any trait except for leaf size. The usual decline of LS at along
gradients of decreasing moisture is usually mediated by a transition from thin, large-leaved,
deciduous plants to thick, small-leaved, perennial species (Corwell and Ackerly 2009). Other
factor is the increased leaf nitrogen in arid environments, as an adaptation to prevent water

Diversidad funcional y filogenética en los Bosques Secos del Sur del Ecuador
85
loss by allowing stomata to remain closed for longer periods of time (Wright et al. 2001,
2005).

Diversidad funcional y filogenética en los Bosques Secos del Sur del Ecuador
86
References
Ackerly, D. D. (2003). Community assembly, niche conservatism, and adaptive evolution in changing
environments. International Journal of Plant Sciences, 164(S3), S165-S184.
Ackerly, D., Knight, C., Weiss, S., Barton, K., and Starmer, K. (2002). Leaf size, specific leaf area
and microhabitat distribution of chaparral woody plants: contrasting patterns in species level and
community level analyses. Oecologia,130(3), 449-457.
Ackerly, D.D. (2009). Conservatism and diversification of plant functional traits: evolutionary rates
versus phylogenetic signal. Proceedings of the National Academy of Sciences, 106(Supplement 2),
19699-19706.
Aguirre, Z., Kvist, L. P., and Sánchez, O. (2005). Floristic composition and conservation status of the
dry forests in Ecuador. Lyonia, 8, 41-67.
Augspurger, C. K. (1984). Light requirements of neotropical tree seedlings: a comparative study of
growth and survival. The Journal of Ecology, 777-795.
Bernard‐ Verdier, M., Navas, M. L., Vellend, M., Violle, C., Fayolle, A., and Garnier, E. (2012).
Community assembly along a soil depth gradient: contrasting patterns of plant trait convergence
and divergence in a Mediterranean rangeland. Journal of Ecology, 100(6), 1422-1433.
Brooker, R. W., Maestre, F. T., Callaway, R. M., Lortie, C. L., Cavieres, L. A., Kunstler, G., ... and
Michalet, R. (2008). Facilitation in plant communities: the past, the present, and the future. Journal
of Ecology, 96(1), 18-34.
Brooker, R. W., Maestre, F. T., Callaway, R. M., Lortie, C. L., Cavieres, L. A., Kunstler, G., ... and
Michalet, R. (2008). Facilitation in plant communities: the past, the present, and the future. Journal
of Ecology, 96(1), 18-34.
Butterfield, B. J. (2009). Effects of facilitation on community stability and dynamics: synthesis and
future directions. Journal of Ecology, 97(6), 1192-1201.
Cadotte, M. W., Cavender-Bares, J., Tilman, D., and Oakley, T. H. (2009). Using phylogenetic,
functional and trait diversity to understand patterns of plant community productivity. PLoS
One, 4(5), e5695.
Callaway, R. M. (2007). Interaction between competition and facilitation (pp. 179-254). Springer
Netherlands.
Callaway, R. M., Brooker, R. W., Choler, P., Kikvidze, Z., Lortie, C. J., Michalet, R., ... and Cook, B.
J. (2002). Positive interactions among alpine plants increase with stress. Nature, 417(6891), 844-
848.
Castro-Diez, P., Puyravaud, J. P., Cornelissen, J. H. C., and Villar-Salvador, P. (1998). Stem anatomy
and relative growth rate in seedlings of a wide range of woody plant species and
types. Oecologia, 116(1-2), 57-66.

Diversidad funcional y filogenética en los Bosques Secos del Sur del Ecuador
87
Cavender-Bares, J., Kitajima, K., and Bazzaz, F. A. (2004). Multiple trait associations in relation to
habitat differentiation among 17 Floridian oak species. Ecological Monographs, 74(4), 635-662.
Chesson, P. (2000). Mechanisms of maintenance of species diversity. Annual review of Ecology and
Systematics, 343-366.
Coomes, D. A., and Grubb, P. J. (2003). Colonization, tolerance, competition and seed-size variation
within functional groups. Trends in Ecology and Evolution,18(6), 283-291.
Cornelissen, J. H. C., Lavorel, S., Garnier, E., Diaz, S., Buchmann, N., Gurvich, D. E., ... and Poorter,
H. (2003). A handbook of protocols for standardised and easy measurement of plant functional
traits worldwide. Australian journal of Botany, 51(4), 335-380.
Cornwell, W. K., and Ackerly, D. D. (2009). Community assembly and shifts in plant trait
distributions across an environmental gradient in coastal California.Ecological Monographs, 79(1),
109-126.
Cornwell, W. K., Schwilk, D. W., and Ackerly, D. D. (2006). A trait-based test for habitat filtering:
convex hull volume. Ecology, 87(6), 1465-1471.
Dalling, J. W., Hubbell, S. P., and Silvera, K. (1998). Seed dispersal, seedling establishment and gap
partitioning among tropical pioneer trees. Journal of Ecology, 86(4), 674-689.
Espinosa C, Cabrera O, Luzuriaga A, Escudero A. What Factors Affect Diversity and Species
Composition of Endangered Tumbesian Dry Forests in Southern Ecuador. Biotrópica. 2011; 43:
15–22.
Espinosa CI, Luzuriaga A, de la Cruz M, Escudero A. Climate and grazing control nurse effects in an
Ecuadorian dry shrubby community. Journal of Tropical Ecology. 2013; 30 23–32.
Espinosa, C. I., de la Cruz, M., Jara‐ Guerrero, A., Gusmán, E., and Escudero, A. (2015). The effects
of individual tree species on species diversity in a tropical dry forest change throughout
ontogeny. Ecography.
Flynn, D. F., Mirotchnick, N., Jain, M., Palmer, M. I., and Naeem, S. (2011). Functional and
phylogenetic diversity as predictors of biodiversity-ecosystem-function
relationships. Ecology, 92(8), 1573-1581.
Fonseca, C.R., Overton, J.M., Collins, B. and Westoby, M. (2000) Shifts in trait-combinations along
rainfall and phosphorus gradients. Journal of Ecology, 88, 964–977.
Freschet, G. T., Dias, A. T., Ackerly, D. D., Aerts, R., van Bodegom, P. M., Cornwell, W. K., ... and
Cornelissen, J. H. (2011). Global to community scale differences in the prevalence of convergent
over divergent leaf trait distributions in plant assemblages. Global Ecology and
Biogeography, 20(5), 755-765.
Fukami, T., Martijn Bezemer, T., Mortimer, S. R., and Putten, W. H. (2005). Species divergence and
trait convergence in experimental plant community assembly. Ecology letters, 8(12), 1283-1290.

Diversidad funcional y filogenética en los Bosques Secos del Sur del Ecuador
88
Garnier, E., Cortez, J., Billes, G., Navas, ML., Roumet, C., Debussche, M., …and Toussaint, JP.
(2004). Plant functional markers capture ecosystem properties during secondary succession.
Ecology 85:2630– 2637.
Givnish, T. J., and Vermeij, G. J. (1976). Sizes and shapes of liane leaves.American Naturalist, 743-
778.
Götzenberger, L., de Bello, F., Bråthen, K. A., Davison, J., Dubuis, A., Guisan, A., ... and Zobel, M.
(2012). Ecological assembly rules in plant communities—approaches, patterns and
prospects. Biological Reviews, 87(1), 111-127.
Grime, J. P. (1998). Benefits of plant diversity to ecosystems: immediate, filter and founder effects. J
Ecol 86:902–910
Grime, J. P. (2006). Trait convergence and trait divergence in herbaceous plant communities:
mechanisms and consequences. Journal of Vegetation Science,17(2), 255-260.
Gurevitch, J., Morrow, L. L., Wallace, A., and Walsh, J. S. (1992). A meta-analysis of competition in
field experiments. American Naturalist, 539-572.
Harms, K. E., and Dalling, J. W. (1997). Damage and herbivory tolerance through resprouting as an
advantage of large seed size in tropical trees and lianas.Journal of Tropical Ecology, 13(4), 617-
621.
Hijmans, R. J., Cameron, S. E., Parra, J. L., Jones, P. G., and Jarvis, A. (2005). Very high resolution
interpolated climate surfaces for global land areas.International journal of climatology, 25(15),
1965-1978.
Hulshof, C. M., Violle, C., Spasojevic, M. J., McGill, B., Damschen, E., Harrison, S., and Enquist, B.
J. (2013). Intra‐ specific and inter‐ specific variation in specific leaf area reveal the importance
of abiotic and biotic drivers of species diversity across elevation and latitude. Journal of
Vegetation Science, 24(5), 921-931.
Jeltsch, F., Moloney, K. A., Schurr, F. M., Köchy, M., and Schwager, M. (2008). The state of plant
population modelling in light of environmental change.Perspectives in Plant Ecology, Evolution
and Systematics, 9(3), 171-189.
Keddy, P. A. (1992). Assembly and response rules: two goals for predictive community
ecology. Journal of Vegetation Science, 3(2), 157-164.
Kembel, S. (2010). An introduction to the picante package.
Kembel, S. W., and Hubbell, S. P. (2006). The phylogenetic structure of a neotropical forest tree
community. Ecology, 87(sp7), S86-S99.
Kembel, S. W., Cowan, P. D., Helmus, M. R., Cornwell, W. K., Morlon, H., Ackerly, D. D., ... and
Webb, C. O. (2010). Picante: R tools for integrating phylogenies and
ecology. Bioinformatics, 26(11), 1463-1464.

Diversidad funcional y filogenética en los Bosques Secos del Sur del Ecuador
89
King, D. A., Davies, S. J., Tan, S., and NOOR, N. S. (2006). The role of wood density and stem
support costs in the growth and mortality of tropical trees.Journal of Ecology, 94(3), 670-680.
Kitajima, K., Mulkey, S. S., Samaniego, M., and Wright, S. J. (2002). Decline of photosynthetic
capacity with leaf age and position in two tropical pioneer tree species. American Journal of
Botany, 89(12), 1925-1932.
Kraft, N. J., and Ackerly, D. D. (2010). Functional trait and phylogenetic tests of community
assembly across spatial scales in an Amazonian forest. Ecological Monographs, 80(3), 401-422.
Kraft, N. J., Cornwell, W. K., Webb, C. O., and Ackerly, D. D. (2007). Trait evolution, community
assembly, and the phylogenetic structure of ecological communities. The American
Naturalist, 170(2), 271-283.
Kraft, N. J., Valencia, R., and Ackerly, D. D. (2008). Functional traits and niche-based tree
community assembly in an Amazonian forest. Science, 322(5901), 580-582.
Laliberté, E., Legendre, P. (2010). A distance-based framework for measuring functional diversity
from multiple traits. Ecology 91:299–305
Laliberté, E., Legendre, P., Shipley, B., and Laliberté, M. E. (2014). Package ‘FD’.Version, 1, 12.
Lavorel, S., and Garnier, E. (2002). Predicting changes in community composition and ecosystem
functioning from plant traits: revisiting the Holy Grail. Functional ecology, 16(5), 545-556.
Lavorel, S., Grigulis, K., McIntyre, S., Garden, D., Williams, N., Dorrough, J., …and Bonis, A.
(2008). Assessing functional diversity in the field-methodology matters! Funct Ecol 22:134–147.
Lebrija-Trejos, E., Pérez-García, E. A., Meave, J. A., Bongers, F., and Poorter, L. (2010). Functional
traits and environmental filtering drive community assembly in a species-rich tropical
system. Ecology, 91(2), 386-398.
Lepš J, de Bello F, Lavorel S, Berman S (2006). Quantifying and interpreting functional diversity of
natural communities: practical considerations matter. Preslia 78:481–501.
Losos, J. B. (2008). Phylogenetic niche conservatism, phylogenetic signal and the relationship
between phylogenetic relatedness and ecological similarity among species. Ecology letters, 11(10),
995-1003.
MacArthur, R., and Levins, R. (1967). The limiting similarity, convergence, and divergence of
coexisting species. American naturalist, 377-385.
Mason, N. W., and de Bello, F. (2013). Functional diversity: a tool for answering challenging
ecological questions. Journal of Vegetation Science, 24(5), 777-780.
May, F., Giladi, I., Ristow, M., Ziv, Y., and Jeltsch, F. (2013). Plant functional traits and community
assembly along interacting gradients of productivity and fragmentation. Perspectives in Plant
Ecology, Evolution and Systematics, 15(6), 304-318.
Mayfield, M. M., and Levine, J. M. (2010). Opposing effects of competitive exclusion on the
phylogenetic structure of communities. Ecology letters, 13(9), 1085-1093.

Diversidad funcional y filogenética en los Bosques Secos del Sur del Ecuador
90
McAuliffe, J.R. (1988). Markovian dynamics of simple and complex desert plant communities. Am.
Nat., 131, 459–490.
McGill, B. J., Enquist, B. J., Weiher, E., and Westoby, M. (2006). Rebuilding community ecology
from functional traits. Trends in Ecology and Evolution, 21(4), 178-185.
Mokany, K., Ash, J., Roxburgh, S. (2008). Functional identity is more important than diversity in
influencing ecosystem processes in a temperate native grassland. Journal Ecology 96:884–893
Moles, A. T., and Westoby, M. (2006). Seed size and plant strategy across the whole life
cycle. Oikos, 113(1), 91-105.
Mouchet, M. A., Villeger, S., Mason, N. W., and Mouillot, D. (2010). Functional diversity measures:
an overview of their redundancy and their ability to discriminate community assembly
rules. Functional Ecology, 24(4), 867-876.
Norberg, J. (2004). Biodiversity and ecosystem functioning: a complex adaptive systems
approach. Limnology and Oceanography, 49(4part2), 1269-1277.
Oksanen, J., Blanchet, F. G., Kindt, R., Legendre, P., Minchin, P. R., O’Hara, R. B., ... and Wagner,
H. (2013). Package ‘vegan’. R Packag ver, 254, 20-8.
Ordoñez, J. C., Van Bodegom, P. M., Witte, J. P. M., Wright, I. J., Reich, P. B., and Aerts, R. (2009).
A global study of relationships between leaf traits, climate and soil measures of nutrient
fertility. Global Ecology and Biogeography, 18(2), 137-149.
Pacala, S. W., and Tilman, D. (1994). Limiting similarity in mechanistic and spatial models of plant
competition in heterogeneous environments. American naturalist, 222-257.
Poorter, L., and Bongers, F. (2006). Leaf traits are good predictors of plant performance across 53
rain forest species. Ecology, 87(7), 1733-1743.
Poorter, L., Bongers, F., Sterck, F. J., and Woell, H. (2005). Beyond the regeneration phase:
differentiation of height–light trajectories among tropical tree species. Journal of ecology, 93(2),
256-267.
Poorter, L., Wright, S. J., Paz, H., Ackerly, D. D., Condit, R., Ibarra-Manríquez, G., ... and Wright, I.
J. (2008). Are functional traits good predictors of demographic rates? Evidence from five
neotropical forests. Ecology, 89(7), 1908-1920.
R Development Core Team. R: A Language and Environment for Statistical Computing. Vienna.
2014; R Foundation for Statistical Computing
Ricotta, C., Moretti, M. (2010). Assessing the functional turnover of species assemblages with
tailored dissimilarity matrices. Oikos 119:1089–1098.
Shipley, B. (2014). Measuring and interpreting trait‐ based selection versus meta‐ community
effects during local community assembly. Journal of Vegetation Science, 25(1), 55-65.

Diversidad funcional y filogenética en los Bosques Secos del Sur del Ecuador
91
Spasojevic, M. J., and Suding, K. N. (2011). Contrasting effects of hemiparasites on ecosystem
processes: can positive litter effects offset the negative effects of parasitism?. Oecologia, 165(1),
193-200.
Spasojevic, M. J., and Suding, K. N. (2012). Inferring community assembly mechanisms from
functional diversity patterns: the importance of multiple assembly processes. Journal of
Ecology, 100(3), 652-661.
Stubbs, W. J., and Bastow Wilson, J. (2004). Evidence for limiting similarity in a sand dune
community. Journal of Ecology, 92(4), 557-567.
Suding, K. N., Lavorel, S., Chapin, F. S., Cornelissen, J. H., DIAz, S., Garnier, E., ... and NAVAS, M.
L. (2008). Scaling environmental change through the community‐ level: a trait‐ based
response‐ and‐ effect framework for plants. Global Change Biology, 14(5), 1125-1140.
Tirado, R. and Pugnaire, F.I. (2005). Community structure and positive interactions in constraining
environments. Oikos, 111, 437–444.
Valiente-Banuet, A., Vital, A., Verdu´, M. and Callaway, R.M. (2006). Modern Quaternary plant
lineages promote diversity through facilitation of ancient Tertiary lineages. Proc. Natl Acad. Sci.
USA, 103, 16812–16817.
Valiente‐ Banuet, A., and Verdú, M. (2007). Facilitation can increase the phylogenetic diversity of
plant communities. Ecology Letters, 10(11), 1029-1036.
Van Gelder, H. A., Poorter, L., and Sterck, F. J. (2006). Wood mechanics, allometry, and
life‐ history variation in a tropical rain forest tree community. New Phytologist, 171(2), 367-378.
Vile, D., Shipley, B., Garnier, E. (2006). Ecosystem productivity relates to species’ potential relative
growth rate: a field test and a conceptual framework. Ecol Lett 9:1061–1067
Violle, C., Enquist, B. J., McGill, B. J., Jiang, L., Albert, C. H., Hulshof, C., ... and Messier, J. (2012).
The return of the variance: intraspecific variability in community ecology. Trends in ecology and
evolution, 27(4), 244-252.
Webb, C. O. (2000). Exploring the phylogenetic structure of ecological communities: an example for
rain forest trees. The American Naturalist, 156(2), 145-155.
Webb, C. O., and Donoghue, M. J. (2005). Phylomatic: tree assembly for applied
phylogenetics. Molecular Ecology Notes, 5(1), 181-183.
Webb, C. O., Ackerly, D. D., and Kembel, S. W. (2008). Phylocom: software for the analysis of
phylogenetic community structure and trait evolution.Bioinformatics, 24(18), 2098-2100.
Weiher, E., and Keddy, P. A. (1995). Assembly rules, null models, and trait dispersion: new questions
from old patterns. Oikos, 159-164.
Weiher, E., Freund, D., Bunton, T., Stefanski, A., Lee, T., and Bentivenga, S. (2011). Advances,
challenges and a developing synthesis of ecological community assembly theory. Philosophical
Transactions of the Royal Society B: Biological Sciences, 366(1576), 2403-2413.

Diversidad funcional y filogenética en los Bosques Secos del Sur del Ecuador
92
Westoby, M. (1998). A leaf-height-seed (LHS) plant ecology strategy scheme.Plant and soil, 199(2),
213-227.
Wiens, J. J., and Morrill, M. C. (2011). Missing data in phylogenetic analysis: reconciling results
from simulations and empirical data. Systematic Biology, syr025.
Wikström, N., Savolainen, V., and Chase, M. W. (2001). Evolution of the angiosperms: calibrating
the family tree. Proceedings of the Royal Society of London B: Biological Sciences, 268(1482),
2211-2220.
Wright, I. J., Reich, P. B., Westoby, M., Ackerly, D. D., Baruch, Z., Bongers, F., ... and Villar, R.
(2004). The worldwide leaf economics spectrum. Nature,428(6985), 821-827.

Diversidad funcional y filogenética en los Bosques Secos del Sur del Ecuador
93
Appendix 1. Principal components analysis of environmental variables.

Diversidad funcional y filogenética en los Bosques Secos del Sur del Ecuador
94

Diversidad funcional y filogenética en los Bosques Secos del Sur del Ecuador
95
CAPÍTULO 3
¿Actúan los mecanismos de ensamblaje a diferentes
escalas espaciales en un Bosque Seco?

Diversidad funcional y filogenética en los Bosques Secos del Sur del Ecuador
96

Diversidad funcional y filogenética en los Bosques Secos del Sur del Ecuador
97
RESUMEN
Una aproximación que ha resultado ser eficaz para cuantificar la influencia de los procesos
estocásticos y deterministas en el ensamble de comunidades ha sido el estudio de la
diversidad funcional y filogenética en un contexto espacial. Los rasgos funcionales y la
estructura filogenética de la comunidad pueden ser modificados tanto por condicionantes
bióticos como abióticos. Nosotros evaluamos 1) si la dispersión de los rasgos funcionales de
las plantas en la estructuración de la comunidad es dependiente de la escala espacial, 2) Los
factores deterministas modifican la dispersión funcional dependiendo de la escala espacial?.
3) la dispersión de los rasgos funcionales es un reflejo de la dispersión filogenética.
Examinamos la dispersión funcional y filogenética en una parcela de 9 hectáreas en un
Bosque Seco ubicado en el Suroeste de la Costa Ecuatoriana, dividida en seis escalas
espaciales. Hemos encontrado que a escalas espaciales pequeñas, las especies que coexisten
son funcionalmente mas agrupadas, además existe una relación positiva entre la dispersión
funcional y la diversidad filogenética en escalas espaciales mayores, este resultado nos
indique existe una conservación de los rasgos funcionales en este tipo de bosque.
Nuestros hallazgos sugieren que la co-ocurrencia de especies fue impulsada por el filtrado de
hábitat a escalas pequeñas donde hubo mayor agrupación de lo esperado por el azar. Es decir
las condiciones abióticas locales permite la coexistencia de un sólo subconjunto funcional en
la piscina de especie.

Diversidad funcional y filogenética en los Bosques Secos del Sur del Ecuador
98
INTRODUCCIÓN
La importancia relativa de los procesos deterministas y estocásticos en el ensamble de las
comunidades sigue siendo un tema central en la ecología de comunidades (Gotzenberger et
al. 2012). Algunos autores argumentan que una aproximación efectiva para cuantificar la
influencia de estos procesos en el ensamble de comunidades es el análisis de la diversidad
funcional y filogenética en un contexto espacial (Losos 1996, Webb 2000, Cavender-Bares et
al. 2004; Milne 1992, Enquist y Niklas 2001).
Los rasgos funcionales y la filogenia de las especies deberían ser aleatorios en la comunidad,
en un contexto de un modelo estocástico, siendo la dispersión el factor limitante en la
estructura de la comunidad (Hubbell 2001). Por otro lado, modelos deterministas afirman la
importancia en la diferenciación ecológica y evolutiva de las especies en la comunidad. De
esta forma la estructura de la comunidad debe ser no-aleatoria con respecto a los rasgos
funcionales y a su filogenia (por ejemplo, Swenson y Enquist 2009; Kraft y Ackerly 2010;
Swenson et al 2012; 2013).
Los rasgos funcionales y la estructura filogenética de la comunidad pueden ser modificados
tanto por condicionantes bióticos como abióticos. Mientras las interacciones bióticas (como
la exclusión competitiva o la facilitación) conducen a la sobre-dispersión de los rasgos
funcionales, las interacciones abióticas (por ejemplo el filtrado ambiental) conducen a la baja
dispersión o agrupación de los rasgos funcionales en la comunidad (Swenson y Enquist
2009). Bajo este mismo enfoque cuando analizamos la diversidad filogenética de una
comunidad se espera que las especies estrechamente relacionadas puedan ser ecológica y
funcionalmente más similares a especies alejadas filogenéticamente (Swenson and Enquist
2009). Por ejemplo, si los rasgos funcionales se conservan filogenéticamente, las especies co-
ocurrentes estarán más relacionadas de lo esperado por el azar (Webb et al. 2002). Sin

Diversidad funcional y filogenética en los Bosques Secos del Sur del Ecuador
99
embargo, se ha demostrado que algunos rasgos ecológicos no se conservan filogenéticamente
(Cavender-Bares et al. 2004), lo que podría conducir a un desacople entre la diversidad
funcional y filogenética.
Se ha documentado que el filtrado de hábitat y el límite de similitud pueden ocurrir
simultáneamente en una comunidad de plantas, pero su importancia relativa por lo general
varía en diferentes escalas espaciales (Goetzenberger et al 2012; Adler et al 2013; May et al
2013). Por ejemplo en bosques tropicales el filtrado de hábitat parece ser más importante a
escalas más grandes, por lo que se producen gradientes ambientales y topográficas
predecibles (Shipley et al. 2012), por otra parte, el límite de similitud, es a menudo más
importante a escalas más pequeñas donde las interacciones competitivas entre los vecinos
aumentan en frecuencia e intensidad (Kraft y Ackerly 2010, Cavender-Bares et al 2006;
Swenson et al. 2007, 2012).
Con fin de obtener una visión más profunda de los mecanismos que promueven el ensamble
de las comunidades, nosotros evaluamos si el rol de los rasgos funcionales de las plantas en
la estructura de la comunidad es dependiente de la escala espacial a la cual se evalúa.
Específicamente nos interesa entender (1) ¿Cómo influye la escala espacial en la relación
entre la diversidad funcional y la riqueza de especies?; Si la diversidad funcional es un reflejo
de la diversidad taxonómica nosotros esperamos que la correlación sea significativa y
positiva entre estas dos medidas y que se torne negativa en escalas espaciales más grandes.
(2) ¿Factores deterministas modifican la dispersión funcional dependiendo de la escala
espacial?. Esperamos que el ensamble de las comunidades de bosque seco sea diferente a un
ensamble aleatorio de las especies del territorio, como consecuencia de filtrados bióticos o
abióticos. Así, a escalas cortas esperamos una mayor dispersión de caracteres como efecto de
interacciones bióticas y con menor dispersión a escalas mayores como resultado de un

Diversidad funcional y filogenética en los Bosques Secos del Sur del Ecuador
100
filtrado del ambiente. Finalmente, queremos entender. (3) ¿En qué medida la dispersión de
rasgos funcionales coinciden con la dispersión filogenética?. Si los caracteres funcionales
evaluados son conservados, bajo el criterio de conservacionismo filogenético (Fitter y Peat
1994, Ackerly y Reich 1999), la diversidad filogenética debería estar positivamente
relacionada con la diversidad funcional y estas a su vez con la riqueza taxonómica.
MÉTODOS
Área de Estudio
La zona de estudio se encuentra en el Reserva Ecológica Arenillas (REA). La REA se
encuentra en el suroeste de Ecuador, en la provincia de El Oro, entre los cantones de
Arenillas y Huaquillas y cubre 131,7 Km2
(Decreto Ejecutivo No. 787) con una altitud que va
de 0 a 300 m. Esta zona pertenece a la región biogeográfica Tumbesina, una de las zonas más
importantes de endemismo y a su vez se constituye en uno de los ecosistemas más
amenazados (Best y Kessler 1995). El clima se caracteriza por una temporada de lluvias
(enero a abril), con una precipitación media de 515 mm y sólo 152 mm de promedio durante
la estación seca (mayo-diciembre) (estación meteorológica Huaquillas por un período de 45
años de registro (1969-2014). La temperatura media es de 25.2 °C tiene una variación
máxima de 3.4 ºC entre los meses más fríos y más cálidos. La temperatura más baja se da
durante la estación seca.
Dentro de una zona muy bien conservada en el centro de la REA conocida como 'Pintag
Nuevo' instalamos una parcela permanente en 2009. Esta área se caracteriza por una
formación de transición entre los bosques secos caducifolios y matorrales secos de tierras
bajas. Las especies de árboles más conspicuos de la zona son; Tabebuia chrysantha y
Tabebuia bilbergii (Bignoniaceae), junto con otras especies como Colicodendron scabridum

Diversidad funcional y filogenética en los Bosques Secos del Sur del Ecuador
101
(Capparaceae) y Croton sp. (Euphorbiaceae). De enero de 2010 a mayo del 2011 delimitamos
una parcela cuadrada de 9 hectáreas, subdivida en 225 subparcelas de 20x20 metros (400 m2).
Todos los individuos arbóreos con un diámetro a la altura del pecho (DAP) igual o mayor a
5cm fueron registrados. Cada individuo fue identificado y determinada su posición espacial.
Rasgos funcionales en plantas
Seleccionamos un conjunto de rasgos funcionales que están estrechamente relacionados con
procesos importantes en las plantas como el crecimiento, reproducción, y fisiología. La
Altura máxima de la planta está relacionada con el acceso a la luz (Westoby 1998; Poorter et
al 2005). Las plantas más altas interceptan en promedio más luz y por lo tanto tienen tasas de
crecimiento potencialmente más rápidas (Poorter et al. 2008). La Densidad de la madera se
encuentra relacionada con la eficiencia y el transporte del agua (Cornwell y Ackerly 2009) y
con el crecimiento y la supervivencia del individuo. Baja densidad de la madera suele estar
relacionada con altas tasas de crecimiento del tallo (King et al., 2005), mientras que altas
densidades están relacionados con bajas tasas de crecimiento (Castro-Díez et al.1998).
Adicionalmente, la altas densidades de la madera generan paredes celulares gruesas (Castro-
Díez et al. 1998) mejorando la resistencia de los tallos a la rotura (van Gelder et al. 2006) y a
los ataques de patógenos (Augspurger 1984). El tamaño de la hoja desempeña un papel
particularmente importante en la asimilación de carbón, relaciones hídricas y el balance
energético de la planta (Ackerly et al., 2002). El crecimiento de las plantas y la supervivencia
están fuertemente conectados con el área foliar específica (SLA, siglas en ingles). Esta
característica representa un eje "económico" de variación que va desde las especies típicas de
los hábitats ricos en recursos, con altas tasas metabólicas y cuyos atributos mejoran la rápida
adquisición de carbono fotosintético (alta SLA), a las especies que toleran hábitats y recursos
limitados que tienden a mostrar atributos opuestos (Walters y Reich 1999; Poorter y Bongers

Diversidad funcional y filogenética en los Bosques Secos del Sur del Ecuador
102
2006). La Masa seca de la semilla (MSS, siglas en ingles) es una característica crucial para la
dispersión y la regeneración (Coomes y Grubb 2003). Las semillas grandes proporcionan
reservas para el éxito de establecimiento de plántulas en condiciones de bajos recursos
(Kitajima 2002). Por el contrario, las especies con semillas pequeñas son mejores
colonizadoras (Dalling et al. 1998).
Los rasgos se midieron en el campo y/o el laboratorio, siguiendo los protocolos
estandarizados propuestos por Pérez-Harguindeguy et al. (2013). Para cada especie
inventariada se recogieron al azar 10 hojas de 50 individuos de cada especie de árboles y
arbustos. El área foliar se midió con el programa Image J (Abramoff et al. 2004; Kraft and
Ackerly. 2010). El área foliar específica se calculó como el área de lámina de la hoja dividida
por la masa seca de la hoja (48 horas de secado a 80 ºC), para las especies de hojas
compuestas se incluyó el raquis. Las hojas fueron recolectadas en la temporada de
crecimiento. Para calcular la densidad de la madera se recogieron ramas secundarias de
árboles y arbustos. El volumen de madera fresca se determinó con el método de
desplazamiento de agua que consiste en secar las muestras a 80 °C, hasta que las muestras
mantengan un peso constante, finalmente se realiza el calculó la densidad de la madera (d =
m/v: donde m= masa seca y v= al volumen). Para las especies que no fue posible calcular la
densidad de la madera directamente, se utilizó la base de datos de Chave et al. (2009). Para la
obtención de los datos de masa de las semillas recogimos muestras de al menos 10 individuos
de cada especie. Las semillas fueron secadas durante 48 horas a 80 °C, luego de lo cual
fueron pesadas según lo propuesto por Cornelissen et al (2003). La masa seca de la semilla de
algunas especies que no pudieron ser recogidas en el campo, se aproximó su valor en base a
congéneres registrados en la base de datos del Jardín Botánico de Kew. (2014).

Diversidad funcional y filogenética en los Bosques Secos del Sur del Ecuador
103
Análisis estadístico
Modelos espaciales por especie
Empleamos la función K de Ripley para caracterizar el patrón espacial de cada especie
(Ripley 1976; Illian et al. 2008). Nuestro ajuste de modelo se basa en minimizar una medida
de discrepancia entre la función observada K y la función K (también conocido como
"contraste mínimo" o "mínimos cuadrados" de estimación), siguiendo la ponderación
presentada en Wiegand et al. 2012. Nosotros calculamos el patrón espacial de cada especie
con el patrón esperado en base a cuatro modelos (Poisson homogéneo (HPP), Poisson
inhomogéneo (IPP), Poisson agrupado homogéneo (HPCP) y Poisson agrupado
inhomogéneo (IPCP)) (Shen et al. 2009, Lin et al. 2011). Una descripción detallada de los
cuatro modelos considerados en este estudio se encuentra en el Apéndice 1.
Para seleccionar el modelo que mejor se ajustó a cada especie usamos el ajuste de bondad de
u (gof-u.)(Diggle 2003; Loosmore y Ford, 2006; Pescador et al 2014).
Diversidad en escalas espaciales
Para examinar la dispersión de los rasgos funcionales dividimos a la REA en 5 escalas
espaciales (20, 50, 500, 2000 y 10000 m2). Dentro de cada cuadrante se cuantificó la riqueza
de especies (SR siglas en ingles), dispersión funcional (FDis siglas en ingles) que es la
distancia media de las especies individuales al centroide de todas las especies en la
comunidad en un espacio funcional (Laliberté et al 2010), el FDis es una medida de
diversidad funcional. Finalmente la diversidad filogenética mediante el índice de variabilidad
filogenética de especies (PSV siglas en ingles ). El PSV resume el grado en que las especies
están relacionadas filogenéticamente en una comunidad (Helmus et al 2007).
En cada escala espacial se realizaron correlaciones de Sperman´s rho entre la dispersión

Diversidad funcional y filogenética en los Bosques Secos del Sur del Ecuador
104
funcional de la comunidad y la riqueza de especies. Las correlaciones fueron realizadas para
los rasgos individualmente y para la diversidad del conjunto de datos. Adicionalmente, se
evaluó la correlación entre la diversidad funcional, filogenética y la riqueza de especies. Para
calcular la significancia de la correlación usamos una prueba de Wilcoxon.
Con el fin de determinar si el cambio de la dispersión funcional dentro de los cuadrantes es
diferente de lo esperado por el azar, generamos 1000 conjuntos de comunidades simuladas en
cada escala espacial. Utilizamos el modelo espacial con mejor ajuste para cada especie
(Apéndice 2) para construir los modelos nulos. Para cada uno de estos conjuntos calculamos
la dispersión funcional generando una distribución nula. Esta distribución nula se utilizó para
calcular el efecto estandarizado del tamaño de la siguiente manera:
Ztd = (TDobs - TDnull) / TDsdnull
donde TDnull es el valor medio de la distribución nula de la dispersión de rasgos y TSDsdnull es
la desviación estándar de la distribución nula (Gotelli y Graves, 1996). Nosotros también
testamos si la mediana de Ztd para todos los cuadrantes REA era diferente de una expectativa
nula de cero mediante una prueba de Wilcoxon.
Todos cálculos se efectuaron utilizando el entorno R (R Core Team 2013) y los paquetes
“spatstat” (Baddeley y Turner 2005), “ecespa” (de la Cruz 2008a), “FD” (Laliberté et al.
2014), “picante”(Kembel y Ackerly 2011).
RESULTADOS
Inicialmente encontramos una relación positiva entre la dispersión funcional de los rasgos y
la riqueza de especies en escalas espaciales cortas (0-500m2) y una relación negativa a
escalas espaciales mayores. En el caso de Masa seca de la semilla la relación fue positiva en

Diversidad funcional y filogenética en los Bosques Secos del Sur del Ecuador
105
todas las escalas espaciales (Fig. 1). Nosotros encontramos que existió una relación positiva
significativa en escalas cortas (0-100m2) para casi todos los rasgos funcionales excepto para
altura máxima. En el caso de Masa seca de la semilla fue significativo en casi todas las
escalas espaciales (Fig.1).
20 50 200 500 2000 10000
-1.0
-0.5
0.0
0.5
1.0
area
Spe
arm
an
's r
ho
FDIs
20 50 200 500 2000 10000
-1.0
-0.5
0.0
0.5
1.0
area
Spe
arm
an
's r
ho
FDIs.Height
20 50 200 500 2000 10000
-1.0
-0.5
0.0
0.5
1.0
area
Spe
arm
an
's r
ho
FDIs.Wood.Density
20 50 200 500 2000 10000
-1.0
-0.5
0.0
0.5
1.0
area
Sp
earm
an
's r
ho
FDIs.Leaf.area
20 50 200 500 2000 10000
-1.0
-0.5
0.0
0.5
1.0
area
Sp
earm
an
's r
ho
FDIs.SLA
20 50 200 500 2000 10000
-1.0
-0.5
0.0
0.5
1.0
area
Sp
earm
an
's r
ho
FDIs.MSS
20 50 200 500 2000 10000
-1.0
-0.5
0.0
0.5
1.0
area
Spe
arm
an
's r
ho
PSVs
Figura 1. Correlaciones de Spearman´s rho entre la dispersión de los rasgos funcionales de la
comunidad en cada escala espacial. Círculos negros indican correlaciones significativas (P ≤ 0.05).
Área en m2
Nosotros observamos que la desviación de la dispersión funcional y diversidad filogenética
de la comunidad fueron significativos a escalas espaciales cortas (0-40 m2), encontrando un
mayor agrupamiento con respecto a lo esperada por el azar (Fig.2). Para la riqueza de
especies encontramos que la desviación fue significativo en escalas entre 0-1000 m2. En el
caso de la diversidad filogenética encontramos que a escalas espaciales de 100m2
la
desviación es mas dispersa con respecto a lo esperada por el azar (Fig.2).

Diversidad funcional y filogenética en los Bosques Secos del Sur del Ecuador
106
En general todas la desviaciones de la dispersión de los rasgos funcionales fueron
significativos en escalas espaciales cortas (0-40m2). En el caso de densidad de la madera y
tamaño de la hoja fueron significativos también a escalas espaciales de 40-100m2, para SLA
y MSS a escalas de 40-500m2
(Fig.2).
20 50 100 500 2000 10000
-1.0
-0.5
0.0
0.5
1.0
FDIs
area
med
ian
Z-s
core
20 50 100 500 2000 10000
-1.0
-0.5
0.0
0.5
1.0
PSVs
area
med
ian
Z-s
core
20 50 100 500 2000 10000
-1.0
-0.5
0.0
0.5
1.0
SR
area
med
ian
Z-s
core
20 50 100 500 2000 10000
-1.0
-0.5
0.0
0.5
1.0
FDIs.Height
area
me
dia
n Z
-sco
re
20 50 100 500 2000 10000
-1.0
-0.5
0.0
0.5
1.0
FDIs.Wood.Density
area
me
dia
n Z
-sco
re
20 50 100 500 2000 10000-1
.0-0
.50
.00
.51
.0
FDIs.Leaf.area
area
me
dia
n Z
-sco
re
20 50 100 500 2000 10000
-1.0
-0.5
0.0
0.5
1.0
FDIs.SLA
area
med
ian
Z-s
core
20 50 100 500 2000 10000
-1.0
-0.5
0.0
0.5
1.0
FDIs.MSS
area
med
ian
Z-s
core
Figura 2. Desviación de las comunidades al modelo nulo a diferentes escalas espaciales. Los valores
por encima de la línea indican desviaciones positivas (dispersión de rasgos) y los valores por debajo
de la línea desviaciones negativas (agrupamiento de rasgos). Círculos negros indican desviaciones
significativas del modelo nulo mediante una prueba de Wilcoxon. (P ≤ 0.05), área en m2
Finalmente encontramos que existió una relación positiva significativa entre la dispersión
funcional de la comunidad y la riqueza de especies en escalas espaciales cortas (0-100m2) y
negativa significativa a escalas espaciales mayores (Fig. 3). En cuanto a la relación entre la
dispersión funcional de la comunidad y la diversidad filogenética fue positiva significativa a

Diversidad funcional y filogenética en los Bosques Secos del Sur del Ecuador
107
escalas mayores (Fig. 3). En el caso de la relación entre la diversidad filogenética de la
comunidad y la riqueza no fue significativa en ninguna escala espacial (Fig. 3).
20 50 100 200 500 1000 5000
-1.0
-0.5
0.0
0.5
1.0
area
Sp
ea
rma
n's
rh
o
SR vs FDis
20 50 100 200 500 1000 5000
-1.0
-0.5
0.0
0.5
1.0
area
Sp
ea
rma
n's
rh
o
FDis vs PSV
Figura 3. Correlaciones entre dispersión funcional y filogenética a diferentes escalas espaciales.
Círculos negros indican correlaciones significativas mediante una prueba de Wilcoxon (P ≤ 0.05).
Área en m2
DISCUSIÓN
Nosotros encontramos que la dispersión funcional de los rasgos individuales y para su
conjunto en escalas cortas muestran agrupación funcional (Fig. 2), sugiriendo que las
condiciones abióticas locales (filtrado de hábitat) permiten la coexistencia de un sólo
subconjunto funcional en la piscina de especies (Webb et al., 2002). La filtración del medio
ambiente ocurra cuando las especies comparten tolerancias similares (Cavender-Bares et al.
2004, 2006), es decir ocupan el mismo tipo de entornos (Donoghue 2008), como por ejemplo
variabilidad en las condiciones climáticas, edáficas o topológicos, que sufren algunos
comunidades, y por lo tanto, las especies concurrentes deben ser funcionalmente más
similares.
En el caso de la diversidad filogenética encontramos que las especies fueron mas similares

Diversidad funcional y filogenética en los Bosques Secos del Sur del Ecuador
108
filogenéticamente en escalas cortas. Es decir que las especies estrechamente emparentadas
comparten rasgos similares (Kraft et al. 2007; Losos et al. 2008), mientras que las especies
relacionadas lejanamente difieren en sus rasgos funcionales (Webb et al. 2002; Swenson and
Enquist 2009). Sin embargo este patrón puede cambiar a escalas espaciales mayores donde la
diversidad filogenética es mas dispersa, es decir que las especies que se encuentran en estos
sitios son mas alejadas filogenéticamente produciéndose un efecto de limite de similitud
donde las especies que se encuentran en estas escalas deben ser menos similares.
Como observamos la dispersión funcional se correlaciona con la diversidad filogenética, esta
correlación depende de los rasgos considerados en el estudio y del nivel de conservadurismo
filogenético (Srivastava et al. 2012; Mouquet et al. 2012; Losos et al. 2008). Desde una
perspectiva de la comunidad, hay estudios teóricos que indican que un aumento de la
diversidad filogenética en una comunidad aumenta el potencial evolutivo de adaptarse a los
cambios ambientales (Mouquet et al. 2012; Sgro, et al. 2011). Esta relación entre la
dispersión funcional y la diversidad filogenética se basa en la suposición razonable de que la
diversificación evolutiva ha generado la diversificación del rasgo, que a su vez puede dar
lugar a una mayor complementariedad de nicho (Cadotte et al. 2008).
Conclusión
En las 9-ha de la REA, nuestros resultados demuestran que funcionalmente las especies son
mas similares en escalas espaciales pequeñas, indicando la importancia de filtrados abióticos.
Es decir las condiciones abióticas locales permite la coexistencia de sólo un subconjunto
funcional en la piscina de especie. Los resultados también apoyan la hipótesis de que las
especies se encuentran filogenéticamente mas agrupadas a escalas pequeñas es decir son
filogenéticamente mas similares y que a escalas superiores este comportamiento cambia
siendo mas distinta de los esperado por el azar.

Diversidad funcional y filogenética en los Bosques Secos del Sur del Ecuador
109
Referencias
Abràmoff, M. D., Magalhães, P. J., y Ram, S. J. (2004). Image processing with ImageJ. Biophotonics
international, 11(7), 36-42.
Ackerly, D. D., y Reich, P. B. (1999). Convergence and correlations among leaf size and function in
seed plants: a comparative test using independent contrasts. American Journal of Botany, 86(9),
1272-1281.
Ackerly, D., Knight, C., Weiss, S., Barton, K., y Starmer, K. (2002). Leaf size, specific leaf area and
microhabitat distribution of chaparral woody plants: contrasting patterns in species level and
community level analyses. Oecologia, 130(3), 449-457.
Adler, P. B., Fajardo, A., Kleinhesselink, A. R., y Kraft, N. J. (2013). Trait‐ based tests of
coexistence mechanisms. Ecology letters, 16(10), 1294-1306.
Augspurger, C. K. (1984). Seedling survival of tropical tree species: interactions of dispersal
distance, light-gaps, and pathogens. Ecology, 65(6), 1705-1712.
Baddeley, A. J., y Silverman, B. W. (1984). A cautionary example on the use of second-order
methods for analyzing point patterns. Biometrics, 1089-1093.
Best, B., y Kessler, M. (1995). Biodiversity and conservation in Tumbesian Ecuador and Peru (Vol.
218). Cambridge, England: BirdLife International.
Castro-Díez, P., Villar-Salvador, P., Pérez-Rontomé, C., Maestro-Martínez, M., & Montserrat-Martí,
G. (1998). Leaf morphology, leaf chemical composition and stem xylem characteristics in two
Pistacia (Anacardiaceae) species along a climatic gradient. Journal of the Chemical Society-
Dalton Transactions, (10), 195-202.
Cavender-Bares, J., Ackerly, D. D., Baum, D. A., y Bazzaz, F. A. (2004). Phylogenetic
overdispersion in Floridian oak communities. The American Naturalist, 163(6), 823-843.
Cavender-Bares, J., Keen, A., y Miles, B. (2006). Phylogenetic structure of Floridian plant
communities depends on taxonomic and spatial scale. Ecology, 87(sp7), S109-S122.
Chave, J., Coomes, D., Jansen, S., Lewis, S. L., Swenson, N. G., y Zanne, A. E. (2009). Towards a
worldwide wood economics spectrum. Ecology letters,12(4), 351-366.
Coomes, D. A., y Grubb, P. J. (2003). Colonization, tolerance, competition and seed-size variation

Diversidad funcional y filogenética en los Bosques Secos del Sur del Ecuador
110
within functional groups. Trends in Ecology & Evolution,18(6), 283-291.
Cornelissen, J. H. C., Lavorel, S., Garnier, E., Diaz, S., Buchmann, N., Gurvich, D. E., ... y Poorter,
H. (2003). A handbook of protocols for standardised and easy measurement of plant functional
traits worldwide. Australian journal of Botany, 51(4), 335-380.
Cornwell, W. K., y Ackerly, D. D. (2009). Community assembly and shifts in plant trait distributions
across an environmental gradient in coastal California.Ecological Monographs, 79(1), 109-126.
Dalling, J. W., Hubbell, S. P., y Silvera, K. (1998). Seed dispersal, seedling establishment and gap
partitioning among tropical pioneer trees. Journal of Ecology, 86(4), 674-689.
De la Cruz, M. (2008a). Métodos para analizar datos puntuales. En: Maestre, F.T., Escudero, A. y
Bonet, A. (eds). Introducción al Análisis Espacial de Datos en Ecología y Ciencias Ambientales:
Metodos y Aplicaciones. pp 76-127. Asociación Española de Ecología Terrestre, Universidad
Rey Juan Carlos y Caja de Ahorros del Mediterráneo, Madrid.
Donoghue, M. J. (2008). A phylogenetic perspective on the distribution of plant
diversity. Proceedings of the National Academy of Sciences, 105(Supplement 1), 11549-11555.
Enquist, B. J., y Niklas, K. J. (2001). Invariant scaling relations across tree-dominated
communities. Nature, 410(6829), 655-660.
Fitter, A. H., y Peat, H. J. (1994). The ecological flora database. Journal of Ecology, 415-425.
Gotelli, N. J., y G. R. Graves. 1996. Null models in ecology. Smithsonian Institution Press,
Washington, D.C., USA.
Götzenberger, L., de Bello, F., Bråthen, K. A., Davison, J., Dubuis, A., Guisan, A., ... y Zobel, M.
(2012). Ecological assembly rules in plant communities—approaches, patterns and
prospects. Biological Reviews, 87(1), 111-127.
Helmus, M. R., Bland, T. J., Williams, C. K., & Ives, A. R. (2007). Phylogenetic measures of
biodiversity. The American Naturalist, 169(3), E68-E83.
Hubbell, S.P. (2001). The Unified Neutral Theory of Biodiversity and Biogeography. Princeton
University Press, Princeton.
Kembel, S. W. and Ackerly, D. D. (2010). R tools for integrating phylogenies and ecology.
King, D. A., Davies, S. J., y Noor, N. S. M. (2006). Growth and mortality are related to adult tree size

Diversidad funcional y filogenética en los Bosques Secos del Sur del Ecuador
111
in a Malaysian mixed dipterocarp forest. Forest Ecology and Management, 223(1), 152-158.
Kitajima, K. (2002). Do shade‐ tolerant tropical tree seedlings depend longer on seed reserves?
Functional growth analysis of three Bignoniaceae species.Functional Ecology, 16(4), 433-444.
Kraft, N.J.B. y Ackerly, D.D. (2010) Functional trait and phylogenetic tests of community assembly
across spatial scales in an Amazonian forest. Ecological Monographs, 80, 401–422.
Laliberté, E., Legendre, P., Shipley, B., y Laliberté, ME (2014). Paquete 'FD'.Version, 1, 12.
Losos, J. B. (1996). Phylogenetic perspectives on community ecology. Ecology, 1344-1354.
Losos, J. B. (2008). Phylogenetic niche conservatism, phylogenetic signal and the relationship
between phylogenetic relatedness and ecological similarity among species. Ecology
letters, 11(10), 995-1003.
May, F., Giladi, I., Ristow, M., Ziv, Y., y Jeltsch, F. (2013). Plant functional traits and community
assembly along interacting gradients of productivity and fragmentation. Perspectives in Plant
Ecology, Evolution and Systematics, 15(6), 304-318.
Milne, B. T. (1992). Spatial aggregation and neutral models in fractal landscapes. American
Naturalist, 32-57.
Mouquet, N., Devictor, V., Meynard, C. N., Munoz, F., Bersier, L. F., Chave, J., ... & Thuiller, W.
(2012). Ecophylogenetics: advances and perspectives. Biological reviews, 87(4), 769-785.
Pérez-Harguindeguy, N., Díaz, S., Garnier, E., Lavorel, S., Poorter, H., Jaureguiberry, P., ... y
Cornelissen, J. H. C. (2013). New handbook for standardised measurement of plant functional
traits worldwide. Australian Journal of Botany, 61(3), 167-234.
Poorter, H., Van Rijn, C. P., Vanhala, T. K., Verhoeven, K. J., De Jong, Y. E., Stam, P., y Lambers,
H. (2005). A genetic analysis of relative growth rate and underlying components in Hordeum
spontaneum. Oecologia, 142(3), 360-377.
Poorter, L., Wright, S. J., Paz, H., Ackerly, D. D., Condit, R., Ibarra-Manríquez, G., ... y Wright, I. J.
(2008). Are functional traits good predictors of demographic rates? Evidence from five
neotropical forests. Ecology, 89(7), 1908-1920.
Poorter, L., y Bongers, F. (2006). Leaf traits are good predictors of plant performance across 53 rain
forest species. Ecology, 87(7), 1733-1743.

Diversidad funcional y filogenética en los Bosques Secos del Sur del Ecuador
112
S122.
Sgro, C. M., Lowe, A. J., & Hoffmann, A. A. (2011). Building evolutionary resilience for conserving
biodiversity under climate change. Evolutionary Applications, 4(2), 326-337.
Shipley, B., Paine, C. T., & Baraloto, C. (2012). Quantifying the importance of local niche-based and
stochastic processes to tropical tree community assembly. Ecology, 93(4), 760-769.
Srivastava, D. S., Cadotte, M. W., MacDonald, A. A. M., Marushia, R. G., & Mirotchnick, N. (2012).
Phylogenetic diversity and the functioning of ecosystems. Ecology Letters, 15(7), 637-648.
Swenson, N. G., y Enquist, B. J. (2007). Ecological and evolutionary determinants of a key plant
functional trait: wood density and its community-wide variation across latitude and
elevation. American Journal of Botany, 94(3), 451-459.
Swenson, N.G. (2013) The assembly of tropical tree communities - the advances and shortcomings of
phylogenetic and functional trait analyses. Ecography, 36, 264–276.
Swenson, N.G. y Enquist, B.J. (2009) Opposing assembly mechanisms in a Neotropical dry forest:
implications for phylogenetic and functional community ecology. Ecology, 90, 2161–2170.
Swenson, N.G., Anglada-Cordero, P. y Barone, J.A. (2011) Deterministic tropical tree community
turnover: evidence from patterns of functional beta diversity along an elevational gradient.
Proceedings of the Royal Society B, 278, 877–884.
Swenson, N. G. (2012). The functional ecology and diversity of tropical tree assemblages through
space and time: from local to regional and from traits to transcriptomes. ISRN Forestry, 2012.
Swenson, N.G., Enquist, B.J., Pither, J., Thompson, J. y Zimmerman, J.K. (2006) The problem and
promise of scale dependency in community phylogenetics. Ecology, 87, 2418–2424.
Tofts, R., y Silvertown, J. (2000). A phylogenetic approach to community assembly from a local
species pool. Proceedings of the Royal Society of London B: Biological Sciences, 267(1441),
363-369.
Van Gelder, H. A., Poorter, L., y Sterck, F. J. (2006). Wood mechanics, allometry, and life‐ history
variation in a tropical rain forest tree community. New Phytologist, 171(2), 367-378.
Verdú, M., & Pausas, J. G. (2007). Fire drives phylogenetic clustering in Mediterranean Basin woody
plant communities. Journal of Ecology, 95(6), 1316-1323.

Diversidad funcional y filogenética en los Bosques Secos del Sur del Ecuador
113
Walters, M. B., & Reich, P. B. (1999). Low‐ light carbon balance and shade tolerance in the
seedlings of woody plants: do winter deciduous and broad‐ leaved evergreen species
differ?. New Phytologist, 143(1), 143-154.
Webb, C. O. (2000). Exploring the phylogenetic structure of ecological communities: an example for
rain forest trees. The American Naturalist, 156(2), 145-155.
Webb, C. O., Ackerly, D. D., McPeek, M. A., & Donoghue, M. J. (2002). Phylogenies and
community ecology. Annual review of ecology and systematics, 475-505.
Westoby, M. (1998). A leaf-height-seed (LHS) plant ecology strategy scheme.Plant and soil, 199(2),
213-227.

Diversidad funcional y filogenética en los Bosques Secos del Sur del Ecuador
114
Apéndice 1: Detalles matemáticos de los modelos ajustados
1. Proceso homogéneo de Poisson (HPP)
En este proceso se define por su intensidad λ que normalmente se aproxima como λ = n / A, es decir,
la relación entre el número de puntos n y el área A de la ventana de observación. Su parámetro
denota la intensidad del patrón y describe el número medio de los puntos localizados en una unidad de
superficie, es decir, la densidad media de árboles por unidad de área para cada especie (Plotkin et al.
2000, Shen et al. 2009). K(r) es el número esperado de puntos en un círculo de radio r alrededor de
un punto arbitrario. La función K para un patrón de puntos homogéneo es estimada como:
donde A y n son el área y el número de puntos en la parcela respectivamente, wij es un factor de
corrección de borde, y la función indicador I. El HPP tiene una intensidad constante a lo largo del área
de estudio y la distribución de los puntos es independiente, por lo que el valor esperado es K(r) = πr2
(Illian et al. 2008).
2. Proceso de Poisson cluster (PCP)
Procesos Poisson clúster puntos no-independientes (agrupados) en un proceso de dos pasos. Primero,
se genera un HPP de puntos “padres” con intensidad. Luego cada “padre” produce un número
aleatorio de “descendientes” que se distribuyen de acuerdo a una ley de Poisson, con media =/,
donde representa la intensidad de los descendientes; y sus ubicaciones son independientes,
isotrópica y normalmente distribuidos alrededor de cada árbol padre, con media cero y desviación
estándar σ (Stoyan y Stoyan 1994). La función K esperada para un PCP es
Los parámetros y son usualmente ajustados comparando la función K empírica con la función K
teórica, mediante el método de mínimo contraste (Stoyan y Stoyan 1994, Diggle 2003). De esta

Diversidad funcional y filogenética en los Bosques Secos del Sur del Ecuador
115
forma, la agregación del patrón es cuantificada por (número medio de grupos), y el tamaño medio
de los grupos está dado por . El PCP considera la distribución de descendientes como una función
de dispersión limitada y asume homogeneidad, sin embargo las características que conlleva esta
condición podrían no cumplirse por muchas especies debido a la heterogeneidad ambiental y
asociación de hábitat (Gunatilleke et al. 2006, Wiegand et al. 2007b, Morlon et al. 2008).
Proceso Poisson no homogéneos (IPP).
El IPP supone la formación del patrón en dos etapas, primero se genera un patrón de Poisson
homogéneo, luego los puntos del patrón son retenidos con una probabilidad proporcional a la
superficie (x), la cual describe la heterogeneidad ambiental. En ausencia de valores de variables
ambientales, esa superficie es estimada con una función kernel. Este proceso puede ser utilizado para
examinar los efectos de interacción entre la densidad de árboles y los factores ambientales (Shen et al.
2009). Este proceso se estima como:
donde x={x1,…,xn}A, w es el factor de corrección de borde (Ripley 1977, Baddeley 1999).
El valor esperado de la función K heterogénea para un IPP es . La función de intensidad
(x) puede ser estimada en diferentes formas. Aquí utilizamos el método basado en “kernel
smoothing” (Baddeley 2010), que estima la intensidad en la ubicación u como
,
donde k(u) es una función kernel arbitraria y e(u) es término de corrección de borde. Utilizamos
kernel Gaussiano bidimensional como función de suavizamiento.
Proceso de Poisson cluster heterogéneo (IPCP)
Como una alternativa al IPP, es considerado también una extensión del HPCP, donde la distribución

Diversidad funcional y filogenética en los Bosques Secos del Sur del Ecuador
116
de los puntos además de ser agrupada es heterogénea. Waagepetersen (2007) considera un proceso
cluster X=XcY donde Xc son los cluster de los “descendientes” asociados a los puntos “padres” c en
un proceso de Poisson estacionario Y con intensidad > 0. La función de intensidad de X tiene forma
log-lineal, y el valor esperado para la función K heterogénea tiene la misma forma que para el HPCP.
Este proceso es adecuado para evaluar el efecto conjunto de heterogeneidad de hábitat y dispersión
limitada (Diggle 2003, Illian et al. 2008), de forma similar al HPCP, excepto por el número de
descendientes por padre, el cual ya no es una constante, sino que debe ser estimado a través de una
función de intensidad espacialmente heterogénea (Waagepetersen 2007, Yi-Ching Lin et al. 2011).
Los modelos fueron equipados con código basado en la spatstat paquetes R (Baddeley y Turner 2005)
y ecespa (De la Cruz, 2008). Proporcionamos este código y ejemplos de su uso en un nuevo paquete
de R (selectspm) disponible en los servidores CRAN habituales (cran.r-project.org). Tanto las
funciones-K homogéneos y no homogéneos se estimaron utilizando la corrección borde isotrópica de
Ripley (Ripley, 1978). Todas las funciones se estimaron hasta 75 m (es decir, r max = 75 m), con
pasos de 1 m.

Diversidad funcional y filogenética en los Bosques Secos del Sur del Ecuador
117
Appendice 2:
Tabla.1: valores de ajuste de bondad de u (gof-u) de los diferentes modelos adaptados a cada especie
IPCP: Proceso de agrupación de Poisson no homogénea; IPP: Procesos de Poisson no homogéneo
Species Best model value-u
1. Armatocereus. cartwrightianus IPCP 94235537
2. Bursera.graveolens IPCP 5847679
3. Caesalpinia.glabrata IPCP 31586555
4. Coccoloba.ruiziana IPCP 65851604
5. Colicodendron.scabridum IPCP 983903.6
6. Cordia.lutea IPCP 506813760
7. Croton rivinifolius IPCP 12895271
8. Erythrina.velutina IPCP 107762648
9. Erythroxylum.glaucum IPCP 4196608
10. Geoffroea.spinosa IPCP 6905221
11. Leucaena.trichodes IPCP 12515970
12. Malphigia.emarginata IPCP 5186331
13. Piptadenia.flava IPCP 15047050
14. Tabebuia.chrysantha IPCP 13088950
15. Achatocarpus.pubescens IPP 94235537
16. Chloroleucon.mangense IPP 8431424
17. Cochlospermum.vitifolium IPP 991187.5
18. Cynophalla.mollis IPP 1461603
19. Eriotheca.ruizii IPP 3137833
20. Jacquinia.sprucei IPP 56464279
21. Pisonia.aculeata IPP 72624176
22. Pithecellobium.excelsum IPP 11102231
23. Tabebuia.billbergii IPP 965215.2

Diversidad funcional y filogenética en los Bosques Secos del Sur del Ecuador
118
Referencias
Baddeley, A.J. 1999. Spatial sampling and censoring. In:Barndorff-Nielsen, O.E., Kendall, W.S., and
van Lieshout, M.N.M. (eds.) Stochastic geometry: Likelihood and Computation. Chapman and
Hall/CRC, London pp. 37-78.
Baddeley, A.J., MØller, J. y Waagepetersen, R. 2000. Non- and semi –parametric estimation of
interaction in inhomogeneous point patterns. Statistica Neerlandica 54(3): 329-350.
Baddeley, A.; Turner, R., 2005: Spatstat: an R package for analyzing spatial point patterns. Journal of
Statistical Software 12(6), 1-42.
Baddeley, A.J. 2010. Analysing spatial point patterns in R. CSIRO and University of Western
Australia, Workshop notes, version 4.1.
Diggle, P. J. 2003. Statistical analysis of spatial point patterns. Second edition. - Arnold, London.
Getzin, S.; Wiegand, T.; Wiegand, K.; Fangliang, He. 2008: Heterogeneity influences spatial patterns
and demographics in forest stands. Journal of Ecology 96, 807-820.
Gunatilleke, C. V. S., Gunatilleke, I. A. U. N., Esufali, S., Harms, K. E., Ashton, P. M. S., Burslem,
D. F. R. P. y Ashton, P. S. 2006. Species-habitat associations in a Sri Lankan dipterocarp forest.
Journal of Tropical Ecology 22: 371-384.
Illian, J., Penttinen, A., Stoyan, H. y Stoyan, D. 2008. Statistical Analysis and Modeling of Spatial
Point Patterns. John Wiley & Sons Ltd. England.
Morlon, H., Chuyong, G., Condit, R., Hubbell, S. Kenfack, D., Thomas, D., Valencia, R. y Green, J.
L. 2008. A general framework for the distance-decay of similarity in ecological communities.
Ecology Letters 11: 904-917.
Neyman, J. 1939. On the new class of “contagious” distributions, applicable in entomology and
bacteriology. The Annals of Mathematical Statistics 10(1): 35-57.
Neyman, J. y Scott, E.L. 1958. Statistical approach to problems of cosmology. Journal of the Royal
Statistical Society. Series B. 20(1): 1-43.

Diversidad funcional y filogenética en los Bosques Secos del Sur del Ecuador
119
Plotkin, J.B., Potts, M.D., Leslie, N., Manokaran, N., LaFrankie, J. y Ashton, P. 2000. Species-area
curves, spatial aggregation, and habitat specialization in tropical forest. Journal of Theoretical
Biology 2007: 81-99.
Ripley, B.D. 1977. Modeling spatial patterns. Journal of the Royal Statistical Society. Series B
(Methodological) 39(2): 172-212.
Shen, G., Yu, M., Hu, X-S., Mi, X., Ren, H., Sun, I-F., y Ma, K. 2009. Species-area relationship
explained by the joint effects of dispersal limitation and hábitat heterogeneity. Ecology 90(11):
3033-3041.
Stoyan, D. y Stoyan, H. 1994. Fractals, Random Shapes and Point Fields. Wiley, Chichester.
Waagepetersen, R. P. 2007. An Estimating Function Approach to Inference for Inhomogeneous
Neyman–Scott Processes. Biometrics 63: 252–258.
Wang, X., Wiegand, T., Wolf, A., Howe, R., Davies, S. J. y Hao, Z. 2011. Spatial patterns of tree
species richness in two temperate forests. Journal of Ecology 99: 1382-1393.
Webster, R. y Mcbratney, A.B. 1989. On the Akaike information criterion for choosing models for
variograms of soil properties. Journal of Soil Science 40: 493–496.
Wiegand, T., Gunatilleke, S. y Gunatilleke, N. 2007. Species associations in a heterogeneous Sri
Lankan Dipterocarp forest. The American Naturalist 170: E77–E95.
Wiegand, T, y Moloney, K.A. 2014. Handbook of Spatial Point-Pattern Analysis in Ecology.
Chapman & Hall/CRC. Iowa, USA.
Yi-Ching, L., Chang, L-W., Yang, K-Ch., Wang, H-H. y Sun, I-F. Point patterns of tree distribution
determined by habitat heterogeneity and dispersal limitation. Oecologia 165: 175-184.

Diversidad funcional y filogenética en los Bosques Secos del Sur del Ecuador
120

Diversidad funcional y filogenética en los Bosques Secos del Sur del Ecuador
121
CAPÍTULO 4
Mechanisms of community assemblage at level
taxonomic, functional and phylogenetic in a scale
spatial

Diversidad funcional y filogenética en los Bosques Secos del Sur del Ecuador
122

Diversidad funcional y filogenética en los Bosques Secos del Sur del Ecuador
123
ABSTRACT
Recently, ecologists have moved from measuring diversity as the species richness and
evenness, to using measures that reflect ecological differences as use of the functional and
phylogenetic diversity of species, because several evidences that pointed to consider
functional traits as better predictors of diversity.
We are interesting in know the individual species–area relationships (ISAR) to measure to
species richness in local neighborhoods around the individuals of a focal species within a
community. Individual Functional Diversity-Area Relationship (IFDAR) to measure scale-
dependent, local functional diversity structures around individual species, and individual
Phylogenetic Species Variability Area Relationship (IPSVAR) to measure of the
phylogenetic distance between species. We have used these tools in a dry forest in south of
Ecuador.
Our results showed that at all the spatial scales considered for ISAR, IFDAR and IPSVAR,
most species behaved as ‘neutral’, i.e. they are surrounded by the expected richness. Some
species in IFDAR (39%), IPSVAR (17%), were accumulator the functional and phylogenetic
diversity, suggesting the existence of a process of limiting similarity, i.e. the species are more
functionally different than expected. A small proportion of species was repeller of functional
and phylogenetic diversity than expected, suggesting the existence of an additional process
habitat filtering.
In this study highlights how analyzing alternative dimensions of biodiversity, such as
functional and phylogenetic diversity, may help us understand the co-occurrence of species in
diverse assemblages. These results suggest that some species showed a different behavior to
the plant-plant interactions, where the abiotic interactions and environment are important in
the community assembly at functional and phylogenetic levels.

Diversidad funcional y filogenética en los Bosques Secos del Sur del Ecuador
124
INTRODUCTION
Historically, species richness has been the most common metric used to characterize local
and regional biodiversity of ecosystem. However, a more accurate assessment of biodiversity
can be achieved by studying simultaneous the three diversity, taxonomic, functional and
phylogenetic (Swenson 2011). For example, use of only the taxonomic diversity for
conservation or management could mask losses of functionality of ecosystem (Díaz and
Cabido 2001). Functional diversity is the variety of life-history traits presented by an
assemblage of organisms (Mayfield et al. 2006), and is critical to the maintenance of
ecosystem processes (Hooper and Vitousek 1997; Tilman and Downing 1994; Tilman et al.
1997). Thus, functional diversity adds an important dimension to the conventional
characterization of biodiversity (Faith 2015). Phylogenetic diversity describes the total
phylogenetic distance among species in a community (Faith 1992) and provides a measure of
future biodiversity, identifying phylogenetic patterns in community composition can generate
hypotheses about the abiotic and biotic factors structuring communities (Helmus et al. 2007).
During the past decade ecologists have increasingly utilized phylogenetic and functional
traits information to estimate the ecological similarity of species in order to test mechanistic
community assembly hypotheses (Swenson 2013), because several evidences pointed to
consider functional traits to be better predictors of diversity (Tilman et al. 1997; Cadotte et al.
2009; Flynn et al. 2011; Helmus and Ives 2012). A common idea in the study of ecology is
that taxonomic, functional and phylogenetic diversity are positively correlated, that is,
accounting for one of these components also accounts for the others. However, recent studies
(Cadotte et al. 2013; Pavoine and Bonsall 2011; Pavoine et al. 2013) suggested that these
components might also represent independent aspects of community structure (Dainese et al.
2015).
Diversidad funcional y filogenética en los Bosques Secos del Sur del Ecuador
125
Have developed newfangled statistical analysis for the plant diversity study, by using spatial
patterns, as is the use of ISAR (His Individual Species–Area relationship) that computes
species richness in local neighborhoods around the individuals of a focal species within a
community. As a consequence a particular species can be identified as an accumulator or
repeller of diversity, or as neutral. Although repelling can be interpreted as the expectation of
a prevalence of “competition” between species, and facilitation in the case of accumulation,
this must be done with caution and only after partialling out the possible existence of other
mechanisms, which can give also similar spatial signals (Espinosa et al.2015). Both
accumulators and repellers have been taken as evidence for non-neutral or niche- based
processes influencing the distribution and diversity of tree species in forest communities.
Conversely if the species diversity around a target individual does not deviate significantly
from that expected, this is taken as evidence for neutrality (Wiegand et al. 2007). The
proportion of these plant types and abundance within a community could shed light on the
mechanisms ruling coexistence in mega-diverse communities. For example, interspecific
aggregations of plants are often interpreted as a result of positive plant-plant interactions that
are generally considered to play a prominent role in semiarid plant community dynamics
because of harsh climate and scarce resources in these environments (Schlesinger et al. 1990;
Kéfi et al. 2007; Pugnaire et al. 2011; Espinosa et al. 2014).
Despite the clear impact of the approach developed by Wiegand et al. (2007). It has been
expanded this vision of spatial processes occurring in the community assembly, using tools
such measure of functional and phylogenetic diversity as the IFDAR (Individual functional-
diversity–area relationship) and IPSVAR (Individual Phylogenetic Species Variability Area
Relationship).
The IFDAR quantifies the functional diversity and the IPSVAR the phylogenetic diversity of
species within circular areas around a target individual of a species. The IPSVAR is then

Diversidad funcional y filogenética en los Bosques Secos del Sur del Ecuador
126
compared with the expected random ratio taking into account the phylogenetic diversity of
species observed in the neighborhood, and IFDAR is compared with the expected random
ratio taking into account the traits diversity of species observed. The simultaneous
comparison of these functions and null models will give new insights of the process and
timing implied in the organization of the forests (Helmus and Ives 2012).
The aim of this study is to evaluate the species behavior in the three levels of diversity using
ISAR- for the level taxonomic, IFDAR for the level functional and IPSVAR for the level
phylogenetic. We test these patterns in the Neotropical dry forest, this ecosystem is especially
interesting because it is periodically subjected to a strong abiotic stress, which has led to
species develop patterns and morphofunctional adaptations. Some studies have showed that
in this ecosystem, the facilitation is stronger under stress conditions and it reduced when
conditions improve (e.g. Espinosa et al. 2014, 2011), additionally, to local scales Espinosa et
al. (2015) found interesting evidence that to local scales exist different processes acting such
as facilitation and habitat association. We are interested in disentangle the mechanisms of
community assemblage at local spatial scale. Specifically, we are interesting in know 1) if
plant-plant interactions define structure in our dry forest community and if it is mediated by
habitat filtering or limiting similarity, or both, and 2) to what extent the environmental
conditions define the structure of community. When plant-plant interactions dominate, we
expected that species would present accumulator or repeller behavior at the taxonomic level.
Accumulator behavior at taxonomic level means positive plant-plant interaction; if these
interactions are mediated by limiting similarity at the same scale, we expected that the
species would present the same behavior at functional and phylogenetic levels. Conversely if
species show repeller behavior at taxonomic level, and this behavior is mediated by habitat
filtering, we expect repeller behavior at functional and phylogenetic levels.
On the other hand, if environmental conditions rather than plant-plant interactions define the

Diversidad funcional y filogenética en los Bosques Secos del Sur del Ecuador
127
community assembly, we expect a repeller pattern at functional and phylogenetic level if
habitat filtering is predominant, but an accumulator pattern if the limiting similarity is
predominant.
Methods
Study Site
The study was conducted in the Arenillas Ecological Reserve (REA, from its Spanish name),
located in southwestern Ecuador (03º34′15.44′′S; 80º08′46.15′′E, 30 m a.s.l.), in El Oro
province, between the towns of Arenillas and Huaquillas. This reserve covers 131,7 Km2
(Decreto Ejecutivo No. 787), with an altitude ranging from 0 to 300 m. The climate is
characterized by a rainy season with an average annual rainfall of 515 mm from January to
April (wet season) and only 152 mm on average during the eight-month dry season (weather
station Huaquillas for a record period of 45 years (1969-2014)). The average temperature is
21-25 °C with a maximum variation of 3.4 ºC in the coldest and warmest reaching the lowest
temperature during the dry season. These dry forests are considered the most threatened
ecosystems in Ecuador (Sierra 1999; Gentry 1977; Espinosa et al. 2015).
In the center of the REA in 2009, a permanent plot of 9 hectares was set up and marked all
trees and shrubs greater than 5 cm and identified. During the dry season (July to September
2010 and 2011) were mapped using a total station, Leica TS02-5 Power model with less than
5 cm accuracy.
Functional trait collection
The following functional traits were collected for 38 species between trees and shrubs that
growing in the permanent plot the traits were: maximum height (Hmax) (is the distance
between the top of photosynthetic tissue and the ground), leaf area (in square centimeters),
specific leaf area (SLA, in square centimeters of fresh leaf area per gram of dry leaf mass),

Diversidad funcional y filogenética en los Bosques Secos del Sur del Ecuador
128
wood density (in grams per square centimeter) and seed mass (in grams). The traits were
measured following standardized protocols (Pérez-Harguindeguy et al. 2013). For each
species, we randomly collected 10 leaves from each of 50 individuals. Leaf area was
measured with the program Image J (Abramoff et al. 2004; Kraft et al. 2010). Specific leaf
area was calculated, as the fresh leaf area divided by the leaf dry mass (48 hours drying at 80
ºC), for species of compound leaves the rachis was included. They were collected during the
phenologic peak. To estimate wood density secondary branches of three individuals were
collected with size in circumference ranging from 10 to 20 cm, fresh wood volume was
determined with the water displacement method (Chave 2006), after which samples were
oven-dried at 80ºC and weighed for species that we could not calculate the wood density, was
used the database of Chave et al (2009). Seed mass was recorded of the Kew Millennium
Seed database (Royal Botanic Gardens Kew 2014).
Phylogeny construction
A phylogenetic tree was constructed for these 38 species in the plot, using Phylomatic (Webb
and Donoghue 2005). Phylomatic utilizes the Angiosperm Phylogeny Group III (APG III
2010). Taxonomic relationships (family, genus and species) are pasted onto this backbone to
estimate the phylogenetic tree. Branch lengths were estimated for each tree using the BLADJ
algorithm implemented in Phylocom (Webb et al. 2008), to adjust the length of the branches
of the phylogeny with known ages of fossils of plants (Wikström et al. 2001). The ''ape”
library was used to import and manipulate the phylogeny, as required in R (Paradis 200, R
Development Core Team 2009). Our metric used for of phylogenetic analysis was
phylogenetic species variability (PSV) this measure of phylogenetic species variability
summarizes the degree to which species in a community are phylogenetically related
(Helmus et al. 2007)

Diversidad funcional y filogenética en los Bosques Secos del Sur del Ecuador
129
Spatial pattern analysis
To select appropriate null models for each species, we followed an approach conceptually
similar to the pattern reconstruction strategy of Wiegand et al. (2013) and implemented in
Chacón et al. (2013). We first fitted a battery of different spatial null models for each species:
(1) a homogeneous Poisson process (HPP) with constant intensity λ equal to the density of
the observed pattern; (2) a homogeneous Poisson cluster process (HPCP) with constant
intensity λ and parameters σ and ρ fitted by minimum contrast (Diggle 2003); (3)
heterogeneous Poisson processes (IPP) with an intensity function λ (x,y) estimated with a
Gaussian kernel (Wiegand et al. 2007) with 13 different σ values (bandwidths) from σ = 15 to
σ= 75 m with a sequence of 5 m; and, finally, (4) heterogeneous Poisson cluster processes
(IPCP) (Waagepetersen 2007) with sigma-values similar to IPP. A detailed description of the
four models of processes considered in this study is located in Appendix 1, of Chapter 3 of
the thesis. We performed 199 simulations for each null model. To avoid difficulties due to
small sample size we only calculated functions for species with at least 10 individuals.
Best model for each species was selected with the goodness-of-fit u statistic (Diggle 2003;
Loosmore and Ford, 2006; Pescador et al. 2014).
Taxonomic, Functional and phylogenetic diversities
We analyzed our community in three dimensions: Taxonomic using the ISAR, functional by
IFDAR, and phylogenetic by IPSVAR.
For taxonomic diversity first, we computed ISAR for ‘adult’ individuals with DBH 10 cm,
which in our ecosystem is the dominant life stage (Linares-Palomino and Ponce-Alvarez
2009); these functions summarize how community richness is organized around individual
species once they reach maturity (Wiegand et al. 2007).
IFDAR allows the calculation of functional diversity around individual species to be

Diversidad funcional y filogenética en los Bosques Secos del Sur del Ecuador
130
evaluated against the expectations of some assumed ecological processes and corresponding
null models, for example, if competitive effects were ruling the structure of a community, we
would expect an increase (i.e., accumulation) of FD around individual species. On the
contrary, if only habitat filtering is affecting the assembly process, we should find that most
species have small values of FD in their neighborhoods. Even more if several processes were
simultaneously ruling the community assembly, IFDAR could detect there differential
effects, at least when these are occurring at contrasting spatial scales (De la Cruz in prep).
IFDAR is able to detect both positive and negative deviations of functional diversity from the
expectations of a heterogeneous null model.
IPSVAR is then compared with the expected random ratio taking into account the
phylogenetic diversity of species observed in the neighborhood, closely related species might
have similar tolerances to similar environmental stressors and thus be more likely to occur
within the same community than with less related species (e.g., Webb 2000). Conversely,
closely related species might share the same resource requirements, and therefore
competition could prevent similar species in the same community (Elton 1946).
The goodness of fit of the models were evaluated in three ranges of radius 0 to 20 m; 21 to 40
m and 41 m- 60 m, to test for differences between the observed pattern and the null model
of ISAR, IFDAR and IPSVAR
All calculations were done using the R statistical software, version 3.1.0 (R Development
Core Team, 2014). The ISAR analyses were implemented using the statistical package
‘‘idar’’ (De la Cruz, in prep.). The randomization process was simulated using the packages
‘‘spatstat’ (Baddeley and Turner 2005), ecespa (De la Cruz, 2008) and “picante” (Kembel et
al. 2010).

Diversidad funcional y filogenética en los Bosques Secos del Sur del Ecuador
131
Results
We tagged and georeferenced 9479 individuals with DBH greater than 5 cm in the 9-ha plot.
We found 38 species, 19 of trees and 19 of shrubs. We selected 23 species (14 trees, 9
shrubs) with more than 10 individuals, belonging to 14 families. (Appendix A).
The best fit for spatial patterns were homogeneous Poisson cluster for fourteen species, and
homogeneous Poisson processes for nine species (Appendice 1). In all cases, the best models
included intensity surfaces estimated from their own patterns with Gaussian kernels.
Taxonomic, Functional and phylogenetic diversities
Considering the ranges of radius r= 0–60 m, the most prevalent behavior for the 23 species
was neutral for ISAR with 57%, (13 species); IFDAR 60 % (14 species); and 70 % (16
species) for IPSVAR (Fig. 1).
0 20 40 60
02
04
060
80
100
ISAR
Radius r of circle (m)
Pe
rce
nta
ge
of ca
ses
neutrals
accumulators
repellers
0 20 40 60
02
04
060
80
100
IFDAR
Radius r of circle (m)
Pe
rce
nta
ge
of ca
ses
neutrals
accumulators
repellers
0 20 40 60
02
04
060
80
100
IPSVAR
Radius r of circle (m)
Pe
rce
nta
ge
of ca
ses
neutrals
accumulators
repellers
Figure1: Proportion of significant accumulator, repeller and neutral species for ISAR (Individual
Species-Area Relationships), IFDAR (Individual Functional-Diversity–Area Relationship) and
IPSVAR (Individual Phylogenetic Species Variability Area Relationship) in the REA, in a radius of
0-60 m.
For ISAR (taxonomic diversity) six species were accumulators (26%) in all spatial scales
(r=0-60 m), and Chloroleucon mangense was the only repeller of diversity in all-spatial

Diversidad funcional y filogenética en los Bosques Secos del Sur del Ecuador
132
scales. In IFDAR (functional diversity) one species were accumulators (Jacquinia sprucei)
and one repeller (Armatocereus sp) of diversity (4%) in all-spatial scales (r=0-60 m). With
respect IPSVAR only was accumulator and repeller in certain spatial scales (Table 2).

Diversidad funcional y filogenética en los Bosques Secos del Sur del Ecuador
133
Table 2. p-values of the GoF u test for three spatial ranges: 0–20, 21–40 and 41–60 m. Grey background: species that behaved as accumulators in the
evaluated range. Black background: species that behaved as repellers in the evaluated range. Neutral behavior is showed as white cells and n.c. indicates that
ISAR, IFDAR and IPSVAR, were not calculated.
Species ISAR IFDAR IPSVAR
R0-20 R21-40 R41-60 R0-20 R21-40 R41-60 R1-20 R21-40 R41-60
Achatocarpus pubescens 0.91 0.94 0.16 0.94 0.02 0.05 0.56 0.52 0.64
Armatocereus sp. 0.16 0.41 0.5 0.01 0.01 0.01 0.15 0.04 0.04
Bursera graveolens 0.24 0.07 0.1 0.56 0.85 0.9 0.1 0.11 0.16
Caesalpinia glabrata 0.01 0.01 0.03 0.42 0.38 0.66 0.95 0.48 0.1
Chloroleucon mangense 0.01 0.01 0.01 0.1 0.04 0.01 0.68 0.05 0.24
Coccoloba ruiziana 0.15 0.29 0.05 0.65 0.7 0.23 0.34 0.65 0.44
Cochlospermum vitifolium 0.2 0.07 0.11 0.72 0.29 0.69 0.48 0.13 0.04
Colicodendron scabridum 0.57 0.07 0.14 0.09 0.77 0.35 0.31 1 0.48
Cordia lutea 0.08 0.68 nc 0.47 0.81 nc 0.81 0.55 nc
Croton sp 0.33 0.63 0.9 0.09 0.38 0.37 0.07 0.62 0.39
Cynophalla mollis 0.01 0.01 0.01 0.03 0.38 0.16 0.7 0.07 0.01
Eriotheca ruizii 0.01 0.01 0.02 0.05 0.48 0.67 0.69 0.45 0.91
Erythrina velutina 0.36 0.14 0.13 0.02 0.37 0.99 0.79 0.07 0.08

Diversidad funcional y filogenética en los Bosques Secos del Sur del Ecuador
134
ISAR (Individual Species–Area Relationship), IFDAR (Individual Functional-Diversity–Area Relationship) and IPSVAR (Individual Phylogenetic Species Variability Area
Relationship).
Erythroxylum glaucum 0.02 0.39 0.43 0.33 0.76 0.59 0.51 0.8 0.7
Geoffroea.spinosa 0.01 0.01 0.01 0.13 0.42 0.84 0.53 0.84 0.11
Jacquinia sprucei 0.01 0.01 0.01 0.01 0.01 0.01 0.05 0.01 0.01
Leucaena trichodes 0.57 0.41 0.64 0.12 0.67 0.56 0.04 0.5 0.94
Malphigia emarginata 0.01 0.01 0.02 0.01 0.51 0.1 0.21 0.26 0.66
Piptadenia flava 0.27 0.19 0.42 0.20 0.07 0.59 0.04 0.59 0.82
Pisonia aculeata 0.05 0.54 0.71 0.46 0.78 0.68 0.43 0.15 0.52
Pithecellobium excelsum 0.28 0.02 0.01 0.5 0.04 0.05 0.21 0.09 0.08
Tabebuia billbergii 0.55 0.13 0.09 0.01 0.07 0.49 0.57 0.52 0.64
Tabebuia chrysantha 0.12 0.46 0.35 0.12 0.3 0.44 0.08 0.37 0.41

Diversidad funcional y filogenética en los Bosques Secos del Sur del Ecuador
135
In ISAR some species showed different spatial patterns depending on the proximity to the target
plant. For example, Erythroxylum glaucum accumulated diversity at short distances (r= 0-20 m)
and Pithecellobium excelsum, accumulated taxonomic diversity at large distances (r= 21-60 m)
(Table 2). For IFDAR five species (22%) accumulated diversity at short distances (r= 0-20 m),
and two species (9%) were accumulators in middle distances (r= 21- 40 m) (Table 2). Finally,
Chloroleucon mangense were repeller of diversity in greater distances (r= 21-60 m) (Table 2).
We found three species (13%) that behaved as accumulators in IPSVAR to large distances
Armatocereus sp. (r= 21- 60 m), Cynophalla mollis and Jacquinea sprucei (r= 41-60). Five
species (26%) behaved as repellers of phylogenetic diversity in the IPSVAR at short distances (4
species) and only one species at large distances (Cochlospermum vitifolium)(Table 2).
Cynophalla mollis showed an accumulator behavior so much for ISAR, IFDAR and IPSVAR in
different scales spatial (Fig.2).
0 20 40 60
0
5
10
15
20
25
30
a) Cynophalla mollis-ISAR
r
ISA
R(r
)
i sarobs(r)i sar(r)i sarhi(r)i sar l o(r)
0 20 40 60
0.00
0.02
0.04
0.06
0.08
0.10
0.12
0.14
b) Cynophalla mollis-IFDAR
r
IFD
AR
(r)
i fdarobs(r)i fdar(r)i fdarh i(r)i fdar lo(r)
0 20 40 60
0.80
0.85
0.90
c) Cynophalla mollis-IPSVAR
r
IPS
VA
R(r
)
ipsvarobs(r)ipsvar(r)ipsvarhi(r)ipsvar lo(r)
Figure 2: Proportion of significant accumulators for Cynophalla mollis (a) ISAR (Individual Species–
Area Relationship) in radius of 0-60 m, (b) IFDAR (Individual functional-diversity–area relationship) in
radius of 0-20 m, (c) IPSVAR (Individual Phylogenetic Species Variability Area Relationship) in radius

Diversidad funcional y filogenética en los Bosques Secos del Sur del Ecuador
136
of 40-60 m.
Our results also showed that five out of eight species that showed an accumulator behavior in
ISAR showed the coincident behavior in IFDAR, however the accumulator effect in IFDAR was
significantly only at short scales (Table 2).
Chloroleucon mangense was the only species that behaved as a repeller in the ISAR and IFDAR
(Fig. 3).
0 20 40 60
0
5
10
15
20
25
30
a) Chloroleucon mangense-ISAR
r
ISA
R(r
)
i sarobs(r)i sar(r)i sarhi(r)i sar lo(r)
0 20 40 60
0.00
0.02
0.04
0.06
0.08
0.10
0.12
0.14
b) Chloroleucon mangense-IFDAR
r
IFD
AR
(r)
i fdarobs(r)i fdar(r)i fdarhi(r)i fdar lo(r)
Figure 3. Proportion of significant repeller for Chloreucon mangense (a) ISAR (Individual Species–Area
Relationship) in radius of 0-60 m, and (b) IFDAR (Individual functional-diversity–area relationship) in
radius of 21-60 m.
In the case of Armatocereus sp, was repeller en IFDAR and accumulator of
diversity in IPSVAR, Jacquinea sprucei was accumulator in IFDAR and repeller
of diversity in IPSVAR (Table 2).

Diversidad funcional y filogenética en los Bosques Secos del Sur del Ecuador
137
Discussion
Alternative dimensions of biodiversity as functional and phylogenetic diversity may have the
ability to convey species–area relationships and determining the degree to which processes as
random placement, habitat filtering and/or limiting similarity contribute to the spatial distribution
and assembly of communities (Webb 2000, Swenson et al. 2007, Kraft et al. 2008, Swenson and
Enquist 2009, Helmus and Ives 2012). Our results showed that at all the spatial scales considered
for ISAR, IFDAR and IPSVAR, most species behaved as ‘neutral’, i.e. they are surrounded by
the expected richness, under a null model that only accounts for environmental heterogeneity.
In the case of ISAR some species behaved as accumulators in all spatial scales. Several authors
(Maestre and Cortina 2005, Wiegand et al. 2007a, Brooker et al. 2008) suggest that in the
harshest environments some species tend to improve their surrounding environment, which
results in a strong spatial structuring of the community. Under these conditions the importance of
negative interactions is reduced and increases the importance of positive relationships (Callaway
2007), so it is expected that positive interactions such as facilitation would be more important
and consequently accumulator species would predominate over repeller ones. In particular with
IFDAR, some species were significant accumulators of diversity only on local spatial scales (0-
20 m) and generally behaved neutrally on larger spatial scales (Table 1), and this suggests that
some process limiting similarity is controlling community assembly at fine scales. If this were
the case, inter-specific competition would make that species avoid functionally similar species in
their close proximity (De la Cruz in prep). The frequent clustering of species accumulators on the
functional diversity may be also driven by facilitation, allowing different species around it. In the

Diversidad funcional y filogenética en los Bosques Secos del Sur del Ecuador
138
case of Chloroleucon mangense was a repeller for ISAR and IFDAR, this repeller behavior could
be the consequence of a clumped spatial structure, where much of the living space surrounding
its individuals will be occupied by conspecifics, leaving less space for heterospecific species
(Yang et al, 2013) this process was generate for habitat filtering.
In the case of Phylogenetic diversity accumulators are hypothesized to be evidence also of
facilitation among distantly related species, while phylogenetic diversity repellers are
hypothesized to be target species where closely related species filter into the same neighboring
environment (Yang et al 2013).
Finally observe some cases as Cynophalla mollis and Jacquinia sprucei that were accumulator
for ISAR-IFDAR and IPSVAR (Table 2), these species could be acting as community engineers,
favoring the recruitment of multiple species through the improvement of environmental
conditions (Espinosa et al. 2015) allowing its around different functional species.
In this study highlights how analyzing alternative dimensions of biodiversity, such as functional
and phylogenetic diversity, may help us understand the co-occurrence of species in diverse
assemblages. These results suggest that some species showed a different behavior to the plant-
plant interactions, where the abiotic interactions and environment are also important in the
community assembly at functional and phylogenetic levels. In particular, we have shown that the
phylogenetic and functional distribution of some species are accumulators and repellers in this
dry forest is non-random indicating the importance of functional traits and past evolutionary
history in dictating the ecological interactions we presently observe.

Diversidad funcional y filogenética en los Bosques Secos del Sur del Ecuador
139
References
Abràmoff, M. D., Magalhães, P. J., y Ram, S. J. (2004). Image processing with ImageJ. Biophotonics
international, 11(7), 36-42.
Baddeley, A., Turner, R., Møller, J., and Hazelton, M. (2005). Residual analysis for spatial point
processes (with discussion). Journal of the Royal Statistical Society: Series B (Statistical
Methodology), 67(5), 617-666.
Brooker, R. W., Maestre, F. T., Callaway, R. M., Lortie, C. L., Cavieres, L. A., Kunstler, G., ... and
Michalet, R. (2008). Facilitation in plant communities: the past, the present, and the future. Journal
of Ecology, 96(1), 18-34.
Cadotte, M. W., Cavender-Bares, J., Tilman, D., and Oakley, T. H. (2009). Using phylogenetic,
functional and trait diversity to understand patterns of plant community productivity. PLoS
One, 4(5), e5695.
Cadotte, M., Albert, C. H., and Walker, S. C. (2013). The ecology of differences: assessing community
assembly with trait and evolutionary distances. Ecology Letters, 16(10), 1234-1244.
Callaway, R. M. (2007). Interaction between competition and facilitation (pp. 179-254). Springer
Netherlands.
Chave, J., Coomes, D., Jansen, S., Lewis, S. L., Swenson, N. G., y Zanne, A. E. (2009). Towards a
worldwide wood economics spectrum. Ecology letters,12(4), 351-366.
Chave, J., Muller-Landau, H. C., Baker, T. R., Easdale, T. A., Steege, H. T., and Webb, C. O. (2006).
Regional and phylogenetic variation of wood density across 2456 neotropical tree
species. Ecological applications, 16(6), 2356-2367.
Dainese, M., Lepš, J., and de Bello, F. (2015). Different effects of elevation, habitat fragmentation and
grazing management on the functional, phylogenetic and taxonomic structure of mountain
grasslands. Perspectives in Plant Ecology, Evolution and Systematics, 17(1), 44-53.
Díaz, S.and Cabido, M. 2001.Vive la difference: plant functional diversity matters to ecosystem

Diversidad funcional y filogenética en los Bosques Secos del Sur del Ecuador
140
processes. Trends in Ecology and Evolution, vol. 16, no 11, p. 646-655.
Elton, C. (1946). Competition and the structure of ecological communities. The Journal of Animal
Ecology, 54-68.
Espinosa, C. I., Cabrera, O., Luzuriaga, A. L., and Escudero, A. (2011). What Factors Affect Diversity
and Species Composition of Endangered Tumbesian Dry Forests in Southern
Ecuador?. Biotropica, 43(1), 15-22.
Espinosa, C. I., de la Cruz, M., Jara‐ Guerrero, A., Gusmán, E., and Escudero, A. (2015). The effects of
individual tree species on species diversity in a tropical dry forest change throughout
ontogeny. Ecography.
Espinosa, C. I., Luzuriaga, A. L., de la Cruz, M., and Escudero, A. (2014). Climate and grazing control
nurse effects in an Ecuadorian dry shrubby community.Journal of Tropical Ecology, 30(01), 23-32.
Faith, D. P. (1992). Conservation evaluation and phylogenetic diversity. Biological conservation, 61(1),
1-10.
Faith, D. P. (2015). The unimodal relationship between species’ functional traits and habitat gradients
provides a family of indices supporting the conservation of functional trait diversity. Plant
Ecology, 216(5), 725-740.
Flynn, D. F., Mirotchnick, N., Jain, M., Palmer, M. I., and Naeem, S. (2011). Functional and phylogenetic
diversity as predictors of biodiversity-ecosystem-function relationships. Ecology, 92(8), 1573-1581.
Gentry, A. (1977). Endangered plant species and habitats of Ecuador and Amazonian Peru. – In: Prance,
G. and Ellias, T. (eds), Extinction is forever. New York Botanical Garden, pp. 136–149.
Helmus, M. R., and Ives, A. R. (2012). Phylogenetic diversity-area curves.Ecology, 93(sp8), S31-S43.
Helmus, M. R., Savage, K., Diebel, M. W., Maxted, J. T., and Ives, A. R. (2007). Separating the
determinants of phylogenetic community structure. Ecology letters, 10(10), 917-925.
Helmus, M. R., Savage, K., Diebel, M. W., Maxted, J. T., and Ives, A. R. (2007). Separating the
determinants of phylogenetic community structure. Ecology letters, 10(10), 917-925.

Diversidad funcional y filogenética en los Bosques Secos del Sur del Ecuador
141
Hooper, D. U., and Vitousek, P. M. (1997). The effects of plant composition and diversity on ecosystem
processes. Science, 277(5330), 1302-1305.
Kéfi, S., Rietkerk, M., Alados, C. L., Pueyo, Y., Papanastasis, V. P., ElAich, A., and De Ruiter, P. C.
(2007). Spatial vegetation patterns and imminent desertification in Mediterranean arid
ecosystems. Nature, 449(7159), 213-217.
Kembel, S. W., Cowan, P. D., Helmus, M. R., Cornwell, W. K., Morlon, H., Ackerly, D. D., ... and
Webb, C. O. (2010). Picante: R tools for integrating phylogenies and
ecology. Bioinformatics, 26(11), 1463-1464.
Kraft, N.J.B. y Ackerly, D.D. (2010) Functional trait and phylogenetic tests of community assembly
across spatial scales in an Amazonian forest. Ecological Monographs, 80, 401–422.
Linares-Palomino, R., and Ponce-Alvarez, S. I. (2009). Structural patterns and floristics of a seasonally
dry forest in Reserva Ecológica Chaparri, Lambayeque, Peru. Tropical Ecology, 50(2), 305.
Loosmore, N. B., and Ford, E. D. (2006). Statistical inference using the G or K point pattern spatial
statistics. Ecology, 87(8), 1925-1931.
Maestre, F. T., and Cortina, J. (2005). Remnant shrubs in Mediterranean semi-arid steppes: effects of
shrub size, abiotic factors and species identity on understorey richness and occurrence. Acta
Oecologica, 27(3), 161-169.
Mayfield, M. M., Ackerly, D., and Daily, G. C. (2006). The diversity and conservation of plant
reproductive and dispersal functional traits in human‐ dominated tropical landscapes. Journal of
Ecology, 94(3), 522-536.
Pavoine, S., Gasc, A., Bonsall, M. B., and Mason, N. W. (2013). Correlations between phylogenetic and
functional diversity: mathematical artefacts or true ecological and evolutionary processes?. Journal
of Vegetation Science, 24(5), 781-793.
Pavoine, S., Vela, E., Gachet, S., De Bélair, G., and Bonsall, M. B. (2011). Linking patterns in
phylogeny, traits, abiotic variables and space: a novel approach to linking environmental filtering
and plant community assembly. Journal of Ecology, 99(1), 165-175.

Diversidad funcional y filogenética en los Bosques Secos del Sur del Ecuador
142
Pérez-Harguindeguy, N., Díaz, S., Garnier, E., Lavorel, S., Poorter, H., Jaureguiberry, P., ... y
Cornelissen, J. H. C. (2013). New handbook for standardised measurement of plant functional traits
worldwide. Australian Journal of Botany, 61(3), 167-234.
Pescador, D. S., Chacón-Labella, J., Cruz, M., and Escudero, A. (2014). Maintaining distances with the
engineer: patterns of coexistence in plant communities beyond the patch‐ bare dichotomy. New
Phytologist, 204(1), 140-148.
Pugnaire, F. I., Armas, C., and Maestre, F. T. (2011). Positive plant interactions in the Iberian Southeast:
mechanisms, environmental gradients, and ecosystem function. Journal of Arid
Environments, 75(12), 1310-1320.
Schlesinger, W. H., Reynolds, J. F., Cunningham, G. L., Huenneke, L. F., Jarrell, W. M., Virginia, R. A.,
and Whitford, W. G. (1990). Biological feedbacks in global desertification. Science, 247(4946),
1043-1048.
Sierra, M. (1999). Propuesta preliminar de un sistema de clasificación de vegetación para el Ecuador
continental. Proyecto Inefan/Gef-Birf y Ecociencia.
Soliveres, S. (2011). Efectos del estrés abiótico y factores bióticos en las interacciones planta-planta:
implicaciones para el funcionamiento y la restauración de los ecosistemas semiáridos. Revista
Ecosistemas, 20(2-3).
Swenson, N.G. (2013) The assembly of tropical tree communities - the advances and shortcomings of
phylogenetic and functional trait analyses. Ecography, 36, 264–276.
Swenson, N.G., Anglada-Cordero, P. y Barone, J.A. (2011) Deterministic tropical tree community
turnover: evidence from patterns of functional beta diversity along an
Tilman, D. (1997). Community invasibility, recruitment limitation, and grassland
biodiversity. Ecology, 78(1), 81-92.
Tilman, D., and Lehman, C. L. (1997). Habitat destruction and species extinctions.Spatial ecology, 233-
249.

Diversidad funcional y filogenética en los Bosques Secos del Sur del Ecuador
143
Tilman, D., May, R. M., Lehman, C. L., and Nowak, M. A. (1994). Habitat destruction and the extinction
debt.
Waagepetersen, R. P. (2007). An estimating function approach to inference for inhomogeneous Neyman–
Scott processes. Biometrics, 63(1), 252-258.
Webb, C. O., and Donoghue, M. J. (2005). Phylomatic: tree assembly for applied
phylogenetics. Molecular Ecology Notes, 5(1), 181-183.
Webb, C. O., Ackerly, D. D., and Kembel, S. W. (2008). Phylocom: software for the analysis of
phylogenetic community structure and trait evolution.Bioinformatics, 24(18), 2098-2100.
Wiegand, T., and Moloney, K. A. (2013). Handbook of spatial point-pattern analysis in ecology. CRC
Press.
Wiegand, T., Gunatilleke, C. S., Gunatilleke, I. N., and Huth, A. (2007). How individual species structure
diversity in tropical forests. Proceedings of the National Academy of Sciences, 104(48), 19029-
19033.
Wikström, N., Savolainen, V., and Chase, M. W. (2001). Evolution of the angiosperms: calibrating the
family tree. Proceedings of the Royal Society of London B: Biological Sciences, 268(1482), 2211-
2220.
Yang, J., Swenson, N. G., Cao, M., Chuyong, G. B., Ewango, C. E., Howe, R., ... and Lin, L. (2013). A
phylogenetic perspective on the individual species-area relationship in temperate and tropical tree
communities.

Diversidad funcional y filogenética en los Bosques Secos del Sur del Ecuador
144
Appendice 1
Table.1: Gof u values of the different models fitted to each species IPCP: inhomogeneous
Poisson cluster process; IPP: inhomogeneous Poisson process.
Species Best model value-u
24. Armatocereus cartwrightianus IPCP 94235537
25. Bursera graveolens IPCP 5847679
26. Caesalpinia glabrata IPCP 31586555
27. Coccoloba ruiziana IPCP 65851604
28. Colicodendron scabridum IPCP 983903.6
29. Cordia.lutea IPCP 506813760
30. Croton rivinifolius IPCP 12895271
31. Erythrina.velutina IPCP 107762648
32. Erythroxylum.glaucum IPCP 4196608
33. Geoffroea.spinosa IPCP 6905221
34. Leucaena.trichodes IPCP 12515970
35. Malphigia.emarginata IPCP 5186331
36. Piptadenia.flava IPCP 15047050
37. Tabebuia.chrysantha IPCP 13088950
38. Achatocarpus.pubescens IPP 94235537
39. Chloroleucon.mangense IPP 8431424
40. Cochlospermum.vitifolium IPP 991187.5
41. Cynophalla.mollis IPP 1461603
42. Eriotheca.ruizii IPP 3137833
43. Jacquinia.sprucei IPP 56464279
44. Pisonia.aculeata IPP 72624176

Diversidad funcional y filogenética en los Bosques Secos del Sur del Ecuador
145
45. Pithecellobium.excelsum IPP 11102231
46. Tabebuia.billbergii IPP 965215.2

Diversidad funcional y filogenética en los Bosques Secos del Sur del Ecuador
146

Diversidad funcional y filogenética en los Bosques Secos del Sur del Ecuador
147
CONCLUSIONES GENERALES

Diversidad funcional y filogenética en los Bosques Secos del Sur del Ecuador
148

Diversidad funcional y filogenética en los Bosques Secos del Sur del Ecuador
149
Los resultados obtenidos en la presente investigación han permitido dilucidar algunos
procesos de ensamble de la comunidad de los bosques tropicales estacionalmente secos, a
partir de los cuales se extraen las siguientes conclusiones generales:
Confirmamos la influencia tanto de filtrado de hábitat y el limite de similitud en el
ensamble de la comunidad de los bosques secos Tumbesinos. Nuestros resultados
encontraron que los valores de los rasgo a través del gradiente de precipitación es
consistente con la idea de filtrado de habitat. Los resultados del análisis de
correlación sugieren que en los sitios más secos, la estrategia funcional consiste en
alta SLA, alta WD, alta y baja Hmax SM. Se confirmó que el gradiente también
modifica la fuerza de la similitud limitante y los procesos de filtrado hábitat, con una
escasez de las estrategias funcionales permitidos (es decir, una disminución de la
gama de valores del rasgo) y un aumento de los efectos de la competencia (a más
distribución de los valores de rasgo), para la mayoría de los rasgos, cuando las
condiciones se vuelven más seco. Estos hallazgos son muy interesantes desde el
punto de vista funcional de las interacciones de las especies, que pueden ser usados
para el manejo y conservación de estos bosques.
Si bien estos resultados son consistentes con lo propuesto para los bosques
secos tropicales, donde se evidencia baja diversidad funcional en sitios que están
sometidos a mayor estrés sugiriendo evidencias de filtrado de hábitat en los valores
tomados por la mayoría de los rasgos a lo largo del gradiente de estrés (medido como
CWN), hay evidencia de que la diversidad funcional se movió a lo largo del

Diversidad funcional y filogenética en los Bosques Secos del Sur del Ecuador
150
gradiente ambiental fue encontrado por cualquier rasgo excepto por el tamaño de la
hoja. Esta variación en el tamaño de la hoja es mediada por una transición del tamaño
de la hoja, es decir hojas grandes, tipico de hojas caducas, delgadas, y hojas pequeñas
con mayor espesor de especies perennes.
Un enfoque actualemente utilizado es medir como si la dispersion de los rasgos estan
relacionados con la escala especial, nuestros resultados demuestran que
funcionalmente las especies son mas similares en escalas espaciales pequeñas,
indicando la importancia de filtrados abióticos. Es decir las condiciones abióticas
locales permite la coexistencia de sólo un subconjunto funcional en la piscina de
especie. Los resultados también apoyan la hipótesis de que las especies se encuentran
filogenéticamente mas agrupadas a escalas pequeñas es decir son filogenéticamente
mas similares y que a escalas superiores este comportamiento cambia siendo mas
distinta de los esperado por el azar.
Utilizamos un nuevo enfoque metodológico mediante el análisis de las dimensiones
alternativas de la biodiversidad, como la diversidad funcional y filogenética, para
entender la co-ocurrencia de especies en diversos ensambles. Estos resultados
sugieren que algunas especies mostraron un comportamiento diferente a las
interacciones planta-planta, donde las interacciones abióticas y medio ambiente
también son importantes en la asamblea de la comunidad en los niveles funcionales y
filogenéticos. En particular, hemos demostrado que la distribución filogenética y
funcional de algunas especies son acumuladores y repelentes en este bosque seco es

Diversidad funcional y filogenética en los Bosques Secos del Sur del Ecuador
151
no aleatoria que indica la importancia de los rasgos funcionales y la historia evolutiva
pasado en el dictado de las interacciones ecológicas que actualmente observamos.

152

153
AGRADECIMIENTOS
Durante estos años tengo mucho que agradecer a mucha gente! Muchos han puesto su granito de
arena en esta tesis de manera muy distinta.
"Un grano no hace un granero, pero ayuda al compañero".
A mis Padres quienes han sido mi más grande fortaleza, a mis queridos herman@s Diani, Joha,
Pame, Angel, mis sobrinos Patricio y Angelito y a mi cuñada Jessenia que es como una hermana,
gracias por ese apoyo incondicional e invaluable en las largas jornadas de campo y laboratorio,
por todos los sacrificios que han hecho para que yo realice mis estudios.
A mis directores de tesis Adrián y Marcelino, sin ustedes esta tesis, nunca habría sido posible.
Adrian, mil gracias por apoyarme y dedicarle tanto tiempo e ilusión a esta tesis! Eres un
excelente investigador y sobre todo una persona increible.
Marcelino, muchas gracias por haberme permitido hacer la tesis contigo, por tu paciencia e
ilusión durante todos estos años eres lo máximo.
Gracias a los dos por meterme de lleno en el mundo de la ciencia.
A mis compañeros del Departamento de Ciencias Naturales, especialmente a Carlos Iván quien
ha sido un pilar fundamental en el desarrollo de mi tesis, a Pablo Ramón y David Duncan
quienes me apoyaron en mis dudas estadísticas, Angel B., Anita A., Diego G, Dalton Q., Jorge
A., Andrea J., José R, Ramiro M, Bayo y Rosita quienes me apoyaron en alguna fase de mi tesis

154
y en mis estancias en Madrid … A Aran Luzuriga quien me ayudo como revisora de algunos
capítulos de mi tesis… A María Belen amiga incondicional.
La realización de esta tesis fue apoyada parcialmente por los proyectos A/024796/09 y
A/030244/10 de la Agencia Española de Cooperación Internacional y para el Desarrollo
(AECID) y el proyecto Islas-Espacio CGL2009-13190-C03-02 del Ministerio de Ciencia e
Innovación. A la beca doctoral SENESCYT 2009. A los proyectos internos de la UTPL,
PROY_CCNN 0030; PROY_CCNN 1260; PROY_CCNN 1054.
GRACIAS A TODOS
Eli Gusmán M.

155