Divergent trends of alcohol consumption and harm – A case of polarization among Swedish youth?
25
Divergent trends of alcohol consumption and harm – A case of polarization among Swedish youth? Johan Svensson Presentation at the nordic alcohol and drug researchers’ assembly, Copenhagen, August 27 – 29, 2012
-
Upload
ignacia-price -
Category
Documents
-
view
15 -
download
0
description
Divergent trends of alcohol consumption and harm – A case of polarization among Swedish youth?. Johan Svensson Presentation at the nordic alcohol and drug researchers’ assembly, Copenhagen, August 27 – 29, 2012. - PowerPoint PPT Presentation
Transcript of Divergent trends of alcohol consumption and harm – A case of polarization among Swedish youth?

Divergent trends of alcohol consumption and harm – A case of polarization among Swedish youth?
Johan Svensson
Presentation at the nordic alcohol and drug researchers’ assembly, Copenhagen, August 27 – 29, 2012

Average consumption of alcohol (100%), girls and boys in grade 9 (age 15-16) and alcohol related hospital admissions (age 15-19) in Sweden, 2000 - 2010
0
10
20
30
40
50
60
0
50
100
150
200
250
2000 2001 2002 2003 2004 2005 2006 2007 2008 2009 2010
Ave
rag
e c
on
sum
pti
on
(d
l 10
0%)
Ho
psi
tal
ad
mis
sio
ns/
100.
000
(alc
oh
ol
in
de
x)
Hospital adm (Boys) Hospital adm (Girls) Avg. Cons. (Boys) Avg. Cons.(Girls)

Background
These divergent trends are not expected and raise questions on the association among youth between:
1, Average consumption and heavy drinking?
2, Average consumption and harm?
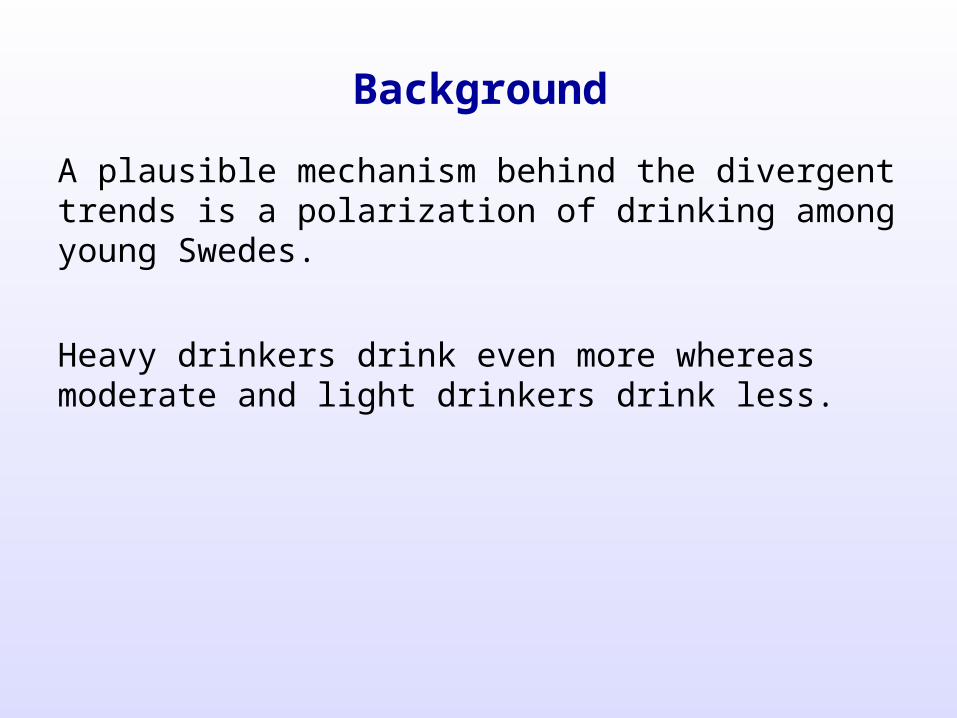
A plausible mechanism behind the divergent trends is a polarization of drinking among young Swedes.
Heavy drinkers drink even more whereas moderate and light drinkers drink less.
Background
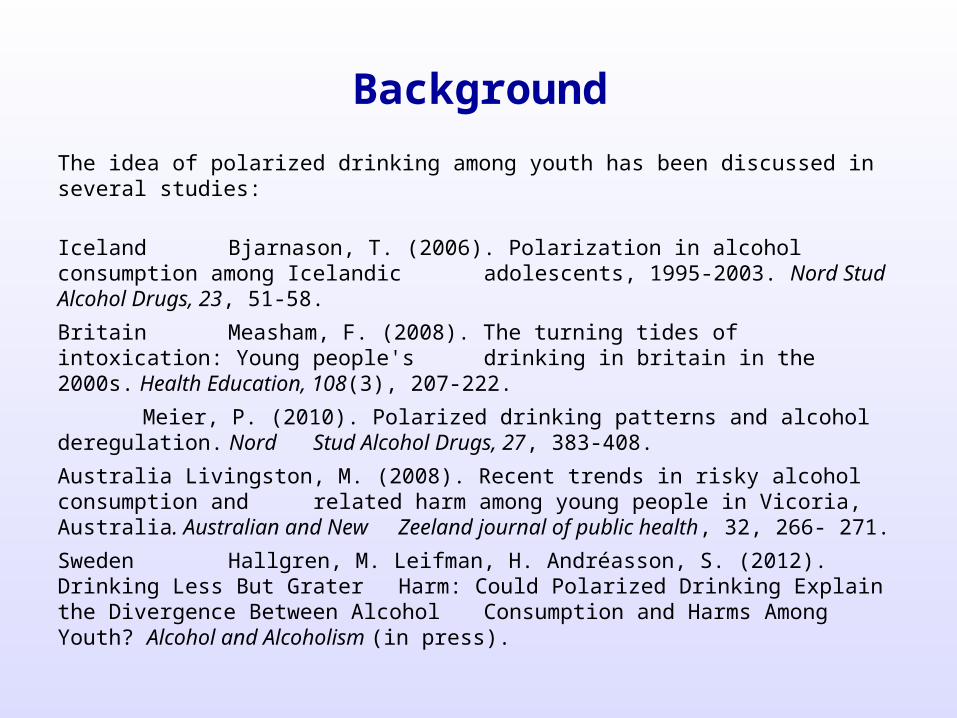
The idea of polarized drinking among youth has been discussed in several studies:
Iceland Bjarnason, T. (2006). Polarization in alcohol consumption among Icelandic adolescents, 1995-2003. Nord Stud Alcohol Drugs, 23, 51-58.
Britain Measham, F. (2008). The turning tides of intoxication: Young people's drinking in britain in the 2000s. Health Education, 108(3), 207-222.
Meier, P. (2010). Polarized drinking patterns and alcohol deregulation. Nord Stud Alcohol Drugs, 27, 383-408.
Australia Livingston, M. (2008). Recent trends in risky alcohol consumption and related harm among young people in Vicoria, Australia. Australian and New Zeeland journal of public health, 32, 266- 271.
Sweden Hallgren, M. Leifman, H. Andréasson, S. (2012). Drinking Less But Grater Harm: Could Polarized Drinking Explain the Divergence Between Alcohol Consumption and Harms Among Youth? Alcohol and Alcoholism (in press).
Background

Aim: To test whether there are signs of a shift in the distribution of drinking among grade 9 pupils in Sweden during the period 2000-2010.

Data and methodsData: Annual school surveys conducted by CAN
Number of respondents varies from app. 4.900 – 5.300 each year.
Age: grade 9 pupils (age 15-16)
Analysis: To test the polarization hypothesis:
For each year the consumers were split into 20 equally large groups (each group representing 5% of the consumers). (Ranked 20=highest consumption, 1=lowest consumption
Mean consumption was used to test for signs of a shift in the distribution.
In this presentation comparison is made between the first two years (2000 and 2001) and the last two years (2009 and 2010).
Preliminary analysis!

Long-term trends in average consumption and abstainers in Swedenboys and girls (grade 9 age 15-16), 1989-2010 (CAN-data)

A case of polarization?

Trends in average consumption in different consumer groups, boys (grade 9), 2000-2010 (CAN-data)
Cons. groups
Year2000
2001
2002
2003
2004
2005
2006
2007
2008
2009
2010
Diff.00/01-09/10
Diff.%
20 39,32 38,88 39,22 36,75 37,66 41,47 43,19 42,49 42,11 45,14 39,88 3,41** 919 17,87 17,37 15,98 15,45 15,22 16,17 19,37 18,94 17,74 19,81 15,56 0,06 -18 11,05 11,25 10,28 9,15 9,80 10,14 10,95 11,32 11,38 11,51 9,33 -0,73** -7 16 6,01 6,04 5,32 4,68 5,39 5,22 5,53 5,70 5,76 5,42 4,63 -1,00** -1714 3,58 3,60 3,07 2,69 3,11 2,83 3,19 3,23 3,24 3,14 2,56 -0,74** -2112 2,11 2,17 1,76 1,50 1,70 1,53 1,73 1,79 1,80 1,67 1,43 -0,6** -2810 1,17 1,21 1,00 0,82 0,88 0,80 0,88 1,00 0,91 0,90 0,79 -0,35** -298 0,59 0,65 0,52 0,42 0,43 0,38 0,45 0,49 0,42 0,46 0,38 -0,2** -326 0,27 0,29 0,21 0,19 0,18 0,16 0,19 0,20 0,18 0,19 0,18 -0,1** -34
1-5 0,07 0,07 0,06 0,05 0,05 0,04 0,04 0,05 0,05 0,05 0,05 -0,02 -26

Trends in average consumption in different consumer groups, girls (grade 9), 2000-2010 (CAN-data)
Cons. groups
Year2000
2001
2002
2003
2004
2005
2006
2007
2008
2009
2010
Diff.00/01-09/10
Diff.%
20 39,35 37,77 34,68 33,42 34,17 37,32 40,24 41,26 37,76 45,02 38,40 3,16** 819 17,41 17,89 16,28 14,93 15,28 17,13 18,62 19,78 18,24 20,10 14,91 -0,14** -118 10,85 11,36 10,29 9,28 9,74 9,88 10,72 11,18 11,09 11,51 9,40 -0,65** -6 16 5,95 6,06 5,22 4,67 5,36 5,14 5,42 5,53 5,76 5,28 4,66 -1,03** -1714 3,56 3,65 3,04 2,68 3,09 2,82 3,19 3,25 3,29 3,11 2,53 -0,78** -2212 2,12 2,15 1,78 1,50 1,64 1,53 1,71 1,75 1,78 1,70 1,43 -0,57** -2710 1,16 1,25 0,99 0,82 0,86 0,79 0,88 0,99 0,90 0,89 0,80 -0,36** -308 0,60 0,65 0,51 0,43 0,43 0,37 0,45 0,49 0,42 0,45 0,38 -0,21** -336 0,27 0,29 0,22 0,18 0,18 0,16 0,19 0,21 0,19 0,20 0,18 -0,09** -32
1-5 0,06 0,07 0,05 0,05 0,04 0,04 0,05 0,05 0,04 0,05 0,04 -0,02 -31

A case of polarization –
self-reported problems?

Trends in average number of self reported problems in different consumer groups, girls (grade 9), 2000-2010 (CAN-data)
Cons. groups
Year2000
2001
2002
2003
2004
2005
2006
2007
2008
2009
2010
Diff.00/01-09/10
Diff.%
20 9,98 11,52 11,29 10,46 11,75 11,45 15,98 12,39 10,98 13,08 14,13 2,85** 2719 7,99 9,29 8,06 9,52 9,09 7,57 9,28 10,96 10,49 10,40 12,44 2,78* 3218 9,08 7,70 6,86 6,73 8,27 7,38 9,32 9,35 9,51 9,32 10,38 1,46* 17 16 6,49 6,35 6,03 5,63 5,41 5,17 5,30 6,01 6,84 7,33 6,71 0,60 914 5,33 4,46 4,41 3,95 4,08 4,56 4,93 4,42 5,73 4,78 4,77 -0,12 -212 4,96 3,50 3,96 2,97 3,65 3,42 3,58 3,94 3,61 4,67 3,57 -0,11 -310 3,36 2,61 3,10 2,22 2,29 1,87 2,13 2,45 2,76 3,47 2,43 -0,04 -18 2,04 1,64 1,77 1,42 1,64 1,37 1,67 1,52 1,25 1,43 1,54 -0,36 -196 1,17 1,01 0,90 0,67 0,94 1,23 0,99 1,07 0,92 1,28 0,88 -0,01 -1
1-5 0,39 0,36 0,39 0,26 0,31 0,23 0,30 0,35 0,53 0,38 0,39 0,01 -3

Trends in average number of self reported problems in different consumer groups, boys (grade 9), 2000-2010 (CAN-data)
Cons. groups
Year2000
2001
2002
2003
2004
2005
2006
2007
2008
2009
2010
Diff.00/01-09/10
Diff.%
20 8,66 10,41 10,79 10,13 11,68 11,51 13,42 12,58 12,03 11,99 13,36 3,14*** 3319 5,45 6,57 6,83 5,45 5,82 5,80 6,78 6,56 6,99 7,67 6,66 1,15* 1918 4,76 5,36 5,66 5,58 4,08 5,79 5,36 4,98 4,94 6,43 5,88 1,10** 22 16 4,13 3,94 3,91 2,52 3,89 4,01 2,97 3,72 3,62 4,27 4,33 0,27 714 2,63 3,25 3,06 2,16 2,22 2,71 2,38 2,23 3,16 3,33 2,13 -0,21 -712 2,19 1,91 2,35 2,19 1,48 1,48 1,70 1,76 1,83 2,25 2,57 0,36 1810 1,36 1,19 1,35 1,68 1,40 1,04 0,73 1,06 1,68 1,47 1,60 0,26 208 0,96 0,88 1,01 0,86 0,92 0,60 0,59 0,99 0,82 1,04 0,78 -0,01 -16 0,73 0,46 0,52 0,37 0,45 0,39 0,27 0,25 0,60 0,79 0,40 0,00 1
1-5 0,18 0,23 0,24 0,17 0,32 0,15 0,13 0,23 0,17 0,20 0,29 0,04 20

Trends in heavy episodic drinking (at least once a month) in different consumer groups, boys (grade 9), 2000-2010 (CAN-data)

Significant difference between 2000/2001 and 2009/2010 in heavy episodic drinking (at least once a month) in different consumer groups, boys (grade 9),
2000-2010 (CAN-data)
0
10
20
30
40
50
60
70
80
90
100
2000 2001 2002 2003 2004 2005 2006 2007 2008 2009 2010
Hea
vy e
psio
dic
drin
king
%
16 All other groups

Trends in heavy episodic drinking (at least once a month) in different consumer groups, girls (grade 9), 2000-2010 (CAN-data)

Significant difference between 2000/2001 and 2009/2010 in heavy episodic drinking (at least once a month) in different consumer groups, girls (grade 9),
2000-2010 (CAN-data)
0
10
20
30
40
50
60
70
80
90
100
2000 2001 2002 2003 2004 2005 2006 2007 2008 2009 2010
Hea
vy e
psio
dic
drin
king
%
16 All other groups

…another example of a polarized trends among youth –
school grades and being qualified to apply for high school in Sweden

Trends in average grade and proportion of pupils qualified to apply for high school in Sweden (grade 9) 2002-2010 (The Swedish National Agency for Education)

ConclusionsPreliminary analysis suggest:•Rates of abstainers have increased during the period among both boys and girls, – further analysis needed!•Significant increase in consumption among the heaviest consumers (top 5%) both boys and girls.
…whereas other groups decreased their consumption
•Significant increase in average numbers of self-reported problems among the heaviest consumers (top 15%) both boys and girls.
…whereas other groups were stable•No significant increase in heavy episodic drinking among the heaviest consumers (top 15%) both boys and girls.
…whereas other groups experienced a decrease•Other areas of societal changes among youth may also have undergone similar divergent trends – common mechanisms?

Mange tak!
Mange tak!

Mange tak!

• Different period• Perhaps more marginlazied groups!• Overall the consumtion has gone down!