
Disruptive forces and new technologies: harnessing change ...
Upload
andrew-owitiCategory
view
32download
0
OCULUS PRIME
Disruptive ForcesPart One: Urbanization and its DisContents
Andrew L. Owiti
oculus prime Ltd
+254 (0) 708 377 699
+1 703 981 4201
[email protected] oculus prime
OCULUS PRIME
OCULUS PRIMEDisruptive ForcesPart One: Urbanization and its DisContents

OCULUS PRIMEIntroduction
oculus prime
OCULUS PRIME
OCULUS PRIME

OCULUS PRIME
OCULUS PRIME
OCULUS PRIMEKenya’s largest metropolitan area has grown at a rapid 4.4% p.a. pace since 1980
and, at 3.8 million inhabitants in 2014, was the 8th largest in Sub-Saharan Africa
Source: World Bank
Nairobi City Population, 1980 - 2014 Largest City Population by Country, 2014
Lagos 12.6
9.2
0.1
Lilongwe
Lusaka 2.1
2.5
Gaborone
Millions
Port Louis
Addis Ababa 3.2
Dakar Metro 3.4
Nairobi City 3.8
Dar es Salaam 4.8
Johannesberg Metro
0.9
Accra
0.3
1
9
14
16
10
40
45
29
8
3
6
SSA Rank
SSA Ave
0.0
2.0
4.0
2.5
0.5
3.5
1.5
3.0
4.5
1.0
1.7
+3.9%
+4.4%
3.8
20101995
Millions
1980
1.3
3.2
4.0
2.5
20052000
2.2
1990
0.9
1985
1.4
+3.9%
SSA Average
Kenya
Africa 11
oculus prime

OCULUS PRIME
OCULUS PRIME
OCULUS PRIME
0.5
2.1
3.5
3.5
3.7
3.9
4.0
4.4
4.8
4.9
5.7
Lusaka
Dar
Lagos
CAGR 2010-2014
Lilongwe
Accra
Addis
Joburg
Nairobi
Port Louis
Gaborone
Dakar
-0.4
2.1
2.5
2.9
3.6
3.6
3.7
3.9
4.0
4.8
5.5
CAGR 2000-2014
Port Louis
Addis
Gaborone
Accra
Joburg
Lilongwe
Dakar
Nairobi
Lagos
Dar
Lusaka
-0.3
2.2
3.0
3.1
3.2
3.8
3.8
4.1
4.4
4.8
5.2
Joburg
Addis
Lilongwe
Gaborone
CAGR 1980-2014
Dakar
Lusaka
Nairobi
Lagos
Dar
Accra
Port Louis
While Nairobi’s growth has stabilized at 3.9% p.a., of her peer cities, Dar es
Salaam has grown the fastest since 1980, since 2000 as well as this decade
Population Growth, 1980 - 2014
4
8
23
25
26
37
40
9
20
11
15
SSA Rank (48)
SSA
Population Growth, 2000 - 2014 Population Growth, 2010 - 2014
3
13
8
21
18
10
32
30
35
26
40
41
25
19
8
4
22
37
41
34
28
23
SSA Rank (48)SSA Rank (48)
SSA
SSA
Source: World Bank; Oculus Prime Analysis oculus prime

OCULUS PRIME
OCULUS PRIME
OCULUS PRIMEStill, the growth of Nairobi, nearly doubling since 2000 and projected to
triple by 2030 (from 2000), is perfectly in line with SSA trends
SSA Growth of Largest City, 2000-2030
Fastest Growing Cities
between 2000 and 2030
Source: World Bank; Oculus Prime Analysis
Projected to triple in size
between 2000 and 2030
Cities that doubled in size
between 2000 and 2015
0.0
0.5
1.0
1.5
2.0
2.5
3.0
0.0 0.5 1.0 1.5 2.0 2.5 3.0 3.5 4.0 4.5 5.0 5.5 6.0 6.5 7.0 7.5 8.0 8.5 9.0
Harare
SSA Average
Lusaka
Luanda
World
OECD members
Dakar
Kigali
Lagos
Maputo
Gaborone
Bujumbura
Yaounde
Ouagadougou
Khartoum
Dar es Salaam
Juba
MogadishuJohannesburg
2015 Population/2000 Population
2030 Population/2000 Population
Accra
Abdijan
Addis Ababa
Kinsasha
Lilongwe
Nairobi
Port Louis
Bamako
oculus prime
OCULUS PRIME
OCULUS PRIME
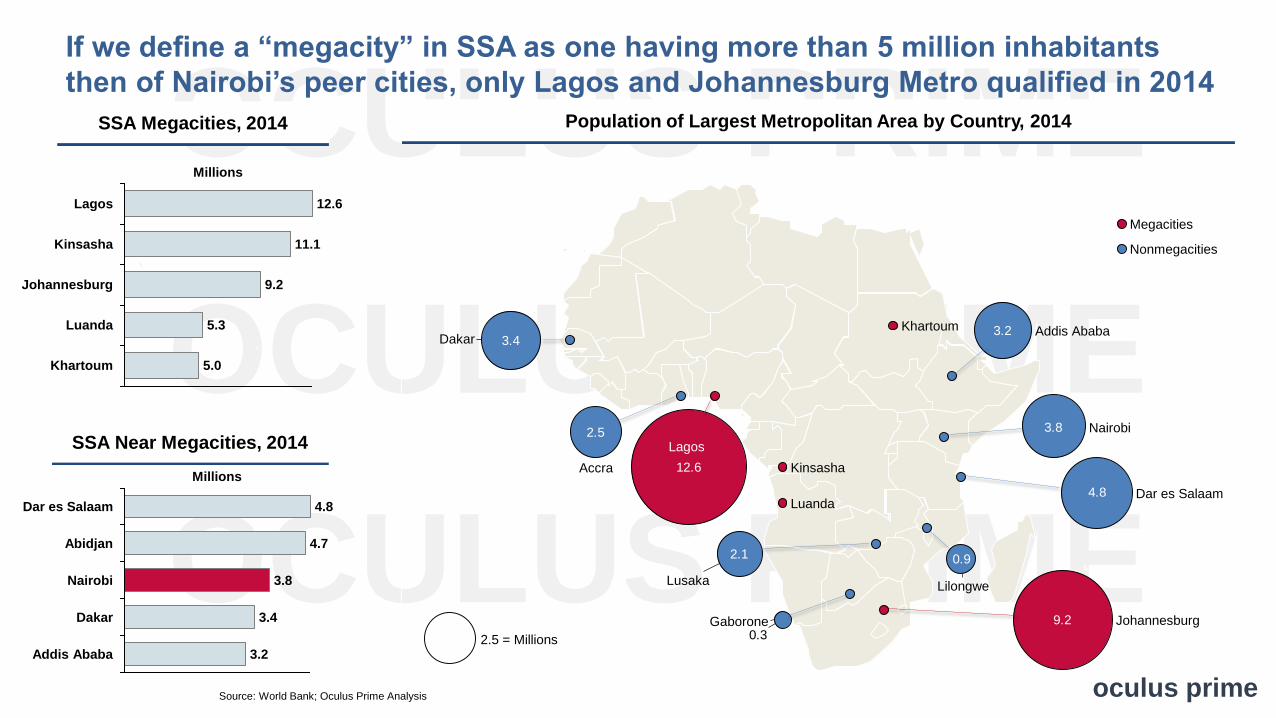
OCULUS PRIMEIf we define a “megacity” in SSA as one having more than 5 million inhabitants
then of Nairobi’s peer cities, only Lagos and Johannesburg Metro qualified in 2014
Population of Largest Metropolitan Area by Country, 2014
2.5 = Millions
2.1
0.3
3.4
2.5
12.6
9.2
0.9
4.8
3.8
3.2
Nonmegacities
Lusaka
Gaborone
Kinsasha
Megacities
KhartoumDakar
Luanda
Accra
Nairobi
Dar es Salaam
Lilongwe
Johannesburg
Lagos
Addis Ababa
Millions
Luanda
Johannesburg
Kinsasha 11.1
Khartoum
Lagos 12.6
5.0
5.3
9.2
SSA Megacities, 2014
SSA Near Megacities, 2014
3.2
4.8
Addis Ababa
Nairobi
Millions
Dakar
3.8
3.4
Abidjan 4.7
Dar es Salaam
Source: World Bank; Oculus Prime Analysis oculus prime

OCULUS PRIME
OCULUS PRIME
OCULUS PRIME
2000 2005 2010 2015 2020 2025 2030
6
4
12
22
8
14
24
0
18
20
16
10
2
Nairobi
Port Louis
Lusaka
Dakar
SSA Average
Lilongwe
Dar es Salaam
Johannesburg
Lagos
Africa 11
4.73 Addis Ababa
15.94
Accra
Gaborone
6.92
5.72
3.913.24
23.64
2.682.21
But if Nairobi keeps growing at ~ 4% p.a., Nairobi’s population will be
close to 7 million in 2030 – almost doubling in size in just 15 years
Largest City Population by Country, 2000 - 2030
MillionsSSA Rank 2030
25
15
3
16
40
1
17
Projected estimates:
Assuming last 5 years pace continues
12
4
41
11
Source: World Bank; Oculus Prime Analysis oculus prime

OCULUS PRIME
OCULUS PRIME
OCULUS PRIMEAt these rates, by 2030 not only Nairobi, but Dar es Salaam, Accra and Dakar will join
Lagos, Johannesburg and nine others as SSA megacities; Nairobi and Dar by 2022
Population of Largest Metropolitan Area by Country, 2030
5 = Millions
4.4
0.5
6.1
5.2
23.6
16.0
1.7
11.8
6.9
4.4
Nairobi
Addis Ababa
Luanda
Khartoum
Kinsasha
Gaborone
Lusaka
Dakar
Dar es Salaam
Johannesburg
Lilongwe
Lagos
Accra
Nonmegacities
Ouagadougou
Antananarivo
Ibadan
KanoBamako
Yaoundé
AbidjanMogadishu
Megacities
Johannesburg 15.9
Kinsasha 21.9
Lagos
6.9
7.0
6.1
Khartoum
Yaoundé
Antananarivo
7.5
Nairobi
5.7
Millions
5.2Accra
5.5
Dakar
Bamako
8.3
Luanda 10.0
Mogadishu
Abidjan
8.0
Ouagadougou
7.8
Dar es Salaam 11.8
23.6
SSA Megacities, 2030
Source: World Bank;; Oculus Prime Analysis oculus prime

OCULUS PRIME
OCULUS PRIME
OCULUS PRIMEOf course, the challenges of rapid urbanization are many, varied and have
been well documented…
Housing Shortage (Kibera, Nairobi) Hygiene & Health (Malawi) Traffic (Lagos)
Water Shortage (Harare) Crime (Lusaka) Pollution (Cairo)
Source: Press Search oculus prime

OCULUS PRIME
OCULUS PRIME
OCULUS PRIME…but the higher order effects of rapid urbanization that are less well documented
can also have drastic impacts on distant but connected societies
Source: Kenya 2009 Census
Busia County’s Yawning Gender Imbalance, 2010
Female (Kenya)
Male (Kenya)
Male
Female
Age Groups, years
Busia County, along with several other Counties in Kenya, experiences significant
gender imbalances at the onset of adulthood. There are around 25% more adult
women than men in Busia. The men leave for Nairobi and they don’t come back! The
implications for family structure and cohesion, local economies etc. can be massive
oculus prime
0%
0%
+28%+33%
+1%
+29%+22%
-3%
+24%+27%
+26%+28%+28%+28%
+24%
65--6940--44 60--6450--54 55--59 70--7410--14 15--19
+22%
25--2920--24
+20%
30--345--9 80+75--7945--4935--390--4

OCULUS PRIME
OCULUS PRIME
OCULUS PRIMEGDP
Urban Population % Total Population
Still, like it or not, urbanization and economic growth have a very strong and
positive correlation both in output and in consumption
GDP Growth vs. Urbanization, Selected Countries, 1960-2014
“There are no rich countries which aren’t urbanized..., there are urban countries which are not rich… [urbanization] seems
to be a necessary [though not sufficient] step [for economic development] ." Jonathan Woetzel –McKinsey Global Institute
S. Korea
India
Brazil
China
1960 2014
Source: World Bank; oculus prime

OCULUS PRIME
OCULUS PRIME
OCULUS PRIMEWhat does this mean for Nairobi?
Output
oculus prime

OCULUS PRIME
OCULUS PRIME
OCULUS PRIMEGreater Nairobi’s GDP stood at $13.6 Billion in 2014 and at current growth rates (almost
entirely driven by population growth) GDP will nearly double by 2030. If we assume national
productivity gains, Nairobi’s GDP could be as high as $31.2 Billion in 2030
Greater Nairobi GDP, 2000- 2030
24
8
26
0
22
20
4
14
18
12
2
16
10
6
Billions, USD
2010 2030
25.9
+4.1%
2020
13.6
20052000 2015
7.6
2025
Kiambu County
Nairobi County
Greater Nairobi GDP, 2000- 2030
5.4
1.5
3.9
GDP
Growth
Productivity
Growth
Population
Growth
4.2
0.33.9
Population
Growth
GDP
Growth
Productivity
Growth
Nairobi GDP Growth Breakdown, 2000-2015
Nairobi Productivity Gains
2000-2015
National Productivity Gains
2000-2015
Source: World Bank; Oculus Prime Analysis oculus prime
30
4
28
26
24
18
10
22
16
14
32
0
12
2
6
8
20
31.2
14.2
2010 202520152000
+5.4%
Billions, USD
2020 20302005
7.6
Nairobi County
Kiambu County
2015-2030 projections using
National Productivity Gains

OCULUS PRIME
OCULUS PRIME
OCULUS PRIMEIn context, in 2014 Nairobi’s GDP was larger than Namibia’s, almost as large as
Zimbabwe’s, and in 15 short years Nairobi’s economy could be larger than the
current size of ¾ of SSA countries. That’s the disruptive power of urbanization!
Source: World Bank
SSA GDP by Country (selected countries), 2014 SSA GDP by Country (selected countries), 2014
Kenya
Cameroon
Cote d’Ivoire
Greater Nairobi 2030
Angola
34.3
Namibia
32.1
Mozambique
60.9
31.2
Billions, current USD
138.4
Zimbabwe
Senegal
27.1
15.9
13.0
15.7
Uganda
14.2
27.0
Zambia
3
11
14
16
13
20
24
18
12
5
9
SSA Rank
SSA Ave
2.6
13.0
10.6
Zimbabwe
4.3
32.1
Greater Nairobi 2014
Namibia
Madagascar
13.6
Kenya
Angola
Malawi
14.2
60.9
Cote d’Ivoire
Cameroon
7.9Rwanda
138.4
34.3
Billions, current USD
Eritrea
SSA Ave
3
5
9
11
19
24
40
38
31
28
22
SSA Rank
oculus prime

OCULUS PRIME
OCULUS PRIME
OCULUS PRIME34.3
27.031.213.613.0
14.2
Cote D’Ivoire
Greater Nairobi 2014
Zimbabwe
Namibia
Greater Nairobi 2030 Uganda
Who are the people in charge of managing the challenges and opportunities of such
disruption in Greater Nairobi and in economies comparable in size to Greater Nairobi’s
economy in 2014 and in 2030? Patrick Chinamasa,
Minister of Finance
Adama Kone,
Minister of Economy & Finance
Calle Schlettwein,
Minister of Finance
Matia Kasaiija,
Minister of Finance, Planning &
Economic DevelopmentGregory Mwakanongo Mary Ndunge Nugli
Ministers of Finance & Economic Planning,
Kiambu County & Nairobi County
Source: World Bank; Oculus Prime research oculus prime

OCULUS PRIME
OCULUS PRIME
OCULUS PRIMEWhat does this mean for Nairobi?
Consumption
oculus prime

OCULUS PRIME
OCULUS PRIME
OCULUS PRIME10.6
4.9
Greater Nairobi 2010 Greater Nairobi 2030
At current growth rates, Greater Nairobi will have a population of 10.6 million by
2030, ~57% of whom will be between the earning and consuming ages of 20 and 64
Greater Nairobi Population Growth, 2010-2030
Source: Kenya Census 2009; Kiambu County Government; Oculus Prime Analysis
1
0
9
8
7
6
5
10
3
2
4
11
Millions
+3.9%
10.6
2030
4.9
20252020
7.3
20152010
Greater Nairobi (Nairobi County + Kiambu County)
2001000 300 400
454035
1510
2530
20
05
80
55
9590
100
75
50
6570
85
60
300 200 100400 0
Population, Thousands
800600 1.0004002000
5
1520
50
85
70
80
65
75
55
95
60
0
100
10
40
25
45
3530
90
600800 200 0400
Population, Thousands
Greater Nairobi Population Pyramid, 2010 Greater Nairobi Population Pyramid, 2030
Nairobi Male
Kiambu Male Nairobi Female
Kiambu Female Nairobi Male
Kiambu Male
Kiambu Female
Nairobi Female
1.45 M 1.34 M 3.13 M 2.91 M
oculus prime
OCULUS PRIME
OCULUS PRIME
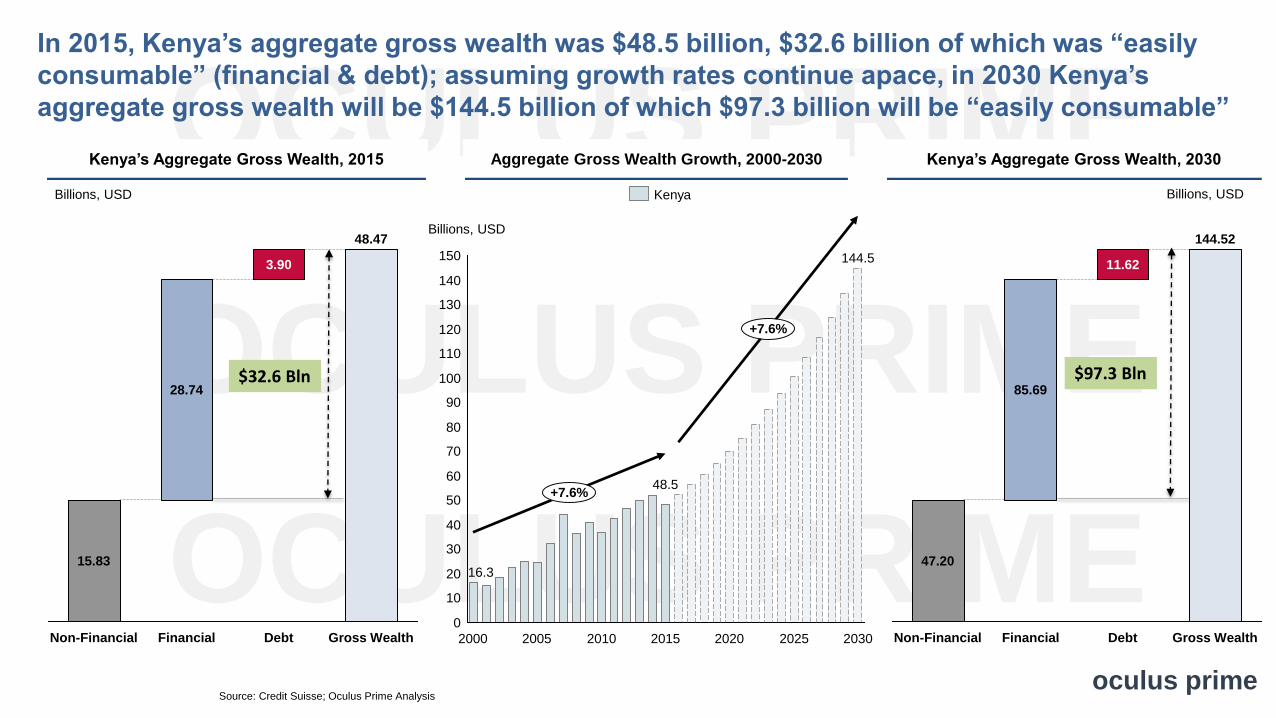
OCULUS PRIMEIn 2015, Kenya’s aggregate gross wealth was $48.5 billion, $32.6 billion of which was “easily
consumable” (financial & debt); assuming growth rates continue apace, in 2030 Kenya’s
aggregate gross wealth will be $144.5 billion of which $97.3 billion will be “easily consumable”
Kenya’s Aggregate Gross Wealth, 2015
Debt
3.90
FinancialNon-Financial Gross Wealth
48.47
15.83
28.74
10
50
70
150
90
100
130
80
120
60
40
110
30
140
20
0
+7.6%
+7.6%
Billions, USD
2000 2020 20302025
48.5
20152010
144.5
2005
16.3
Financial Debt
11.62
47.20
Non-Financial Gross Wealth
85.69
144.52
Kenya’s Aggregate Gross Wealth, 2030Aggregate Gross Wealth Growth, 2000-2030
Billions, USD Billions, USD
$32.6 Bln $97.3 Bln
Kenya
Source: Credit Suisse; Oculus Prime Analysis oculus prime

OCULUS PRIME
OCULUS PRIME
OCULUS PRIME
Narok
33.9%
Kisumu
Uasin Gishu
Mombasa
Nakuru
Nyeri
Other Counties
Machakos
Kajiado
Nairobi
Kiambu
6.2%
If aggregate wealth at the sub-national level breaks down as it does for sub-national
revenues, then in 2015 Greater Nairobi’s aggregate wealth (~40% of Kenya) was
around $19.5 billion and could be as high as $58 billion in 2030
Source: Government of Kenya Office of the Controller of the Budget; Credit Suisse; Oculus Prime Analysis
County Revenues % Total, 2014/2015
60
55
40
45
50
15
10
20
0
25
5
30
35
2030
14.8
2005
58.0
2000
+7.6%
Millions
9.0
2025
3.0
+7.6%
49.0
6.5
19.5
2010 2015 2020
16.4
Kiambu County
Nairobi County
Greater Nairobi Aggregate Wealth, 20000-2030
oculus prime

OCULUS PRIME
OCULUS PRIME
OCULUS PRIMEUtilities
Transport
Consumable Wealth
27.7%Rent
55.5%
4.2%
12.6%
Which implies $13.1 billion was available to Greater Nairobians in financial and debt form,
of which $7.3 billion was available for consumption of “non-fixed” goods and services
Source: Credit Suisse;Numbeo; Oculus Prime Analysis
Greater Nairobi Aggregate Wealth Breakdown, 2015 Greater Nairobi Average Expenses, 2015
11.5
1.6
FinancialDebt Non-FinancialTotal
19.5
6.4
$13.1 Bln
7.3
2015
Consumable Wealth, 2015
Billions, USD Billions, USD
oculus prime
Wealth available for food,
clothing, entertainment,
electronics, vacations etc.
OCULUS PRIME
OCULUS PRIME
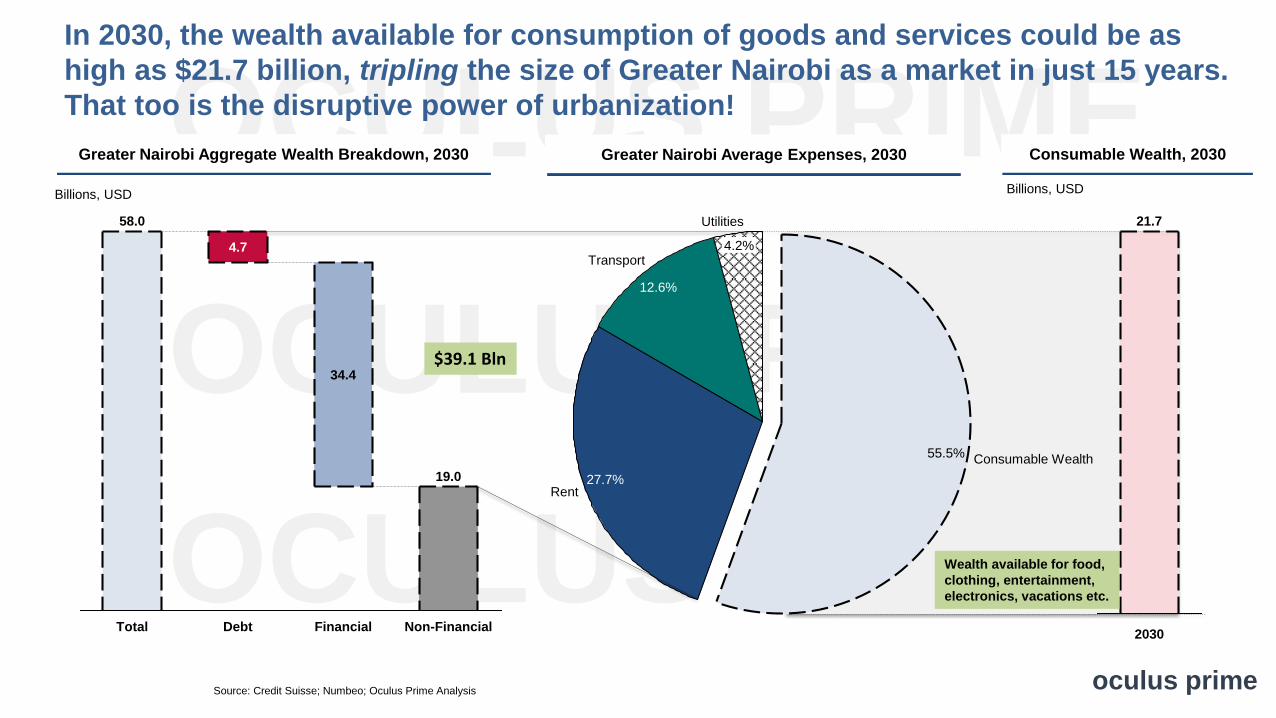
OCULUS PRIME12.6%
Consumable Wealth55.5%
4.2%
27.7%Rent
Utilities
Transport
In 2030, the wealth available for consumption of goods and services could be as
high as $21.7 billion, tripling the size of Greater Nairobi as a market in just 15 years.
That too is the disruptive power of urbanization!
Greater Nairobi Aggregate Wealth Breakdown, 2030 Greater Nairobi Average Expenses, 2030
58.0
34.4
4.7
Non-Financial
19.0
Debt FinancialTotal
$39.1 Bln
2030
21.7
Consumable Wealth, 2030
Billions, USD Billions, USD
Source: Credit Suisse; Numbeo; Oculus Prime Analysis oculus prime
Wealth available for food,
clothing, entertainment,
electronics, vacations etc.

OCULUS PRIME
OCULUS PRIME
OCULUS PRIME
Conclusion
oculus prime

OCULUS PRIME
OCULUS PRIME
OCULUS PRIME
Urbanization is a very powerful disruptive force that can bestow upon megacities the
economic heft of entire nations and can conjure up massive new markets before our
very eyes… And it is happening right now in Kenya and all over Sub-Saharan Africa!
GDP Greater Nairobi vs. Selected Countries, 2000-2014
2006
20
2009
8
28
26
6
18
14
4
2011
2
16
12
0
2013 2014201220102008
10
24
2007
22
200520042003200220012000
27.0
Zimbabwe
Mozambique
Rwanda
Namibia
Greater Nairobi
7.9
13.6
Mauritius
Senegal
Uganda
Greater Nairobi GDP & Market Size, 2015-2030
Billions, USD Billions, USD
x3
2.2
Source: World Bank; Credit Suisse; Numbeo; Oculus Prime Analysis oculus prime
31.2
Market Size 2015
21.7
Market Size 2030
7.3
GDP 2030
GDP 2015
Greater Nairobi
14.2