
Disruptive Forces Impacting the Real Estate Industry
25
Disruptive Forces Impacting The Real Estate Industry
-
Upload
houston-association-of-realtors -
Category
Real Estate
-
view
605 -
download
2
Transcript of Disruptive Forces Impacting the Real Estate Industry

Disruptive Forces Impacting The
Real Estate Industry

Disruptive Forces
207 Cities 45 Countries
33,000 Cities 192 Countries
1 Million Listings
100 Million Consumers 103,000 Premier Agents
31,000 Restaurants
62 Million Subscribers
+50 Million Users

Disruptive Forces Impacting The
Real Estate Industry
1 Regulatory Pressures
2 Wall Street Influence
3 Internal Forces –
Organized Real Estate
4 Market Forces – The Portals
5 Changing Consumer Demands
& Agent Behaviors
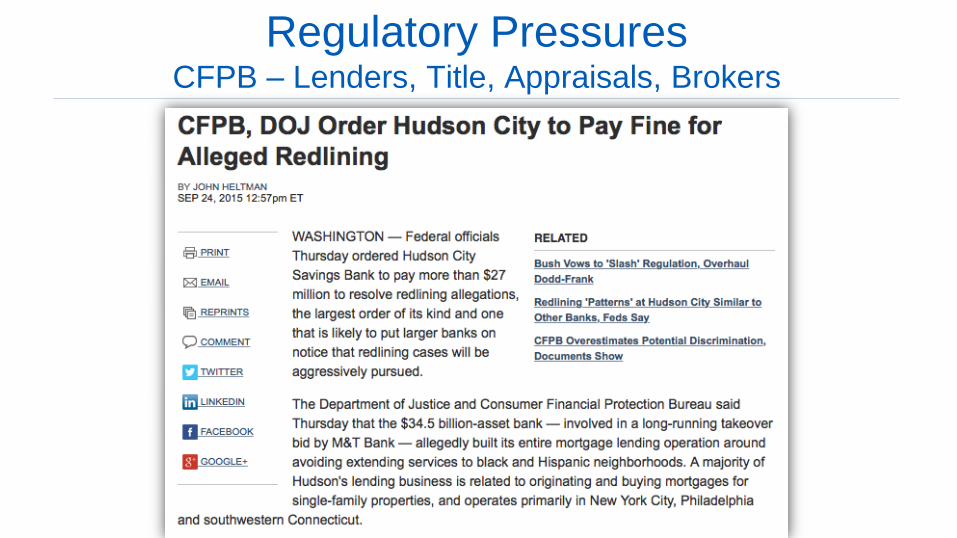
Regulatory Pressures CFPB – Lenders, Title, Appraisals, Brokers

Regulatory Pressures Employee VS. Independent Contractor

Profitable
Accountable
Innovative
Wall Street
Influences $450M $7.3B
$4.9B $5.6B
$318B
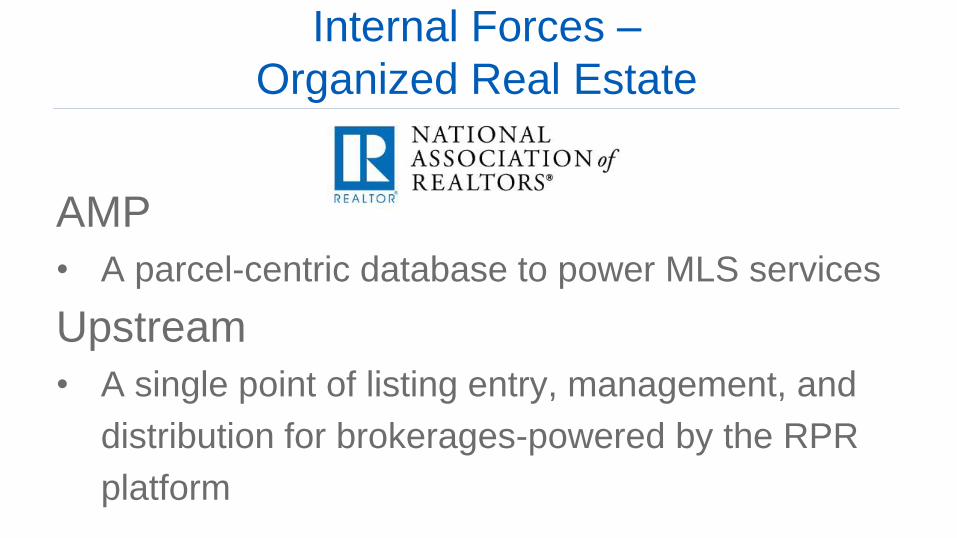
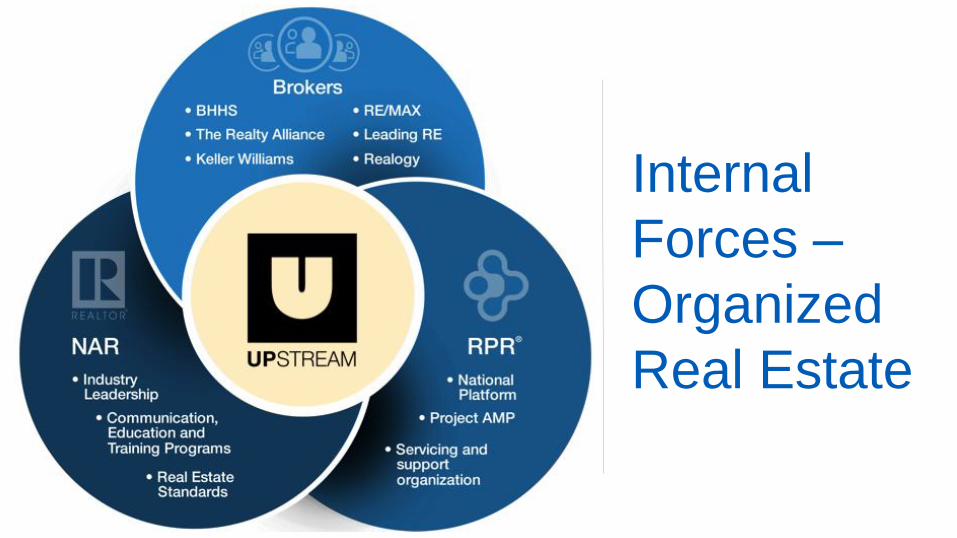
Internal Forces –
Organized Real Estate
AMP
• A parcel-centric database to power MLS services
Upstream
• A single point of listing entry, management, and
distribution for brokerages-powered by the RPR
platform
Internal
Forces –
Organized
Real Estate

Internal Forces – Organized Real Estate
NAR Core Standards
MLS Consolidation

Internal Forces – Broker Public Portal

Market Forces – The Portals Combined $150,000,000 Advertising Impact
realtor.com The Zillow Group

Market Forces – The Portals
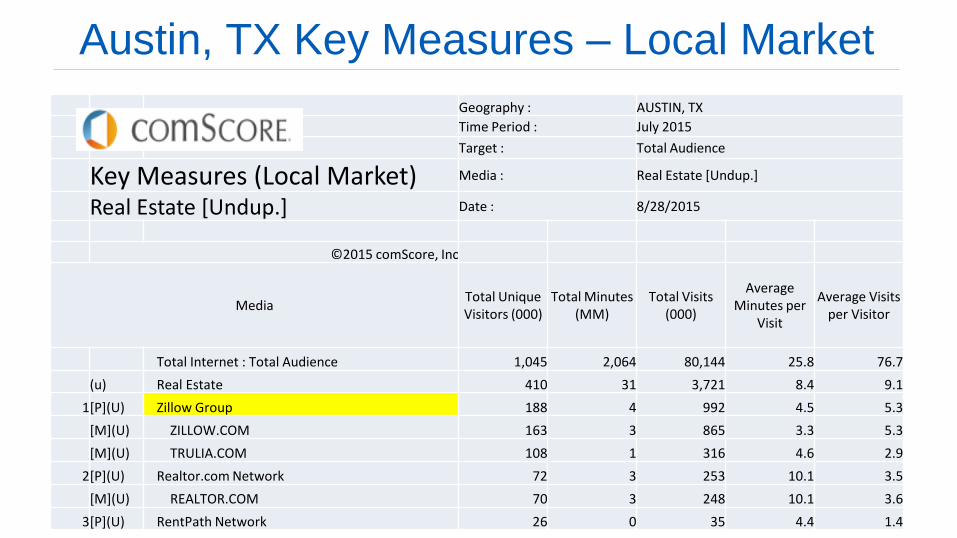
Austin, TX Key Measures – Local Market
Geography : AUSTIN, TX
Time Period : July 2015
Target : Total Audience
Key Measures (Local Market) Media : Real Estate [Undup.]
Real Estate [Undup.] Date : 8/28/2015
©2015 comScore, Inc
Media Total Unique Visitors (000)
Total Minutes (MM)
Total Visits (000)
Average Minutes per
Visit
Average Visits per Visitor
Total Internet : Total Audience 1,045 2,064 80,144 25.8 76.7
(u) Real Estate 410 31 3,721 8.4 9.1
1 [P](U) Zillow Group 188 4 992 4.5 5.3
[M](U) ZILLOW.COM 163 3 865 3.3 5.3
[M](U) TRULIA.COM 108 1 316 4.6 2.9
2 [P](U) Realtor.com Network 72 3 253 10.1 3.5
[M](U) REALTOR.COM 70 3 248 10.1 3.6
3 [P](U) RentPath Network 26 0 35 4.4 1.4
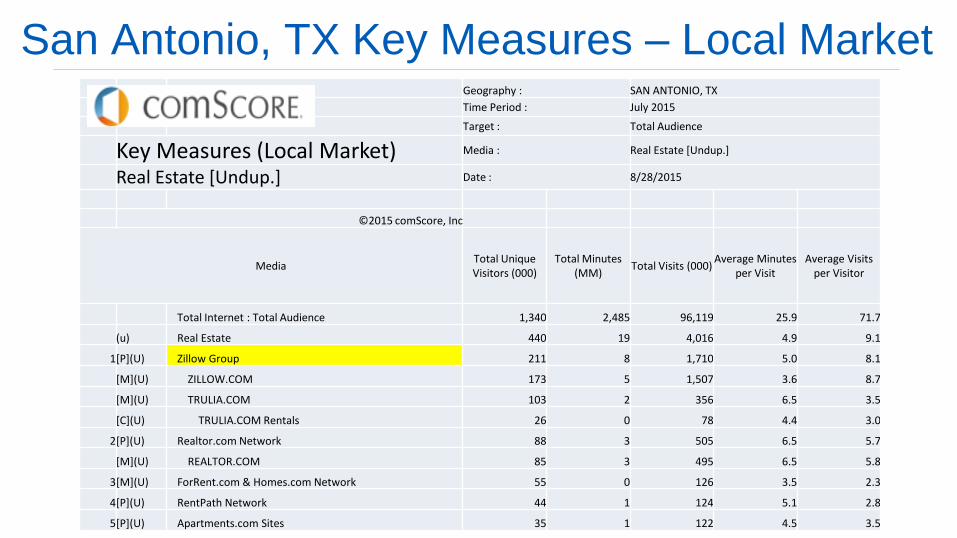
San Antonio, TX Key Measures – Local Market Geography : SAN ANTONIO, TX
Time Period : July 2015
Target : Total Audience
Key Measures (Local Market) Media : Real Estate [Undup.]
Real Estate [Undup.] Date : 8/28/2015
©2015 comScore, Inc
Media Total Unique Visitors (000)
Total Minutes (MM)
Total Visits (000) Average Minutes
per Visit Average Visits
per Visitor
Total Internet : Total Audience 1,340 2,485 96,119 25.9 71.7
(u) Real Estate 440 19 4,016 4.9 9.1
1 [P](U) Zillow Group 211 8 1,710 5.0 8.1
[M](U) ZILLOW.COM 173 5 1,507 3.6 8.7
[M](U) TRULIA.COM 103 2 356 6.5 3.5
[C](U) TRULIA.COM Rentals 26 0 78 4.4 3.0
2 [P](U) Realtor.com Network 88 3 505 6.5 5.7
[M](U) REALTOR.COM 85 3 495 6.5 5.8
3 [M](U) ForRent.com & Homes.com Network 55 0 126 3.5 2.3
4 [P](U) RentPath Network 44 1 124 5.1 2.8
5 [P](U) Apartments.com Sites 35 1 122 4.5 3.5
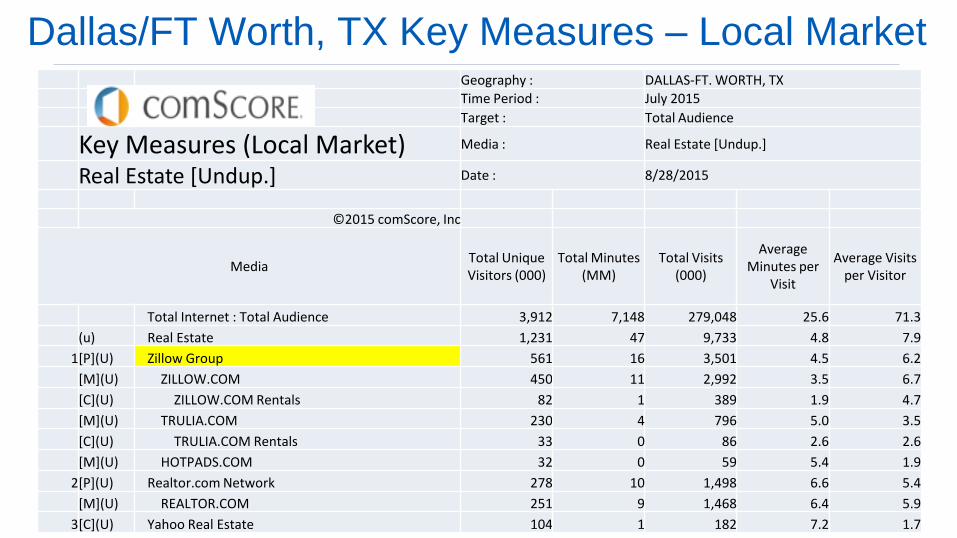
Geography : DALLAS-FT. WORTH, TX
Time Period : July 2015
Target : Total Audience
Key Measures (Local Market) Media : Real Estate [Undup.]
Real Estate [Undup.] Date : 8/28/2015
©2015 comScore, Inc
Media Total Unique Visitors (000)
Total Minutes (MM)
Total Visits (000)
Average Minutes per
Visit
Average Visits per Visitor
Total Internet : Total Audience 3,912 7,148 279,048 25.6 71.3
(u) Real Estate 1,231 47 9,733 4.8 7.9
1 [P](U) Zillow Group 561 16 3,501 4.5 6.2
[M](U) ZILLOW.COM 450 11 2,992 3.5 6.7
[C](U) ZILLOW.COM Rentals 82 1 389 1.9 4.7
[M](U) TRULIA.COM 230 4 796 5.0 3.5
[C](U) TRULIA.COM Rentals 33 0 86 2.6 2.6
[M](U) HOTPADS.COM 32 0 59 5.4 1.9
2 [P](U) Realtor.com Network 278 10 1,498 6.6 5.4
[M](U) REALTOR.COM 251 9 1,468 6.4 5.9
3 [C](U) Yahoo Real Estate 104 1 182 7.2 1.7
Dallas/FT Worth, TX Key Measures – Local Market
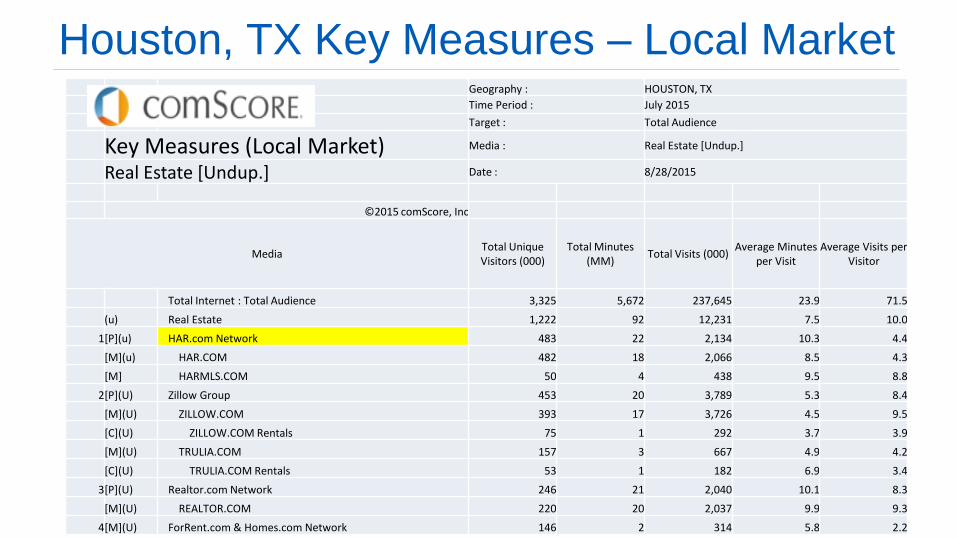
Geography : HOUSTON, TX
Time Period : July 2015
Target : Total Audience
Key Measures (Local Market) Media : Real Estate [Undup.]
Real Estate [Undup.] Date : 8/28/2015
©2015 comScore, Inc
Media Total Unique Visitors (000)
Total Minutes (MM)
Total Visits (000) Average Minutes
per Visit Average Visits per
Visitor
Total Internet : Total Audience 3,325 5,672 237,645 23.9 71.5
(u) Real Estate 1,222 92 12,231 7.5 10.0
1 [P](u) HAR.com Network 483 22 2,134 10.3 4.4
[M](u) HAR.COM 482 18 2,066 8.5 4.3
[M] HARMLS.COM 50 4 438 9.5 8.8
2 [P](U) Zillow Group 453 20 3,789 5.3 8.4
[M](U) ZILLOW.COM 393 17 3,726 4.5 9.5
[C](U) ZILLOW.COM Rentals 75 1 292 3.7 3.9
[M](U) TRULIA.COM 157 3 667 4.9 4.2
[C](U) TRULIA.COM Rentals 53 1 182 6.9 3.4
3 [P](U) Realtor.com Network 246 21 2,040 10.1 8.3
[M](U) REALTOR.COM 220 20 2,037 9.9 9.3
4 [M](U) ForRent.com & Homes.com Network 146 2 314 5.8 2.2
Houston, TX Key Measures – Local Market

Rank Website % of Texas Visits
1 Zillow Group 28.50
2 Realtor.com 10.19
3 HAR.com 6.77
Texas Real Estate Visitors – July, 2015 (Source: Hitwise)
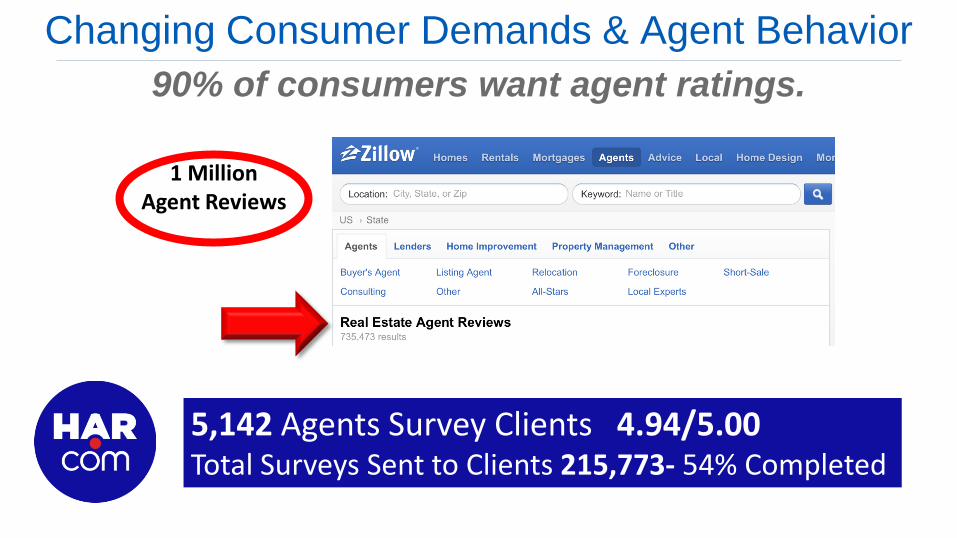
Changing Consumer Demands & Agent Behavior
90% of consumers want agent ratings.
1 Million Agent Reviews
5,142 Agents Survey Clients 4.94/5.00 Total Surveys Sent to Clients 215,773- 54% Completed

Changing Consumer Demands & Agent Behavior
96% of consumers
want to view agent production.

Changing Consumer Demands & Agent Behavior
Consumers want home values.

Changing Consumer Demands & Agent Behavior
92% of consumers want transaction management.
$108 Million Costs
162,118 transactions opened in SureClose
Changing Consumer Demands & Agent Behavior
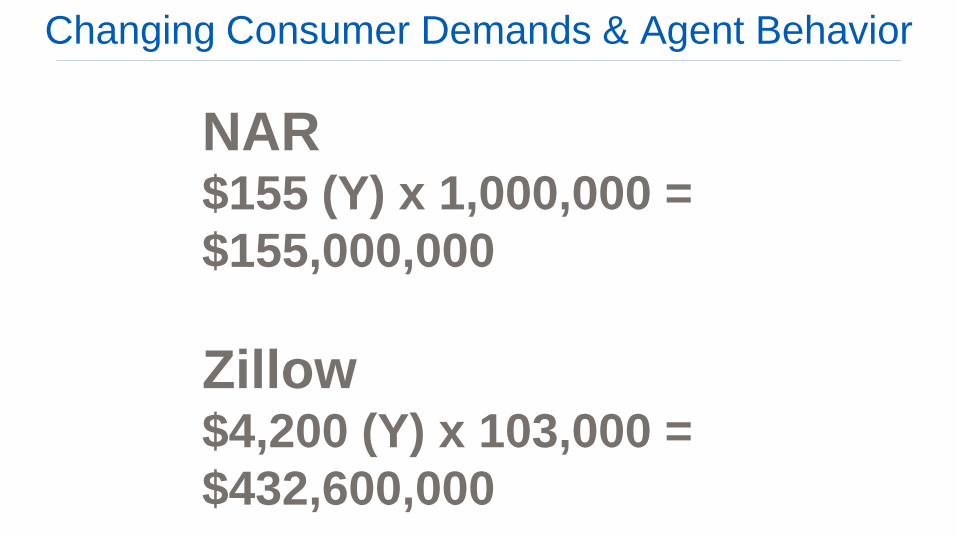
NAR $155 (Y) x 1,000,000 =
$155,000,000
Zillow $4,200 (Y) x 103,000 =
$432,600,000
Changing Consumer Demands & Agent Behavior

• High def images of homes • Video in new Zillow TV
Channel • New Apple TV available in
October
Changing Consumer Demands & Agent Behavior
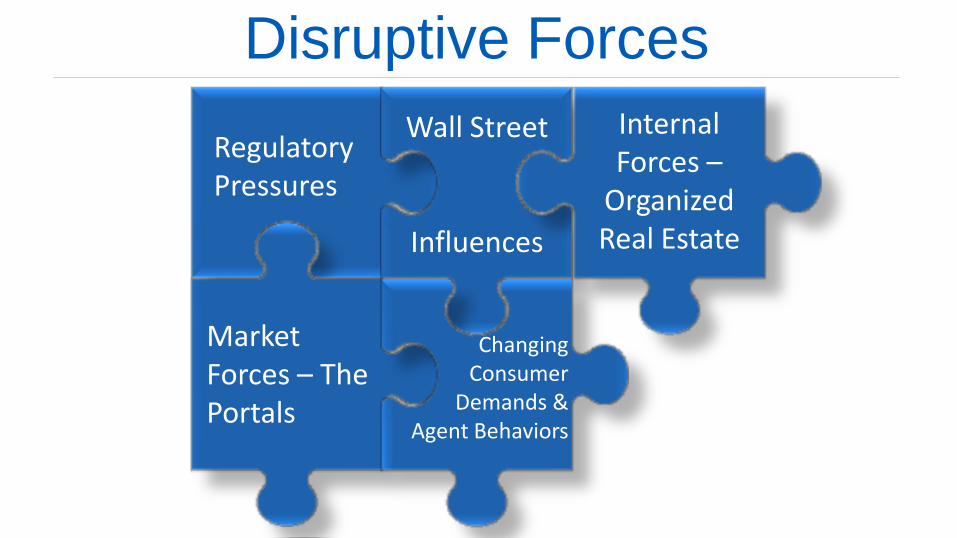
Disruptive Forces
Regulatory Pressures
Wall Street
Influences
Internal Forces –
Organized Real Estate
Market Forces – The Portals
Changing Consumer
Demands & Agent Behaviors