Discussions on the Potential Contribution of Secondary Organic Aerosol (including organonitrates) to...
18
Discussions on the Potential Contribution of Secondary Organic Aerosol (including organonitrates) to PM 2.5 in Klamath Falls Kelley Barsanti 1 , Serena Chung 2 and Abdullah Mahmud 1 1 Center for Climate and Aerosol Research, Portland State University 2 Laboratory for Atmospheric Research , Washington State University
-
date post
21-Dec-2015 -
Category
Documents
-
view
217 -
download
1
Transcript of Discussions on the Potential Contribution of Secondary Organic Aerosol (including organonitrates) to...

Discussions on the Potential Contribution of Secondary Organic Aerosol (including
organonitrates) to PM2.5 in Klamath Falls
Kelley Barsanti1, Serena Chung2 and Abdullah Mahmud1
1Center for Climate and Aerosol Research, Portland State University2Laboratory for Atmospheric Research , Washington State University

Outline
• Goal: To use thermodynamic modeling to assess the potential of secondary organic aerosol formation, relative to primary PM2.5 emissions, in Klamath Falls, OR
• Introduction to SOA modules in chemical transport models
• Approach• Results

Overview of Relevant Gas-Phase ChemistryDay: OH, O3 (HO2, NOx) Night: O3, NO3
• Anthropogenic precursors: react w/OH
• Biogenic precursors– Isoprene reacts w/OH– Monoterpenes and
sesquiterpenes react w/OH+O3
• Then…branching based on NOx concentrations
VOC
Modified from Presto et al., 2005, ES&T
“Ox”
• Typically anthropogenic SOA precursors (benzene, xylene, toluene) react slowly with NO3
• Biogenic precursors react w/NO3
– Isoprene, on order of reaction w/OH
– Reactions w/α-,β-pinene particularly fast

How is SOA Formation Represented in Models: Two Product Approach
α-Pinene + OH (first generation) α-Pinene + OH (lumped compounds)
Sources: Pinho et al., J. Atmos. Chem.; Odum et al., ES&T; Donahue et al., ES&T
N hydrocarbons (HC)
p2
p1
α1, C*1
α2, C*2Fit chamber data to obtain α1,2 and C* 1,2 values
2 products (2p)
Products tracked = 2 x N
Overview of SOA Model Approaches: Two-Product (2p) and Volatility Basis Set (VBS)
bins 1 to j (usually 4)
α1, C*1 Fix C* i, fit chamber data to obtain αi values
Products tracked = j or j x N
volatility basis set (VBS)
α2, C*2 α3, C*3 α4, C*4

SOA in CMAQv4.7 (2p)
No NOx dependence;No independent NO3 pathway
Carlton et al., ES&T, 2010
NOx dependence

SOA in GEOS-Chem (VBS)
Pye et al., 2010
NOx dependence mono- and sesquiterpenes
Independent NO3 pathway for all terpenes
“2p-VBS”
SOA
Yiel
d (≡
AM
F)SOA Mass (μg m-3)
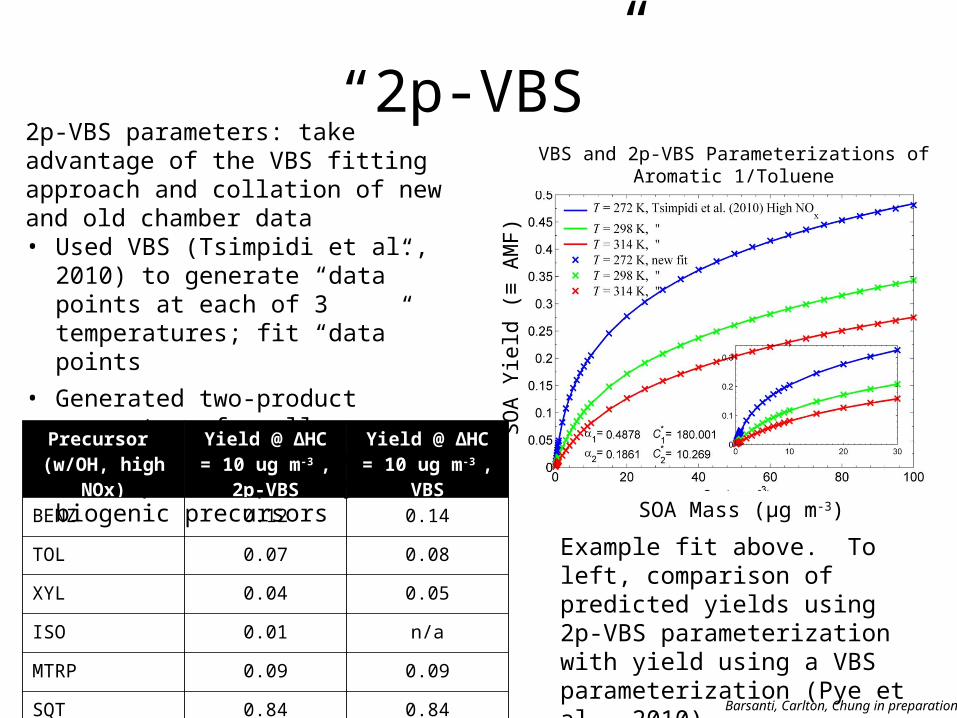
VBS and 2p-VBS Parameterizations of Aromatic 1/Toluene
2p-VBS parameters: take advantage of the VBS fitting approach and collation of new and old chamber data • Used VBS (Tsimpidi et al., 2010) to generate
“data” points at each of 3 temperatures; fit “data” points
• Generated two-product parameters for all precursors in CMAQ, added parameters for NOx dependent pathway for biogenic precursors
Barsanti, Carlton, Chung in preparation
Precursor (w/OH, high NOx)
Yield @ ΔHC = 10 ug m-3 , 2p-VBS
Yield @ ΔHC = 10 ug m-3 , VBS
BENZ 0.12 0.14
TOL 0.07 0.08
XYL 0.04 0.05
ISO 0.01 n/a
MTRP 0.09 0.09
SQT 0.84 0.84
Example fit above. To left, comparison of predicted yields using 2p-VBS parameterization with yield using a VBS parameterization (Pye et al., 2010).

Assumptions and Approach Goal: To evaluate the potential importance of SOA formation in Klamath Falls non-attainment area by
comparing predicted SOA with primary PM2.5 emissions in a fully-closed box model.
Cases:1. Klamath County: 1.6 x 10⁴ km2
2. Area approximating area of influence around monitoring site: 225 km2
Winter Conditions:Mixed-Layer Height: 200 mAverage Daytime Temp.: 40°F Average Nighttime Temp.: 20°F
Duration of Simulation: 12 hours
Daytime chemistry: 12-hr average OH: 2 x 10⁶ molecules/cm3
24-hr average O3: 7 x 10¹¹ molecules/cm3
No NO/HO2 assumptions, consider one pathway at a time
Nighttime chemistry: 12-hr average NO3: 2.5 x 10⁸ molecules/cm3
Breakdown of biogenic terpene emissions:31% sesquiterpenes (sqt)69% monoterpenes (mtrp)
Seasonally-averaged emissions from C. Swab,ODEQ.
SOA parameters based on Carlton et al. (2010),Pye et al. (2010), Barsanti et al. (in prep.)

Seasonally-Adjusted Winter Emissions
Mobile Sources (64%)
Res Wood
Combust(31%)
Other (5%)
Res Wood
Combust(4%)
Other (2%)
Mobile Sources (94%)
Res Wood
Combust(1%) Other (1%)
Mobile Sources (98%)
Benzene
Xylene
Toluene

Summary of Estimated SOA Formation
Notes: Predicted SOA depends on background organic PM2.5 loading; assumed primary PM2.5 was 20-50% organic as noted. For case 2, anthropogenic field burning emissions omitted and biogenic emissions reduced by half.
Precursor (w/OH, high NOx)
Anthropogenic SOA(g/m3), % of
total PM2.5
Biogenic SOA (g/ m3), % of total
PM2.5
Total PM2.5 (primary + SOA)
Case 1: low-NOx 0.08, 2.5% 1.6, 52% 3.1
Case 1: low-NOx, T correction on biogenic emissions
0.08, 3.3% 0.9, 38% 2.4
Case 1: high-NOx 0.02, <0.5% 3.5, 71% 4.9
Case 1: NO3 (nighttime chemistry)
n/a 4.3, 75% 5.7
Case 2: low-NOx, 20% organic
6.9, 9% 2.3, 4% 52
Case 2: low-NOx, 50% organic
7.6, 9% 3.0, 6% 53
Case 2: high-NOx, 20% organic
5.4, 4% 3.2, 6% 50
Case 2: high-NOx, 50% organic
7.1, 6% 4.3, 8% 52
Case 1 and variations used to demonstrate sensitivity to inputs
(assumed PM2.5 50% organic)
toluene, benzene, xylene (low NOx)
benzene, toluene, xylene
(high NOx)
Precursor contribution to SOA (high
to low) :

Take Home Points An attempt to understand SOA contributions to total PM2.5
Anthropogenic SOA contributes ~4-9%, and biogenic contributes ~4%-8% to the total PM2.5 during wintertime in Klamath Falls
Need 3-D Airshed modeling to estimate SOA source contributions more accurately

Additional Slides

Seasonally-Adjusted Benzene Emissions ( 1 % of Total) Data Category Group
% Contribution to Total Benzene
Emissions
Onroad Mobile Sources/Highway Vehicles - Gasoline/Light Duty Gasoline Vehicles (LDGV) 0.267
Onroad Mobile Sources/Highway Vehicles - Gasoline/Light Duty Gasoline Trucks 1 & 2 (M6) = LDGT1 (M5) 0.170
Nonpoint Residential Wood Combustion: Woodstove_NotCertified 0.098
Onroad Mobile Sources/Highway Vehicles - Gasoline/Light Duty Gasoline Trucks 3 & 4 (M6) = LDGT2 (M5) 0.070
Nonroad Mobile Sources/Pleasure Craft/Gasoline 2-Stroke 0.063
Nonpoint Residential Wood Combusiont: Insert_NonCertified 0.051
Nonpoint Residential Wood Combustion: Woodstove_Certified_Catalytic 0.039
Nonpoint Residential Wood Combustion: Woodstove_Certified_NonCatalytic 0.036
Nonpoint Residential Wood Combustion: Central_Furnace 0.032
Nonpoint Residential Wood Combusiont: Insert_Certified_NonCatalytic 0.025
Nonpoint Residential Open Burning: Municipal Waste (check SCC) 0.025
Nonpoint Storage and Transport/Petroleum and Petroleum Product Storage/Gasoline Service Stations 0.023
Nonroad Mobile Sources/Off-highway Vehicle Gasoline, 2-Stroke/Recreational Equipment 0.017
Nonpoint Residential Wood Combustion: Insert_Certified_Catalytic 0.016
Onroad Mobile Sources/Highway Vehicles - Gasoline/Heavy Duty Gasoline Vehicles 2B thru 8B & Buses (HDGV) 0.015
Mobile Sources (64%)
Res Wood
Combust(31%)
Other (5%)

Seasonally-Adjusted Toluene Emissions ( 1 % of Total)
Data Category Group% Contribution to
Total Toluene Emissions
Onroad Mobile Sources/Highway Vehicles - Gasoline/Light Duty Gasoline Vehicles (LDGV) 0.315
Onroad Mobile Sources/Highway Vehicles - Gasoline/Light Duty Gasoline Trucks 1 & 2 (M6) = LDGT1 (M5) 0.202
Nonroad Mobile Sources/Pleasure Craft/Gasoline 2-Stroke 0.164
Nonroad Mobile Sources/Off-highway Vehicle Gasoline, 2-Stroke/Recreational Equipment 0.089
Onroad Mobile Sources/Highway Vehicles - Gasoline/Light Duty Gasoline Trucks 3 & 4 (M6) = LDGT2 (M5) 0.083
Nonpoint Residential Wood Combustion: Woodstove_NotCertified 0.024
Onroad Mobile Sources/Highway Vehicles - Gasoline/Heavy Duty Gasoline Vehicles 2B thru 8B & Buses (HDGV) 0.022
Nonpoint Storage and Transport/Petroleum and Petroleum Product Storage/Gasoline Service Stations 0.018
Nonpoint Residential Wood Combusiont: Insert_NonCertified 0.012
Res Wood
Combust(4%)
Other (2%)
Mobile Sources (94%)

Seasonally-Adjusted Xylene Emissions ( 1 % of Total)
Data Category Group % Contribution to Total Xylene Emissions
Nonroad Mobile Sources/Pleasure Craft/Gasoline 2-Stroke 0.282
Onroad Mobile Sources/Highway Vehicles - Gasoline/Light Duty Gasoline Vehicles (LDGV) 0.266
Onroad Mobile Sources/Highway Vehicles - Gasoline/Light Duty Gasoline Trucks 1 & 2 (M6) = LDGT1 (M5) 0.170
Nonroad Mobile Sources/Off-highway Vehicle Gasoline, 2-Stroke/Recreational Equipment 0.096
Onroad Mobile Sources/Highway Vehicles - Gasoline/Light Duty Gasoline Trucks 3 & 4 (M6) = LDGT2 (M5) 0.070
Onroad Mobile Sources/Highway Vehicles - Gasoline/Heavy Duty Gasoline Vehicles 2B thru 8B & Buses (HDGV) 0.019
Nonpoint Storage and Transport/Petroleum and Petroleum Product Storage/Gasoline Service Stations 0.011
Nonpoint Residential Wood Combustion: Woodstove_NotCertified 0.010
Res Wood
Combust(1%) Other (1%)
Mobile Sources (98%)

Seasonally-Adjusted Emissions Summary
Data Category Group % Contribution to Total Primary PM2.5
Nonpoint Prescribed Burning: ANTHROPOGENIC 0.547
Nonpoint Mobile Sources/Unpaved Roads/unknown (fugitive dust: vehicle related) 0.071
Nonpoint Residential Wood Combustion: Woodstove_NotCertified 0.066
Nonpoint Residential Wood Combusiont: Insert_NonCertified 0.034
Nonpoint Residential Wood Combustion: Woodstove_Certified_NonCatalytic 0.031
Nonpoint Residential Open Burning: Brush 0.023
Nonpoint Residential Wood Combustion: Woodstove_Certified_Catalytic 0.023
Nonpoint Residential Wood Combusiont: Insert_Certified_NonCatalytic 0.022
Nonpoint Mobile Sources/Paved Roads/All Paved Roads (fugitive dust: vehicle related) 0.021
Nonpoint CAFO: Beef Cattle: Total (non-permitted sources) 0.017
Nonpoint Residential Wood Combustion: Central_Furnace 0.014
Point Industrial Processes/Pulp and Paper and Wood Products/Plywood Operations 0.013
Nonpoint Residential Wood Combusiont: Fireplace 0.012
Point External Combustion Boilers/Industrial/Wood/Bark Waste 0.012
Nonpoint Residential Wood Combustion: Insert_Certified_Catalytic 0.010
Seasonally-Adjusted Primary PM2.5 Emissions ( 1 % of Total)

How is SOA Formation Represented in Models: Two Product Approach
α,β-Pinene + OH (first generation) α,β-Pinene + OH (lumped compounds)
Sources: Pinho et al., J. Atmos. Chem.; Odum et al., ES&T; Donahue et al., ES&T
N hydrocarbons (HC)
p2
p1
α1, C*1
α2, C*2Fit chamber data to obtain α1,2 and C* 1,2 values
2 products (2p)
Products tracked = 2 x N
Overview of SOA Model Approaches: Two-Product (2p) and Volatility Basis Set (VBS)
bins 1 to j (usually 4)
α1, C*1 Fix C* i, fit chamber data to obtain αi values
Products tracked = j or j x N
volatility basis set (VBS)
α2, C*2 α3, C*3 α4, C*4
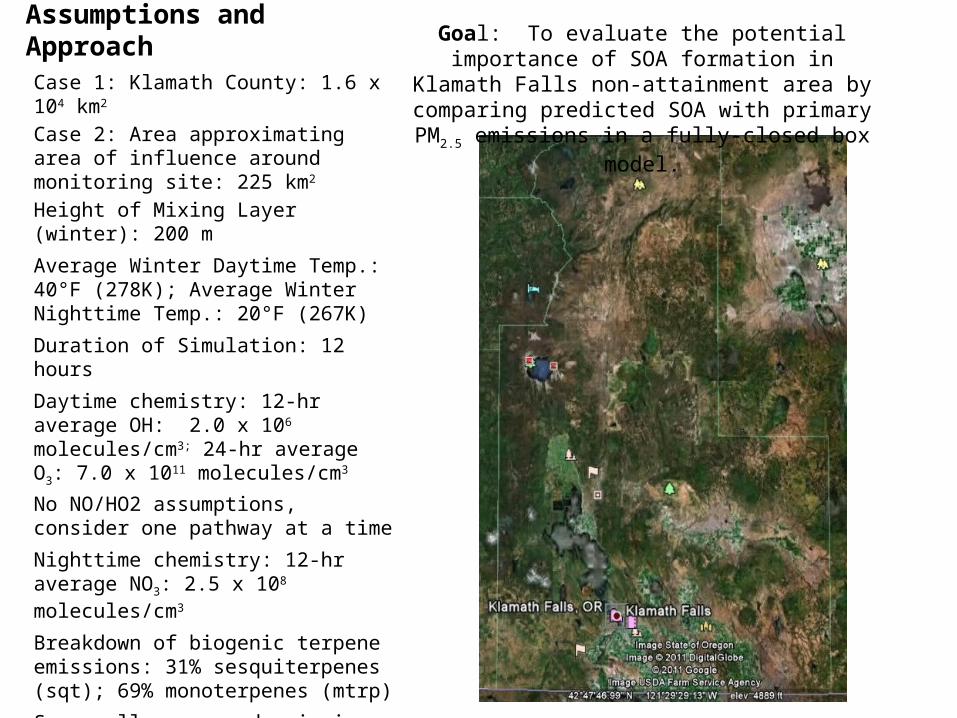
Assumptions and ApproachCase 1: Klamath County: 1.6 x 10⁴ km2
Case 2: Area approximating area of influence around monitoring site: 225 km2
Height of Mixing Layer (winter): 200 m
Average Winter Daytime Temp.: 40°F (278K); Average Winter Nighttime Temp.: 20°F (267K)
Duration of Simulation: 12 hours
Daytime chemistry: 12-hr average OH: 2.0 x 10⁶ molecules/cm3; 24-hr average O3: 7.0 x 10¹¹ molecules/cm3
No NO/HO2 assumptions, consider one pathway at a time
Nighttime chemistry: 12-hr average NO3: 2.5 x 10⁸ molecules/cm3
Breakdown of biogenic terpene emissions: 31% sesquiterpenes (sqt); 69% monoterpenes (mtrp)
Seasonally-averaged emissions from C. Swab, ODEQ.
SOA parameters based on Carlton et al. (2010), Pye et al. (2010), Barsanti et al. (in prep.)
Goal: To evaluate the potential importance of SOA formation in Klamath Falls non-attainment area by
comparing predicted SOA with primary PM2.5 emissions in a fully-closed box model.