Discover Network Insights with Reports
18
Discovering Network Insights with Reports Young Xu, Product Marketing Analyst
-
Upload
thousandeyes -
Category
Technology
-
view
90 -
download
1
Transcript of Discover Network Insights with Reports

Discovering Network Insights with Reports
Young Xu, Product Marketing Analyst

2
About ThousandEyes
Founded by network experts; strong
investor backing
Relied on for "critical operations by leading enterprises
Recognized as "an innovative "
new approach
ThousandEyes delivers network intelligence into every network.
24 Fortune 500
4 top 5 SaaS Companies 4 top 6 US Banks
3 Fortune 5
3
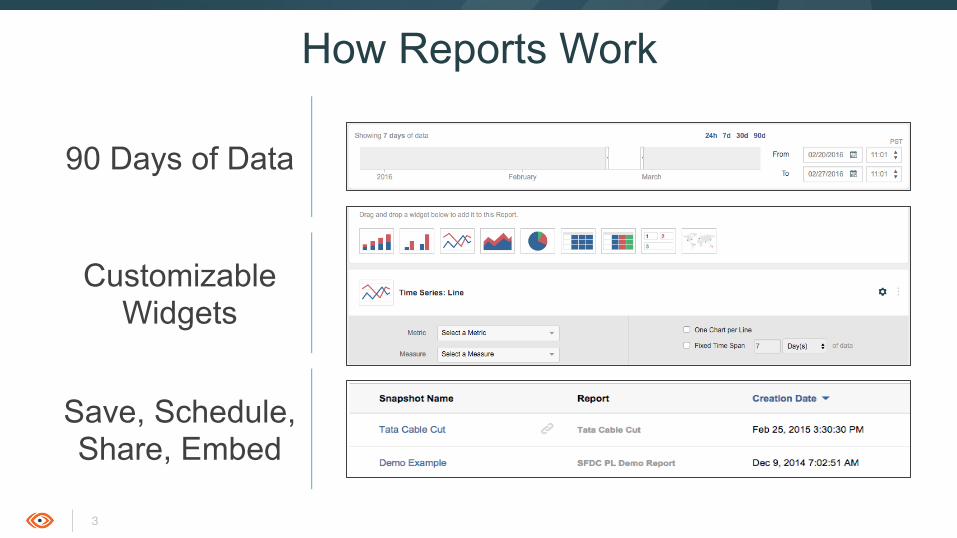
How Reports Work
90 Days of Data
Save, Schedule, Share, Embed
Customizable Widgets

4
App Health
Availability and response time
BGP
Reachability, "path changes
Network Health
Loss, latency, "jitter, bandwidth
Geo Metrics
Continent, country, agent, server
DNS
Availability, response time
Live Shares
Even free tests included in Lite
Page Load
Components, errors, time
Alerts
Active alerts, alerts by type
What to Report On

5
• Stacked Bar • Grouped Bar • Pie Chart
Types of Report Visualizations
• Line • Stacked Area Trends over Time
Decomposable/Grouped
Numerical
Geographical • Map • Group by Continent, Country,
Agent or Server
• Table • Multi Metric Table • Number

6
• Time Series
Trends over Time
Line
• Line Stacked Area
Response time, fetch time, error count
7
• Time Series
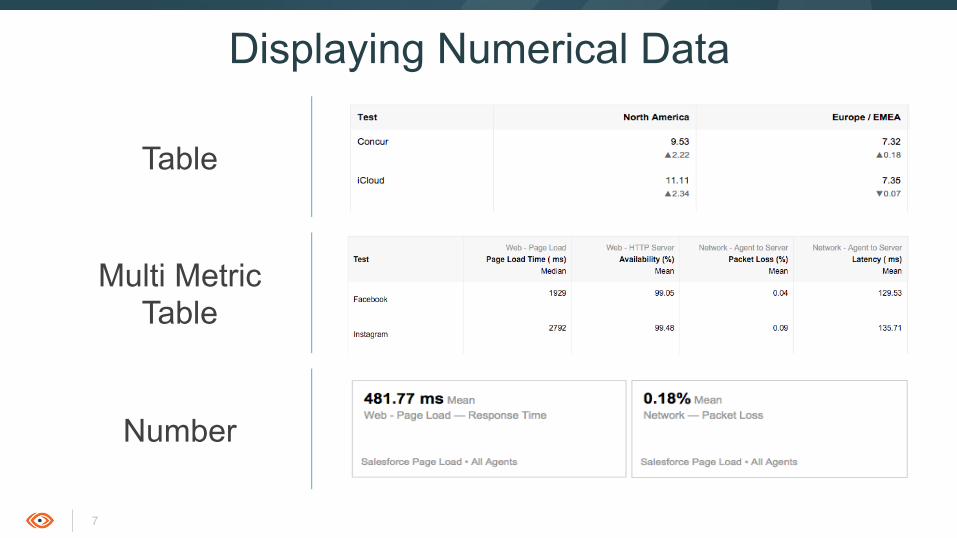
Displaying Numerical Data
• Table
Table
Multi Metric Table
Number

8
• Time Series
Decomposable/Grouped Metrics
Stacked Bar
Response time, fetch time, error count
Grouped Bar
Pie Chart
Response time, fetch time, error count

9
• Time Series
Geography
Map (Coming Soon)
• Line ‘Group By’
Option

10
• Save a report time slice • Persist data for your records
or forensics
Saving Report Data
• Set daily, weekly, quarterly snapshots
• Email snapshots or public share links, even to non-users
Snapshots Scheduling

11
• Share snapshots with a publicly accessible link
Sharing Report Data
• Embed on external sites with provided HTML code
• Updated in real time
Shares Embed

12
q Choose a Measure to meet your use case q Mean, median, standard deviation, nth percentile
q Use Filters to explicitly exclude/include! q Filter by Tests (services), Agents (sites), Servers q Or group together for aggregate data
q Save snapshots of before and after q Infrastructure changes, routing changes, CDN changes, outages
q Define defaults by Account Group and User q Clone reports to keep common layouts q Use naming conventions to keep track of many reports
q Use embedded widgets to create NOC dashboards, status pages or internal wikis q More on the blog:
q https://blog.thousandeyes.com/using-analytics-reports-to-present-new-insights/ q https://blog.thousandeyes.com/using-embedded-report-widgets/
Tips for Great Reports

13
Demo
14
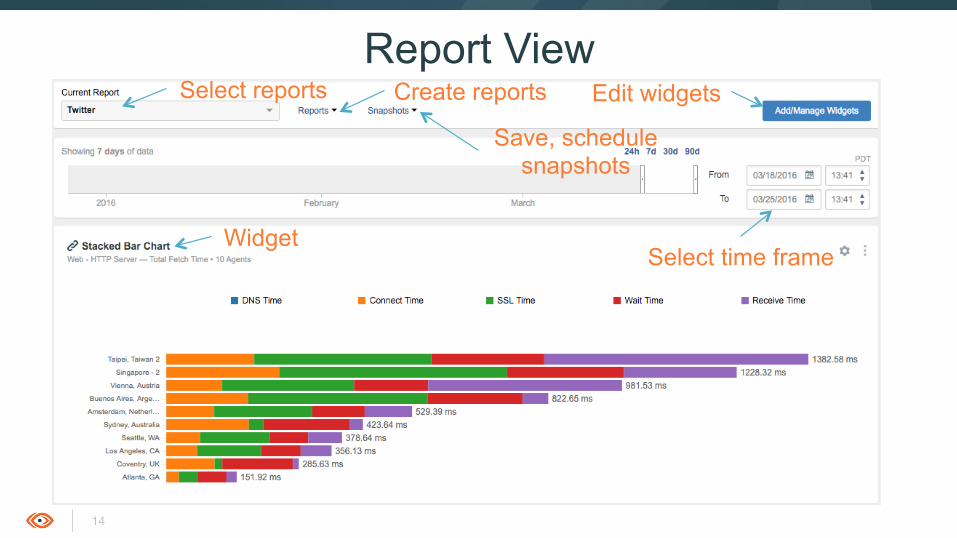
Report View Select reports
Select time frame Widget
Edit widgets Create reports
Save, schedule snapshots

15
Editing Reports
Save report Drag a widget below to add
Edit widget
Control defaults

16
Editing Report Widgets Embed widget and
other options
Only filter to explicitly exclude or include; otherwise all shown
Group by dimensions will break out data by selected group
Metrics and measures are shown based on test types in your account
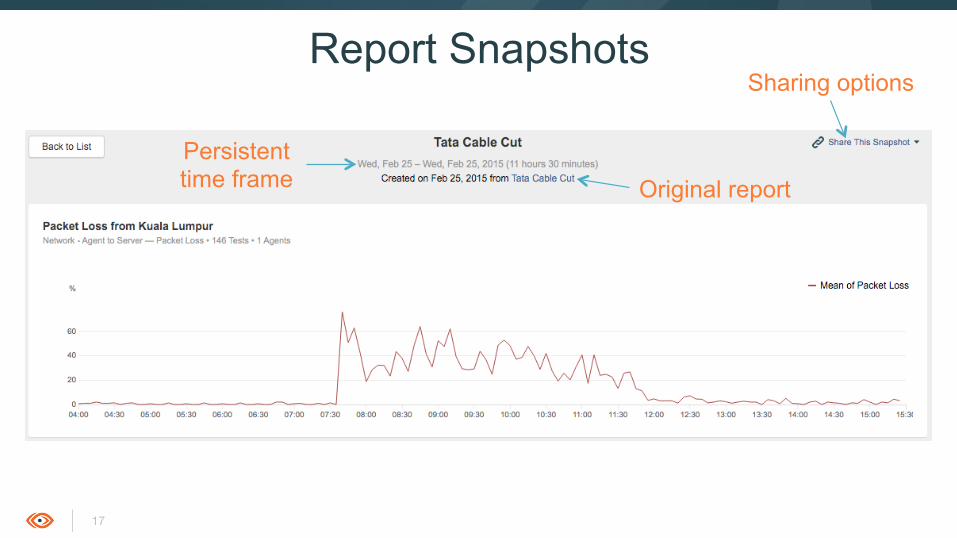
17
Report Snapshots Sharing options
Original report Persistent time frame

18
View the Live Demo https://www.thousandeyes.com/resources/reporting-webinar