
Discover England: summary insights on overseas visitors · 1 Discover England: summary insights on...
78
Discover England: summary insights on overseas visitors to England’s regions Initial summary report: volume, value, profile, motivations and barriers August 2016
Transcript of Discover England: summary insights on overseas visitors · 1 Discover England: summary insights on...
1
Discover England: summary insights on
overseas visitors to England’s regions
Initial summary report: volume, value, profile, motivations and barriers
August 2016

2
Report contents
1. Introduction: Including research sources and report rationale (Pages 3-5)
2. Executive summary: Key results from each chapter (Pages 6-10)
3. Volume, value and profile: Including trips, nights and spend per year overall, by region and market;proportion of visits to and outside London, by individual region and market; top cities/towns visited overalland by region; seasonality of visits overall, by region and market; duration of holidays overall and by market;key demographics including age and gender; accommodation stayed in during holiday (Pages 11-34)
4. Activities and themes as motivators: Including perceptions of the UK, motivations for holidaying in England,and activities conducted on a holiday in the UK. (Pages 35-43)
5. Booking and consuming travel: Including how overseas visitors hear about England, transport bookingmethods and accommodation booking methods (Pages 44-47)
6. Hooks and barriers for travelling beyond London: Includes themes illustrating barriers to, and hooks for,going beyond London (Pages 48-55)
7. Regional Pen Portraits: Key product insights on each of England’s regions as well as activities conducted byoverseas visitors in each region, ‘dream-only’ activities and attractions admissions numbers (Pages 56-74)
8. Recommendations: Final product-orientated recommendations (Pages 75-77)

3
Introduction
4
Background
The three-year £40million Discover England Fund was announced by the Government last year, with the objective of ensuring that England stays competitive in the rapidly growing global tourism industry, by offering world-class English tourism products to the right customers at the right time. The fund will be awarded to external bidders, with awards for two blocks of projects.
It is vital that funding is awarded to bids which are in line with consumer and business trends, and to this end, the fund will also support additional research, to ensure that project teams and potential bidders have access to relevant market intelligence. The research will include the delivery of both broad insights (that is, with potential relevance to any project) and research into specific areas.
In considering the types of research relevant for the Discover England Fund, it became evident that much of the information that bidders might require is actually already in existence. This includes information on the VisitBritain Insights pages, the dataset from the International Passenger Survey, other research carried out in the past by VisitBritain, or other secondary data sources.
For these reasons, VisitEngland have commissioned BDRC Continental undertake a substantial programme of tailored secondary research to ensure that bidders can easily access and use existing market intelligence to shape both year 1 and years 2-3 projects. The focus of this programme is the international consumer – while the fund is also intended to stimulate domestic tourism, bids must in the first instance demonstrate their potential to generate growth from inbound markets – and therefore all analysis should be focused on inbound markets.
This first report seeks to summarise all existing information to provide bidders with an immediate source of information to work from. Subsequent in-depth reports will be produced.
Introduction
5
About this report
There is a large and diverse range of data available on overseas visitors to the UK. The data in this report is largely drawnfrom the International Passenger Survey (IPS), which includes a combination of publically available raw data and theinsights generated by VisitBritain in their dedicated reports. As well as IPS data, the report also draws on the Anholt GfKNations Brand Index and BDRC Continental’s Global Tourism Monitor. Research sources are cited throughout.
This report aims to draw on the most up-to-date research available. In some cases, data was several years old. Forexample, ‘activities’ data is based on supplementary questions added to IPS in 2011. With this in mind, some cautionshould be applied to results in these areas, although there is little evidence to suggest significant changes in recent years.
Although the report aims to focus on visitors to England, this is not always possible with the data available. Therefore thereport interchanges between ‘England’ and ‘the UK’ where necessary. All figures reported refer to holiday visits.
The report refers to ‘target markets’ throughout. These are France, Germany, USA, Spain, Netherlands, Australia, TheNordics (Sweden, Norway, Denmark, Finland and Iceland) and China. Markets have been chosen due to their current highvolume of visits to England, or (as is the case with China) their potential to visit England in the future.
Introduction

6
Executive summary
7
Executive summary/1
Volume, value and profile of overseas visitors
• Since 2002, holiday trips to England by overseas visitors have increased by 83%, and nights spent in England by 46%.The lower growth in nights spent illustrates a trend towards shorter breaks in that period. The growth has largelybeen driven by trips to London, which have grown by 89% compared to 52% for trips outside London.
• Average trip length has dropped from 7.4 nights in 2002 to 5.9 nights in 2015. Trips to London average 4.9 nights,and trips to Rest of England 6.9 nights.
• Spend has gradually increased since 2002 although due to a strengthening pound has plateaued in recent years.
• Overseas visitors are most likely to stay in the South East on their holiday (1.6 million visits in 2015), followed by theSouth West (1 million) and North West (0.7 million). These regions aside, there has been limited consistent upwardmovement for overseas visits outside London.
• There has been significant change in the distribution of markets visiting England for a holiday since 2002. In 2015 themost visits were made from France (1.6 million visits), Germany (1.3 million), USA (1.2 million) and The Nordics (1.1million). Positively, visits from each of these markets have grown in recent years.
• Overseas holiday-makers staying outside of London are most likely to be from Germany, followed by France and theUSA. Germany aside, visits from overseas markets have not increased as much as they have in the capital.
• Visitors from the USA tend to spend the most money on a holiday to England, visitors from Germany the mostoutside of London.
• There is significant variation in market representation across different regions. Of the 8 featured markets, Francegenerates the highest number of visitors in 2 of England’s regions (London and East of England), Germany in 4regions (North East, West Midlands, South West and South East) and USA in 3 (North West, Yorkshire and EastMidlands).
• Manchester, Brighton and Bath are the most visited towns/cities outside of London
8
Executive summary/2
• Seasonality of visits varies by region. London has the most even spread , 30% visiting in both April to June and July toSeptember, and around 1 in 5 visiting in both off-peak quarters. The South West is the least evenly spread, over halfvisiting in April to June
• Hotels and guest houses tend to be the most popular type of accommodation for all markets, in particular for visitorsfrom China, The Nordics and the USA. More than a third of visitors from Australia stayed with friends or relatives in2015. Visitors from the Netherlands are most likely to be camping or staying at home.
Activities and themes as motivators
• The Gfk Anholt Nations Brand Index survey ranks the UK as 4th in the world for tourism. In particular it is well-regarded for being rich in historic buildings/monuments and for educational qualifications. The UK is less well-regarded for its natural beauty, an attribute for which it is ranked 18th. Despite this lower ranking, perceptions haveimproved in recent years.
• Motivations for visiting England tend to be centred around sight-seeing and experiencing local culture, areas in whichEngland scores higher than the ‘world average’. ‘Resting mind or body’ or ‘visiting beaches/coastal areas’ tend toscore lower than average, although countries that index high in this area tend to benefit from good weather.
• Activities conducted in the UK tend to mirror visitor motivations – sight-seeing activities, shopping and trips to thepub indexing the highest.
9
Executive summary/3
Booking and consuming travel
• Visitors tend to hear about England through media features, travel guides and peer recommendation. Directadvertising also plays an important role.
• The majority of visitors book their travel (72%) and accommodation (66%) directly with their travel oraccommodation providers. There is some variation by market – long haul markets such as Australia and China morelikely to do so via a travel agent.
Hooks and barriers for travelling beyond London
• Four main themes exist as barriers for overseas visitors travelling beyond London, as identified in VisitBritain’s 2013London & Beyond Report:
– Lack of awareness of the offer outside London: There is a clear lack of awareness of British destinations other thanLondon. Even where awareness exists, understanding of the experiences destinations offer is limited
– The all-encompassing London offer: The draw of London is so strong that many feel they wouldn’t have time or the needto go elsewhere. Attracting return visitors and longer stays is crucial to overcome this barrier.
– Desire and the importance of ‘experiences’: Consumers are increasingly seeking ‘experiential holidays’ encompassingculture, food, accommodation and unique experiences. Although Britain performs well with ‘culture’ it is less strong onother experiential areas.
– Transport concerns: Transport or access was identified as a key practical barrier for those that had not been beyondLondon. Around half said they would be nervous about driving in the UK and a quarter that it was too expensive to traveloutside London. Almost a fifth thought that other places worth going to outside London would be too far to travel.
10
Executive summary/4
• There were seven key themes that acted as hooks for travelling beyond London:
– Heritage: History and heritage are strongly associated with Britain’s holiday offer. The most common reason for goingbeyond London (given by 81%) was that Britain has history spread across the country
– Countryside: More than three quarters (78%) of those going beyond London gave Britain’s unique and beautifulcountryside as a reason for travel. Amongst those that had not been outside London, 81% said Britain’s countrysidewould persuade them to do so.
– Uniqueness and variety: Britain’s unique and varied nature is also appealing, 80% of those that went beyond Londonsaying they did so because of Britain’s diverse regions, and 75% because it offers unique places to stay
– British people and way of life: Over two-thirds of those who went beyond London mentioned the British people as areason for doing so. 70% wanted to meet British people see the British way of life and 67% because they were friendlyand welcoming
– Cities and culture: Britain’s fun and vibrant cities were flagged as a factor which might persuade people to outsideLondon. Britain’s contemporary culture was also regarded as a key element of interest.
– Trains, tours and packages: Most are willing to travel 2-3 hours from their initial base (typically London) to stay inanother destination. Preference is for train travel – a fifth said rail passes would help. Packaged tours and itinerarieswere also mentioned.
11
Volume, value and profile of overseas visitors
Data taken predominantly from International Passenger Survey (IPS) data

12
Trends in VOLUME of overseas visits to England
6,698
12,229
4,863
9,210
2,574
3,921
-
2,000
4,000
6,000
8,000
10,000
12,000
14,000
Column1 2003 2005 2007 2009 2011 2013
Visits to England Visits to London Visits to Rest of England
Holiday trips per year (000s)
49,237
71,949
27,773
44,956
21,464
26,993
-
10,000
20,000
30,000
40,000
50,000
60,000
70,000
80,000
2002 2003 2004 2005 2006 2007 2008 2009 2010 2011 2012 2013 2014 2015
Nights in England Nights in London Nights in rest of England
Holiday nights per year (000s)
Since 2002, holiday trips to England by overseas visitors have grown by 83% and nights spent by 46%; the lower growth innights spent illustrating the trend towards short breaks during that period.
This growth has been driven ostensibly by trips which include stays in London which have increased by 89% (nights spentin London growing by 62% in this time). The gap between trips / nights spent in London and spent in the Rest of Englandhas grown significantly in that time: trips including stays in the Rest of England growing by only 52% and nights away byonly 26%.
Only 32% of all trips to England made by overseas visitors now involve a stay outside of London compared with 38% in2002.
Source: IPS Source: IPS
Volume, value & profile
13
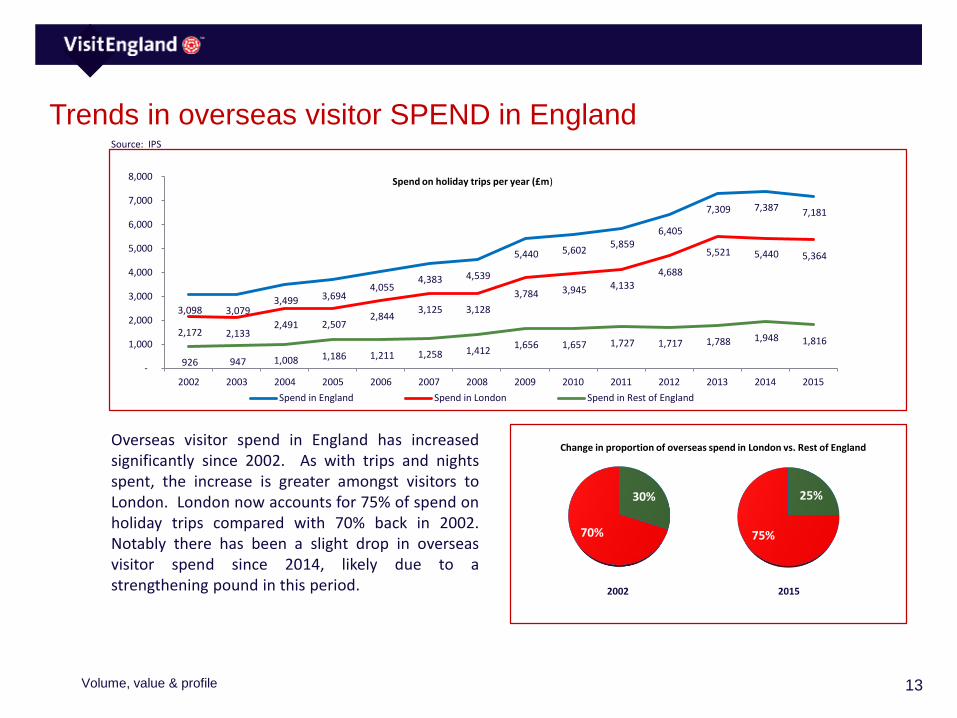
Trends in overseas visitor SPEND in England
Overseas visitor spend in England has increasedsignificantly since 2002. As with trips and nightsspent, the increase is greater amongst visitors toLondon. London now accounts for 75% of spend onholiday trips compared with 70% back in 2002.Notably there has been a slight drop in overseasvisitor spend since 2014, likely due to astrengthening pound in this period.
Source: IPS
3,098 3,079 3,499 3,694
4,055 4,383 4,539
5,440 5,602 5,859
6,405
7,309 7,387 7,181
2,172 2,133 2,491 2,507
2,844 3,125 3,128
3,784 3,945 4,133 4,688
5,521 5,440 5,364
926 947 1,008 1,186 1,211 1,258 1,412 1,656 1,657 1,727 1,717 1,788 1,948 1,816
-
1,000
2,000
3,000
4,000
5,000
6,000
7,000
8,000
2002 2003 2004 2005 2006 2007 2008 2009 2010 2011 2012 2013 2014 2015
Spend in England Spend in London Spend in Rest of England
Spend on holiday trips per year (£m)
Volume, value & profile
30%
70%
Change in proportion of overseas spend in London vs. Rest of England
25%
75%
2002 2015
14
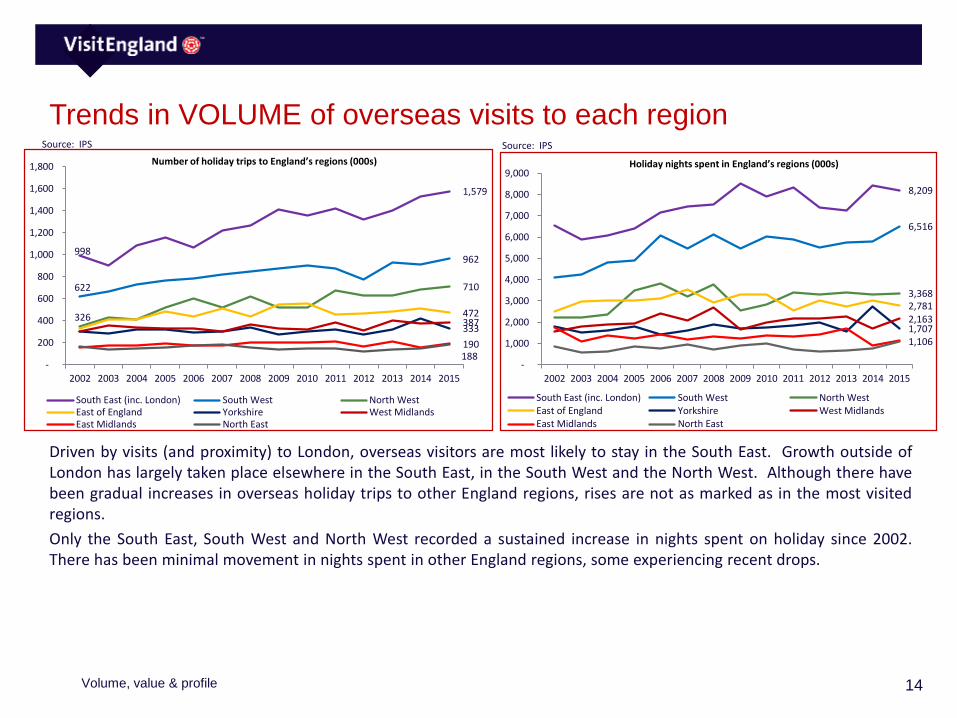
Trends in VOLUME of overseas visits to each region
Driven by visits (and proximity) to London, overseas visitors are most likely to stay in the South East. Growth outside ofLondon has largely taken place elsewhere in the South East, in the South West and the North West. Although there havebeen gradual increases in overseas holiday trips to other England regions, rises are not as marked as in the most visitedregions.
Only the South East, South West and North West recorded a sustained increase in nights spent on holiday since 2002.There has been minimal movement in nights spent in other England regions, some experiencing recent drops.
Source: IPS Source: IPS
998
1,579
622
962
710
326 472
333 387
190 188
-
200
400
600
800
1,000
1,200
1,400
1,600
1,800
2002 2003 2004 2005 2006 2007 2008 2009 2010 2011 2012 2013 2014 2015
South East (inc. London) South West North WestEast of England Yorkshire West MidlandsEast Midlands North East
Number of holiday trips to England’s regions (000s)
8,209
6,516
3,368 2,781
1,707 2,163
1,106
-
1,000
2,000
3,000
4,000
5,000
6,000
7,000
8,000
9,000
2002 2003 2004 2005 2006 2007 2008 2009 2010 2011 2012 2013 2014 2015
South East (inc. London) South West North WestEast of England Yorkshire West MidlandsEast Midlands North East
Holiday nights spent in England’s regions (000s)
Volume, value & profile

15
Trends in overseas visitor SPEND in each region
Trends in overseas visitor spend in England’s regions follows a similar pattern to trips – general sustained increases in theSouth East, South West and the North West, with minimal consistent movement elsewhere.
Source: IPS
559
392
273
165 121 144
79 82
-
100
200
300
400
500
600
700
2002 2003 2004 2005 2006 2007 2008 2009 2010 2011 2012 2013 2014 2015
South East (inc. London) South West North West East of England Yorkshire West Midlands East Midlands North East
Spend on holiday trips in English Regions (£m)
Volume, value & profile

16
Trends in volume of overseas holiday TRIPS by target market
There has been significant movement in the distribution of markets visiting England for a holiday in the last 13 years. In2002, the USA accounted for around 600,000 more trips than Germany and France (the second and third most prevalentvisitors) but in 2015 most trips to England were made by residents of France (up by 107% since 2002) and Germany (up by78% since 2002). The USA generated the third highest number of trips in 2015, but experienced a significant drop duringthe financial crisis in 2007. Although trip numbers from the USA are increasing, they are still 14% lower than in 2002.
Other notable movements have occurred amongst Nordic countries (Sweden, Norway, Denmark, Finland and Iceland);visitors from these markets increasing by 161% since 2002.
Outside of London, overseas visitors are overwhelmingly most likely to come from Germany and France, both of whichhave risen gradually since 2002.
Source: IPS Source: IPS
1,551
1,290 1,185
780
611
415
129
1,106
-
200
400
600
800
1,000
1,200
1,400
1,600
1,800
2002 2003 2004 2005 2006 2007 2008 2009 2010 2011 2012 2013 2014 2015
France Germany USA SpainNetherlands Australia China Nordics
Holiday Trips to ENGLAND By Target Market (000s)
517
581
314 286
178
67
223
-
100
200
300
400
500
600
700
2002 2003 2004 2005 2006 2007 2008 2009 2010 2011 2012 2013 2014 2015
France Germany USA SpainNetherlands Australia China Nordics
Holiday Trips to REST OF ENGLAND (OUTSIDE LONDON) by Target Market (000s)
Volume, value & profile

17
Trends in volume of overseas holiday NIGHTS by target market
Visitors from the USA spend the most number of nights in England, perhaps unsurprising given the time and financialinvestment in making a trip. Germany and France generate the second and third highest number of nights.
The pattern in the rest of England is markedly different however; Germany accounting for the most number of nights; 3.9million compared to 2.7 million from France and 2.2 million from the USA. Clearly, the German market should be a focusfor projects outside of London.
Source: IPS Source: IPS
6,919 7,280
4,511
3,033
3,980
1,077
4,768
-
1,000
2,000
3,000
4,000
5,000
6,000
7,000
8,000
9,000
10,000
2002 2003 2004 2005 2006 2007 2008 2009 2010 2011 2012 2013 2014 2015
France Germany USA SpainNetherlands Australia China Nordics
Holiday Nights in ENGLAND by Target Market (000s)
2,722
3,948
2,201
1,658 1,860 1,976
446
1,215
-
500
1,000
1,500
2,000
2,500
3,000
3,500
4,000
4,500
2002 2003 2004 2005 2006 2007 2008 2009 2010 2011 2012 2013 2014 2015
France Germany USA SpainNetherlands Australia China Nordics
Holiday Nights in REST OF ENGLAND (OUTSIDE LONDON) by Target Market (000s)
Volume, value & profile
18
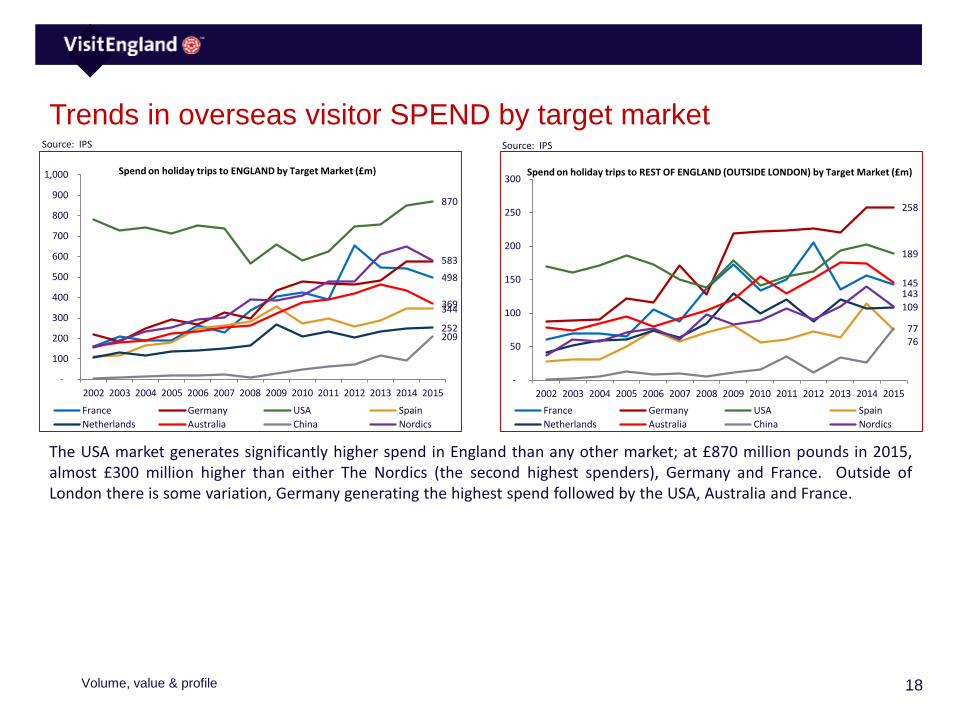
Trends in overseas visitor SPEND by target market
The USA market generates significantly higher spend in England than any other market; at £870 million pounds in 2015,almost £300 million higher than either The Nordics (the second highest spenders), Germany and France. Outside ofLondon there is some variation, Germany generating the highest spend followed by the USA, Australia and France.
Source: IPS Source: IPS
498
870
344
252
369
209
583
-
100
200
300
400
500
600
700
800
900
1,000
2002 2003 2004 2005 2006 2007 2008 2009 2010 2011 2012 2013 2014 2015
France Germany USA Spain
Netherlands Australia China Nordics
Spend on holiday trips to ENGLAND by Target Market (£m)
143
258
189
76
145
77
109
-
50
100
150
200
250
300
2002 2003 2004 2005 2006 2007 2008 2009 2010 2011 2012 2013 2014 2015
France Germany USA Spain
Netherlands Australia China Nordics
Spend on holiday trips to REST OF ENGLAND (OUTSIDE LONDON) by Target Market (£m)
Volume, value & profile

19
Proportion of visitors from each target market visiting outside London
(2013-2015 average)
Visitors from the USA are the most likely to visit London, followed by The Nordic countries. Almost half (49%) of holiday-makers from China and the Netherlands visit outside London, as do 45% from Germany. Visitors from The Nordics (21%),Spain (25%) and France (31%) are the least likely to visit outside the capital.
Source: IPS Source: IPS
79
72
62
86
55
79 7983
0
10
20
30
40
50
60
70
80
90
100
Proportion of visitors from each target market visitingLONDON (%)
44
31
45
29
49
25
49
21
0
10
20
30
40
50
60
70
80
90
100
Proportion of visitors from each target market visiting theREST OF ENGLAND (%)
Volume, value & profile
20
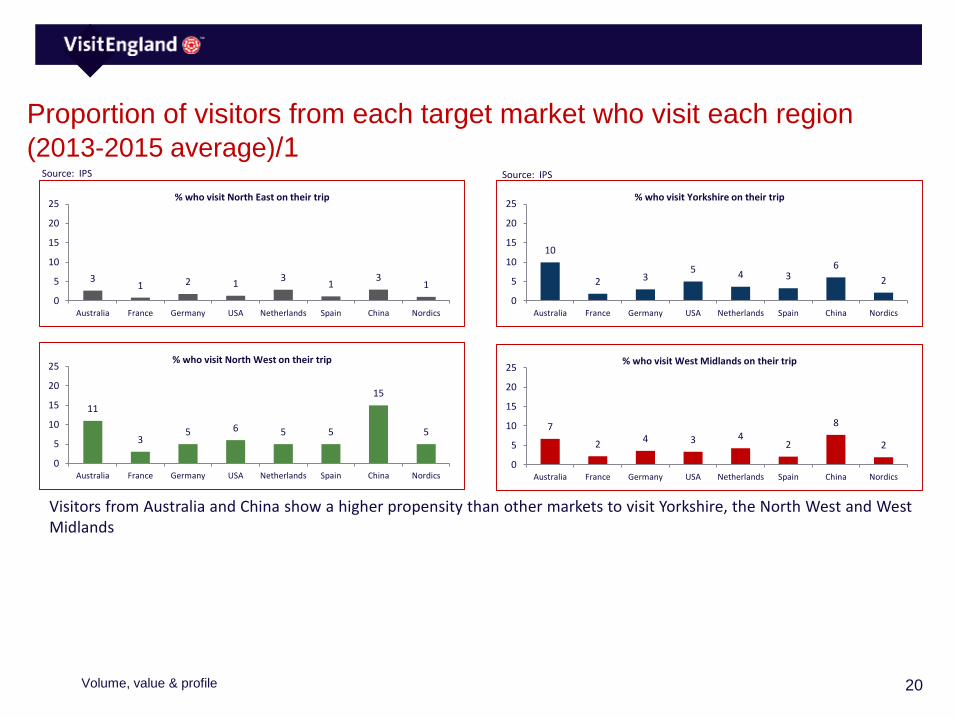
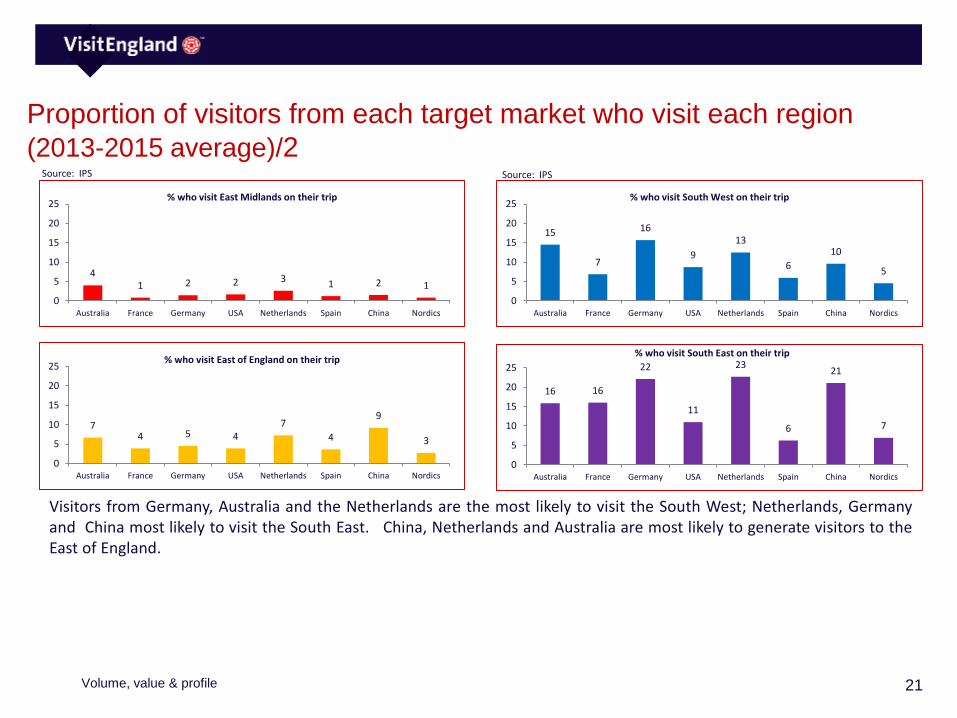
Proportion of visitors from each target market who visit each region
(2013-2015 average)/1
Visitors from Australia and China show a higher propensity than other markets to visit Yorkshire, the North West and WestMidlands
Source: IPS Source: IPS
31 2 1
31
31
0
5
10
15
20
25
Australia France Germany USA Netherlands Spain China Nordics
% who visit North East on their trip
11
35 6 5 5
15
5
0
5
10
15
20
25
Australia France Germany USA Netherlands Spain China Nordics
% who visit North West on their trip
10
2 35 4 3
6
2
0
5
10
15
20
25
Australia France Germany USA Netherlands Spain China Nordics
% who visit Yorkshire on their trip
7
24 3 4
2
8
2
0
5
10
15
20
25
Australia France Germany USA Netherlands Spain China Nordics
% who visit West Midlands on their trip
Volume, value & profile
21
Proportion of visitors from each target market who visit each region
(2013-2015 average)/2
Visitors from Germany, Australia and the Netherlands are the most likely to visit the South West; Netherlands, Germanyand China most likely to visit the South East. China, Netherlands and Australia are most likely to generate visitors to theEast of England.
Source: IPS Source: IPS
41 2 2 3 1 2 1
0
5
10
15
20
25
Australia France Germany USA Netherlands Spain China Nordics
% who visit East Midlands on their trip
74 5 4
7
4
9
3
0
5
10
15
20
25
Australia France Germany USA Netherlands Spain China Nordics
% who visit East of England on their trip
15
7
16
9
13
6
10
5
0
5
10
15
20
25
Australia France Germany USA Netherlands Spain China Nordics
% who visit South West on their trip
16 16
22
11
23
6
21
7
0
5
10
15
20
25
Australia France Germany USA Netherlands Spain China Nordics
% who visit South East on their trip
Volume, value & profile

22
Holiday trips to each region by market – 2013 to 2015 average (000s)
London North East North West YorkshireWest
Midlands East MidlandsEast Of England South West
South East (excl. London)
Australia 357 12 51 45 30 18 30 66 72
France 1,094 13 40 29 34 13 59 105 244
Germany 748 22 59 36 43 18 54 188 265
USA 947 15 63 56 37 19 43 96 122
Netherlands 332 17 32 22 25 16 43 75 136
Spain 546 8 32 23 14 9 25 41 43
China 72 3 14 6 7 1 8 9 19
Nordics 920 12 55 24 22 9 30 51 77
Of the 8 featured markets, France generates the highest number of visitors in 2 of England’s regions (London and East ofEngland), Germany in 4 regions (North East, West Midlands, South West and South East) and USA in 3 (North West,Yorkshire and East Midlands).
Despite the dominance of these 3 markets, a number of regions attract varying proportions of visitors from these andother markets. For example, the Netherlands have second highest representation in the North East, third highest in theSouth East and joint third highest in East of England. Similarly, The Nordics have the third highest representation inLondon and the North West. Despite generating the highest number of trips to England overall, France tends to besignificantly less well-represented in the North of England and Yorkshire.
Volume, value & profile
Source: IPS

23
Top English cities/towns stayed in by overseas visitors on holiday trips
(2010-15)000s of visitors 2010 2011 2012 2013 2014 2015
1. London 7,325 7,616 7,649 8,509 8,914 9,210
2. Manchester 184 211 215 222 229 268
3. Brighton 157 143 167 210 212 211
4. Bath 159 144 119 176 146 208
5. Liverpool 145 188 173 193 222 198
6. Birmingham 130 148 116 156 156 180
7. Oxford 165 181 140 167 193 180
8. Bristol 103 141 127 140 120 163
9. York 124 139 108 150 201 132
10. Cambridge 128 106 121 126 130 109
11. Hastings 49 70 42 46 59 99
12. Canterbury 96 112 96 99 100 99
After London, Manchester attracted the highest number of overseas holiday visitors in 2015, 268,000 in total. Thisrepresents an annual increase each year since 2010. Manchester is followed by Brighton, Bath and Liverpool.
Volume, value & profile
Source: IPS
NB. IPS measures people who have ‘stayed in’ a town rather than ‘visited’

24
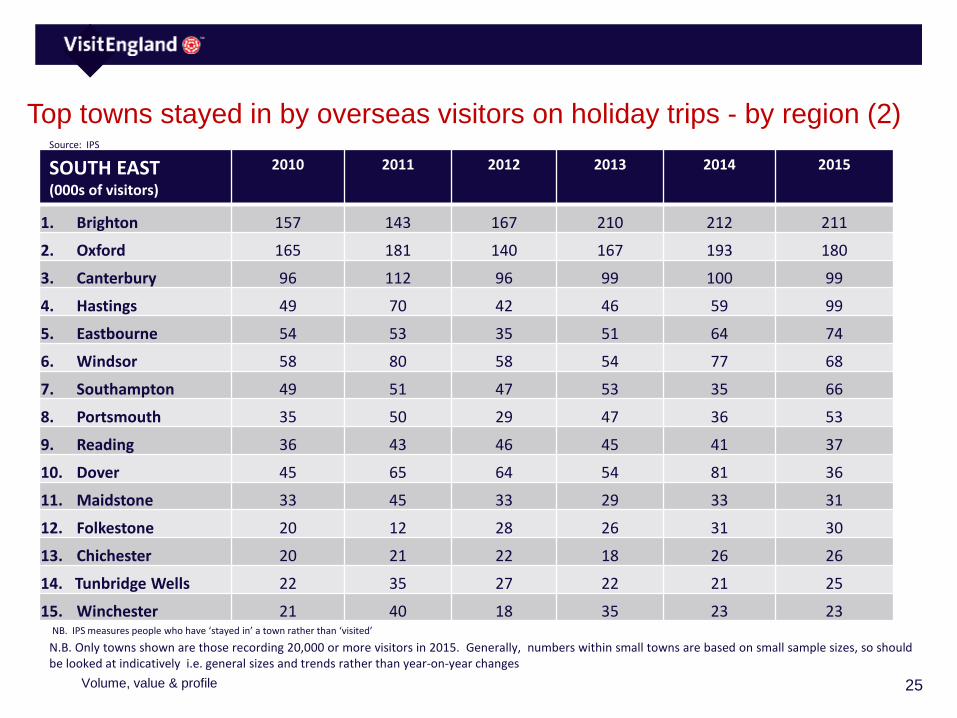
Top towns stayed in by overseas visitors on holiday trips - by region (1)
SOUTH WEST(000s of visitors)
2010 2011 2012 2013 2014 2015
1. Bath 159 144 119 176 146 208
2. Bristol 103 141 127 140 120 163
3. Bournemouth 67 59 71 69 51 68
4. Exeter 52 28 28 48 52 64
5. Salisbury 50 56 54 80 57 47
6. Plymouth 72 65 63 75 52 44
7. Torbay 42 44 35 39 51 36
8. St Ives 49 41 23 34 34 36
9. Newquay 28 35 28 35 58 34
10. Penzance 30 18 32 26 26 34
11. Falmouth 24 14 18 11 12 29
12. Weymouth 13 25 16 17 11 21
13. Gloucester 13 10 4 19 23 20
N.B. Only towns shown are those recording 20,000 or more visitors in 2015. Generally, numbers within small towns are based on small sample sizes, so shouldbe looked at indicatively i.e. general sizes and trends rather than year-on-year changes
Volume, value & profile
Source: IPS
NB. IPS measures people who have ‘stayed in’ a town rather than ‘visited’
25
SOUTH EAST(000s of visitors)
2010 2011 2012 2013 2014 2015
1. Brighton 157 143 167 210 212 211
2. Oxford 165 181 140 167 193 180
3. Canterbury 96 112 96 99 100 99
4. Hastings 49 70 42 46 59 99
5. Eastbourne 54 53 35 51 64 74
6. Windsor 58 80 58 54 77 68
7. Southampton 49 51 47 53 35 66
8. Portsmouth 35 50 29 47 36 53
9. Reading 36 43 46 45 41 37
10. Dover 45 65 64 54 81 36
11. Maidstone 33 45 33 29 33 31
12. Folkestone 20 12 28 26 31 30
13. Chichester 20 21 22 18 26 26
14. Tunbridge Wells 22 35 27 22 21 25
15. Winchester 21 40 18 35 23 23
N.B. Only towns shown are those recording 20,000 or more visitors in 2015. Generally, numbers within small towns are based on small sample sizes, so shouldbe looked at indicatively i.e. general sizes and trends rather than year-on-year changes
Volume, value & profile
Top towns stayed in by overseas visitors on holiday trips - by region (2)Source: IPS
NB. IPS measures people who have ‘stayed in’ a town rather than ‘visited’
26
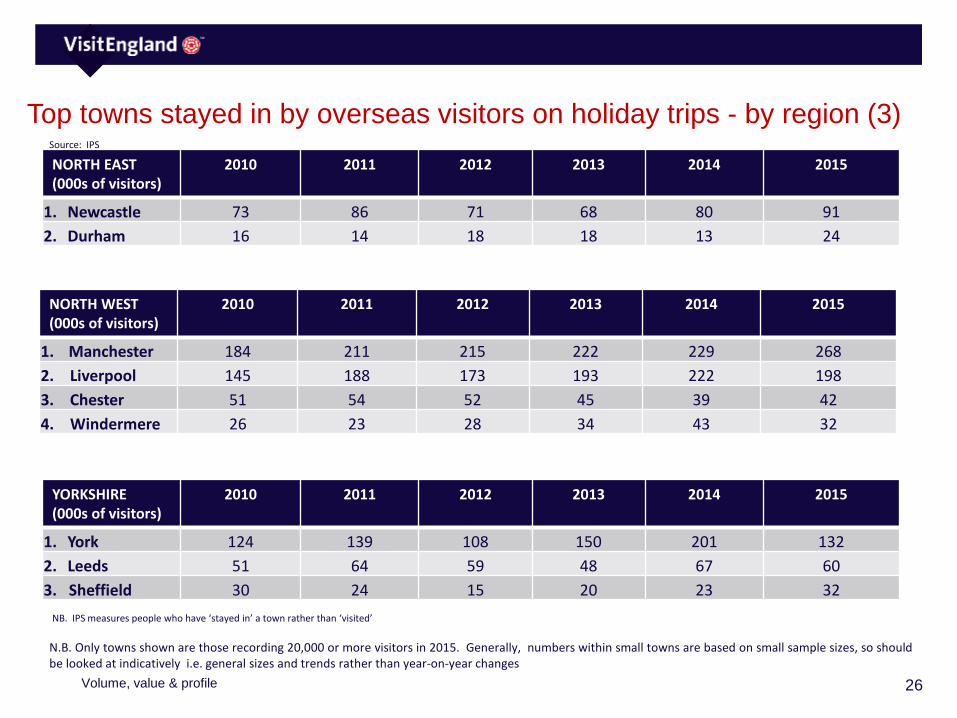
NORTH EAST(000s of visitors)
2010 2011 2012 2013 2014 2015
1. Newcastle 73 86 71 68 80 91
2. Durham 16 14 18 18 13 24
NORTH WEST(000s of visitors)
2010 2011 2012 2013 2014 2015
1. Manchester 184 211 215 222 229 268
2. Liverpool 145 188 173 193 222 198
3. Chester 51 54 52 45 39 42
4. Windermere 26 23 28 34 43 32
YORKSHIRE(000s of visitors)
2010 2011 2012 2013 2014 2015
1. York 124 139 108 150 201 132
2. Leeds 51 64 59 48 67 60
3. Sheffield 30 24 15 20 23 32
N.B. Only towns shown are those recording 20,000 or more visitors in 2015. Generally, numbers within small towns are based on small sample sizes, so shouldbe looked at indicatively i.e. general sizes and trends rather than year-on-year changes
Volume, value & profile
Top towns stayed in by overseas visitors on holiday trips - by region (3)Source: IPS
NB. IPS measures people who have ‘stayed in’ a town rather than ‘visited’
27
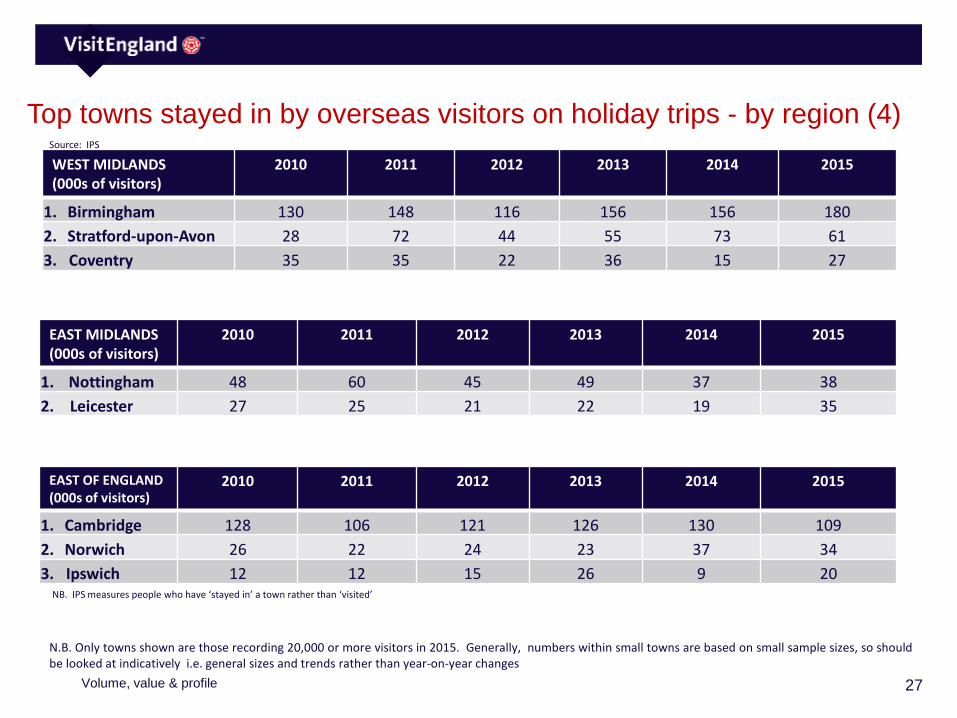
WEST MIDLANDS(000s of visitors)
2010 2011 2012 2013 2014 2015
1. Birmingham 130 148 116 156 156 180
2. Stratford-upon-Avon 28 72 44 55 73 61
3. Coventry 35 35 22 36 15 27
EAST MIDLANDS(000s of visitors)
2010 2011 2012 2013 2014 2015
1. Nottingham 48 60 45 49 37 38
2. Leicester 27 25 21 22 19 35
EAST OF ENGLAND(000s of visitors)
2010 2011 2012 2013 2014 2015
1. Cambridge 128 106 121 126 130 109
2. Norwich 26 22 24 23 37 34
3. Ipswich 12 12 15 26 9 20
N.B. Only towns shown are those recording 20,000 or more visitors in 2015. Generally, numbers within small towns are based on small sample sizes, so shouldbe looked at indicatively i.e. general sizes and trends rather than year-on-year changes
Volume, value & profile
Top towns stayed in by overseas visitors on holiday trips - by region (4)Source: IPS
NB. IPS measures people who have ‘stayed in’ a town rather than ‘visited’
28
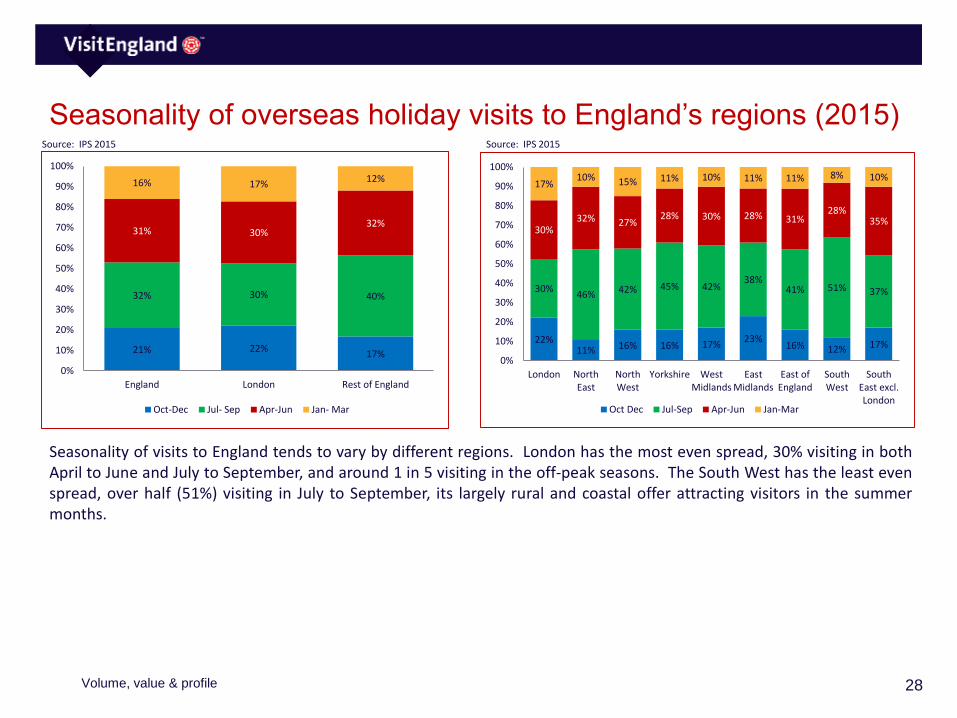
Seasonality of overseas holiday visits to England’s regions (2015)
Seasonality of visits to England tends to vary by different regions. London has the most even spread, 30% visiting in bothApril to June and July to September, and around 1 in 5 visiting in the off-peak seasons. The South West has the least evenspread, over half (51%) visiting in July to September, its largely rural and coastal offer attracting visitors in the summermonths.
Source: IPS 2015 Source: IPS 2015
21% 22%17%
32% 30% 40%
31% 30%32%
16% 17%12%
0%
10%
20%
30%
40%
50%
60%
70%
80%
90%
100%
England London Rest of England
Oct-Dec Jul- Sep Apr-Jun Jan- Mar
22%11% 16% 16% 17%
23%16% 12% 17%
30%46% 42% 45% 42%
38%41% 51% 37%
30%32% 27%
28% 30% 28% 31%28%
35%
17%10% 15% 11% 10% 11% 11% 8% 10%
0%
10%
20%
30%
40%
50%
60%
70%
80%
90%
100%
London NorthEast
NorthWest
Yorkshire WestMidlands
EastMidlands
East ofEngland
SouthWest
SouthEast excl.London
Oct Dec Jul-Sep Apr-Jun Jan-Mar
Volume, value & profile
29
Seasonality of overseas holiday visits by target market (2015)
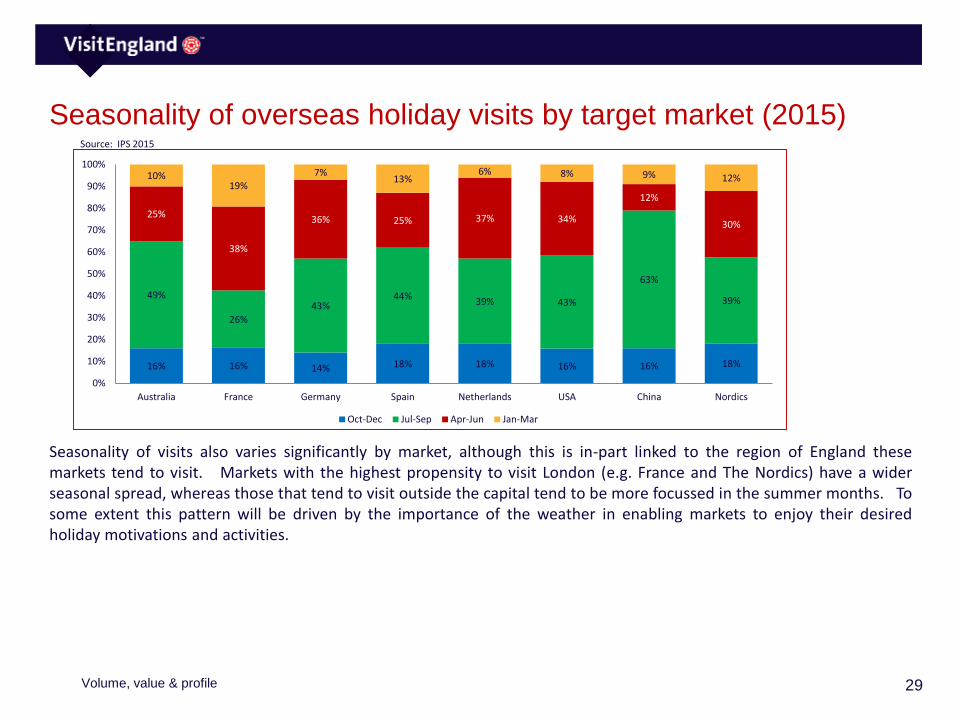
Seasonality of visits also varies significantly by market, although this is in-part linked to the region of England thesemarkets tend to visit. Markets with the highest propensity to visit London (e.g. France and The Nordics) have a widerseasonal spread, whereas those that tend to visit outside the capital tend to be more focussed in the summer months. Tosome extent this pattern will be driven by the importance of the weather in enabling markets to enjoy their desiredholiday motivations and activities.
Source: IPS 2015
16% 16% 14% 18% 18% 16% 16% 18%
49%
26%
43%44%
39% 43%
63%
39%
25%
38%
36% 25% 37% 34%
12%
30%
10%19%
7%13%
6% 8% 9% 12%
0%
10%
20%
30%
40%
50%
60%
70%
80%
90%
100%
Australia France Germany Spain Netherlands USA China Nordics
Oct-Dec Jul-Sep Apr-Jun Jan-Mar
Volume, value & profile

30
Duration of overseas holiday visits to England
As discussed earlier in this report, the average length of overseas holidays to England has steadily declined since 2002. Toan extent, this has been driven by the changing composition of short haul vs. long haul visitors i.e. of the eight targetmarkets under consideration within this report, the three long haul markets (USA, Australia, China) represented 40% of allinbound trips in 2002. By 2015, this had fallen to just 24% - average length of stay among inbound visitors naturallydeclining as a result of this shift.
This pattern is consistent in holidays to London and to the Rest of England. Holidays to London, either as part of a broaderholiday or as a single destination trip tend to be shorter, on average 4.9 days in 2015, holidays to the Rest of Englandlonger at 6.9 days in 2015.
Source: IPS 2015 Source: IPS
40% 43%
25%
41% 40%
39%
13% 12%
23%
6% 5%13%
0%
10%
20%
30%
40%
50%
60%
70%
80%
90%
100%
England London Rest of England
1-3 nights 4-7 nights 8-14 nights 15+ nights
Duration of stay in each area of England (2015)
7.4
6.9 6.8 6.6
6.8
6.4 6.5 6.2 6.2
6.0 6.1 6.1 5.9 5.9
5.7 5.4 5.4 5.4 5.3
5.1 5.1 5.0 5.1 4.9 4.9 5.0
4.9 4.9
8.3
7.8 7.7
7.4
8.2
7.6 7.8
7.2
7.5 7.2
7.5
7.1 6.9 6.9
4.0
4.5
5.0
5.5
6.0
6.5
7.0
7.5
8.0
8.5
9.0
2002 2003 2004 2005 2006 2007 2008 2009 2010 2011 2012 2013 2014 2015
England London Rest of England
Average number of nights stayed in each area of England
Volume, value & profile
31
Duration of overseas holiday visits to England – by target market (2015)
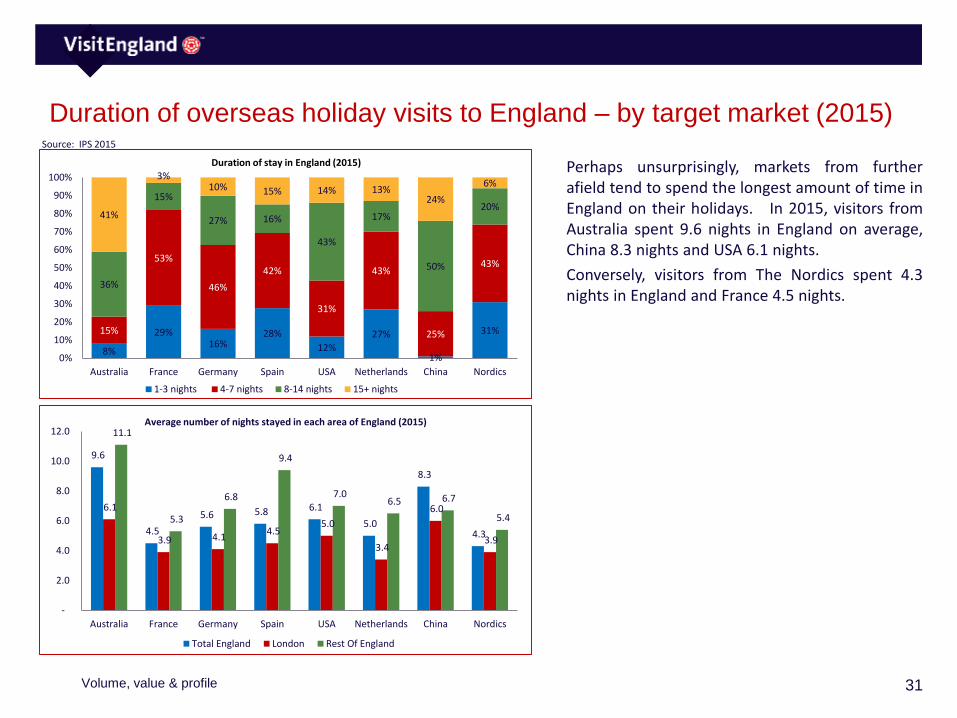
Perhaps unsurprisingly, markets from furtherafield tend to spend the longest amount of time inEngland on their holidays. In 2015, visitors fromAustralia spent 9.6 nights in England on average,China 8.3 nights and USA 6.1 nights.
Conversely, visitors from The Nordics spent 4.3nights in England and France 4.5 nights.
Source: IPS 2015
8%
29%16%
28%
12%
27%
1%
31%15%
53%
46%
42%
31%
43%
25%
43%
36%
15%
27% 16%
43%
17%
50%
20%41%
3%10% 15% 14% 13%
24%
6%
0%
10%
20%
30%
40%
50%
60%
70%
80%
90%
100%
Australia France Germany Spain USA Netherlands China Nordics
1-3 nights 4-7 nights 8-14 nights 15+ nights
Duration of stay in England (2015)
9.6
4.5
5.6 5.8 6.1
5.0
8.3
4.3
6.1
3.9 4.1 4.5
5.0
3.4
6.0
3.9
11.1
5.3
6.8
9.4
7.0 6.5 6.7
5.4
-
2.0
4.0
6.0
8.0
10.0
12.0
Australia France Germany Spain USA Netherlands China Nordics
Average number of nights stayed in each area of England (2015)
Total England London Rest Of England
Volume, value & profile
32
Gender profile of visitors to the UK by target market (2015)
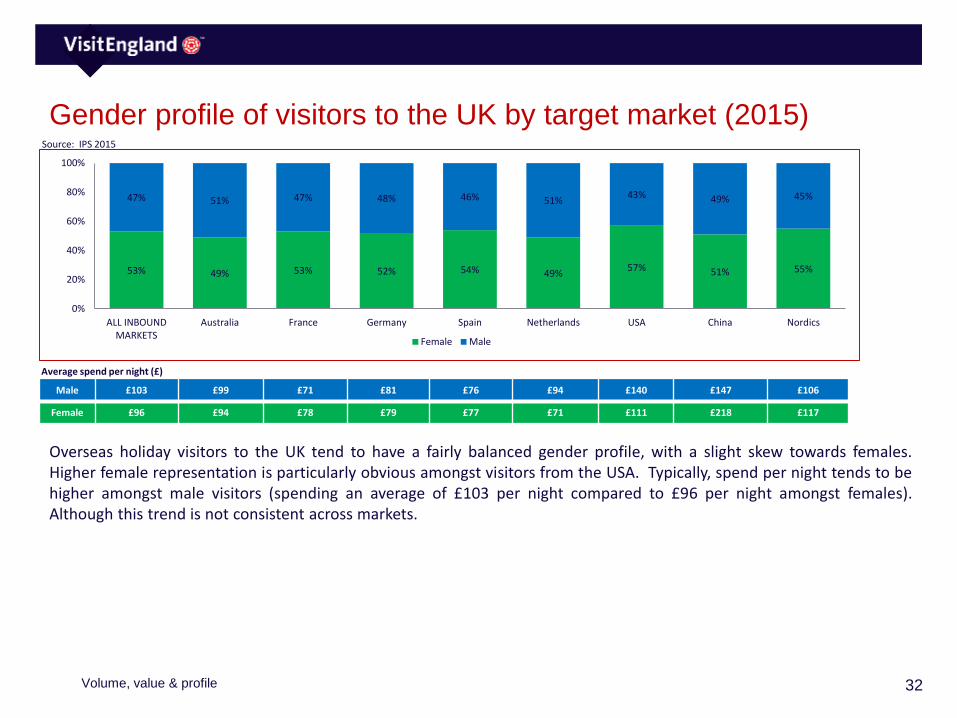
Overseas holiday visitors to the UK tend to have a fairly balanced gender profile, with a slight skew towards females.Higher female representation is particularly obvious amongst visitors from the USA. Typically, spend per night tends to behigher amongst male visitors (spending an average of £103 per night compared to £96 per night amongst females).Although this trend is not consistent across markets.
Source: IPS 2015
53% 49% 53% 52% 54% 49%57% 51% 55%
47% 51% 47% 48% 46% 51%43% 49% 45%
0%
20%
40%
60%
80%
100%
ALL INBOUNDMARKETS
Australia France Germany Spain Netherlands USA China Nordics
Female Male
Male £103 £99 £71 £81 £76 £94 £140 £147 £106
Female £96 £94 £78 £79 £77 £71 £111 £218 £117
Average spend per night (£)
Volume, value & profile
33
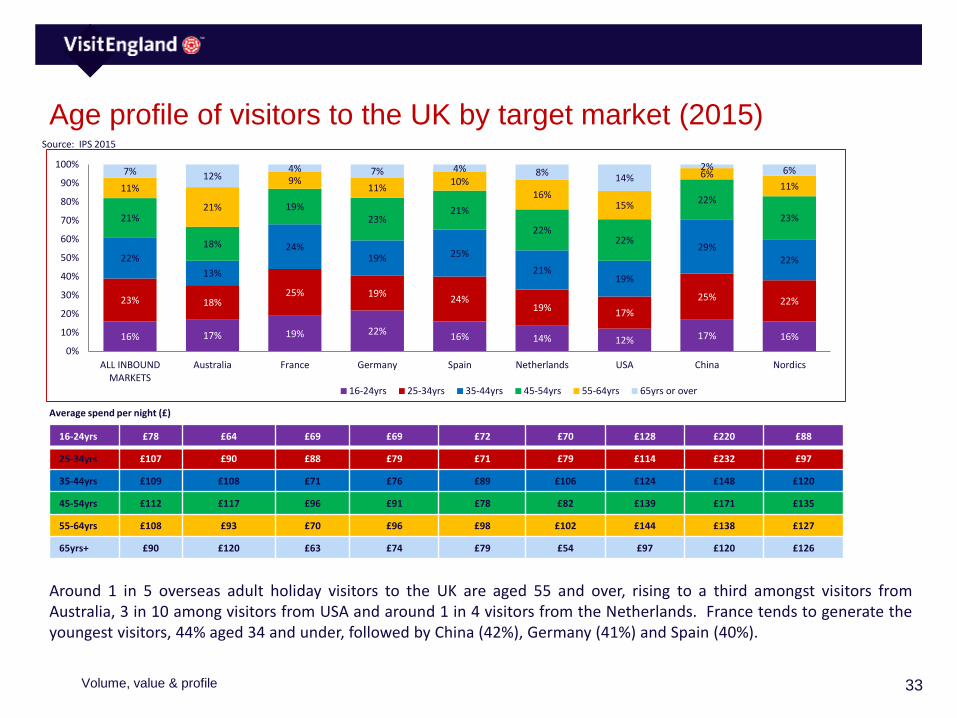
Age profile of visitors to the UK by target market (2015)
Around 1 in 5 overseas adult holiday visitors to the UK are aged 55 and over, rising to a third amongst visitors fromAustralia, 3 in 10 among visitors from USA and around 1 in 4 visitors from the Netherlands. France tends to generate theyoungest visitors, 44% aged 34 and under, followed by China (42%), Germany (41%) and Spain (40%).
Source: IPS 2015
Average spend per night (£)
16% 17% 19% 22%16% 14% 12% 17% 16%
23% 18%25% 19%
24%19% 17%
25% 22%
22%
13%
24%19% 25%
21%19%
29%22%
21%
18%
19%23%
21%
22%22%
22%
23%
11%
21%
9%11%
10%16%
15%
6%11%
7% 12%4% 7% 4% 8%
14%2% 6%
0%
10%
20%
30%
40%
50%
60%
70%
80%
90%
100%
ALL INBOUNDMARKETS
Australia France Germany Spain Netherlands USA China Nordics
16-24yrs 25-34yrs 35-44yrs 45-54yrs 55-64yrs 65yrs or over
16-24yrs £78 £64 £69 £69 £72 £70 £128 £220 £88
25-34yrs £107 £90 £88 £79 £71 £79 £114 £232 £97
35-44yrs £109 £108 £71 £76 £89 £106 £124 £148 £120
45-54yrs £112 £117 £96 £91 £78 £82 £139 £171 £135
55-64yrs £108 £93 £70 £96 £98 £102 £144 £138 £127
65yrs+ £90 £120 £63 £74 £79 £54 £97 £120 £126
Volume, value & profile
34
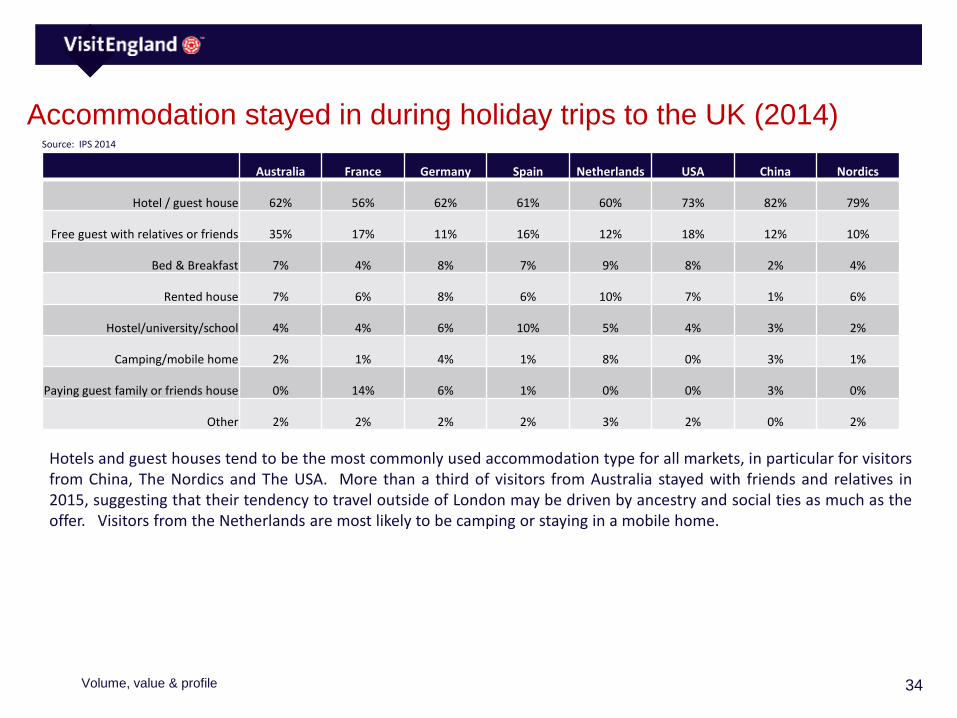
Accommodation stayed in during holiday trips to the UK (2014)
Australia France Germany Spain Netherlands USA China Nordics
Hotel / guest house 62% 56% 62% 61% 60% 73% 82% 79%
Free guest with relatives or friends 35% 17% 11% 16% 12% 18% 12% 10%
Bed & Breakfast 7% 4% 8% 7% 9% 8% 2% 4%
Rented house 7% 6% 8% 6% 10% 7% 1% 6%
Hostel/university/school 4% 4% 6% 10% 5% 4% 3% 2%
Camping/mobile home 2% 1% 4% 1% 8% 0% 3% 1%
Paying guest family or friends house 0% 14% 6% 1% 0% 0% 3% 0%
Other 2% 2% 2% 2% 3% 2% 0% 2%
Hotels and guest houses tend to be the most commonly used accommodation type for all markets, in particular for visitorsfrom China, The Nordics and The USA. More than a third of visitors from Australia stayed with friends and relatives in2015, suggesting that their tendency to travel outside of London may be driven by ancestry and social ties as much as theoffer. Visitors from the Netherlands are most likely to be camping or staying in a mobile home.
Source: IPS 2014
Volume, value & profile
35
Activities and themes as motivators
Data based on a combination of Anholt GfK Nations Brand Index and BDRC Continental’s Global Tourism Monitor (both in2015)
36
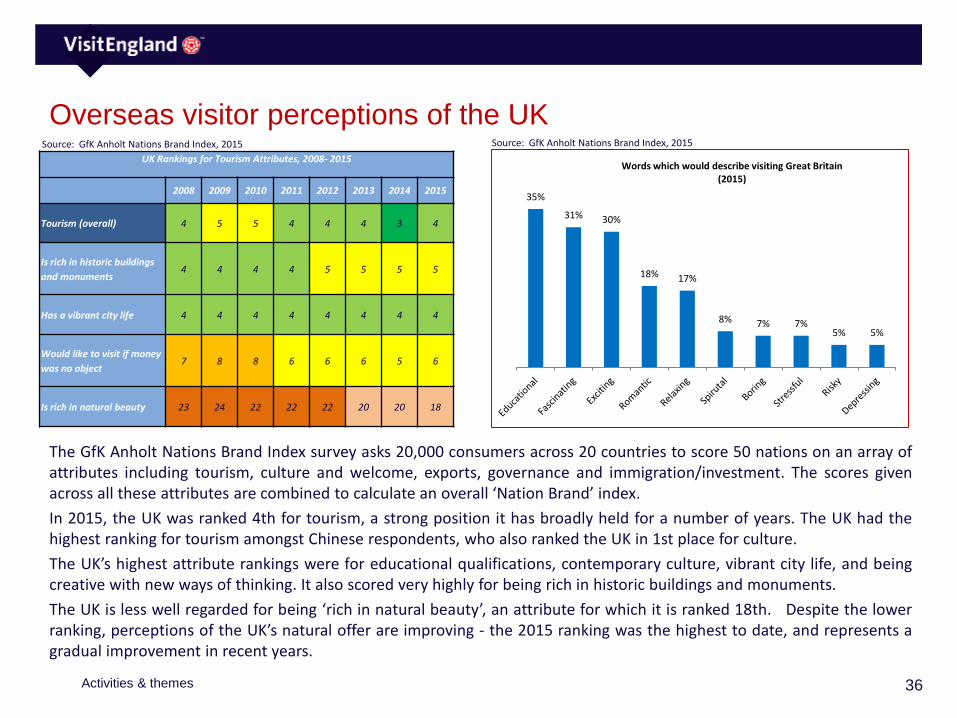
Overseas visitor perceptions of the UK
The GfK Anholt Nations Brand Index survey asks 20,000 consumers across 20 countries to score 50 nations on an array ofattributes including tourism, culture and welcome, exports, governance and immigration/investment. The scores givenacross all these attributes are combined to calculate an overall ‘Nation Brand’ index.
In 2015, the UK was ranked 4th for tourism, a strong position it has broadly held for a number of years. The UK had thehighest ranking for tourism amongst Chinese respondents, who also ranked the UK in 1st place for culture.
The UK’s highest attribute rankings were for educational qualifications, contemporary culture, vibrant city life, and beingcreative with new ways of thinking. It also scored very highly for being rich in historic buildings and monuments.
The UK is less well regarded for being ‘rich in natural beauty’, an attribute for which it is ranked 18th. Despite the lowerranking, perceptions of the UK’s natural offer are improving - the 2015 ranking was the highest to date, and represents agradual improvement in recent years.
Source: GfK Anholt Nations Brand Index, 2015
UK Rankings for Tourism Attributes, 2008- 2015
2008 2009 2010 2011 2012 2013 2014 2015
Tourism (overall) 4 5 5 4 4 4 3 4
Is rich in historic buildings
and monuments4 4 4 4 5 5 5 5
Has a vibrant city life 4 4 4 4 4 4 4 4
Would like to visit if money
was no object7 8 8 6 6 6 5 6
Is rich in natural beauty 23 24 22 22 22 20 20 18
35%
31% 30%
18% 17%
8% 7% 7%5% 5%
Words which would describe visiting Great Britain(2015)
Source: GfK Anholt Nations Brand Index, 2015
Activities & themes

37
Motivations for taking a SHORT BREAK in England
fsffs
In 2015, BDRC Continental conducted a survey of16,800 interviews across 24 different countries tounderstand people’s motivations and experienceof visiting a wide range of holiday destinations, ofwhich England was included.
The data revealed some interesting trends, in partunderlining the perceptions of the UK revealed bythe Gfk Nations Brand Index.
Short breaks to England are more than likely thanaverage to be motivated by ‘seeing the mainsights’, outlining the country’s strong NationsBrand Index rating for ‘historic buildings andmonuments’. Also scoring higher than average isthe appeal of England’s local culture andshopping. Underlining England as a ‘doingholiday’ is a lower than average motivation ofvisiting to ‘rest mind or body’.
A holiday to England is less likely than average tobe motivated by ‘scenery/natural beauty’ and‘visiting beaches/coastal areas’, although theNations Brand Index implies that perceptions areimproving.
Source: BDRC Continental Global Tourism Intentions Monitor 2015
ANY REASONMOST IMPORTANT
REASON
EnglandAll World
DestinationsEngland
All World Destinations
ANY SIGHTSEEING 69% 60% 40% 35%
See main tourist sights /places of interest 48% 38% 27% 18%
Experience scenery / natural beauty 30% 37% 9% 13%
See less well known sights / places of interest 25% 22% 5% 5%
ANY ACTIVITY / EXPERIENCES 72% 70% 37% 38%
Experience the local culture 40% 33% 10% 9%
Experience or learn something new 30% 25% 7% 7%
Go shopping 27% 21% 7% 6%
Experience some adventure or thrill 13% 15% 4% 3%
Go to a specific event 13% 10% 4% 2%
Improve physical fitness / body 7% 10% 3% 4%
Taste the local cuisine 19% 29% 1% 4%
Take part in hobby 9% 10% - 2%
ANY PEOPLE 37% 26% 16% 8%
Meet new people 20% 15% 12% 7%
Visit friends/ relatives 22% 14% 4% 2%
ANY REST / RELAXATION 30% 47% 6% 17%
Rest mind or body 19% 28% 4% 7%
Do as little as possible 10% 13% 1% 2%
Visit beaches / coastal areas 11% 21% - 5%
Guaranteed sun / good weather 8% 16% - 3%
Activities & themes
38
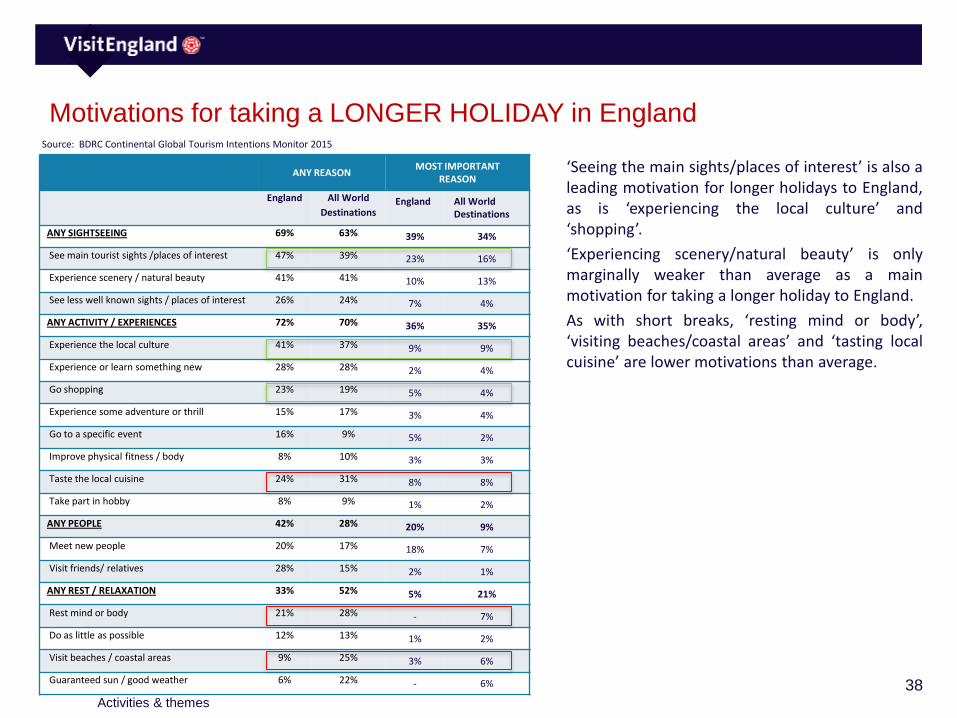
Motivations for taking a LONGER HOLIDAY in England
fsffs
‘Seeing the main sights/places of interest’ is also aleading motivation for longer holidays to England,as is ‘experiencing the local culture’ and‘shopping’.
‘Experiencing scenery/natural beauty’ is onlymarginally weaker than average as a mainmotivation for taking a longer holiday to England.
As with short breaks, ‘resting mind or body’,‘visiting beaches/coastal areas’ and ‘tasting localcuisine’ are lower motivations than average.
Source: BDRC Continental Global Tourism Intentions Monitor 2015
ANY REASONMOST IMPORTANT
REASON
England All World
DestinationsEngland All World
Destinations
ANY SIGHTSEEING 69% 63% 39% 34%
See main tourist sights /places of interest 47% 39% 23% 16%
Experience scenery / natural beauty 41% 41% 10% 13%
See less well known sights / places of interest 26% 24% 7% 4%
ANY ACTIVITY / EXPERIENCES 72% 70% 36% 35%
Experience the local culture 41% 37% 9% 9%
Experience or learn something new 28% 28% 2% 4%
Go shopping 23% 19% 5% 4%
Experience some adventure or thrill 15% 17% 3% 4%
Go to a specific event 16% 9% 5% 2%
Improve physical fitness / body 8% 10% 3% 3%
Taste the local cuisine 24% 31% 8% 8%
Take part in hobby 8% 9% 1% 2%
ANY PEOPLE 42% 28% 20% 9%
Meet new people 20% 17% 18% 7%
Visit friends/ relatives 28% 15% 2% 1%
ANY REST / RELAXATION 33% 52% 5% 21%
Rest mind or body 21% 28% - 7%
Do as little as possible 12% 13% 1% 2%
Visit beaches / coastal areas 9% 25% 3% 6%
Guaranteed sun / good weather 6% 22% - 6%
Activities & themes

39
Locations where overseas markets would like to stay in the UK
According to the Nations Brand Index, overseas markets are most likely to want to stay in the capital city and historicBritish cities on a holiday in the UK. Respondents from France are most likely to show a desire to stay in the capital city.The China holiday market is most likely to want to stay in a historic British city, traditional English countryside and coastalareas of Britain pointing to future potential for this market.
Source: GfK Anholt Nations Brand Index, 2013
45%
26%
19%
46%
37%
21%
28% 29%
52%
16%20%
34% 33%31%
20%
34%
48%
18% 17%
35%32% 32%
26%30%
40%
30%
22%
44%
39%
27% 27% 26%
46%
29%
24%
52%
45% 45%
20%16%
46%
27%24%
40%
32% 31%
21%
27%
0%
10%
20%
30%
40%
50%
60%
Capital City Interesting city/townan hour from London
Large British cities Historic British cities Traditional 'Englishcountryside'
Coastal areas of Britain Rural areas of Britian Remote ares of Britain
Locations that respondents would like to stay in (% choosing option)
Australia France Germany USA China All
Activities & themes
40
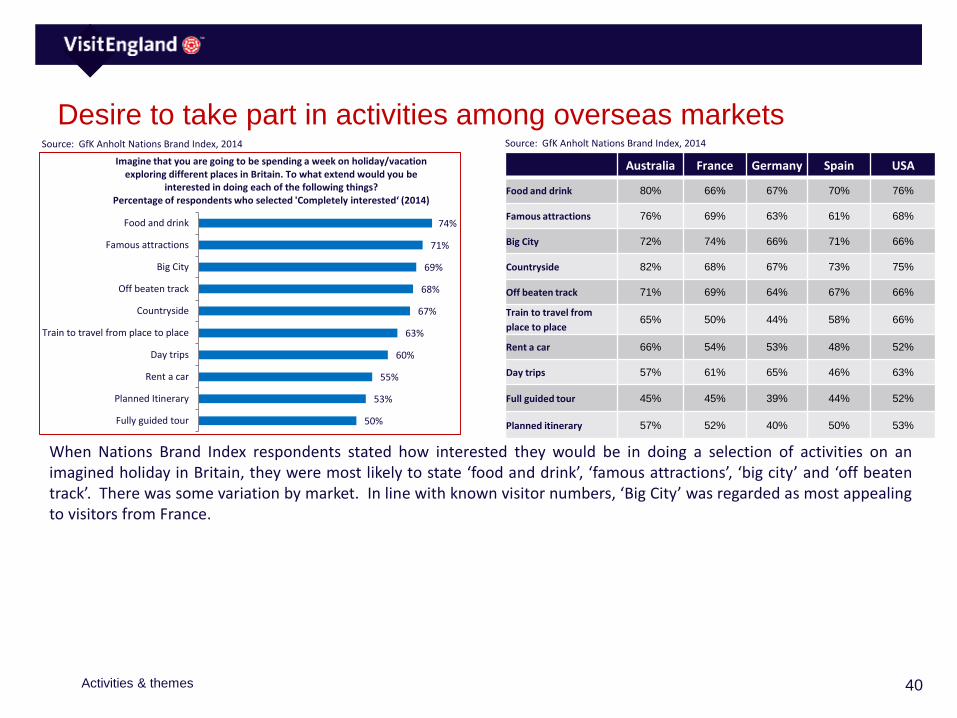
Desire to take part in activities among overseas markets
When Nations Brand Index respondents stated how interested they would be in doing a selection of activities on animagined holiday in Britain, they were most likely to state ‘food and drink’, ‘famous attractions’, ‘big city’ and ‘off beatentrack’. There was some variation by market. In line with known visitor numbers, ‘Big City’ was regarded as most appealingto visitors from France.
Source: GfK Anholt Nations Brand Index, 2014 Source: GfK Anholt Nations Brand Index, 2014
50%
53%
55%
60%
63%
67%
68%
69%
71%
74%
Fully guided tour
Planned Itinerary
Rent a car
Day trips
Train to travel from place to place
Countryside
Off beaten track
Big City
Famous attractions
Food and drink
Imagine that you are going to be spending a week on holiday/vacation exploring different places in Britain. To what extend would you be
interested in doing each of the following things?Percentage of respondents who selected 'Completely interested‘ (2014)
Australia France Germany Spain USA
Food and drink 80% 66% 67% 70% 76%
Famous attractions 76% 69% 63% 61% 68%
Big City 72% 74% 66% 71% 66%
Countryside 82% 68% 67% 73% 75%
Off beaten track 71% 69% 64% 67% 66%
Train to travel from
place to place65% 50% 44% 58% 66%
Rent a car 66% 54% 53% 48% 52%
Day trips 57% 61% 65% 46% 63%
Full guided tour 45% 45% 39% 44% 52%
Planned itinerary 57% 52% 40% 50% 53%
Activities & themes

41
Activities conducted in the UK on holiday (2011)
In 2011, VisitBritain added supplementary questions to the International Passenger Survey on specific activities overseasvisitors conducted in the UK on their holiday.
In line with motivations and perceptions, the activities conducted centred on the UK’s sight-seeing offer. Of the activitiesmentioned, 4 of the top 6 were either cultural venues (castles/historic houses, museums/galleries and religious buildings)or parks and gardens. Shopping and visits to the pub also featured highly.
The UK’s rural offer, be it visits to the countryside/villages or going to the coast/beaches featured further down the list.
Source: IPS 2011
71%
54%
50%
48%
43%
35%
22%
15%
14%
14%
4%
4%
3%
Went Shopping
Parks or Gardens
Went to the pub
Castles/Historic houses
Museums/ Galleries
Religious buildings
Went to countryside/ villages
Went to coast or beaches
Theatre/ Musical
Went to bars/ nightclubs
Attended a festival
Went to a live sport event
Took part in sports activities
Activities & themes
42
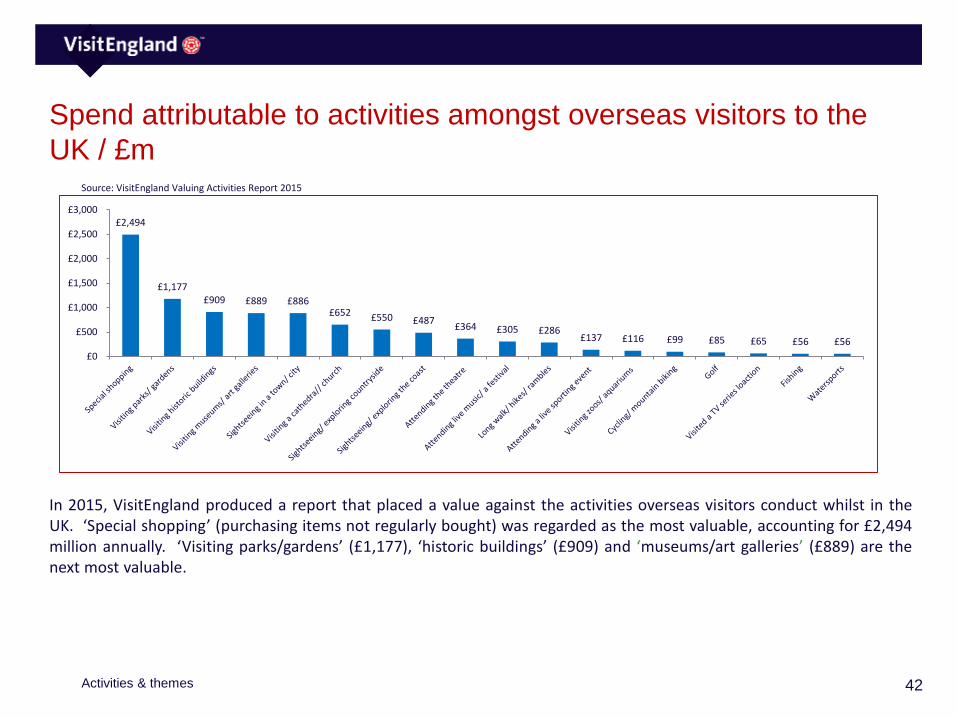
Spend attributable to activities amongst overseas visitors to the
UK / £m
In 2015, VisitEngland produced a report that placed a value against the activities overseas visitors conduct whilst in theUK. ‘Special shopping’ (purchasing items not regularly bought) was regarded as the most valuable, accounting for £2,494million annually. ‘Visiting parks/gardens’ (£1,177), ‘historic buildings’ (£909) and ‘museums/art galleries’ (£889) are thenext most valuable.
Source: VisitEngland Valuing Activities Report 2015
£2,494
£1,177 £909 £889 £886
£652 £550 £487 £364 £305 £286
£137 £116 £99 £85 £65 £56 £56
£0
£500
£1,000
£1,500
£2,000
£2,500
£3,000
Activities & themes
43
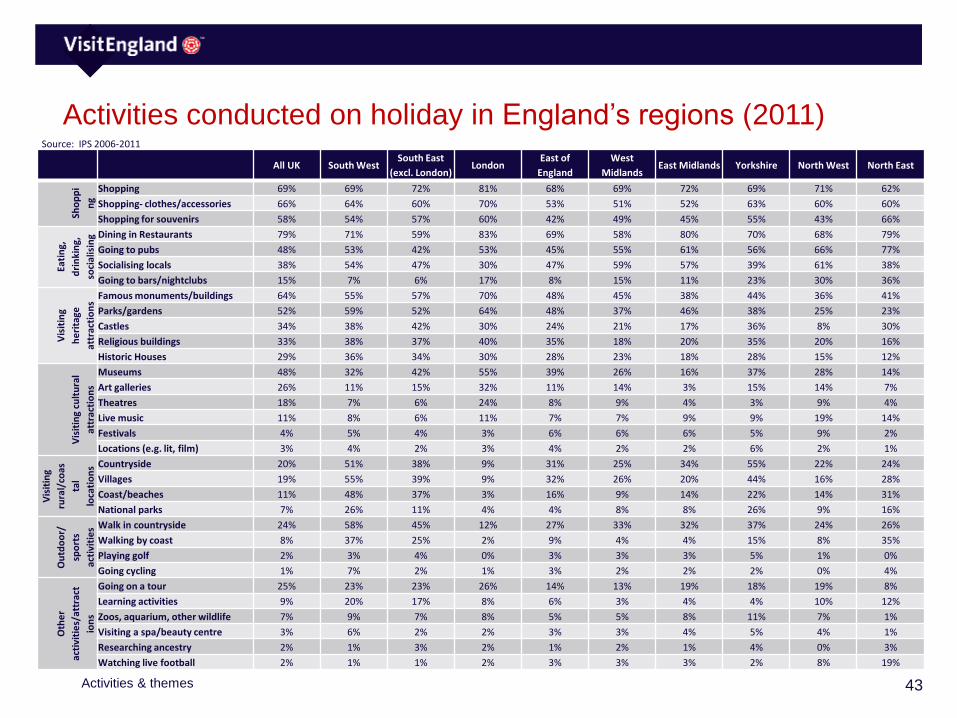
Activities conducted on holiday in England’s regions (2011)Source: IPS 2006-2011
All UK South WestSouth East
(excl. London)London
East of
England
West
MidlandsEast Midlands Yorkshire North West North East
Sho
pp
i
ng
Shopping 69% 69% 72% 81% 68% 69% 72% 69% 71% 62%
Shopping- clothes/accessories 66% 64% 60% 70% 53% 51% 52% 63% 60% 60%
Shopping for souvenirs 58% 54% 57% 60% 42% 49% 45% 55% 43% 66%
Eati
ng,
dri
nki
ng,
soci
alis
ing Dining in Restaurants 79% 71% 59% 83% 69% 58% 80% 70% 68% 79%
Going to pubs 48% 53% 42% 53% 45% 55% 61% 56% 66% 77%
Socialising locals 38% 54% 47% 30% 47% 59% 57% 39% 61% 38%
Going to bars/nightclubs 15% 7% 6% 17% 8% 15% 11% 23% 30% 36%
Vis
itin
g
he
rita
ge
attr
acti
on
s
Famous monuments/buildings 64% 55% 57% 70% 48% 45% 38% 44% 36% 41%
Parks/gardens 52% 59% 52% 64% 48% 37% 46% 38% 25% 23%
Castles 34% 38% 42% 30% 24% 21% 17% 36% 8% 30%
Religious buildings 33% 38% 37% 40% 35% 18% 20% 35% 20% 16%
Historic Houses 29% 36% 34% 30% 28% 23% 18% 28% 15% 12%
Vis
itin
g cu
ltu
ral
attr
acti
on
s
Museums 48% 32% 42% 55% 39% 26% 16% 37% 28% 14%
Art galleries 26% 11% 15% 32% 11% 14% 3% 15% 14% 7%
Theatres 18% 7% 6% 24% 8% 9% 4% 3% 9% 4%
Live music 11% 8% 6% 11% 7% 7% 9% 9% 19% 14%
Festivals 4% 5% 4% 3% 6% 6% 6% 5% 9% 2%
Locations (e.g. lit, film) 3% 4% 2% 3% 4% 2% 2% 6% 2% 1%
Vis
itin
g
rura
l/co
as
tal
loca
tio
ns Countryside 20% 51% 38% 9% 31% 25% 34% 55% 22% 24%
Villages 19% 55% 39% 9% 32% 26% 20% 44% 16% 28%
Coast/beaches 11% 48% 37% 3% 16% 9% 14% 22% 14% 31%
National parks 7% 26% 11% 4% 4% 8% 8% 26% 9% 16%
Ou
tdo
or/
spo
rts
acti
viti
es Walk in countryside 24% 58% 45% 12% 27% 33% 32% 37% 24% 26%
Walking by coast 8% 37% 25% 2% 9% 4% 4% 15% 8% 35%
Playing golf 2% 3% 4% 0% 3% 3% 3% 5% 1% 0%
Going cycling 1% 7% 2% 1% 3% 2% 2% 2% 0% 4%
Oth
er
acti
viti
es/
attr
act
ion
s
Going on a tour 25% 23% 23% 26% 14% 13% 19% 18% 19% 8%
Learning activities 9% 20% 17% 8% 6% 3% 4% 4% 10% 12%
Zoos, aquarium, other wildlife 7% 9% 7% 8% 5% 5% 8% 11% 7% 1%
Visiting a spa/beauty centre 3% 6% 2% 2% 3% 3% 4% 5% 4% 1%
Researching ancestry 2% 1% 3% 2% 1% 2% 1% 4% 0% 3%
Watching live football 2% 1% 1% 2% 3% 3% 3% 2% 8% 19%
Activities & themes
44
Booking and consuming travel
Data taken predominantly from International Passenger Survey (IPS) data and BDRC Continental’s Global Tourism Monitor

45
How overseas visitors hear about England (2015)
BDRC’s Global Tourism Monitor demonstrates theimportance of features, travel guides and peerrecommendations (especially via social media) indriving awareness of England as a destination. Touroperators/travel agents also have a role to play.
Advertising directly on TV, posters, radios ornewspapers are of further importance.
Source: BDRC Continental Global Tourism Monitor 2015
How recent visitors heard about England
Travel guides/features 54%
Peer recommendations 50%
Tourism Board 48%
Tour operator/travel agent 31%
Transport Carrier 21%
Other 16%
44%
17%
11%
14%
15%
11%
4%
31%
18%
16%
8%
14%
12%
36%
21%
13%
13%
3%
Articles / features on TV, radio or in newspapers
Travel guide websites
Travel guidebooks
Advertising by a tour operator / travel agent
Travel agent/tour operator websites
Tour operator brochures / leaflets
Talking to tour operator / travel agent staff
Advertising directly on TV, posters, radio, or newspapers
Tourism board/ destination websites
Content by destinations/tourism boards on socialnetworking sites
Other brochures/ leaflets about destination
Advertising by a transport carrier
Transport carrier websites
Talking to friends/ relatives
Posts/pictures by friends or relatives on socialnetworking sites
Online review websites e.g. TripAdvisor
Hotel / resort websites
Other sources
AN
Y TR
AV
ELG
UID
ES /
FEA
TUR
ESA
NY
TOU
R O
PER
ATO
R/T
RA
VE
L A
GEN
TA
NY
TOU
RIS
M B
OA
RD
AN
YTR
AN
SPO
RT
CA
RR
IER
AN
Y P
EER
REC
OM
MEN
DA
TIO
NS
AN
Y O
THER
Booking and consuming travel
Source: BDRC Continental Global Tourism Monitor 2015

46
Transport booking method for holiday trips to the UK (2012)
The majority (72%) of overseas holiday visitors to the UK booked their transport directly with their travel operator, arounda quarter (26%) doing so through a travel agent.
Booking methods vary according to market, long-haul destinations more likely to book via a travel agent, 32% of visitorsfrom the USA doing so, 49% from Australia and 64% from China.
NB: Data is from 2012 and trends may have changed since then.
Source: IPS 2012
72%
50%
77% 75%86% 91%
66%
36%
26%
49%
21% 23%13% 7%
32%
64%
ALL INBOUNDMARKETS
Australia France Germany Spain Netherlands USA China
Booked directly with airline / train / ferry operator Booked through a travel agent Don't know / someone else booked
Booking and consuming travel
47
Accommodation booking behaviour for holiday trips to GB (2012)
Unsurprisingly, accommodation booking behaviour follows a similar pattern to transport booking. The majority (66%)booked directly with their accommodation provider, but less so amongst visitors from the USA (62%), Australia (59%) andChina (just 37%).
Source: IPS 2012
66%59%
71% 67%77%
65% 62%
37%
32%39%
27% 30%21%
29% 36%
63%
6%
ALL INBOUNDMARKETS
Australia France Germany Spain Netherlands USA China
Booked directly with accomodation provider Booked through a travel agent Someone else booked/I don’t know
Booking and consuming travel
48
Hooks and barriers for travelling beyond London
This section is based upon a comprehensive 2013 VisitBritain study into why many visitors to Britain do not travel beyondLondon – what the barriers are and what attracts those that do go beyond London to do so.
Research was undertaken in four established markets (France, Germany, Norway and USA). Please bear in mind that findingsreflect views and behaviour in these markets only which may differ to those of other markets (especially emerging markets).
49
Headline findingsSource: London and Beyond report 2013
• London remains the key draw within Britain, even for those who have visited before, but many would want to see other places in Britain as well as London again when they return. ‘London Plus’ appeals to the majority.
• Knowledge of destinations drives desire, but knowledge of British destinations other than London can be low, although this varies notably by market. • Those who visit London often want to ‘see’ London/ ‘do the sights’ rather than to have a particular type of holiday experience. This is different from
behaviour when choosing competitor destinations, and does not reflect the growing importance of ‘experiences’. • The most common practical barriers to going outside London were concerns about transport/ access. • Most common draws for going outside of London were heritage variety, countryside, unique places to stay and the British people. • Travel agents remain important for a minority, especially in Germany and the US, but the majority in each market reported booking independently, with
Britain particularly attracting independent travellers. However, there is a gap for tours, packages and agents, or at least suggested itineraries, to enable trips outside London which many lack the knowledge to make the most of.
• There is no single ‘ideal’ itinerary when combining London with other destinations (‘London Plus’), but most are willing to travel 2-3 hours to/ between destinations, preferably by train.
Top Ten Tips for promoting ‘London Plus’ 1. Do not over-estimate geographical knowledge of Britain, or assume potential visitors will be aware of even high- profile destinations outside London.2. Focus on the heritage, variety and countryside outside as well as unique places to stay and the British people . 3. Make sure the ‘experiences’ the destination offers (e.g. luxurious, adventurous) are reflected, and indicate how people will feel (e.g. relaxed) when
there, as well as the attractions/ destinations themselves. 4. Do the work for visitors by putting together set itineraries, illustrating the ‘packages’ they could put together themselves.5. Remind of enjoyment of previous trips to London and include London in suggested itineraries but build on appeal by showing that Britain can offer
more than our capital , world famous headline sights on a second visit. 6. Showcase opportunities to relax, enjoy good food and unique/ unusual experiences and places to stay. 7. Avoid inadvertently re-enforcing out of date stereotypes of destinations8. Compare Britain's offer favourably with similar, well-known ‘regional’ offers in other countries (e.g. Cotswolds/ Tuscany, York/ Seville, Scottish
Highlands/ Swiss Alps, Cornish coast/ Spanish Costas) . Flag unique or ‘off-the-beaten-track’ experiences in Britain, away from mass tourist hotspots.9. Avoid itineraries where driving/ hiring cars is essential (although in some markets this will appeal). Facilitate rail travel, e.g. highlight that booking trains
ahead reduces cost considerably, or suggest the use of a BritRail pass. 10. Show travel times rather than distances from London (or between destinations) by train. Remember for most visitors tolerance is 2-3 hours travel time
between destinations.
Beyond London – hooks & barriers
50
46%
46%
39%
29%
27%
26%
25%
25%
22%
22%
21%
19%
19%
17%
17%
Other places higher up the list to visit
Nervous about driving in UK
So much to do in London wouldn't have time
Don't know what there is to see
Don’t know what its like compared to London
More exciting places elsewhere in Europe as close
Don't know what to expect
Too expensive to travel
Wouldn't know what to do
Weather would put me off
No great urge to explore other parts
Wouldn't visit GB for a long time, but would need a long time
Other places worth going to are too far away from London
The best of Britain can be seen within London
Wouldn't know how to get outside of London
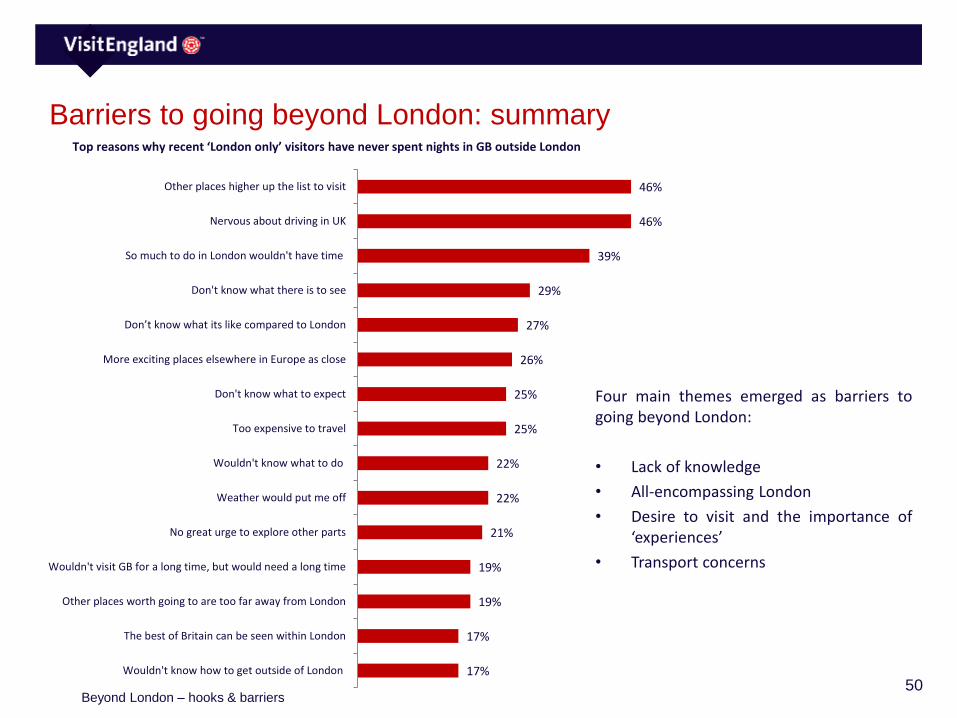
Barriers to going beyond London: summaryTop reasons why recent ‘London only’ visitors have never spent nights in GB outside London
Four main themes emerged as barriers togoing beyond London:
• Lack of knowledge
• All-encompassing London
• Desire to visit and the importance of‘experiences’
• Transport concerns
Beyond London – hooks & barriers
51
Barriers to going beyond London: themes (1)
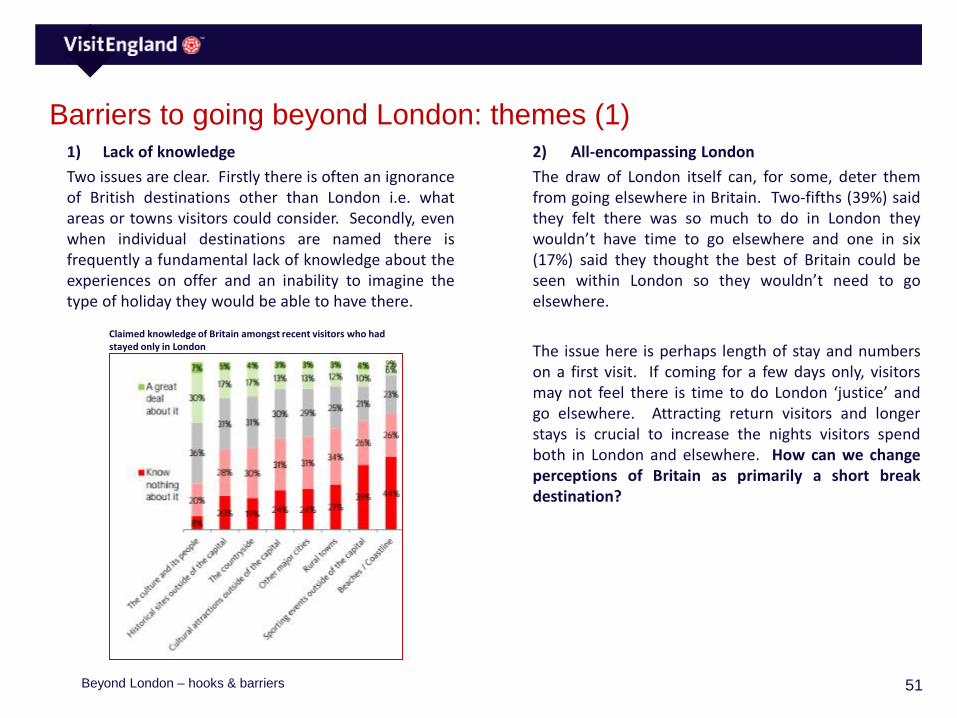
Claimed knowledge of Britain amongst recent visitors who had stayed only in London
1) Lack of knowledge
Two issues are clear. Firstly there is often an ignoranceof British destinations other than London i.e. whatareas or towns visitors could consider. Secondly, evenwhen individual destinations are named there isfrequently a fundamental lack of knowledge about theexperiences on offer and an inability to imagine thetype of holiday they would be able to have there.
2) All-encompassing London
The draw of London itself can, for some, deter themfrom going elsewhere in Britain. Two-fifths (39%) saidthey felt there was so much to do in London theywouldn’t have time to go elsewhere and one in six(17%) said they thought the best of Britain could beseen within London so they wouldn’t need to goelsewhere.
The issue here is perhaps length of stay and numberson a first visit. If coming for a few days only, visitorsmay not feel there is time to do London ‘justice’ andgo elsewhere. Attracting return visitors and longerstays is crucial to increase the nights visitors spendboth in London and elsewhere. How can we changeperceptions of Britain as primarily a short breakdestination?
Beyond London – hooks & barriers
52
Barriers to going beyond London: themes (2)
Importance of various holiday aspects and extent to which agree Britain offers
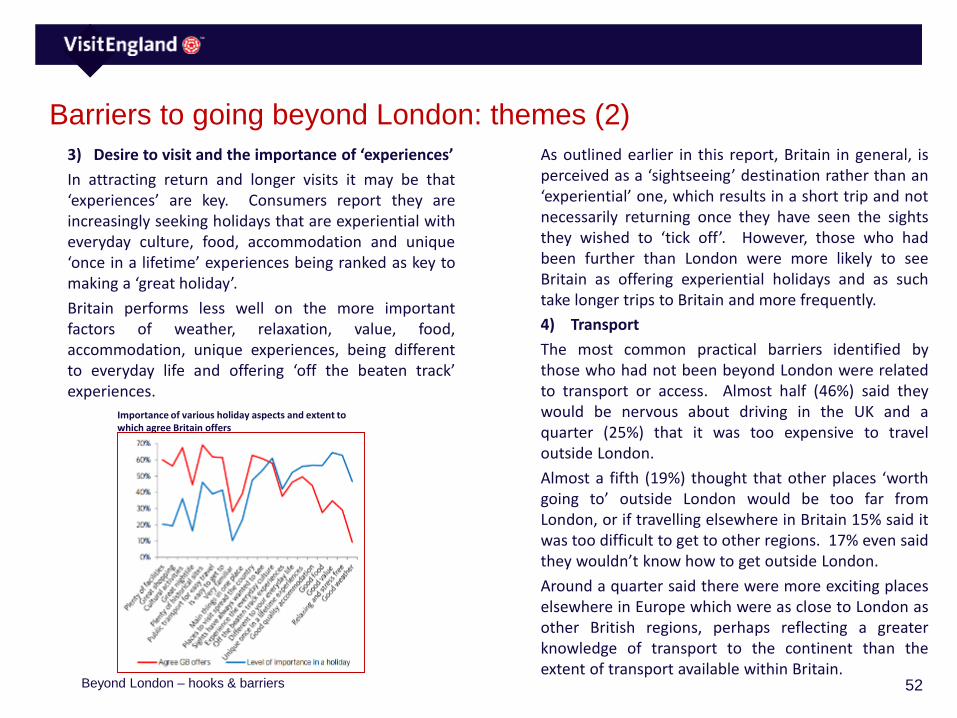
3) Desire to visit and the importance of ‘experiences’
In attracting return and longer visits it may be that‘experiences’ are key. Consumers report they areincreasingly seeking holidays that are experiential witheveryday culture, food, accommodation and unique‘once in a lifetime’ experiences being ranked as key tomaking a ‘great holiday’.
Britain performs less well on the more importantfactors of weather, relaxation, value, food,accommodation, unique experiences, being differentto everyday life and offering ‘off the beaten track’experiences.
4) Transport
The most common practical barriers identified bythose who had not been beyond London were relatedto transport or access. Almost half (46%) said theywould be nervous about driving in the UK and aquarter (25%) that it was too expensive to traveloutside London.
Almost a fifth (19%) thought that other places ‘worthgoing to’ outside London would be too far fromLondon, or if travelling elsewhere in Britain 15% said itwas too difficult to get to other regions. 17% even saidthey wouldn’t know how to get outside London.
Around a quarter said there were more exciting placeselsewhere in Europe which were as close to London asother British regions, perhaps reflecting a greaterknowledge of transport to the continent than theextent of transport available within Britain.
As outlined earlier in this report, Britain in general, isperceived as a ‘sightseeing’ destination rather than an‘experiential’ one, which results in a short trip and notnecessarily returning once they have seen the sightsthey wished to ‘tick off’. However, those who hadbeen further than London were more likely to seeBritain as offering experiential holidays and as suchtake longer trips to Britain and more frequently.
Beyond London – hooks & barriers
53
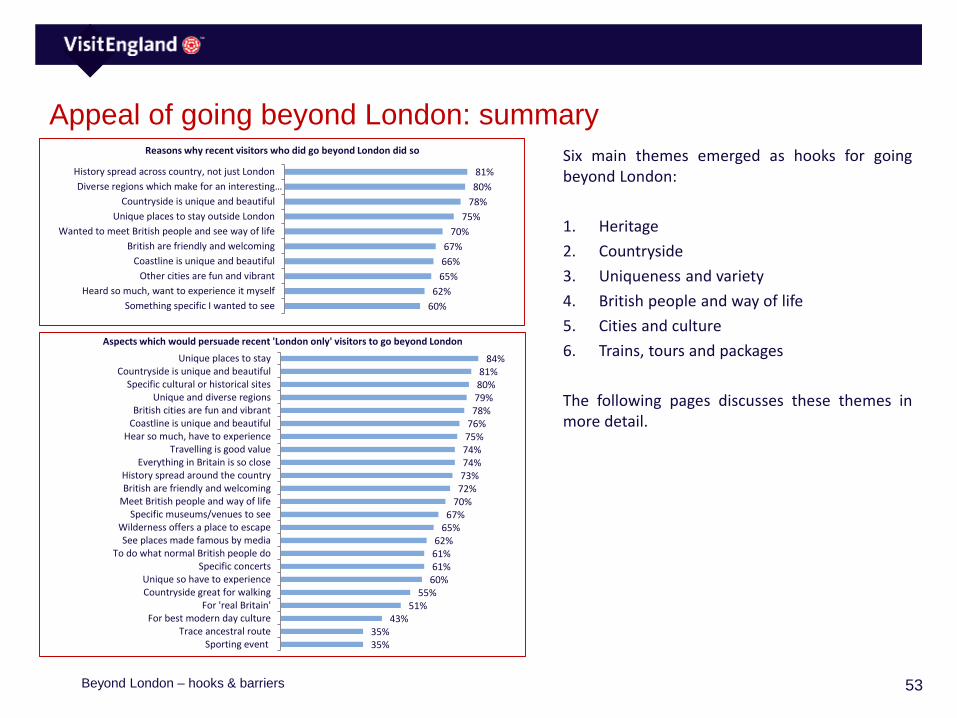
Appeal of going beyond London: summary
Six main themes emerged as hooks for goingbeyond London:
1. Heritage
2. Countryside
3. Uniqueness and variety
4. British people and way of life
5. Cities and culture
6. Trains, tours and packages
The following pages discusses these themes inmore detail.
81%
80%
78%
75%
70%
67%
66%
65%
62%
60%
History spread across country, not just London
Diverse regions which make for an interesting…
Countryside is unique and beautiful
Unique places to stay outside London
Wanted to meet British people and see way of life
British are friendly and welcoming
Coastline is unique and beautiful
Other cities are fun and vibrant
Heard so much, want to experience it myself
Something specific I wanted to see
Reasons why recent visitors who did go beyond London did so
84%81%80%79%78%
76%75%74%74%73%72%
70%67%
65%62%61%61%60%
55%51%
43%35%35%
Unique places to stayCountryside is unique and beautiful
Specific cultural or historical sitesUnique and diverse regions
British cities are fun and vibrantCoastline is unique and beautiful
Hear so much, have to experienceTravelling is good value
Everything in Britain is so closeHistory spread around the countryBritish are friendly and welcoming
Meet British people and way of lifeSpecific museums/venues to see
Wilderness offers a place to escapeSee places made famous by media
To do what normal British people doSpecific concerts
Unique so have to experienceCountryside great for walking
For 'real Britain'For best modern day culture
Trace ancestral routeSporting event
Aspects which would persuade recent 'London only' visitors to go beyond London
Beyond London – hooks & barriers
54
Appeal of going beyond London: themes (1)1) Heritage
History and heritage are strongly associated withBritain’s holiday offer and the most common reasonwhy those who went beyond London did so, given by81%, was because Britain has history spread across thecountry, not just in London.
When discussing heritage, ‘awe’ and ‘amazement’(especially those from the US) were common themesbut also it seems that there was a danger it couldseem a little flat if just about seeing / ticking off majorsites – it is important to get across the ‘experience’and the story behind a place.
3) Uniqueness and variety
Britain’s unique and varied nature is also appealing,with 80% of those who went beyond London sayingthey did so because Britain’s diverse regions make foran interesting holiday. Having unique places to stayaround the country was also a draw, a reason for 75%of those who had been outside London.
Amongst those who had not been outside London,unique places to stay was the most commonly citedaspect which would persuade them to do so, given by84%.
2) Countryside
Three-quarters (78%) of those going beyond Londongave Britain’s unique and beautiful countryside as areason for travel. Amongst those who had not beenoutside London, 81% said Britain’s countryside wouldpersuade them to do so – the second most popularfactor. Coastline also appealed (76%).
Countryside was a major lever to convey ‘unique,different, beautiful and relaxing. The ‘bucolic beauty’of southern England was mentioned although therewere concerns over access and how to get there.Coastline was generally less motivating, but Cornwalland South West were mentioned.
4) British people and way of life
Over two-thirds of those who went beyond Londonmentioned the British people as a reason for travellingoutside London. 70% wanted to meet the Britishpeople and see the British way of life and 67% becausethey were friendly and welcoming.
Amongst those who had only been to London, 49%had ‘lots of interest’ in culture and people outsideLondon and the idea of British people beingwelcoming and seeing British way of life were factorswhich persuade around 70%.
Beyond London – hooks & barriers
55
Appeal of going beyond London: themes (2)5) Cities and culture
Of those who had been to London, a third (34%) had‘lots of interest’ in major cities outside London andBritain’s fun and vibrant cities were flagged as a factorwhich might persuade people to go outside London byover three-quarters (78%).
Britain’s contemporary culture (music, art, fashion andfood) also emerged as key elements of interest.
This again reflects insufficient knowledge of Britainamong many visitors which inhibits their ability toindependently organise multi-destination trips andhighlights a potential gap for tours, packages andagents for at least suggested itineraries to facilitatetrips outside London.
6) Trains, tours and packages
Most are willing to travel 2-3 hours from their initialbase (typically London) to stay in another destination.With concerns about driving for many, preference isfor train travel. Train was the most popular choice oftransport when going between London / elsewhere – afifth said rail passes would help.
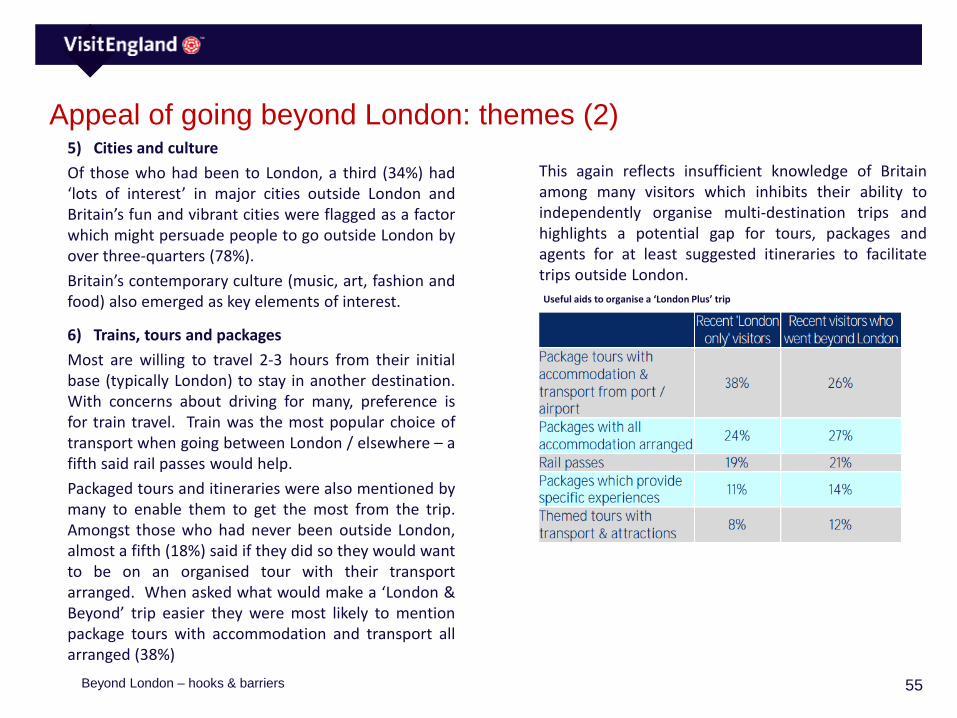
Packaged tours and itineraries were also mentioned bymany to enable them to get the most from the trip.Amongst those who had never been outside London,almost a fifth (18%) said if they did so they would wantto be on an organised tour with their transportarranged. When asked what would make a ‘London &Beyond’ trip easier they were most likely to mentionpackage tours with accommodation and transport allarranged (38%)
Useful aids to organise a ‘London Plus’ trip
Beyond London – hooks & barriers
56
Regional pen portraits – product opportunities
Data taken predominantly from Visit Britain’s ‘Inbound tourism to Britain’s nations and regions’ report (2013)
57
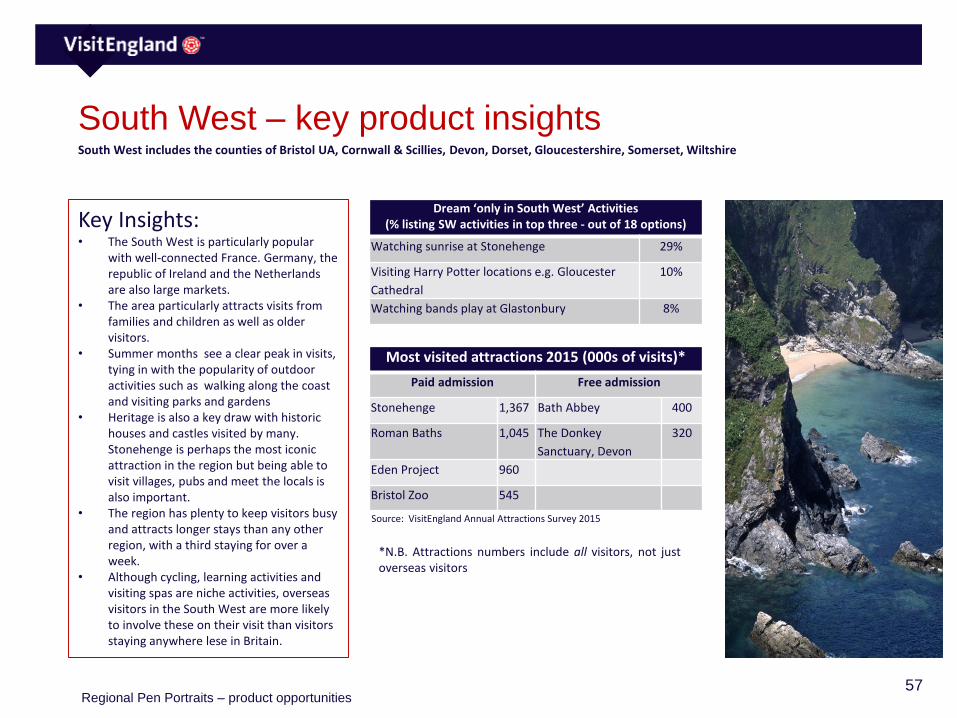
South West – key product insights
Dream ‘only in South West’ Activities(% listing SW activities in top three - out of 18 options)
Watching sunrise at Stonehenge 29%
Visiting Harry Potter locations e.g. Gloucester
Cathedral
10%
Watching bands play at Glastonbury 8%
Most visited attractions 2015 (000s of visits)*
Paid admission Free admission
Stonehenge 1,367 Bath Abbey 400
Roman Baths 1,045 The Donkey
Sanctuary, Devon
320
Eden Project 960
Bristol Zoo 545
Source: VisitEngland Annual Attractions Survey 2015
South West includes the counties of Bristol UA, Cornwall & Scillies, Devon, Dorset, Gloucestershire, Somerset, Wiltshire
Key Insights:• The South West is particularly popular
with well-connected France. Germany, the republic of Ireland and the Netherlands are also large markets.
• The area particularly attracts visits from families and children as well as older visitors.
• Summer months see a clear peak in visits, tying in with the popularity of outdoor activities such as walking along the coast and visiting parks and gardens
• Heritage is also a key draw with historic houses and castles visited by many. Stonehenge is perhaps the most iconic attraction in the region but being able to visit villages, pubs and meet the locals is also important.
• The region has plenty to keep visitors busy and attracts longer stays than any other region, with a third staying for over a week.
• Although cycling, learning activities and visiting spas are niche activities, overseas visitors in the South West are more likely to involve these on their visit than visitors staying anywhere lese in Britain.
*N.B. Attractions numbers include all visitors, not justoverseas visitors
Regional Pen Portraits – product opportunities
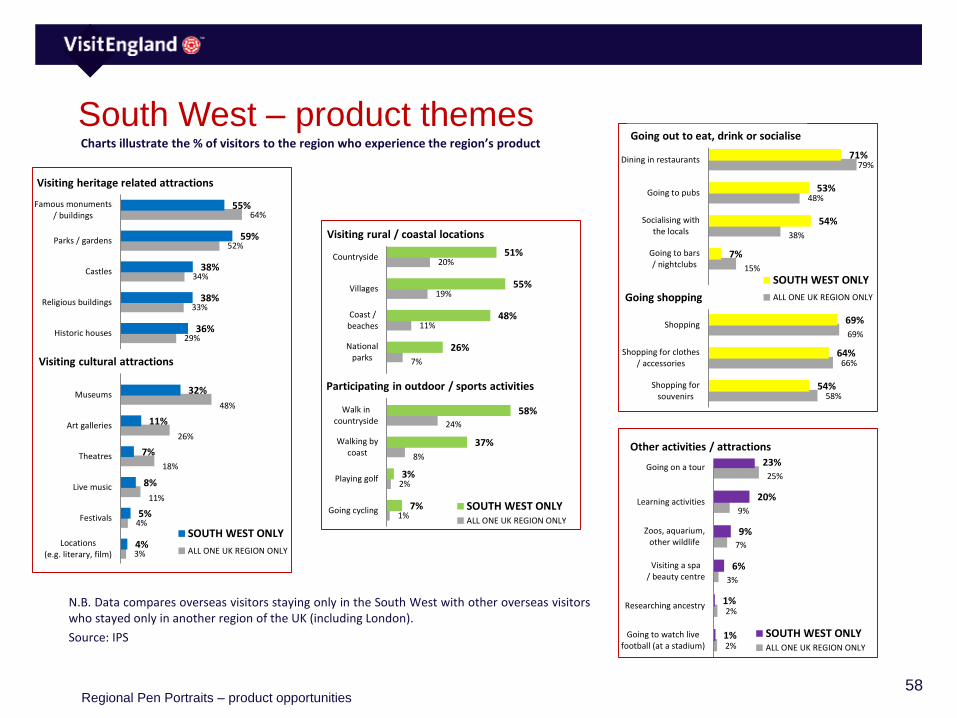
58
South West – product themes
N.B. Data compares overseas visitors staying only in the South West with other overseas visitorswho stayed only in another region of the UK (including London).
Source: IPS
Charts illustrate the % of visitors to the region who experience the region’s product
3%
4%
11%
18%
26%
48%
29%
33%
34%
52%
64%
4%
5%
8%
7%
11%
32%
36%
38%
38%
59%
55%
Locations(e.g. literary, film)
Festivals
Live music
Theatres
Art galleries
Museums
Historic houses
Religious buildings
Castles
Parks / gardens
Famous monuments/ buildings
SOUTH WEST ONLY
ALL ONE UK REGION ONLY
Visiting heritage related attractions
Visiting cultural attractions
1%
2%
8%
24%
7%
11%
19%
20%
7%
3%
37%
58%
26%
48%
55%
51%
Going cycling
Playing golf
Walking bycoast
Walk incountryside
Nationalparks
Coast /beaches
Villages
Countryside
SOUTH WEST ONLYALL ONE UK REGION ONLY
Participating in outdoor / sports activities
Visiting rural / coastal locations
58%
66%
69%
15%
38%
48%
79%
54%
64%
69%
7%
54%
53%
71%
Shopping forsouvenirs
Shopping for clothes/ accessories
Shopping
Going to bars/ nightclubs
Socialising withthe locals
Going to pubs
Dining in restaurants
SOUTH WEST ONLY
ALL ONE UK REGION ONLYGoing shopping
Going out to eat, drink or socialise
2%
2%
3%
7%
9%
25%
1%
1%
6%
9%
20%
23%
Going to watch livefootball (at a stadium)
Researching ancestry
Visiting a spa/ beauty centre
Zoos, aquarium,other wildlife
Learning activities
Going on a tour
SOUTH WEST ONLYALL ONE UK REGION ONLY
Other activities / attractions
Regional Pen Portraits – product opportunities
59
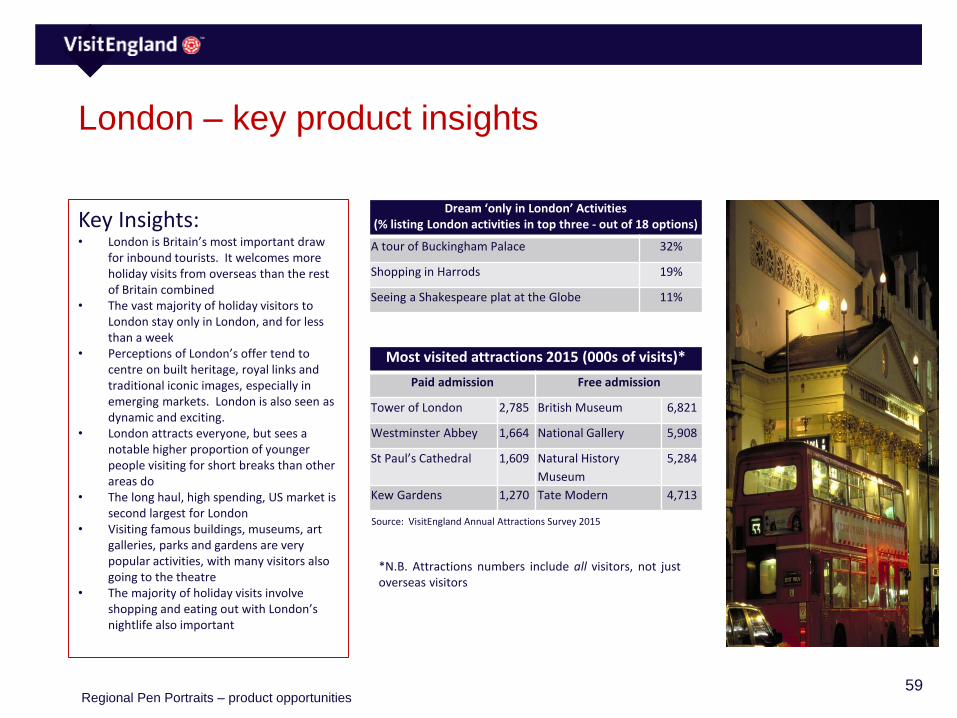
London – key product insights
Dream ‘only in London’ Activities(% listing London activities in top three - out of 18 options)
A tour of Buckingham Palace 32%
Shopping in Harrods 19%
Seeing a Shakespeare plat at the Globe 11%
Most visited attractions 2015 (000s of visits)*
Paid admission Free admission
Tower of London 2,785 British Museum 6,821
Westminster Abbey 1,664 National Gallery 5,908
St Paul’s Cathedral 1,609 Natural History
Museum
5,284
Kew Gardens 1,270 Tate Modern 4,713
Source: VisitEngland Annual Attractions Survey 2015
Key Insights:• London is Britain’s most important draw
for inbound tourists. It welcomes more holiday visits from overseas than the rest of Britain combined
• The vast majority of holiday visitors to London stay only in London, and for less than a week
• Perceptions of London’s offer tend to centre on built heritage, royal links and traditional iconic images, especially in emerging markets. London is also seen as dynamic and exciting.
• London attracts everyone, but sees a notable higher proportion of younger people visiting for short breaks than other areas do
• The long haul, high spending, US market is second largest for London
• Visiting famous buildings, museums, art galleries, parks and gardens are very popular activities, with many visitors also going to the theatre
• The majority of holiday visits involve shopping and eating out with London’s nightlife also important
*N.B. Attractions numbers include all visitors, not justoverseas visitors
Regional Pen Portraits – product opportunities

60
London – product themes
N.B. Data compares overseas visitors staying only in London with other overseas visitors whostayed only in another region of the UK.
Source: IPS
Charts illustrate the % of visitors to the region who experience the region’s product
3%
4%
11%
18%
26%
48%
29%
33%
34%
52%
64%
3%
3%
11%
24%
32%
55%
30%
40%
30%
64%
70%
Locations(e.g. literary, film)
Festivals
Live music
Theatres
Art galleries
Museums
Historic houses
Religious buildings
Castles
Parks / gardens
Famous monuments/ buildings
LONDON ONLY
ALL ONE UK REGION ONLY
Visiting heritage related attractions
Visiting cultural attractions
58%
66%
69%
15%
38%
48%
79%
60%
70%
81%
17%
30%
53%
83%
Shopping forsouvenirs
Shopping for clothes/ accessories
Shopping
Going to bars/ nightclubs
Socialising withthe locals
Going to pubs
Dining in restaurants
LONDON ONLYALL ONE UK REGION ONLYGoing shopping
Going out to eat, drink or socialise
1%
2%
8%
24%
7%
11%
19%
20%
1%
0%
2%
12%
4%
3%
9%
9%
Going cycling
Playing golf
Walking by coast
Walk in countryside
National parks
Coast / beaches
Villages
Countryside
LONDON ONLYALL ONE UK REGION ONLY
Participating in outdoor / sports activities
Visiting rural / coastal locations
2%
2%
3%
7%
9%
25%
2%
2%
2%
8%
8%
26%
Going to watch livefootball (at a stadium)
Researching ancestry
Visiting a spa/ beauty centre
Zoos, aquarium,other wildlife
Learning activities
Going on a tour
LONDON ONLY
ALL ONE UK REGION ONLY
Other activities / attractions
Regional Pen Portraits – product opportunities

61
South East (excl. London) – key product insightsSouth East includes the counties of Berkshire, Buckinghamshire, East Sussex, Hampshire, Isle of Wight, Kent, Oxfordshire, Surrey & West Sussex
Most visited attractions 2015 (000s of visits)*
Paid admission Free admission
RHS Wisley 1088 Ashmolean Museum 848
Canterbury Cathedral 957 University Museum of
Natural History
640
Blenheim Palace 763 Brighton Pier 4,600
Leeds Castle 564 Pitt Rivers Museum 418
Woburn Safari Park 490 The Beaney,
Canterbury
326
Marwell Wildlife 477
Key Insights:• Outdoor activities, parks and gardens as well
as the areas coast and countryside are very popular with many going walking and minorities playing golf or cycling.
• The South Easts heritage is a strong draw – it is one of the areas where overseas visitors are especially likely to visit a castle, a historic house or a religious building.
• Museums are a headline draw and the South East also attracts a relatively large proportion for learning activities.
• There are perhaps fewer concerns about the weather in the South East – as many visitors come in late spring/ early summer as in the usual peak season.
• Shopping and eating out in restaurants are amongst the most popular activities for overseas visitors in the South East – with excellent connectivity to several European neighbours and long stays common there is scope for visitors to relax with low key activities.
• The area attracts more holiday visits including children than any other – some perhaps on school coach trips taking advantage of easy ferry links.
Top of mind activities in the South East (no ‘Dream only in South East’ activities were mentioned)
The South East isn’t particularly top-of-mind, but there were
some mentions of Oxford, and spontaneous mentions of the
Royal Family indicating potential interest in Windsor and
other attractions with royal link.
*N.B. Attractions numbers include all visitors, not justoverseas visitors
Source: VisitEngland Annual Attractions Survey 2015
Regional Pen Portraits – product opportunities
62
South East (excl. London) – product themesCharts illustrate the % of visitors to the region who experience the region’s product
3%
4%
11%
18%
26%
48%
29%
33%
34%
52%
64%
2%
4%
6%
6%
15%
42%
34%
37%
42%
52%
57%
Locations(e.g. literary, film)
Festivals
Live music
Theatres
Art galleries
Museums
Historic houses
Religious buildings
Castles
Parks / gardens
Famous monuments/ buildings
SOUTH EAST ONLYALL ONE UK REGION ONLY
Visiting heritage related attractions
Visiting cultural attractions
58%
66%
69%
15%
38%
48%
79%
57%
60%
72%
6%
47%
42%
59%
Shopping forsouvenirs
Shopping for clothes/ accessories
Shopping
Going to bars/ nightclubs
Socialising withthe locals
Going to pubs
Dining in restaurants
SOUTH EAST ONLYALL ONE UK REGION ONLYGoing shopping
Going out to eat, drink or socialise
1%
2%
8%
24%
7%
11%
19%
20%
2%
4%
25%
45%
11%
37%
39%
38%
Going cycling
Playing golf
Walking by coast
Walk in countryside
National parks
Coast / beaches
Villages
Countryside
SOUTH EAST ONLY
ALL ONE UK REGION ONLY
Participating in outdoor / sports activities
Visiting rural / coastal locations
2%
2%
3%
7%
9%
25%
1%
3%
2%
7%
17%
23%
Going to watch livefootball (at a stadium)
Researching ancestry
Visiting a spa/ beauty centre
Zoos, aquarium,other wildlife
Learning activities
Going on a tour
SOUTH EAST ONLYALL ONE UK REGION ONLY
Other activities / attractions
Regional Pen Portraits – product opportunities
63
The East of England – key product insightsEast England includes the counties of Bedfordshire, Cambridgeshire, Essex, Hertfordshire, Norfolk, Suffolk
Most visited attractions 2015 (000s of visits)*
Paid admission Free admission
Colchester Zoo 964 Fitzwilliam Museum 418
Whipsnade Zoo 737 Needham Lake 320
Imperial War Museum,
Duxford
374
Angelsea Abbey 333
Key Insights:• Near neighbours Germany and the
Netherlands are important markets. Scenery and outdoor activities are often popular with these visitors and this is reflected in the relatively high proportions visiting the countryside.
• Cambridge is a major draw and helps attract a high proportion of young visitors.
• The area’s heritage is important with religious buildings and museums included in the trip for many.
• A relatively high proportion staying with friends or relatives (and a lower proportion in hotels) may contribute to easting out being less common in this area.
• Although niche activities, theatre and festivals also attract some visitors with the area seeing one of the highest propensities for theatre visits outside of London.
Top of mind activities in the East of England (no ‘Dream only in East of England’ activities were mentioned)
The East of England isn’t particularly top-of-mind, although
there was some spontaneous mention of Cambridge. People
had positive associations with country pubs, gardens and
flowers all of which feature in the East of England.
*N.B. Attractions numbers include all visitors, not justoverseas visitors
Source: VisitEngland Annual Attractions Survey 2015
Regional Pen Portraits – product opportunities
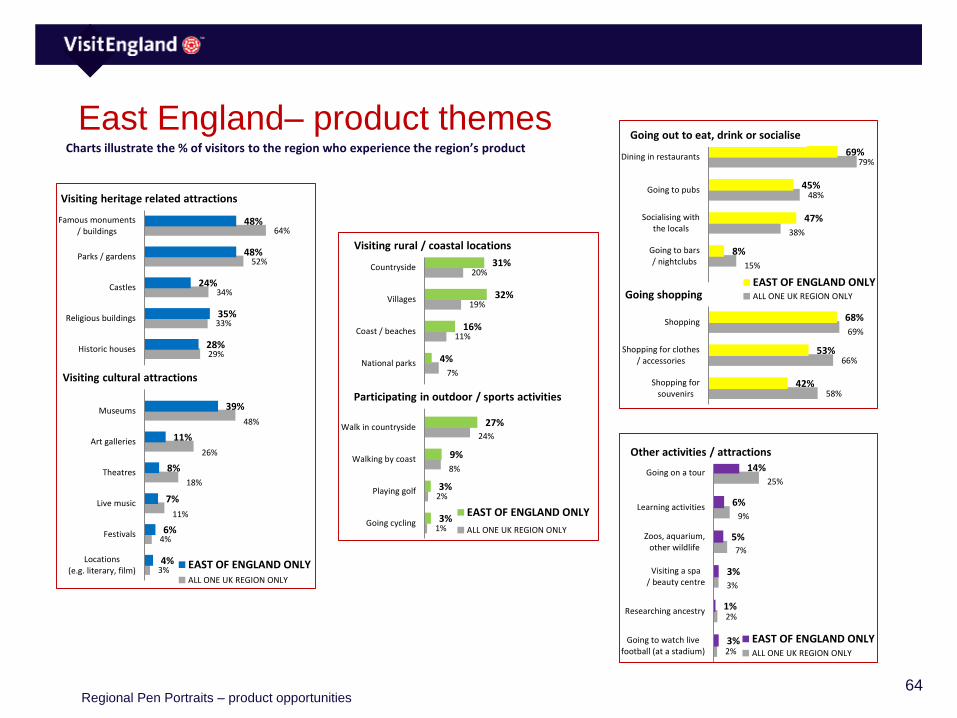
64
East England– product themesCharts illustrate the % of visitors to the region who experience the region’s product
3%
4%
11%
18%
26%
48%
29%
33%
34%
52%
64%
4%
6%
7%
8%
11%
39%
28%
35%
24%
48%
48%
Locations(e.g. literary, film)
Festivals
Live music
Theatres
Art galleries
Museums
Historic houses
Religious buildings
Castles
Parks / gardens
Famous monuments/ buildings
EAST OF ENGLAND ONLYALL ONE UK REGION ONLY
Visiting heritage related attractions
Visiting cultural attractions
1%
2%
8%
24%
7%
11%
19%
20%
3%
3%
9%
27%
4%
16%
32%
31%
Going cycling
Playing golf
Walking by coast
Walk in countryside
National parks
Coast / beaches
Villages
Countryside
EAST OF ENGLAND ONLY
ALL ONE UK REGION ONLY
Participating in outdoor / sports activities
Visiting rural / coastal locations
58%
66%
69%
15%
38%
48%
79%
42%
53%
68%
8%
47%
45%
69%
Shopping forsouvenirs
Shopping for clothes/ accessories
Shopping
Going to bars/ nightclubs
Socialising withthe locals
Going to pubs
Dining in restaurants
EAST OF ENGLAND ONLYALL ONE UK REGION ONLYGoing shopping
Going out to eat, drink or socialise
2%
2%
3%
7%
9%
25%
3%
1%
3%
5%
6%
14%
Going to watch livefootball (at a stadium)
Researching ancestry
Visiting a spa/ beauty centre
Zoos, aquarium,other wildlife
Learning activities
Going on a tour
EAST OF ENGLAND ONLYALL ONE UK REGION ONLY
Other activities / attractions
Regional Pen Portraits – product opportunities
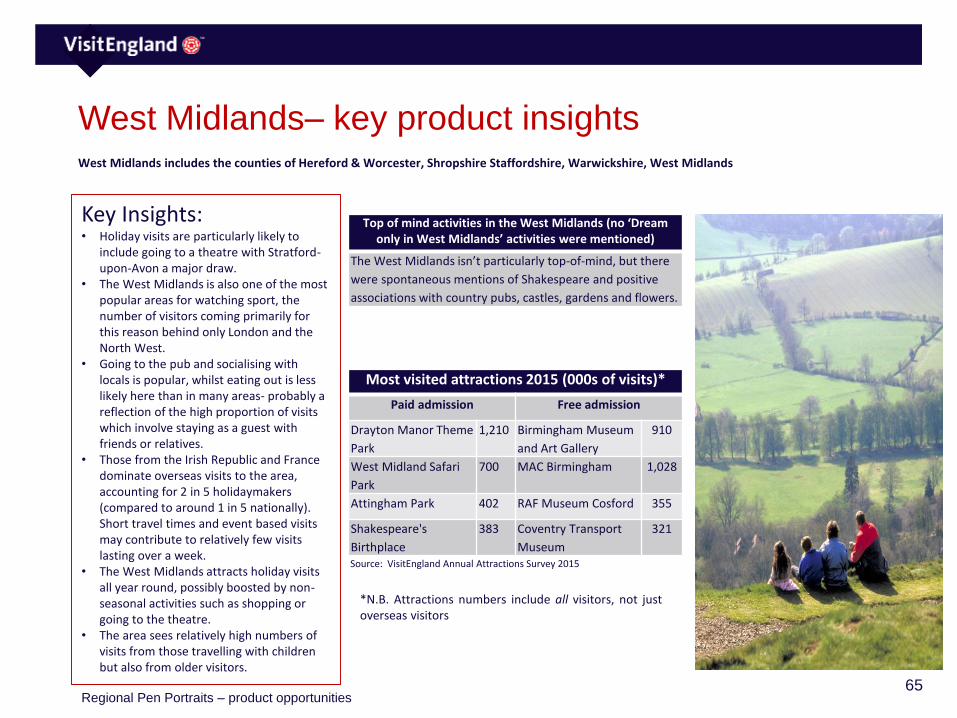
65
West Midlands– key product insightsWest Midlands includes the counties of Hereford & Worcester, Shropshire Staffordshire, Warwickshire, West Midlands
Most visited attractions 2015 (000s of visits)*
Paid admission Free admission
Drayton Manor Theme
Park
1,210 Birmingham Museum
and Art Gallery
910
West Midland Safari
Park
700 MAC Birmingham 1,028
Attingham Park 402 RAF Museum Cosford 355
Shakespeare's
Birthplace
383 Coventry Transport
Museum
321
Key Insights: • Holiday visits are particularly likely to
include going to a theatre with Stratford-upon-Avon a major draw.
• The West Midlands is also one of the most popular areas for watching sport, the number of visitors coming primarily for this reason behind only London and the North West.
• Going to the pub and socialising with locals is popular, whilst eating out is less likely here than in many areas- probably a reflection of the high proportion of visits which involve staying as a guest with friends or relatives.
• Those from the Irish Republic and France dominate overseas visits to the area, accounting for 2 in 5 holidaymakers (compared to around 1 in 5 nationally). Short travel times and event based visits may contribute to relatively few visits lasting over a week.
• The West Midlands attracts holiday visits all year round, possibly boosted by non-seasonal activities such as shopping or going to the theatre.
• The area sees relatively high numbers of visits from those travelling with children but also from older visitors.
Top of mind activities in the West Midlands (no ‘Dream only in West Midlands’ activities were mentioned)
The West Midlands isn’t particularly top-of-mind, but there
were spontaneous mentions of Shakespeare and positive
associations with country pubs, castles, gardens and flowers.
*N.B. Attractions numbers include all visitors, not justoverseas visitors
Source: VisitEngland Annual Attractions Survey 2015
Regional Pen Portraits – product opportunities

66
West Midlands – product themesCharts illustrate the % of visitors to the region who experience the region’s product
3%
4%
11%
18%
26%
48%
29%
33%
34%
52%
64%
2%
6%
7%
9%
14%
26%
23%
18%
21%
37%
45%
Locations(e.g. literary, film)
Festivals
Live music
Theatres
Art galleries
Museums
Historic houses
Religious buildings
Castles
Parks / gardens
Famous monuments/ buildings
WEST MIDLANDS ONLYALL ONE UK REGION ONLY
Visiting heritage related attractions
Visiting cultural attractions
58%
66%
69%
15%
38%
48%
79%
49%
51%
69%
15%
59%
55%
58%
Shopping forsouvenirs
Shopping for clothes/ accessories
Shopping
Going to bars/ nightclubs
Socialising withthe locals
Going to pubs
Dining in restaurants
WEST MIDLANDS ONLYALL ONE UK REGION ONLYGoing shopping
Going out to eat, drink or socialise
1%
2%
8%
24%
7%
11%
19%
20%
2%
3%
4%
33%
8%
9%
26%
25%
Going cycling
Playing golf
Walking by coast
Walk in countryside
National parks
Coast / beaches
Villages
Countryside
WEST MIDLANDS ONLY
ALL ONE UK REGION ONLY
Participating in outdoor / sports activities
Visiting rural / coastal locations
2%
2%
3%
7%
9%
25%
3%
2%
3%
5%
3%
13%
Going to watch livefootball (at a stadium)
Researching ancestry
Visiting a spa/ beauty centre
Zoos, aquarium,other wildlife
Learning activities
Going on a tour
WEST MIDLANDS ONLYALL ONE UK REGION ONLY
Other activities / attractions
Regional Pen Portraits – product opportunities
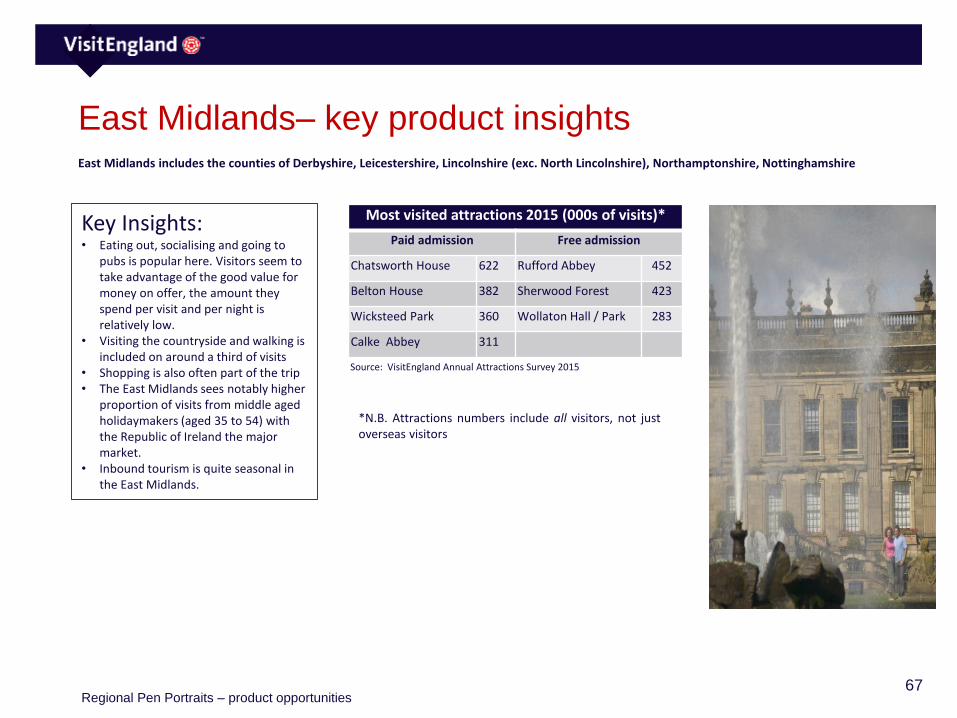
67
East Midlands– key product insightsEast Midlands includes the counties of Derbyshire, Leicestershire, Lincolnshire (exc. North Lincolnshire), Northamptonshire, Nottinghamshire
Most visited attractions 2015 (000s of visits)*
Paid admission Free admission
Chatsworth House 622 Rufford Abbey 452
Belton House 382 Sherwood Forest 423
Wicksteed Park 360 Wollaton Hall / Park 283
Calke Abbey 311
Key Insights: • Eating out, socialising and going to
pubs is popular here. Visitors seem to take advantage of the good value for money on offer, the amount they spend per visit and per night is relatively low.
• Visiting the countryside and walking is included on around a third of visits
• Shopping is also often part of the trip• The East Midlands sees notably higher
proportion of visits from middle aged holidaymakers (aged 35 to 54) with the Republic of Ireland the major market.
• Inbound tourism is quite seasonal in the East Midlands.
*N.B. Attractions numbers include all visitors, not justoverseas visitors
Source: VisitEngland Annual Attractions Survey 2015
Regional Pen Portraits – product opportunities
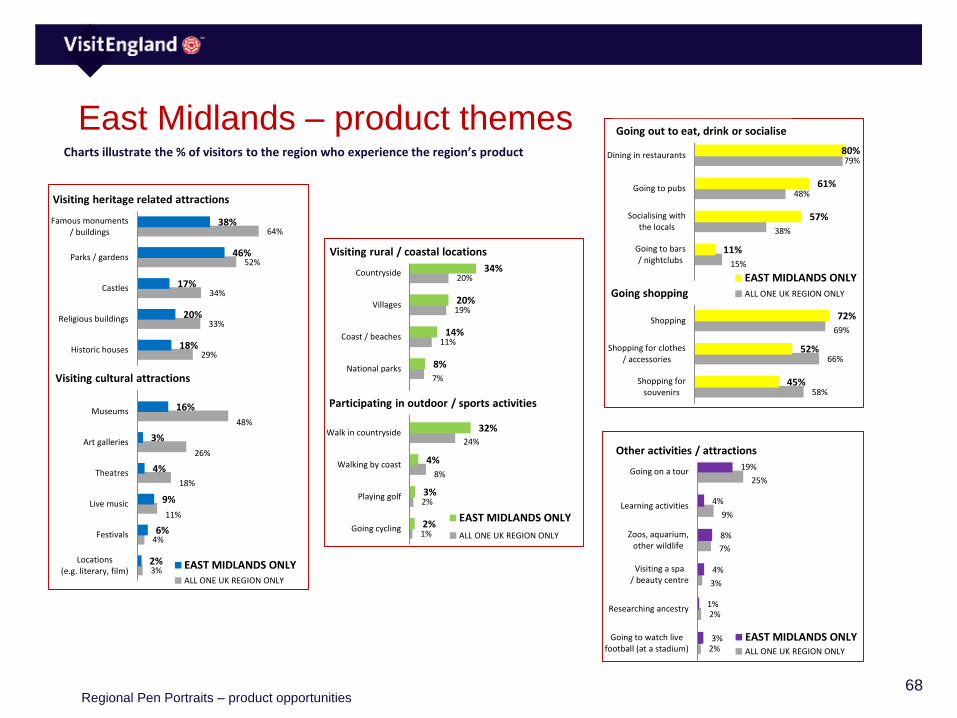
68
East Midlands – product themesCharts illustrate the % of visitors to the region who experience the region’s product
3%
4%
11%
18%
26%
48%
29%
33%
34%
52%
64%
2%
6%
9%
4%
3%
16%
18%
20%
17%
46%
38%
Locations(e.g. literary, film)
Festivals
Live music
Theatres
Art galleries
Museums
Historic houses
Religious buildings
Castles
Parks / gardens
Famous monuments/ buildings
EAST MIDLANDS ONLYALL ONE UK REGION ONLY
Visiting heritage related attractions
Visiting cultural attractions58%
66%
69%
15%
38%
48%
79%
45%
52%
72%
11%
57%
61%
80%
Shopping forsouvenirs
Shopping for clothes/ accessories
Shopping
Going to bars/ nightclubs
Socialising withthe locals
Going to pubs
Dining in restaurants
EAST MIDLANDS ONLY
ALL ONE UK REGION ONLYGoing shopping
Going out to eat, drink or socialise
1%
2%
8%
24%
7%
11%
19%
20%
2%
3%
4%
32%
8%
14%
20%
34%
Going cycling
Playing golf
Walking by coast
Walk in countryside
National parks
Coast / beaches
Villages
Countryside
EAST MIDLANDS ONLY
ALL ONE UK REGION ONLY
Participating in outdoor / sports activities
Visiting rural / coastal locations
2%
2%
3%
7%
9%
25%
3%
1%
4%
8%
4%
19%
Going to watch livefootball (at a stadium)
Researching ancestry
Visiting a spa/ beauty centre
Zoos, aquarium,other wildlife
Learning activities
Going on a tour
EAST MIDLANDS ONLYALL ONE UK REGION ONLY
Other activities / attractions
Regional Pen Portraits – product opportunities
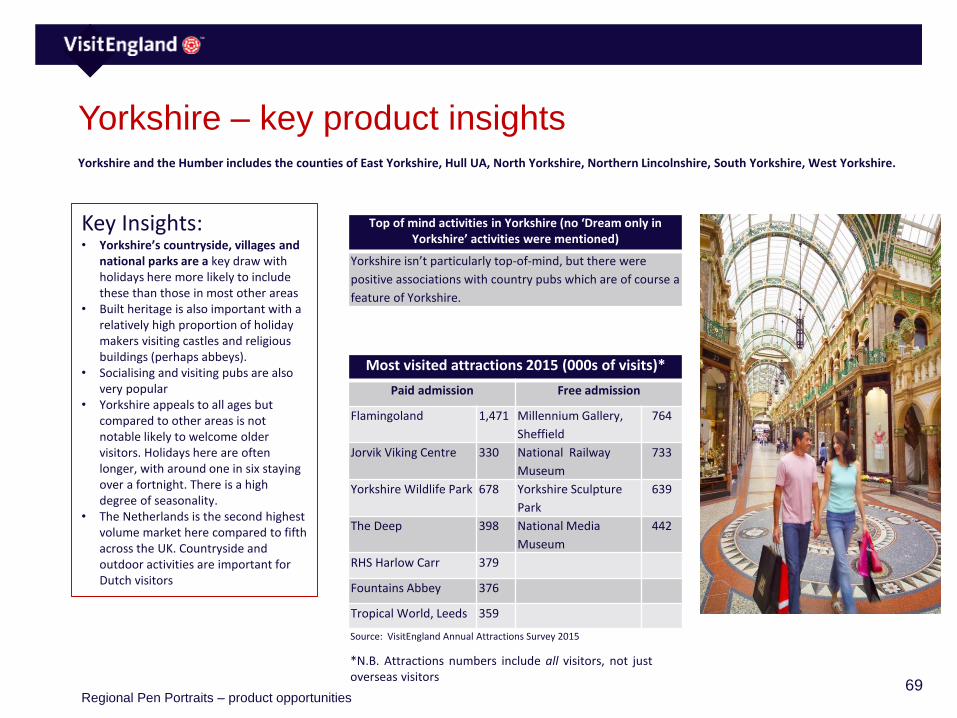
69
Yorkshire – key product insightsYorkshire and the Humber includes the counties of East Yorkshire, Hull UA, North Yorkshire, Northern Lincolnshire, South Yorkshire, West Yorkshire.
Most visited attractions 2015 (000s of visits)*
Paid admission Free admission
Flamingoland 1,471 Millennium Gallery,
Sheffield
764
Jorvik Viking Centre 330 National Railway
Museum
733
Yorkshire Wildlife Park 678 Yorkshire Sculpture
Park
639
The Deep 398 National Media
Museum
442
RHS Harlow Carr 379
Fountains Abbey 376
Tropical World, Leeds 359
Key Insights: • Yorkshire’s countryside, villages and
national parks are a key draw with holidays here more likely to include these than those in most other areas
• Built heritage is also important with a relatively high proportion of holiday makers visiting castles and religious buildings (perhaps abbeys).
• Socialising and visiting pubs are also very popular
• Yorkshire appeals to all ages but compared to other areas is not notable likely to welcome older visitors. Holidays here are often longer, with around one in six staying over a fortnight. There is a high degree of seasonality.
• The Netherlands is the second highest volume market here compared to fifth across the UK. Countryside and outdoor activities are important for Dutch visitors
Top of mind activities in Yorkshire (no ‘Dream only in Yorkshire’ activities were mentioned)
Yorkshire isn’t particularly top-of-mind, but there were
positive associations with country pubs which are of course a
feature of Yorkshire.
*N.B. Attractions numbers include all visitors, not justoverseas visitors
Source: VisitEngland Annual Attractions Survey 2015
Regional Pen Portraits – product opportunities
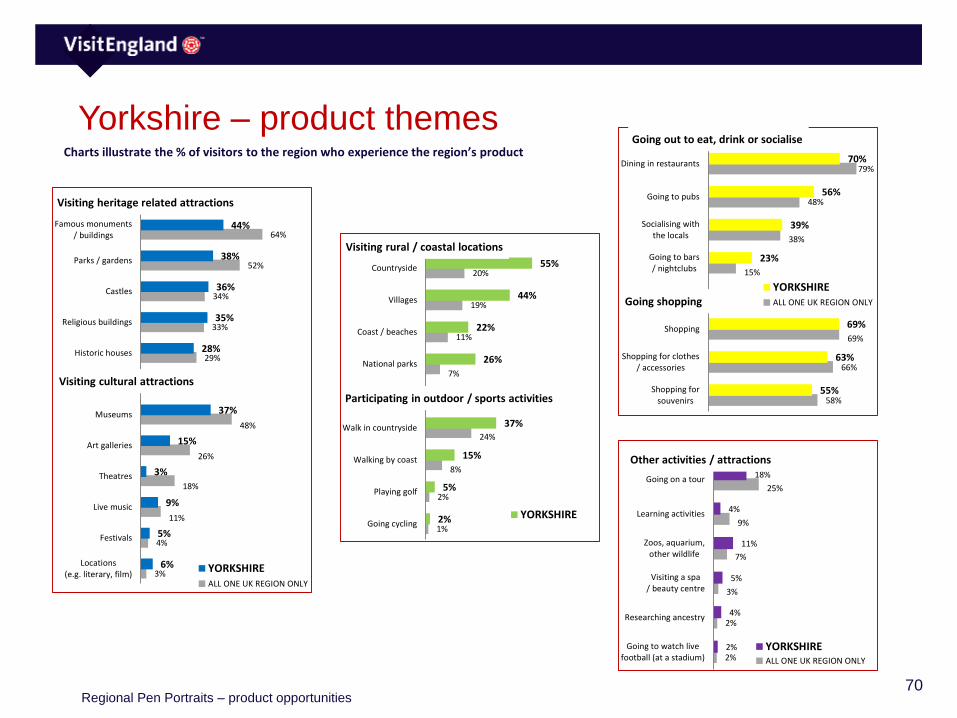
70
Yorkshire – product themesCharts illustrate the % of visitors to the region who experience the region’s product
3%
4%
11%
18%
26%
48%
29%
33%
34%
52%
64%
6%
5%
9%
3%
15%
37%
28%
35%
36%
38%
44%
Locations(e.g. literary, film)
Festivals
Live music
Theatres
Art galleries
Museums
Historic houses
Religious buildings
Castles
Parks / gardens
Famous monuments/ buildings
YORKSHIREALL ONE UK REGION ONLY
Visiting heritage related attractions
Visiting cultural attractions
58%
66%
69%
15%
38%
48%
79%
55%
63%
69%
23%
39%
56%
70%
Shopping forsouvenirs
Shopping for clothes/ accessories
Shopping
Going to bars/ nightclubs
Socialising withthe locals
Going to pubs
Dining in restaurants
YORKSHIREALL ONE UK REGION ONLYGoing shopping
Going out to eat, drink or socialise
1%
2%
8%
24%
7%
11%
19%
20%
2%
5%
15%
37%
26%
22%
44%
55%
Going cycling
Playing golf
Walking by coast
Walk in countryside
National parks
Coast / beaches
Villages
Countryside
YORKSHIRE
Participating in outdoor / sports activities
Visiting rural / coastal locations
2%
2%
3%
7%
9%
25%
2%
4%
5%
11%
4%
18%
Going to watch livefootball (at a stadium)
Researching ancestry
Visiting a spa/ beauty centre
Zoos, aquarium,other wildlife
Learning activities
Going on a tour
YORKSHIREALL ONE UK REGION ONLY
Other activities / attractions
Regional Pen Portraits – product opportunities
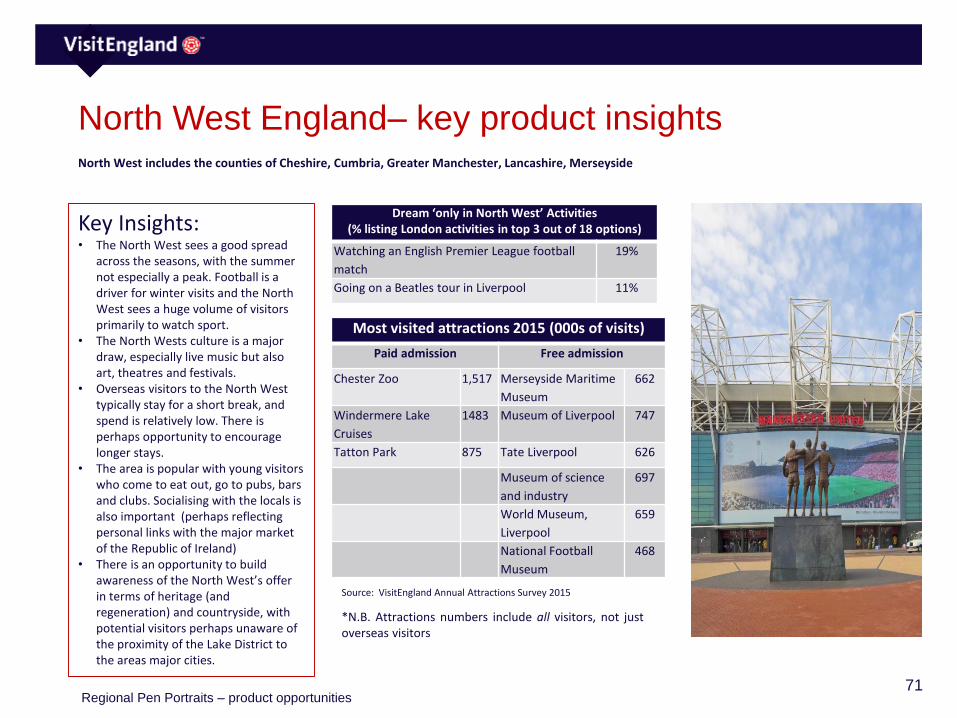
71
North West England– key product insights
Dream ‘only in North West’ Activities(% listing London activities in top 3 out of 18 options)
Watching an English Premier League football
match
19%
Going on a Beatles tour in Liverpool 11%
North West includes the counties of Cheshire, Cumbria, Greater Manchester, Lancashire, Merseyside
Most visited attractions 2015 (000s of visits)
Paid admission Free admission
Chester Zoo 1,517 Merseyside Maritime
Museum
662
Windermere Lake
Cruises
1483 Museum of Liverpool 747
Tatton Park 875 Tate Liverpool 626
Museum of science
and industry
697
World Museum,
Liverpool
659
National Football
Museum
468
Key Insights:• The North West sees a good spread
across the seasons, with the summer not especially a peak. Football is a driver for winter visits and the North West sees a huge volume of visitors primarily to watch sport.
• The North Wests culture is a major draw, especially live music but also art, theatres and festivals.
• Overseas visitors to the North West typically stay for a short break, and spend is relatively low. There is perhaps opportunity to encourage longer stays.
• The area is popular with young visitors who come to eat out, go to pubs, bars and clubs. Socialising with the locals is also important (perhaps reflecting personal links with the major market of the Republic of Ireland)
• There is an opportunity to build awareness of the North West’s offer in terms of heritage (and regeneration) and countryside, with potential visitors perhaps unaware of the proximity of the Lake District to the areas major cities.
*N.B. Attractions numbers include all visitors, not justoverseas visitors
Source: VisitEngland Annual Attractions Survey 2015
Regional Pen Portraits – product opportunities

72
North West England – product themesCharts illustrate the % of visitors to the region who experience the region’s product
3%
4%
11%
18%
26%
48%
29%
33%
34%
52%
64%
2%
9%
19%
9%
14%
28%
15%
20%
8%
25%
36%
Locations(e.g. literary, film)
Festivals
Live music
Theatres
Art galleries
Museums
Historic houses
Religious buildings
Castles
Parks / gardens
Famous monuments/ buildings
NORTH WEST ONLYALL ONE UK REGION ONLY
Visiting heritage related attractions
Visiting cultural attractions
58%
66%
69%
15%
38%
48%
79%
43%
60%
71%
30%
61%
66%
68%
Shopping forsouvenirs
Shopping for clothes/ accessories
Shopping
Going to bars/ nightclubs
Socialising withthe locals
Going to pubs
Dining in restaurants
NORTH WEST ONLYALL ONE UK REGION ONLYGoing shopping
Going out to eat, drink or socialise
1%
2%
8%
24%
7%
11%
19%
20%
1%
8%
24%
9%
14%
16%
22%
Going cycling
Playing golf
Walking by coast
Walk in countryside
National parks
Coast / beaches
Villages
Countryside
NORTH WEST ONLYALL ONE UK REGION ONLY
Participating in outdoor / sports activities
Visiting rural / coastal locations
2%
2%
3%
7%
9%
25%
8%
0%
4%
7%
10%
19%
Going to watch livefootball (at a stadium)
Researching ancestry
Visiting a spa/ beauty centre
Zoos, aquarium,other wildlife
Learning activities
Going on a tour
NORTH WEST ONLYALL ONE UK REGION ONLY
Other activities / attractions
Regional Pen Portraits – product opportunities
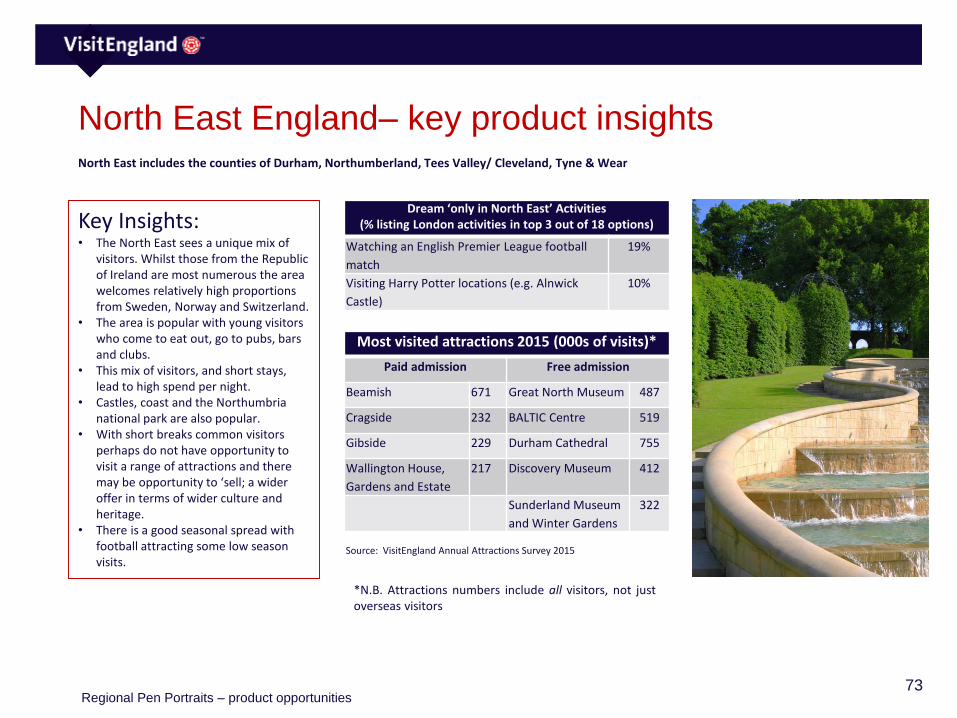
73
North East England– key product insights
Dream ‘only in North East’ Activities(% listing London activities in top 3 out of 18 options)
Watching an English Premier League football
match
19%
Visiting Harry Potter locations (e.g. Alnwick
Castle)
10%
North East includes the counties of Durham, Northumberland, Tees Valley/ Cleveland, Tyne & Wear
Most visited attractions 2015 (000s of visits)*
Paid admission Free admission
Beamish 671 Great North Museum 487
Cragside 232 BALTIC Centre 519
Gibside 229 Durham Cathedral 755
Wallington House,
Gardens and Estate
217 Discovery Museum 412
Sunderland Museum
and Winter Gardens
322
Key Insights:• The North East sees a unique mix of
visitors. Whilst those from the Republic of Ireland are most numerous the area welcomes relatively high proportions from Sweden, Norway and Switzerland.
• The area is popular with young visitors who come to eat out, go to pubs, bars and clubs.
• This mix of visitors, and short stays, lead to high spend per night.
• Castles, coast and the Northumbria national park are also popular.
• With short breaks common visitors perhaps do not have opportunity to visit a range of attractions and there may be opportunity to ‘sell; a wider offer in terms of wider culture and heritage.
• There is a good seasonal spread with football attracting some low season visits.
*N.B. Attractions numbers include all visitors, not justoverseas visitors
Source: VisitEngland Annual Attractions Survey 2015
Regional Pen Portraits – product opportunities
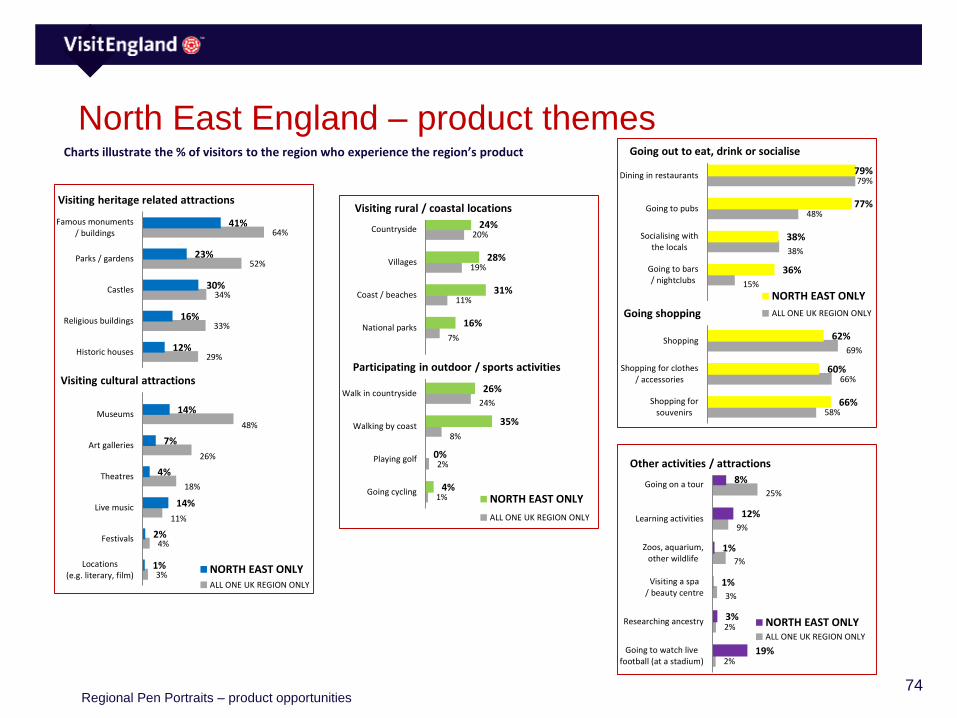
74
North East England – product themesCharts illustrate the % of visitors to the region who experience the region’s product
3%
4%
11%
18%
26%
48%
29%
33%
34%
52%
64%
1%
2%
14%
4%
7%
14%
12%
16%
30%
23%
41%
Locations(e.g. literary, film)
Festivals
Live music
Theatres
Art galleries
Museums
Historic houses
Religious buildings
Castles
Parks / gardens
Famous monuments/ buildings
NORTH EAST ONLYALL ONE UK REGION ONLY
Visiting heritage related attractions
Visiting cultural attractions
58%
66%
69%
15%
38%
48%
79%
66%
60%
62%
36%
38%
77%
79%
Shopping forsouvenirs
Shopping for clothes/ accessories
Shopping
Going to bars/ nightclubs
Socialising withthe locals
Going to pubs
Dining in restaurants
NORTH EAST ONLY
ALL ONE UK REGION ONLYGoing shopping
Going out to eat, drink or socialise
1%
2%
8%
24%
7%
11%
19%
20%
4%
0%
35%
26%
16%
31%
28%
24%
Going cycling
Playing golf
Walking by coast
Walk in countryside
National parks
Coast / beaches
Villages
Countryside
NORTH EAST ONLY
ALL ONE UK REGION ONLY
Participating in outdoor / sports activities
Visiting rural / coastal locations
2%
2%
3%
7%
9%
25%
19%
3%
1%
1%
12%
8%
Going to watch livefootball (at a stadium)
Researching ancestry
Visiting a spa/ beauty centre
Zoos, aquarium,other wildlife
Learning activities
Going on a tour
NORTH EAST ONLYALL ONE UK REGION ONLY
Other activities / attractions
Regional Pen Portraits – product opportunities

75
Recommendations
76
Recommendations/1
This report demonstrates clear opportunities amongst the overseas holiday audience for successful bidders of theDiscover England fund. Holiday trips and spend have increased for a number of years, from a mix of long-haul and short-haul markets. With economic growth likely to continue in key markets such as Germany, France and the USA, increasedholiday visits should increase too.
However, although overseas visitor growth has taken place across England, the focus has been very much in London, andthere are clear barriers to overseas visitors travelling further afield. The danger therefore, is that the rest of England failsto take full advantage of increased tourism.
Key barriers for winning bidders outside London
Our sections on ‘activities and themes as motivators’ and ‘hooks and barriers for travelling beyond London’ highlight clearpractical and psychological barriers that need to be overcome to facilitate travel beyond the capital. A leading obstacle is alack of ‘awareness’ of the destinations and attractions that exist outside of London. Any product funded by the DiscoverEngland Fund will need to raise awareness of its existence and offer, at a micro level and in the context of its location.Enabling visits outside London with itineraries, packages and easy-travel will help overcome existing barriers to travel.
Offering a point of difference
Central to a successful product is its ability to offer a benefit to its customers. England is viewed positively for its historicbuildings and monuments, and current visits from overseas visitors tend to centre around visits to these types ofattractions. Given the strength of England’s historical brand, bidders should harness this wherever relevant.
77
Recommendations/2
However, with the ‘all-encompassing London offer’ presenting a barrier to visits outside the capital, simply appealing tovisitors’ desire for history and heritage is unlikely to be enough to draw them outside of the capital – at least on a firstvisit. In addition, destinations will need to provide a point of difference to the London cultural offer.
This point of difference could be England’s natural beauty (perceptions of which are gradually improving), the escape itoffers from London’s urban environment, as well as the opportunities it provides for wellness holidays and adventuretourism. The ‘structural’ barrier of the British weather however, means that natural beauty should be combined withwet-weather alternatives.
Projects outside London may also wish to harness the rise in experiential travel. Experiential holidays tend to be identity-forming for the holiday-maker. They are typically immersive, local, authentic and adventurous - a natural point ofdifference to the ‘box-ticking’, sight-seeing London holiday. Should bidders opt for this route, they will need to conveytheir destination’s authentic history, stories and traditions, as well as local cuisine.
Further research
These findings provide an initial summary of the existing primary research on overseas visitors to England. We hope toexpand on these findings and recommendations in ensuing reports, a timetable for which will be circulated. If you haveany specific queries or channels of investigation, please get in touch with the contacts on the following page.

78
Jon Young: BDRC Continental:
Further information
Steve Mills: BDRC Continental: