Disco very M atters - 生物通 ... · Disco very M atters ... Fast Flow medium for 30 min with...
24
Discovery Matters Innovations for the life scientist from GE Healthcare Issue 13, May 2011 GE Healthcare Life Sciences Cancer research tools portfolio Streptavidin magnetic beads for biotin capture In vitro cardiotoxicity testing with Cytiva™ Cardiomyocytes High-content assays and screens with IN Cell Analyzer 6000 Sample prep in calorimetric studies
Transcript of Disco very M atters - 生物通 ... · Disco very M atters ... Fast Flow medium for 30 min with...

Discovery MattersInnovations for the life scientist from GE HealthcareIssue 13, May 2011
GE HealthcareLife Sciences
Cancer research tools portfolio
Streptavidin magnetic beads for biotin capture
In vitro cardiotoxicity testingwith Cytiva™ Cardiomyocytes
High-content assays and screens with IN Cell Analyzer 6000
Sample prep in calorimetric studies

2
Contents
Innovations ForumProtein purification and production
Stability of membrane proteins analyzed by gel filtration 4–5
Protein sample preparation
Screening of extraction buffers for 2-D DIGE analysis of plant proteins 6–7
A benchmark study of streptavidin magnetic beads 8–9
Rapid sample preparation for MicroCal™ ITC and DSC experiments using PD MidiTrap™ G-25 columns 10–11
Concentration and recovery of proteins from cell culture media using Vivaspin sample concentrators 14–15
Drug screening and cellular assays
High-content analysis of a live multiplexed cytotoxicity study using Cytiva™ Cardiomyocytes and IN Cell Analyzer 2000 16–17
Technology centralCancer research tools from GE Healthcare 12–13
What’s New?Details of our latest products and services 18–22
Issue 13 May 2011
EditorAlexander Razdan, PhD
Associate EditorJohn Osborn, BSc
ProductionPär Jansson
Discovery Matters is published by GE Healthcare Life Sciences.
The goal of Discovery Matters is to provide you with information that will help you achieve your research objectives. We want to continue developing Discovery Matters into a publication you value, and appreciate your input. Please send your articles for submission in upcoming issues, plus any comments or questions to: [email protected]
The content of this issue and previous issues of Discovery Matters can also be viewed online at www.gelifesciences.com/discoverymatters
Discovery MattersInnovations for the life scientist from GE HealthcareIssue 13, May 2011
GE HealthcareLife Sciences
Cancer research tools portfolio
Streptavidin magnetic beads for biotin capture
In vitro cardiotoxicity testingwith Cytiva™ Cardiomyocytes
High-content assays and screens with IN Cell Analyzer 6000
Sample prep in calorimetric studies

3
Submissiondeadline
August 1
imagination at work
* For the purpose of this prize, molecular biology isdefined as “that part of biology which attempts tointerpret biological events in terms of the physico-chemical properties of molecules in a cell”.
(McGraw-Hill Dictionary of Scientific andTechnical Terms, 4th Edition).
GE Healthcare Bio-Sciences AB,Björkgatan 30, 751 84 Uppsala, Sweden.© 2011 General Electric Company– All rights reserved.
28-9402-06AB
Imagine standing on the podium at the Grand Hotel in Stockholm, making youracceptance speech for the GE & Science Prize for Young Life Scientists. Imaginehaving your essay read by your peers around the world. Imagine discussing yourwork in a seminar with other prize winners and Nobel Laureates. Imagine what youcould do with the $25,000 prize money. Now stop imagining. If you were awarded yourPh.D. in molecular biology in 2010, then submit your 1000-word essay by August 1,and you can make it reality.
Want to build a better reality? Go to www.gescienceprize.org
The GE & Science Prize for Young Life Scientists.Because brilliant ideas build better realities.
Yournamehere.

4
PRO
TEIN PU
RIFICATIO
N AN
D PR
OD
UC
TION
Innovations forum
Stability of membrane proteins analyzed by gel filtrationP. Moberg1, M. Burstedt1, P. Nordlund1, L. Haneskog2, and C. Löw1
1 Department of Medical Biochemistry and Biophysics, Karolinska Institute, Stockholm, Sweden2 GE Healthcare Bio-Sciences AB, Uppsala, Sweden
Well-ordered three-dimensional crystals for structure determination require that the protein preparation is size-homogeneous and stable over a long period of time. Purification of integral membrane proteins requires extraction from their natural lipid environment into detergent-protein complexes. Detergents represent a poor lipid bilayer mimetic and therefore the stability and activity of IMPs is often low. This article describes the use of gel filtration for size-homogeneity analysis to study protein stability and influence of freezing-thawing on integral membrane protein quality.
IntroductionAfter years of research, there is still no golden bullet for receiving well-diffracting membrane protein crystals for structure determination. It is generally accepted that success can only be obtained by extensive screening and optimization of conditions for their preparation. A key requisite for well- diffracting membrane protein crystals is a protein preparation of high purity and size-homogeneity.
In most research laboratories, histidine-tagged membrane proteins are purified in two steps. In the first step, detergent solubilized protein is captured by immobilized metal ion affinity chromatography (IMAC), removing most impurities. In the second step, gel filtration (GF) is used to remove remaining impurities as well as unwanted oligomers and aggregates of the target protein. Earlier, we described the use of GF for screening a wide range of detergents and buffer conditions (pH, salts, and additives) to obtain size-homogeneous integral membrane proteins (IMP) preparations (1). A high enough purity and size-homogeneity can often be obtained, but stability of the purified protein is often limited.
In an ideal workflow for IMP purification, all steps from cell-harvesting over protein purification to start-up of crystallization trials are performed within one day. In reality, an isolated protein often needs to be stored either in the cold room, on ice, or frozen to be thawed later. This handling is often destructive to the protein. During the freeze-thaw process, ice crystals are formed causing buffer salts and proteins to be concentrated. This can influence the stability of the protein significantly (2). To minimize the risk of damaging the protein, process precautions can be made by, for example, addition of glycerol (5% to 10%) and snap-freezing in small aliquots, preferably using liquid nitrogen. Freezing in phosphate buffer sometimes causes decrease in pH due to precipitation of the basic component. Therefore, addition of Tris buffer is often advantageous.
Quality control should preferably be performed before the stored protein is used for further experiments to investigate whether storage at 0°C to 4°C or freeze-thawing has affected the protein. Analytical GF is a powerful tool for determining the homogeneity of proteins. A symmetrical and sharp elution peak in the chromatogram indicates a correctly folded and homogeneous protein preparation.
Here we demonstrate the use of GF for studying the influence of long-term storage and freeze-thaw processes using minimal amounts of purified IMPs. Analytical GF runs were performed on Superdex™ 200 5/150 GL (column volume of 3 ml) using an ÄKTAmicro™ chromatography system. Samples of 25 µl were injected using an autosampler, and separation was performed at 0.25 ml/min with cycle times of 12 min.
Protein expression and purification IMPs carrying N-terminal hexa-histidine tag were expressed in E. coli C41 (DE3) cells at 20°C for 20 h. Cells were disrupted using a high-pressure homogenizer (Avestin), and membranes were harvested by ultracentrifugation at 100 000 × g for 1 h. Membranes were resuspended in solubilization buffer (S-buffer; 20 mM sodium phosphate buffer, 300 mM NaCl, 20 mM imidazole, 5 % glycerol, pH 7.5), and subsequently solubilized in the presence of 1% n-dodecyl β-D-maltoside (DDM) with stirring for 1 h at 4°C. Nonsolubilized material was removed by ultracentrifugation at 100 000 × g at 4°C for 15 min. Purification was performed using IMAC by batch adsorption on Ni Sepharose™ 6 Fast Flow medium for 30 min with end-over-end rotation in a cold room. The chromatography medium was packed in a 10-mm (i.d.) open column for gravity flow.

5
PRO
TEIN PU
RIFICATIO
N AN
D PR
OD
UC
TION
Innovations forum
Fig 1. Long-term stability of the prokaryotic T2 channel 2-(His)6. GF analyses were performed after storage for 0, 1, 7, and 10 days. A broader and lower peak indicates loss of protein integrity. Early peaks indicate protein aggregates.
Fig 2. Effects of freezing and thawing of a purified prokaryotic and enzymatically active IMP in detergent solution. GF analyses were performed as in Fig. 1. Fresh protein (blue), protein snap-frozen in liquid nitrogen and thawed on ice (green), and protein frozen at -20°C and thawed at 4°C (red, no peak).
The column was washed with 20 mM imidazole (10 column volumes, CV), 45 mM imidazole (20 CV), and eluted with 500 mM imidazole (5 CV), all in S-buffer supplemented with 0.03% DDM. Eluted material (5 ml) was applied on HiLoad™ 16/60 Superdex 200 pg gel filtration column at 1 ml/min in GF buffer without imidazole and supplemented with 0.03% DDM.
Long-term stability testAn aliquot of 50 µl from a preparation (1 mg/ml) was stored in a cold room for a period of 10 days. Aliquots of 5 µl were taken out at selected times and diluted with 45 µl of 20 mM HEPES, 150 mM NaCl, 5% glycerol and 0.03% DDM, pH 7.5, and 25 µl of this sample was immediately analyzed by analytical GF. To remove precipitated material in the stored sample, the test tube was centrifuged in a benchtop centrifuge at 20 000 × g for 5 min in the cold room before sample was taken.
Freeze-thaw testAliquots of 50 µl of pure protein were subjected to different freeze-thaw cycles: Sample 1: no freezing; Sample 2; freezing in -20°C overnight; Sample 3: freezing in liquid nitrogen and stored at -80°C for 24 h. Samples were thawed by incubation at 4°C for 1 h, centrifuged at 20 000 × g for 5 min, and subsequently analyzed by GF as described earlier.
ResultsThe prokaryotic T2 channel 2 was stored at 4°C and GF analyses were performed at different times (Fig 1). The fresh protein was monodisperse as judged from the single peak after GF. After one day, a small void peak appeared. Increased storage time led to a dramatic quality loss of channel T2 due to aggregation, as shown by lower and broadened GF peaks compared with the fresh material.
The comparison of GF profiles after a slow freezing process (-20°C, red curve) or flash freezing in liquid nitrogen (green curve) with the nonfrozen sample (blue curve) revealed the importance of fast freezing (Fig 2). Freezing slowly at -20°C in the presence of 5% glycerol and thawing completely precipitated the sample.
Ordering information
Product Code number
HiLoad 16/60 Superdex 200 pg 17-1071-01
Superdex 200 5/150 GL 28-9065-61
ÄKTAmicro chromatography system 28-9483-03
Ni Sepharose 6 Fast Flow 17-5318-01
For more information on our Superdex columns for gel filtration, visit www.gelifesciences.com/protein-purification
0
8
6
4
2
0
A280 (mAU)
0.5 1.0 1.5 2.0 2.5 3.0 Vol. (ml)
Day 0Day 1Day 7Day 10
0
150
100
50
0
0.5 1.0 1.5 2.0 2.5 3.0 Vol. (ml)
Freezing liquid nitrogen and thawed on iceFresh proteinFeezing at -20ºC and thawing at 4ºC
A280 (mAU)
ConclusionsAnalytical GF demonstrates how storage time and/or freezing process affect the stability and homogeneity of IMPs. The short analysis time obtained with a Superdex 200 5/150 GL column enables rapid quality control of IMPs with limited consumption of sample, buffer, and detergent.
References1. C. Löw, et al. Rapid buffer scouting and quality control of integral
membrane proteins. Discovery Matters 12, 10–11 (2010).
2. K. A. Pikal-Cleland et al. Protein denaturation during freezing and thawing in phosphate buffer systems: monomeric and tetrameric beta-galactosidase. Arch. Biochem. Biophys. 384, 398–406 (2000).
Column: Superdex 200 5/150 GLBuffer: 20 mM HEPES, 150 mM NaCl, 5% glycerol, 0.03% DDM, pH 7.5Flow rate: 1 ml/minSystem: ÄKTAmicro

6
Screening of extraction buffers for 2-D DIGE analysis of plant proteinsY. Laurin and P. Oliviusson
GE Healthcare Bio-Sciences AB, Uppsala, Sweden
Sample preparation is a crucial part of the 2-D electrophoresis workflow to achieve a large number of well-resolved protein spots. Plant tissue is a challenging material to work with due to the high content of interfering components and low protein content. A novel workflow for common bean leaves was developed using 2-D Protein Extraction Buffer Trial Kit in combination with 2-D Clean-Up Kit. The purified protein fractions were analyzed by 2-D DIGE and DeCyder™ image analysis software. All tested buffers resulted in overall well-resolved gel images having the majority of relative spot intensities at similar levels. However, some spot intensities depended on the extraction buffer used.
IntroductionPlant tissue often contains high levels of polysaccharides, lipids, and phenolic compounds, which can interfere with protein extraction. A preparation workflow for 2-D DIGE analysis needs a fast and effective cell lysis and protein extraction protocol that ensures the highest solubility, efficient removal of interfering substances, and a minimum of proteolytic activity.
The buffers in the 2-D Protein Extraction Buffer Trial Kit are based on urea or urea/thiourea with different detergents including CHAPS, SB 3-10, and ASB-16 all of which are known to give high solubilization power. The buffers are easily prepared by mixing a dry powder with the supplied diluent solution. Table 1 shows the composition of the six buffers included in the kit.
Table 1. Composition of extraction buffers included in 2-D Protein Extraction Buffer Trial Kit. Buffers highlighted in blue were included in the study together with standard 2-D lysis buffer (7 M urea, 2 M thiourea, and 4% CHAPS)
2-D Protein Extraction Buffer-I Urea (< 10 M) and NP-40* (< 10%)
2-D Protein Extraction Buffer-II Urea (< 10 M) and CHAPS† (< 10%)
2-D Protein Extraction Buffer-III Urea (< 8 M), thiourea (< 5 M), CHAPS (< 5%), and ASB-16‡ (< 5%)
2-D Protein Extraction Buffer-IV Urea (< 8 M), thiourea (< 5 M), CHAPS (< 5%), and SB 3-10§ (< 5%)
2-D Protein Extraction Buffer-V Urea (< 8 M), thiourea (< 5 M), and CHAPS (< 10%)
2-D Protein Extraction Buffer-VI Urea (< 8 M), thiourea (< 5 M), CHAPS (< 5%), and NDSB-201¶ (< 4%)
* Nonylphenyl polyethylene glycol† 3-[(3-Cholamidopropyl)dimethylammonio]-1-propanesulfonate‡ Amidosulfobetaine-16§ n-Decyl-N,N-dimethyl-3-ammonio-1-propanesulfonate¶ 3-(1-Pyridino)-1-propane sulfonate
In this study, leaves from Phaseolus vulgaris (common bean) at seedling stage were used. Buffers III, IV, V, and VI from the 2-D Protein Extraction Buffer Trial Kit and a standard 2-D lysis reference buffer (7 M urea, 2 M thiourea, and 4% CHAPS) were tested. The 2-D Clean-Up Kit was subsequently used for removal of the contaminants, followed by 2-D-DIGE analysis using precast low fluorescent DIGE gels and DIGE Buffer Kit. Figure 1 shows the overall workflow of the study.
Grinding of plant leafin liquid nitrogen
Protein extraction: 2-D Protein Extraction Buffer
Protein clean-up: 2-D Clean Up Kit
Labeling: CyDye™ DIGE Fluor
Protein separation: Ettan IPGphor™ 3,
Ettan™ DALTtwelve system
Image analysis: DeCyder 2D software
Fig 1. Workflow for plant protein extraction.
Protein extractionExtraction buffers were supplemented with 1% DTT, 2% IPG buffer pH 3 to 10 and 10 µl/ml Protease Inhibitor Cocktail VI (P-1545, A. G. Scientific) prior to use.
Two leaf sample replicates of approx. 1.1 g each were ground to powder in liquid nitrogen for 3 min. Each sample was divided into five parts, rapidly mixed with 1 ml of the buffers included in the study and kept on ice until all samples were ground. Following that, all samples were tempered to 30°C to completely dissolve all buffer components. The samples were incubated for 30 min with occasional mixing before centrifugation at 16 100 × g for 30 min at 20°C. The supernatant was collected and stored at -20°C.
Protein clean-up2-D Clean-Up Kit was used according to the kit instructions for samples of >100 µg protein (1). The procedure was optimized as follows: 150 µl of extract was mixed with 450 µl precipitant followed by 450 µl of co-precipitant in 2 ml microtubes with round bottoms to spread out the precipitate. The precipitate was washed with 100 µl of of co-precipitant in step 7 and 100 µl of ultrapure water in step 9. In the latter step, a pipette tip was initially used to disperse the pellet prior to vortex mixing in order to wash the protein precipitate.
PRO
TEIN SAM
PLE PREPARATION
Innovations forum

7
Fig 2. 1-D SDS-PAGE (12% Tris-glycine) of samples (10 µg/lane) extracted by the buffers annotated on the top (EB = 2-D Protein Extraction Buffer) followed by 2-D Clean-Up Kit procedure described in the text. The gel was stained with Deep Purple™ Total Protein Stain.
Fig 3. The spots marked A to E in the gel image are examples of proteins extracted to different levels depending on the buffer used during extraction. The graph view shows the relative abundance of a protein obtained by use of the buffers, respectively.
The pellet was then washed in 1.5 ml of wash buffer and centrifuged at 16 100 × g at 20°C to collect the precipitated protein. The precipitate was solubilized in 50 µl of extraction buffer supplemented with 30 mM Tris, pH 8.5. The solubilization was aided by heating to 30°C for 10 min and mixed by pipetting the sample up and down several times. Finally, the solubilized samples were centrifuged for 5 min and transferred to new tubes to remove any insoluble material. The protein concentration was 2 ± 0.5 mg/ml before and 3.9 ± 1.1 mg/ml after the clean-up step (2-D Quant Kit).
The samples were also analyzed by SDS-PAGE to confirm integrity prior to 2-D DIGE labeling (Fig 2).
M EB re
f
EB II
I
EB IV
EB V
EB V
I
M
1 2 1 2 1 2 1 2 1 2Leaf sample
Mr × 103
97
66
4530
20
14.1
2-D DIGE analysis Labeling was performed with CyDye DIGE Fluor minimal dye labeling kit according to the DIGE manual (2); 35 µg protein of each sample was labeled with Cy™5 and Cy3, respectively, and a pooled standard was labeled with Cy2. A total of 500 pmol dye was used per sample in a final volume of 8 to 14 µl.
Immobiline™ DryStrip gels, pH 3–11 NL (24 cm) were reswollen in 450 µl DeStreak Rehydration Solution. Sample mixes were adjusted to 100 µl final volume with 2-D Protein Extraction buffer VI supplemented with DTT (10 mM final concentration), and applied by cup-loading at the anodic end. The strips were run in a manifold on an Ettan IPGphor 3 instrument. Precast DIGE gels and DIGE Buffer Kit were used for the second-dimension run in Ettan DALTtwelve electrophoresis unit according to the DIGE gel instruction.
The gels were stored overnight at 4°C before scanning in Typhoon™ FLA 9000 Biomolecular Imager. Gel images were evaluated with DeCyder 2-D Differential Analysis Software, v7.0 by the protein statistics function based on Student’s t-test.
All five buffers resulted in well-resolved gel images with the majority of protein spot intensities at similar levels. However, some protein spot intensities depended on the extraction buffer used. Figure 3 shows the gel pattern obtained by Extraction Buffer VI with examples of differentially extracted proteins marked A to E and the corresponding graph view showing the relative abundance of protein in a certain gel spot. The largest difference was found between 2-D Extraction Buffer III and the other buffers.
This buffer was favorable to some spots (D, E) and less effective on the rest of the marked spots while the other buffers were more comparable to each other. The reference buffer and 2-D Protein Extraction Buffer V behaved in a very similar way, which is expected since both buffers are based on thiourea, urea, and CHAPS.
A0.05
0-0.05-0.10-0.15-0.20-0.25-0.30Lo
g st
anda
rdiz
ed a
bsor
banc
e
EB re
f.
EB II
I
EB IV
EB V
EB V
I
B
EB re
f.
EB II
I
EB IV
EB V
EB V
I
0.150.100.05
0-0.05-0.10-0.15-0.20-0.25-0.30Lo
g st
anda
rdiz
ed a
bsor
banc
e
C
EB re
f.
EB II
I
EB IV
EB V
EB V
I
0.100.05
0-0.05-0.10-0.15-0.20-0.25Lo
g st
anda
rdiz
ed a
bsor
banc
e
D
EB re
f.
EB II
I
EB IV
EB V
EB V
I
0.2
0.1
0
-0.1
-0.2
Log
stan
dard
ized
abs
orba
nce
EB re
f.
EB II
I
EB IV
EB V
EB V
I
0.2
0.1
0
-0.1
-0.2
-03Log
stan
dard
ized
abs
orba
nce
E
Summary2-D Protein Extraction Buffer and 2-D Clean-Up Kit give a suitable preparation workflow for 2-D DIGE analysis of plant proteins from Phaseolus vulgaris, and will most likely be useful for protein extraction from other types of leaves. The screening study described compared five different extraction buffers, and some proteins spots showed different relative abundance depending on the buffer used during extraction, which may be beneficial for preparative work of certain proteins of interest.
References1. User Manual: Ettan DIGE System, 18-1173-17, Edition AB (2006).2. Instructions: 2-D Clean-Up Kit, 80-6486-60, Edition AE (2009).
For more information on our range of products for protein and nucleic acid sample preparation, visit www.gelifesciences.com/sampleprep
PRO
TEIN SAM
PLE PREPARATION
Innovations forum

8
A benchmark study of streptavidin magnetic beadsT. Granér, M. Björner, and A. Bergh
GE Healthcare Bio-Sciences AB, Uppsala, Sweden
The binding of streptavidin to biotin is one of the strongest known noncovalent biological interactions and hence a powerful tool for immobilization of ligands for affinity chromatography. Starting with the same streptavidin medium, the desired affinity can be achieved by immobilization of any biospecific molecule derivatized with biotin. This medium can then be used for purification of the desired target. The use of magnetic beads for affinity-based purification simplifies small-scale purifications and provides high flexibility with scales ranging from microliter to milliliter. In this study, we compare the magnetic bead Streptavidin Mag Sepharose™ with corresponding products from other companies. For the tested proteins, Streptavidin Mag Sepharose offers leading performance in terms of binding capacity and achieved enrichment.
Fig 1. Binding capacity for biotinylated polyclonal rabbit IgG for four different streptavidin magnetic beads. Each bar represents the amount of IgG that can be captured using 1 ml of medium slurry.
Table 1. Experimental conditions for binding capacity determination
Supplier GE Healthcare Qiagen Thermo Scientific Invitrogen
Separation medium Streptavidin Mag Sepharose BioMag™ Streptavidin Pierce Streptavidin Magnetic Beads
Dynabeads™ MyOne™ Streptavidin T1
Medium slurry volume 100 µl 100 µl 100 µl 100 µl
Load Overloaded Overloaded Overloaded Overloaded
Binding buffer Tris buffered saline (TBS: 50 mM Tris, 150 mM NaCl), pH, 7.5
TBS, pH 7.5 TBS, 0.1% Tween™ 20, pH 7.5 Phosphate buffered saline (PBS: 140 mM NaCl, 2.7 mM KCl, 10 mM phosphate), pH 7.4
GE Healthcare Invitrogen
Capa
city
(mg/
ml o
f med
ium
slu
rry)
1 2 3
Qiagen
1 2 3
Thermo Scientific
1 2 3 1 2 30
0.2
0.4
0.6
0.8
1.0
1.2
1.4
1.6
1.8
2.0
performance of Streptavidin Mag Sepharose with corresponding magnetic beads from Qiagen™, Thermo Scientific, and Invitrogen™ (Table 1). When a purification protocol was supplied for the product, capture of the biotinylated antibody was performed according to each manufacturer’s instructions. If no protocol was supplied, capture was performed as for Streptavidin Mag Sepharose. To determine the binding capacity, 100 µl of medium slurry of each medium was overloaded with IgG and the binding capacity was calculated by subtracting the amount of protein collected in the flowthrough fractions from the amount of protein loaded as determined using the BCA Protein Assay (Thermo Scientific). The determinations were performed in triplicate.
Binding capacity of Streptavidin Mag Sepharose was approx. 1.7 mg IgG/ml of medium slurry, which is considerably higher than the binding capacity of the other products.
Binding capacity for biotinylated IgG A comparative benchmark analysis was performed at GE Healthcare Life Sciences’ laboratories to investigate the binding capacity of different streptavidin magnetic beads products for biotinylated polyclonal rabbit IgG (DakoCytomation). The antibody was biotinylated using EZ-Link™ Sulfo-NHS-LC Biotinylation kit (Thermo Scientific™). We compared the
PRO
TEIN SAM
PLE PREPARATION
Innovations forum

9
Fig 2. Purity benchmark study. The SDS gel was run under reducing conditions, stained with Deep Purple™ Total Protein Stain, and analyzed using ImageQuant TL software.
Fig 3. Enrichment of human transferrin using streptavidin magnetic beads from different suppliers. Enrichment of transferrin relative to the start material was determined by SDS-PAGE analysis. Quantitation of the eluted transferrin was performed using a standard curve with known amounts of transferrin (data not shown).
Enrichment of captured proteinsIn another comparative study, the enrichment of proteins captured on streptavidin magnetic beads with immobilized biotinylated IgG antibodies was determined. Streptavidin Mag Sepharose was compared with corresponding magnetic beads from Qiagen, Thermo Scientific, and Invitrogen as in the binding capacity test. A biotinylated polyclonal rabbit antibody was immobilized on 50 µl of medium slurry of each medium, after which they were exposed to 300 µl of 7.5 µg/ml of human transferrin in a background of 5 mg/ml E. coli proteins. This immunoprecipitation procedure was performed in duplicate following the manufacturer’s protocol when supplied (Table 2). The enrichment of the eluted fractions was estimated by SDS-PAGE (Fig 2) and the SDS gels were analyzed using ImageQuant™ TL software (Fig 3). Streptavidin Mag Sepharose gave a 430-fold enrichment; higher than for Invitrogen (300-fold), Qiagen (150-fold), and Thermo Scientific (120-fold).
Table 2. Experimental conditions purity assessment
Supplier GE Healthcare* Qiagen* Thermo Scientific* Invitrogen*
Separation medium Streptavidin Mag Sepharose BioMag Streptavidin Pierce Streptavidin Magnetic Beads Dynabeads MyOne Streptavidin T1
Medium slurry volume 50 µl 50 µl 50 µl 50 µl
Antibody load 0.3 ml of 0.2 mg/ml 0.3 ml of 0.2 mg/ml 0.3 ml of 0.2 mg/ml 0.3 ml of 0.033 mg/ml
Sample 0.3 ml of 7.5 µg/ml human transferrin in 5 mg/ml E.coli protein
Binding buffer TBS, pH 7.5 TBS, pH 7.5 TBS, 0.1% Tween 20, pH 7.5 PBS
Wash buffer TBS, 2 M urea, pH 7.5 TBS, 2 M urea, pH 7.5 TBS, 0.1% Tween 20, pH 7.5 PBS
Elution buffer 0.1 M glycine-HCl, 2 M urea, pH 2.9
* Manufacturer’s recommended protocols were used throughout this study
14.0
20.1
30.0
45.0
66.0
97.0
1 65432 7 1098
1. LMW
2. 7.5 µg/ml transferrin + 5 mg/ml E.coli protein
3, 4. Streptavidin Mag Sepharose, GE Healthcare
5, 6. BioMag Streptavidin, Qiagen
7, 8. Pierce Streptavidin magnetic beads, Thermo Scientific
9, 10. Dynabeads MyOne Streptavidin T1, Invitrogen
Mr × 103
Lane1 Low molecular weight markers2 7.5 µg/ml transferrin in 5 mg/ml E. coli protein3, 4 Eluted pool: Streptavidin Mag Sepharose5, 6 Eluted pool: BioMag Streptavidin7, 8 Eluted pool: Dynabeads MyOne Streptavidin T19, 10 Eluted pool: Pierce Streptavidin magnetic beads
14.0
20.1
30.0
45.0
66.0
97.0
1 65432 7 1098
1. Low Molecular Weight Marker
2. Start material
3, 4. Elution pool, Streptavidin Mag Sepharose, GE Healthcare
5, 6. Elution pool, BioMag Streptavidin, Qiagen
7, 8. Elution pool, Dynabeads MyOne Streptavidin T1, Invitrogen
9, 10. Elution pool, Pierce Streptavidin magnetic beads, Thermo Scientific
Mr × 103
X-fo
ld e
nric
hmen
t
GE Healthcare Invitrogen Qiagen Thermo Scientific
0
50
100
150
200
250
300
350
400
450
ConclusionsA benchmark study performed at our laboratory showed that Streptavidin Mag Sepharose has considerably higher binding capacity for biotinylated IgG as compared to the tested streptavidin magnetic beads products from Qiagen, Thermo Scientific, and Invitrogen.
Moreover, the enrichment achieved using Streptavidin Mag Sepharose beads was better than the other products tested. In the test system, an enrichment factor of 430 was obtained with Streptavidin Mag Sepharose, which was higher than for the equivalent products from other suppliers.
Ordering information
Product Code number
Streptavidin Mag Sepharose, 2 × 1 ml, 10% medium slurry 28-9857-38
Streptavidin Mag Sepharose, 5 × 1 ml, 10% medium slurry 28-9857-99
For more information on Mag Sepharose beads for protein enrichment and immunoprecipitation, visit www.gelifesciences.com/sampleprep
PRO
TEIN SAM
PLE PREPARATION
Innovations forum

10
Rapid sample preparation for MicroCal™ ITC and DSC experiments using PD MidiTrap™ G-25 columnsS. Perumal, R. O’Brien, and V. Frasca
GE Healthcare Bio-Sciences, Piscawatay, NJ, USA
PD MidiTrap G-25 columns were used for rapid and simple buffer exchange of samples for isothermal calorimetry and differential scanning calorimetry (DSC) studies where a match between the buffers in the sample and reference cells is crucial for reliable results. For both techniques, buffer exchange with either method was essential in order to determine thermodynamic parameters and heat capacity changes. Compared to dialysis, gel filtration of samples on PD MidiTrap G-25 is much faster and requires less buffer while at the same time gives the same high quality analysis data.
IntroductionTo obtain accurate results in isothermal calorimetry (ITC) and differential scanning calorimetry (DSC), buffers must be carefully matched between the sample and the reference cells to minimize heats of dilution. Sample preparation thus usually involves buffer exchange, which can be achieved by dialysis or gel filtration.
Gel filtration with Sephadex™ G-25 medium enables group separation of biomolecules with a molecular weight above 5000 from contaminants such as salts, dyes, and radioactive labels. The medium is designed for desalting and buffer exchange of biological samples such as proteins, and is stable with all commonly used buffers. PD MidiTrap G-25 are prepacked, disposable columns designed for sample preparation of volumes between 0.5 ml and 1 ml (Fig 1). These columns can be operated using two alternative protocols: The gravity protocol provides a simple cleanup of several samples in parallel without any need for a purification system; and the centrifugation protocol allows samples to be run in parallel in a standard centrifuge, giving minimal dilution of the eluted sample.
Fig 1. PD MidiTrap G-25 columns were used for buffer exchange before isothermal titration calorimetry of RNAse A using MicroCal iTC200 system.
MicroCal ITC200 system (Fig 1) allows direct and label-free measurement of binding affinity and thermodynamics. Heat released or absorbed during biochemical binding events is measured directly, giving information about relative binding affinity (KD), stoichiometry (n), enthalpy (ΔH), and entropy (ΔS). This information provides valuable insights into the mechanism of binding, including hydrogen bonding, van der Waals interactions, and hydrophobic interactions. Microcal DSC systems measure the instability of biomolecules and can be used both to predict long-term stability and to understand the noncovalent forces responsible for protein or lipid micelle stability.
The sample volume needed for analysis in MicroCal ITC200 and MicroCal VP-Capillary DSC is 250 µl and 400 µl, respectively. PD MidiTrap G-25 columns were used for buffer exchange.
Materials and methodsRibonuclease A (RNase A, Sigma-Aldrich) was prepared in 50 mM potassium acetate buffer, pH 5.5. To compare the results obtained in calorimetry between samples prepared by dialysis and gel filtration, 100 mM NaCl, 50 mM Tris buffer were added to RNase A solution in 50 mM potassium acetate buffer.
Sodium chloride and Tris were removed from RNase A by buffer exchange. For buffer exchange by dialysis, a Spectra/Por™ (Spectrum™ Laboratories Inc.) natural cellulose dialysis membrane tubing was soaked for 30 min in 50 mM of potassium acetate buffer to remove the sodium azide preservative, after which 1 ml of RNase A sample was carefully injected into the tubing. The dialysis buffer (50 mM potassium acetate buffer, pH 5.5) was replaced three times over the course of a day (300 ml each), and left overnight at 4˚C on a stir plate.
For buffer exchange by gel filtration, PD MidiTrap G-25 columns (GE Healthcare Life Sciences) were used according to the manufacturer’s recommended gravity protocol, using 50 mM potassium acetate buffer, pH 5.5 as buffer. A volume of 1 ml of RNase A was used per column. Sample preparation was complete within 30 min and less than 20 ml of buffer was used altogether.
Protein concentrations before and after buffer exchange were determined with a spectrophotometer using an extinction coefficient of 9800/cm/M at 280 nm. Cytidine 2’-monophosphate (2’-CMP, Sigma-Aldrich) at a concentration of 795 µM was prepared in 50 mM potassium acetate buffer, pH 5.5. Calorimetric analysis was performed in either MicroCal ITC200 or MicroCal VP-Capillary DSC.
ITCThree different experiments were performed with MicroCal ITC200 system. The first used RNase solution in potassium acetate buffer with added Tris and NaCl before buffer exchange. The second used RNase in potassium acetate buffer after buffer exchange with dialysis. The third experiment used RNase in potassium acetate buffer after gel filtration. The sample cell was filled with 250 µl of 60 µM RNase A in indicated buffer. The titration syringe was filled with 40 µl of 795 µM 2’-CMP in 50 mM potassium acetate buffer. The reference cell was filled with deionized water. For each experiment, 40 µl of titrant was injected into the sample cell in aliquots of 2 µl at a rate of 0.5 µl/s. The following settings were used: Stir speed 1000 rpm, reference power 5 µcal/s, feedback mode/gain set to high, temperature 25˚C, initial delay 60 s. Data were analyzed with Origin software, v7 (OriginLab™ Corporation) for ITC.
PRO
TEIN SAM
PLE PREPARATION
Innovations forum

11
DSCThree different experiments were performed with MicroCal VP-Capillary DSC system. The first used RNase solution in potassium acetate buffer with added Tris and NaCl before buffer exchange. The second used RNase in potassium acetate buffer after buffer exchange with dialysis. The third experiment used RNase in potassium acetate buffer after gel filtration The sample solution of 60 µM RNase A in indicated buffer and reference solution (50 mM potassium acetate buffer) were placed in a 96-well plate (400 µl each). The samples were scanned from 20˚C to 110˚C at a scan rate of 250˚C/h, with 15 min equilibration before each scan. Data were analyzed with Origin v7 for DSC, following buffer subtraction and concentration correction of the protein scans.
ResultsITCTo compare the effectiveness of dialysis and buffer exchange, the same batch of RNase A sample was prepared by either dialysis or gel filtration using PD MidiTrap G-25 columns. The raw ITC data generated from both methods were compared (Fig 2A). The profile from dialysis (red line) and gel filtration (blue line) were overlayed and very small changes were seen. For comparison purposes, Fig 2B shows the profile obtained from RNase A without buffer exchange by dialysis or gel filtration. The excessive heats of dilution observed here (black line) made it difficult to determine thermodynamic parameters from the the RNase A and 2’-CMP interaction. Overall, both dialysis and buffer exchange methods were successful in removing the low-molecular contaminants (i.e., NaCl, Tris) and gave the same high quality data. The thermodynamic parameters were also found to be in excellent agreement.
DSCDSC scans generated from the same RNase A sample prepared by either dialysis (red line) or gel filtration (blue line) were compared (Fig 3). Both profiles clearly overlapped, with the heat capacity of the baseline close to zero and a more linear pre- and post-transitional baseline. For comparison purposes, a scan of RNase A sample without buffer exchange by dialysis or gel filtration is shown (black line). The observed nonlinear pre- and post-transitional baseline is indicative of poor solvent matching, and thus it was not possible to determine the enthalpy and heat capacity change accurately from this profile.
As a result of more accurately matched buffers, it was possible to determine not only the Tm, but also the enthalpy and heat capacity change (from the red and blue profiles), which were found to be in excellent agreement between the two methods.
Ordering information
Product Code number
PD MidiTrap G-25 28-9180-08
MicroCal iTC200 System 28-4289-55
MicroCal VP-Capillary DSC System 28-4289-48
0.00
10
5
0
-5
-10
µca/
s
µca/
s
8.33 16.67 25.00 33.33 41.67 50.00 Time (min)0.00
10
5
0
-5
-10
8.33 16.67 25.00 33.33 41.67 50.00 Time (min)
A) B)
Fig 2. A) Overlapping profiles of raw ITC data of the interaction between 60 µM RNase A and 795 µM 2’-CMP obtained after dialysis (red line) and after gel filtration (blue line) using the gravity protocol. B) Raw ITC data of the interaction without buffer exchange by dialysis or gel filtration.
Fig 3. DSC scans obtained from 60 µM RNase A without buffer exchange by dialysis or gel filtration (black line), after dialysis (red line) and after gel filtration (blue line) using the gravity protocol.
1
0
-1
-2
-3
-4
-5
-6
20 40 60 80 100 120
Cp
(kca
l/mol
/°C
)
Temperature (°C)
ConclusionsIn order to obtain high-quality calorimetric data, sample preparation is crucial. Buffer matching as well as removal of low-molecular weight contaminants contribute to minimize high heats of dilution in both ITC and DSC experiments.
The simplicity and efficiency of PD MidiTrap G-25 columns is well suited to buffer exchange by gel filtration and provides the same high quality data as dialysis. Moreover, gel filtration gives faster buffer exchange, is easier to use, and requires significantly lower buffer volumes than dialysis.
For more information on our wide range of products for sample preparation, visit www.gelifesciences.com/sampleprep. To discover more about our offering of MicroCal instruments for label-free measurement of binding affinity and thermodynamics, visit www.gelifesciences.com/microcal
PRO
TEIN SAM
PLE PREPARATION
Innovations forum

12
Cancer research tools from GE Healthcare
Purifying potential target proteinsÄKTA™ chromatography systems combined with a full range of media and columns allow for research-scale purification to large-scale manufacturing of biopharmaceuticals. Systems such as ÄKTA avant are widely used in big pharma, CRMs, academia, and small drug development companies due to their consistency, reliability, and flexibility.
If potential target proteins for inhibitors are in fact determined, overexpression and purification of these proteins is the next logical next step. Chromatography systems such as ÄKTAmicro™ are used for micropreparative purification and prefractionation of proteins (2), which can be used to facilitate identification of differentially expressed proteins as a result of drug treatment.
Technology central
Expression analysis using 2-D DIGEThe novel 2-D electrophoresis application 2-D DIGE (Difference Gel Electrophoresis) has allowed researchers to achieve more reliable and quantitative results for differentially expressed proteins. In cancer research, these putative biomarkers can be a key factor to determining the disturbance of pathways leading to the disease as well as be used for diagnostic purposes and to ascertain drug targets. Case scenarios in which 2-D DIGE has been used successfully include the analysis of HER-2 growth factors in breast cancer research and analysis of differentially expressed proteins in multicellular tumor spheroids after drug treatment (1).
For more information, visit www.gelifesciences.com/2D For more information, visit www.gelifesciences.com/akta
The GE Healthcare Life Sciences portfolio of technologies provides tools to help researchers build a foundation to better understand cancer from expression to function and to use these findings to develop and improve treatments. The technologies we provide include: electrophoresis products for biomarker discovery; chromatography systems and media for target protein purification; high-content imaging systems for the study of cells and their components. In addition, our cell technology portfolio offers innovative solutions for production of cell lines. And of course, we also provide technical expertise and support in all these areas.

13
Label-free interaction tools for cancer researchPurified proteins are needed for further functional studies with platforms such as Biacore™ and MicroCal™ systems, both of which utilize label-free detection technologies to study binding interactions. Biacore sytems are used in cancer research to evaluate and rank potential drug or diagnostic targets, and to optimize new antibodies, affibodies, small peptides, or even small molecules for ideal binding (3). Performing early screening studies of potential drugs saves time and money in follow-up studies. For instance, if an identified target has shown promising binding to a particular small molecule, Biacore systems can be used to screen a library of related small molecules to select top binding partners. Then, by determining association and dissociation rates in addition to equilibrium constants, greater insight into structure-function relationships can be gained.
Cellular analysis using IN Cell AnalyzerTo test insights gained from the previous technologies on a cellular level, the IN Cell Analyzer platform offers high content imaging and analysis of cell-based assays ranging from basic research to evaluating potential drug candidates. The system allows up to four fluorophores visualized in parallel, while extracting a massive amount of information for each condition. Such information includes fluorescent intensity, counting of cells and organelles, and changes in size or morphology of cells or organelles. For cancer research, these assays provide essential in vivo information. Examples are monitoring toxicology and effectiveness of cancer drugs by observing cell morphology (6), protein translocation, cell movement, and more.
Technology central
Biacore system sensorgrams define whether binding takes place at all and if so to what extent. The sensorgram also shows in real-time how fast the binding and dissociation takes place. Equations can than be fitted to the resulting curve to calculate on rates, off rates, and affinities.
With MicroCal systems, software, and consumables, molecular interactions can be investigated with isothermal titration calorimetry (ITC) to determine affinity and thermodynamic properties such as enthalpy, entropy, and Gibbs free energy. These factors help us to understand whether interactions are based on hydrophilic events, van der Waal interactions, or hydrophobicity (4). In cancer research, this can be used to rationally optimize drug structure. Moreover, MicroCal differential scanning calorimetry (DSC) can be used to study protein unfolding quickly and directly and can be used to rapidly identify the conditions that lead to optimum stability such as for liquid formulations of biomolecular pharmacueticals (5).
For more information, visit www.gelifesciences.com/biacore and www.gelifesciences.com/microcal
For more information, visit www.gelifesciences.com/incell
SummaryGE Healthcare provides a wide range of tools, service, and support to help build effective and comprehensive cancer research programs. With the spirit of innovation, our goal is to partner with researchers to win the war on cancer, a disease that will impact one in three people in their lifetime.
References1. Scientific poster: 2-D DIGE analysis of Multicellular Tumor Spheroids
(MTS) in evaluation of cancer treatment, GE Healthcare, 28-9974-30, Edition AB (2011).
2. Application note: Micropreparative prefractionation using ÄKTAmicro prior to protein expression profiling, GE Healthcare, 28-9519-46, Edition AA (2009).
3. Application note: Cancer research and proteomics. Label-free interaction analysis: revealing the secrets of biomolecular interactions, GE Healthcare, 28-9383-23, Edition AA (2008).
4. Application note: Revealing kinase inhibitor mechanisms, GE Healthcare, 28-9870-38, Edition AA (2010).
5. Application note: Applications of differential scanning calorimetry in the development of liquid formulations for protein biopharmaceuticals, GE Healthcare, 28-9870-37, Edition AA (2010).
6. Application note: Use of online cell counting for micronucleus and neurite outgrowth assays on IN Cell Analyzer 2000, GE Healthcare, 28-9673-96, Edition AA (2009).

14
Concentration and recovery of proteins from cell culture media using Vivaspin sample concentratorsF. Sabounchi Schütt
GE Healthcare Bio-Sciences AB, Uppsala, Sweden
Ultrafiltration provides a simple and efficient technique to concentrate proteins from dilute solutions. We used Vivaspin sample concentrators to obtain sample solutions with concentrations high enough for robust quantitation of IgG1. Starting directly from a CHO cell culture, IgG1 concentration was too low to be detected by affinity chromatography unless the sample had first been concentrated using Vivaspin.
Vivaspin sample concentrators efficiently remove buffer and low molecular weight (LMW) components while retaining the proteins in higher concentrations. Up to 30-fold sample concentration can be achieved with a recovery of the target molecule typically exceeding 95%. The entire process is performed in a single tube with an upper compartment containing sample and a lower compartment separated by a semipermeable membrane with a defined molecular weight cutoff (MWCO). Centrifugation is applied to force the solvent through the membrane, leaving a more concentrated sample in the upper chamber.
In this study, we concentrated samples from E. coli fermentation broth and from culture supernatant from a mammalian cell line with Vivaspin. In the first experiments, two representative model proteins were spiked into E. coli fermentation broths. One is protein L, an intracellular-expressed protein and the other ZätA, an extracellular-expressed periplasmatic protein. Intracellular-expressed proteins usually require mechanical treatment, such as sonication to break the intracellular cell wall. In the case of periplasmic protein, heat treatment is often used to cause leakage of the protein directly into the medium. In both cases, contaminant proteins usually follow the target protein into the medium. When optimizing the factors influencing extraction, purification, and characterization of such proteins, the content of fermentation broth needs to be analyzed.
In a final experiment, IgG1 was concentrated and recovered from an extremely diluted CHO cell culture feed. Purification of IgG1 from CHO feed requires several purification steps and sample concentration can be required several times during the process. Affinity chromatography was used to highlight the ability of Vivaspin to remove unwanted LMW components and concentrate the target protein in the samples.
MethodsAll equipment was used according to the manufacturer’s recommendations. The initial absorbance was measured and protein solutions were loaded and the tubes weighed. After concentration in Vivaspin, the recovered concentrates were diluted to the original weight, and the absorbance measured.
Table 1. Results from concentration experiments with Vivaspin sample concentrators
Sample Vivaspin concentrator
Volume loaded Centrifugation Conc. Factor* Adjusted conc. (mg/ml)
Expected conc. (mg/ml)
Recovery† (%)
E. coli fermentation broth spiked with protein L
Vivaspin 6 MWCO 10 000
4 ml15 min 4000 rpm swing out
3 × 1.2 1.5 75
Vivaspin 2 MWCO 10 000
2 ml10 min 4000 rpm swing out
8 × 3.4 4 86
E. coli fermentation broth spiked with ZätA
Vivaspin 6 MWCO 10 000
6 ml15 min 4000 rpm swing out
3 × 0.25 0.21 86
CHO cell culture supernatant containing IgG1
Vivaspin 6 MWCO 50 000
6 ml20 min 4000 rpm swing out
23 × 0.012
Too low to quantitate; below detection limit of the method
Not determined
* Conc. Factor = starting volume/recovered volume† Recovery (%) = Absrecovered × 100/Absstart
Introduction Samples recovered from chromatographic processes are frequently too dilute for immediate use in the next purification step or for detection in biological assays. The initial concentration of a target protein can also be too low to quantitate.
PRO
TEIN SAM
PLE PREPARATION
Innovations forum

15
Ordering information
Product Code number
Vivaspin 2, MWCO 10 000 28-9322-47
Vivaspin 6, MWCO 10 000 28-9322-96
Vivaspin 6, MWCO 50 000 28-9323-18
HiTrap MabSelect SuRe, 5 × 1 ml 11-0034-93
Fig 1. E. coli fermentation broth spiked with protein L (0.5 mg/ml), concentrated with Vivaspin 2 or 6. Affinity chromatography on HiTrap IgG Sepharose FF.
Chromatography was performed using ÄKTAexplorer™ system with UNICORN™ software, v5.01. Recovery and concentration factor (CF) were calculated and compared.
Bacterial cell culture samplesE. coli BL21 cells were grown at 37°C overnight on a sterile 2TY culture medium containing 16 g/l peptones, 10 g/l yeast extract, and 5 g/l NaCl, pH 7.0. The cells were harvested by centrifugation for 10 min, 10°C, after which the supernatants were collected and refrigerated until use. To achieve a full quantitative comparison before and after Vivaspin concentration, the broth was spiked with known concentrations of protein L (0.5 mg/ml) or ZätA (0.07 mg/ml), respectively. Samples were then concentrated with Vivaspin 2 and Vivaspin 6, MWCO 10 000.
Absorbance was measured at 280 nm for protein L and at 273 nm for ZätA, before and after concentration. After concentration, samples were purified by affinity chromatography on a 1 ml HiTrap™ IgG Sepharose™, or 1 ml HiTrap MabSelect SuRe™ column. Protein concentration was determined by the standard addition method (STD-add). Briefly, sample was split into five aliquots after which the standard protein was spiked into each aliquot in increasing concentration. This was used instead of a calibration curve to help with the matrix effect problem. A minimum of 1.5 ml sample was needed for the STD-add method, so the recovered sample from the Vivaspin 2 concentrator was diluted to 1500 µl before sample application.
Mammalian cell culture samplesA clarified filtered CHO cell culture supernatant supplied by Polymun Scientific (Austria) containing less then 0.2 µg IgG1/ml and colored by phenol red for pH indication was concentrated with Vivaspin 6, MWCO 50 000. The concentrate was purified with analytical affinity chromatography on a 1 ml HiTrap MabSelect SuRe column to enrich the IgG1 for concentration determination. The recovered sample was diluted four-fold to obtain enough volume for the chromatographic step.
ResultsTable 1 shows the result of concentration by Vivaspin and the following affinity chromatography analysis for protein L, ZätA, and IgG1. For the CHO feed, recovery could not be calculated since the original concentration was too low to quantitate. The result of affinity chromatography of protein L and ZätA, respectively, on HiTrap IgG Sepharose FF after concentration is shown in Figures 1 and 2. The corresponding results for IgG1 run on HiTrap MabSelect SuRe are shown in Figure 3.
Conclusion Vivaspin 2 and Vivaspin 6 were used for protein concentration in fermentation broth and mammalian cell culture medium. Using Vivaspin, most of the interfering components in the broth were removed by centrifugation in one step while the volume was reduced. Further analysis of the samples on the affinity columns could be performed without excessive signal noise and normal affinity chromatography curves were obtained. Further, using Vivaspin for concentration, IgG1 from an extremely diluted CHO cell culture could be quantitated by affinity chromatography.
Vivaspin reduced the complexity of the samples, made further analysis convenient, and ensured reliable results.
0
1600
1400
1200
100
800
600
400
200
0
A280 (mAU)
2 4 6 8 10 12 14 16 Vol. (ml)
Concentrated with Vivaspin 6Before concentrating
Concentrated with Vivaspin 2
0
400
300
200
100
0
2 4 6 8 10 12
Before concentrating
A280 (mAU)
Vol. (ml)
Concentrated with Vivaspin 6
120
100
80
60
40
20
0
1 2 3 4 5 6 7
Concentrated with Vivaspin 6
A280 (mAU)
Vol. (ml)
Before concentrating
For more information on our range of Vivaspin sample concentrators, visit www.gelifesciences.com/sample prep
Fig 3. Concentration of IgG1 from CHO cell culture feed. Concentration by Vivaspin 6 and affinity chromatography on HiTrap MabSelect SuRe .
Fig 2. E. coli fermentation broth spiked with ZätA protein (0.07 mg/ml ), concentrated with Vivaspin 6. Affinity chromatography on HiTrap IgG Sepharose FF.
PRO
TEIN SAM
PLE PREPARATION
Innovations forum

16
DRU
G SC
REENIN
G AN
D C
ELLULAR ASSAYS
Innovations forum
GE Healthcare Life Sciences’ Cytiva Cardiomyocytes are derived from human embryonic stem cells. In this study, Cytiva Cardiomyocytes were challenged with a panel of test compounds with known or suspected cardiotoxic liabilities. High-content analysis (HCA) of the results allowed cardiotoxic compounds to be identified and distinguished from each other based on their phenotypic profiles.
IntroductionDuring drug development, early identification and characterization of toxic compounds can help prevent potentially harmful drugs from progressing into costly and time-consuming animal studies or clinical trials. Since cardiotoxicity is a common cause of drug withdrawal during development, there has been an increased demand for more relevant and readily available cell models for in vitro cardiotoxicity testing. To address this need, GE Healthcare now offers human cardiomyocytes derived from stem cells, a self-renewing source for scalable manufacture of somatic cells. GE Healthcare’s Cytiva Cardiomyocytes constitute a physiologically relevant cell model for early safety testing. Here, the effects of six different test compounds on Cytiva Cardiomyocytes were examined using a multiplexed high-content imaging assay.
MethodFollowing incubation with test compound, Cytiva Cardiomyocytes were incubated with a cocktail of four fluorescent probes that simultaneously report on plasma membrane integrity, calcium homeostasis, nuclear phenotype, and mitochondrial status. The cells were then imaged live with IN Cell Analyzer 2000, and the images subjected to HCA using IN Cell Investigator software.
Results and discussionInspection of representative images from the study (Fig 1) confirmed that there are distinct differences in the cellular phenotypes induced by test compounds such as doxorubicin and amiodarone.
Doxorubicin is a chemotherapeutic agent known to induce acute cardiotoxicity by a mechanism that involves cardiomyocyte apoptosis (1). Doxorubicin toxicity was readily detected by our assay, which reported a dose-dependent decrease in plasma membrane integrity concomitant with dose-dependent changes in nuclear area, mitochondrial shape (1/form factor), and intracellular calcium concentration. The toxic dose inducing half maximal plasma membrane integrity of the sample (TD50) was 1.6 µM, which is the same order of magnitude as values reported with other model systems (2).
Amiodarone is a class III antiarrhythmic drug that has multiple channel blocking actions. Dose-response analysis demonstrated that amiodarone induces loss of plasma membrane integrity with a TD50 of 4.5 µM, just above typical therapeutic doses, which can range from 0.75 to 3 µM (0.5 to 2 µg/ml) (3). Amiodarone also affects nuclear area, mitochondrial shape and calcium mobilization, but with pharmacodynamics which differ from those elicited by doxorubicin.
While conventional dose-response plots derived from this four-color toxicity assay indicated differences in compound effects, HCA was able to extract much more detailed and robust information from the images by applying sophisticated analysis techniques to assess more than 50 individual cell measurements collected from every cell imaged in the study. The wealth of measurements amassed by the study was analyzed using clustering and profiling tools accessible through IN Cell Investigator software.
Cell parameters (13)
Calcium Nuclei Mitoch PM
Min Max
Resp
onse
(nor
mal
ized
per
cent
)
Treatment condition
0 µm33 µm
Amiodarone
Doxorubicin
Nifedipine
Cell parameter
Fig 1. A multiplexed cytotoxicity assay reveals distinct differences in cell phenotype. Cytiva Cardiomyocytes were treated for 24 h with test compounds or DMSO only, and then stained for mitochondrial status (TMRM, red), calcium mobilization (Fluo-4 AM, green), DNA/nuclear status (Hoechst™ 33342, blue), and cell viability (TOTO-3 iodide, not displayed in the images). Cells were imaged live with IN Cell Analyzer 2000. Data from all six compounds were analyzed using hierarchical clustering and profiling tools accessed through the IN Cell Investigator analysis software interface; selected results are shown here.
High-content analysis of a live multiplexed cytotoxicity study using Cytiva™ Cardiomyocytes and IN Cell Analyzer 2000C. Hather, L. Roquemore, and N. Thomas
GE Healthcare, The Maynard Centre, Cardiff, U.K.

17
DRU
G SC
REENIN
G AN
D C
ELLULAR ASSAYS
Innovations forum
Ordering information
Product Code number
IN Cell Analyzer 2000, with large chip CCD camera 28-9535-10
IN Cell Investigator I Seat, Web download 28-4089-71
Cytiva Cardiomyocytes (1E5), 1 × 10⁵ cardiomyocytes 28-9774-35
Cytiva Cardiomyocytes (1E6), 1 × 10⁶ cardiomyocytes 28-9763-98
Cytiva Cardiomyocytes (5E6), 5 × 10⁶ cardiomyocytes 28-9763-99
Heatmap visualization and multiparametric profile plots (Fig 1) revealed that amiodarone and doxorubicin elicit dramatically different multiparametric ‘signatures’. These distinct signatures suggest that the two drugs can induce cell death through different signaling mechanisms, a hypothesis that is supported by published studies (3,4). It is also noteworthy that replicate samples tend to have similar signatures or profiles (i.e., they cluster together), as do different doses of the same compound. This observation is an indication that profiling on the basis of multiple parameters provides a relatively robust means of distinguishing subtle compound effects (5).
Correctly interpreting complex multiparametric data from an HCA study can be a significant challenge, especially when some of the reported measurements can be interdependent. Principle Component Analysis (PCA), accessible through the IN Cell Investigator software interface, is a powerful tool that can be used to simplify large multiparametric data sets, returning a smaller number of independent variables (principal components). In this study, 54 cellular parameters from each treatment condition were reduced to three principle components. Multidimensional plots of the principle components (Fig 2) revealed distinct clusters and dose-dependencies for the test compounds. It is readily apparent that three of the test compounds (doxorubicin, amiodarone, and antimycin A) elicit markedly different cellular phenotypes, particularly at higher doses. The phenotype induced by doxorubicin developed in a dose-dependent manner over the concentration range, while antimycin A and amiodarone elicited a threshold type of response. By contrast, diclofenac, zidovudine, and nifedipine produced PCA profiles more similar to the DMSO controls, and exhibited a smaller dynamic range of response. While these three compounds have been associated to varying extents with cardiovascular toxicity, literature suggests that their damaging effects are likely to be cumulative and less acutely cytotoxic than those of doxorubicin, amiodarone, and antimycin A.
ConclusionEarly identification of cardiotoxic compounds can be critical to reducing drug development costs and avoiding adverse reactions. High-content toxicity studies conducted with GE Healthcare’s Cytiva Cardiomyocytes have the potential not only to identify compounds with potential cardiotoxic liabilities, but also to differentiate different toxic compounds by mode of action and group them based on similarities in their responses.
For a detailed description of this study, visit www.gelifesciences.com and search for document 28-9859-16 under the Literature tab.
In this study, automated live-cell imaging and analysis yielded a wealth of detailed cellular information that was used to generate phenotypic profiles for the test compounds. Using various data clustering, profiling, and transformation tools accessible through IN Cell Investigator software, two compounds likely to mediate apoptosis by different mechanisms were readily distinguished from each other, and the dose-dependencies of their effects were examined. HCA profiling with Cytiva Cardiomyocytes provides a sensitive and robust screening approach to identify potential cardiotoxic liabilities and gain early insight into their mechanisms of toxicity.
References1. Arola, O. J. et al., Acute doxorubicin cardiotoxicity involves
cardiomyocyte apoptosis. Cancer Res. 60, 1789–1792 (2000).
2. Filigheddu, N. et al., Hexarelin protects H9c2 cardiomyocytes from doxorubicin-induced cell death. Endocrine 14, 113–119 (2001).
3. An, J. et al. ARC is a critical cardiomyocyte survival switch in doxorubicin cardiotoxicity. J. Mol. Med. 87, 401–410 (2009).
4. Di Matola, T. et. al. Amiodarone induced cytochrome C release and apoptosis through an iodine-independent mechanism. J. Clin. End. & Metab. 85, 4323–4330 (2000).
5. Freeley, M. et al., A high-content analysis toolbox permits dissection of diverse signaling pathways for T-lymphocyte polarization. J. Biomol. Screening 15, 541–555 (2010).
Fig 2. PCA analysis of the six-compound study reveals multiparametric differences in compound effects. A) Each of the 3 principle components is plotted on a separate axis; B) The first two principle components are plotted on the x and y axes, respectively, with arrows connecting the points to indicate increasing drug concentration. In both plots, data points are colored by compound, as shown in the key.
A) A)

18
What’s new
?
Protein Sample Preparation – new handbook
IN Cell Analyzer 6000
The overall goal of sample preparation is to feed the analytical technique of choice with protein subsamples of a quality that maximizes the chances of successful analysis. As protein analysis has become more complex and more sensitive, the need for adequate screening techniques has likewise grown. Protein sample preparation should therefore be a critical consideration for researchers in the following areas:
> Proteomics
> Functional genomics
> Clinical studies (e.g., comparing protein sample before and after “treatment”)
> Differential expression
> Protein atlas studies (i.e., studying expression and localization of proteins within different cell types)
> Structural studies
> Functional studies
The goal of this handbook is to provide useful information and guidance to help make this very important starting point of analysis as well-defined and efficient as possible. The handbook is divided into five chapters, starting with an overview of protein sample preparation, followed by three chapters based on a conceptual, high-level workflow for protein sample preparation and analysis. The final chapter focuses on parallel processing and screening strategies in recombinant protein and monoclonal antibody production workflows.
The code number for ordering a printed copy of the handbook is 28-9887-41, or download a PDF copy from www.gelifesciences.com/handbooks
> Configurable confocality maximizes user-control of speed and image quality
> Variable aperture design enables flexibility across a range of objectives, delivering the benefits of confocal technology across a broad spectrum of high-content challenges
> Highly sensitive scientific-grade CMOS camera generates high-quality data from signals that would typically be lost in the noise
> User-friendly acquisition features include preview scan, manual microscope mode, and whole-well imaging
> Environmental control, liquid handling, temperature control, transmitted light imaging, and slide handling modules extend the range of assays that can be performed
IN Cell Analyzer 6000 is a high performance, laser-based, confocal, high-content analysis system for the most demanding high-content assays and screens. Featuring a next-generation scientific-grade CMOS camera and a proprietary fully adjustable aperture, the optical system allows you to optimize for speed and image quality extending the reach of HCA into applications more typically associated with low-throughput confocal microscopy including 3D imaging, co-localization studies, and assays with low signal.
Ordering information
Product Code number
IN Cell Analyzer 6000 28-9939-14
IN Cell Analyzer 6000 (NA only) 28-9938-51
For more information on the IN Cell Analyzer platform, visit www.gelifesciences.com/incell

19
What’s new
?
Prepacked gravity-flow columns for antibody purification
MabSelect SuRe™ LX for MAb purification and method developmentrProtein A GraviTrap™, Protein G GraviTrap, and rProtein A/Protein G
GraviTrap are prepacked gravity-flow columns designed for fast and efficient manual purification of monoclonal, polyclonal antibodies, and antibody fragments from cell culture supernatants and biological fluids.
The convenient, prepacked columns deliver:
> Speed and simplicity—sample can be purified in 30 min
> High binding capacity for antibodies—up to 50 mg human IgG/column
> High purity and recovery—purity > 95% in one step and recovery typically 70% to 80%
The ready-to-use columns are prepacked with 1 ml of rProtein A Sepharose™ Fast Flow, Protein G Sepharose 4 Fast Flow, or a combination of 50% rProtein A Sepharose Fast Flow and 50% Protein G Sepharose 4 Fast Flow. The various ligands bound to Sepharose Fast Flow enable the user to capture and purify a broad range of IgG from different sources, as well as many different IgG subclasses. rProtein A/Protein G GraviTrap is a first choice product when the binding strength of the target protein is unkown.
The columns are reusable up to five times and are available in a 10 column package. The package itself converts into a convenient column lab stand (Workmate) while the plastic tray in the package is used to collect liquid waste.
MabSelect SuRe LX is an alkali-stabilized, protein A-derived affinity medium with a binding capacity for monoclonal antibodies (MAbs) exceeding that of MabSelect SuRe at longer residence times.
Benefits of MabSelect SuRe LX include:
> Alkali-stabilized protein A affinity medium with low ligand leakage based on the well-established MabSelect™ platform
> Flexible process design due to large operational window of flow rates and bed heights
> Prefilled in PreDictor™ 96-well plates and prepacked in HiScreen™ columns for rapid small-scale purification and method development
> Medium available in 25 and 200 ml lab packs for scale-up
For more information on GraviTrap columns, visit www.gelifesciences.com/sampleprep
For more information on MabSelect SuRe LX and other media for purification of antibodies, visit www.gelifesciences.com/protein-purification
Ordering information
Product Code number
rProtein A GraviTrap, 10 × 1 ml 28-9852-54
Protein G GraviTrap, 10 × 1 ml 28-9852-55
rProtein A/Protein G GraviTrap, 10 × 1 ml 28-9852-56
Ordering information
Product Code number
MabSelect SuRe LX, 25 ml 17-5474-01
MabSelect SuRe LX, 200 ml 17-5474-02
PreDictor MabSelect SuRe LX, 6 µl, 4 × 96-well plates 17-5474-30
PreDictor MabSelect SuRe LX, 20 µl, 4 × 96-well plates 17-5474-31
PreDictor MabSelect SuRe LX, 50 µl, 4 × 96-well plates 17-5474-32
HiScreen MabSelect SuRe, 1 × 4.7 ml 17-5474-15

20
What’s new
?
Streptavidin Mag Sepharose™ magnetic beads
MagRack Maxi
Streptavidin Mag Sepharose are magnetic beads for simple and efficient enrichment of target proteins containing biotin by immunoprecipitation and for purification of biotinylated biomolecules. Streptavidin Mag Sepharose utilizes the strong interaction between biotin and the streptavidin ligand, which is immobilized on the magnetic beads. Collection of biotinylated targets is achieved simply and quickly using the magnets provided by MagRack 6 (for sample volumes up to 1.5 ml) or MagRack Maxi (for sample volumes up to 50 ml).
Streptavidin Mag Sepharose delivers:
> High-capacity small-scale purification of proteins from cell lysates and biological fluids
> High purity and yield
> Easy parallel screening of proteins with high repeatability
> Simple enrichment of proteins from small or large sample volumes (low-microliter to high-milliliter scale)
The beads are available in two pack sizes: 2 × 1 ml of 10% medium slurry and 5 × 1 ml of 10% medium slurry. One milliliter of 10% medium slurry is equivalent to 100 µl of sedimented medium and it is sufficient for 20 purification runs according to the recommended immunoprecipitation protocol.
MagRack Maxi is a new magnetic rack for small-scale protein purification and sample enrichment with magnetic beads. MagRack Maxi is used for capture of Mag Sepharose™ magnetic beads in volumes up to 50 ml. MagRack Maxi complements MagRack 6, which is a magnetic rack for processing of up to six samples in 1.5 ml microcentrifuge tubes.
Each rack consists of an anodized aluminum housing (blue) with a detachable plastic bar (white) containing a neodymium magnet and this design allows for optimal performance during protein purifications or enrichments using Mag Sepharose beads.
One of the main advantages of the magnetic beads separation method is the ability to vary the amount of medium as well as the sample volume. MagRack Maxi and MagRack 6 together cover a broad range of sample volumes from low-microliter to high-milliliter purification scales and this further enhances the flexibility of magnetic beads separations. The ability to use a larger sample volume allows high yields in a single purification run and also allows capture of low-expressed target proteins.
For more information on GraviTrap columns, visit www.gelifesciences.com/sampleprep
For more information on MagRack Maxi, MagRack 6, and the range of Mag Sepharose magnetic beads, visit www.gelifesciences.com/sampleprepOrdering information
Product Code number
Streptavidin Mag Sepharose, 2 × 1 ml 28-9857-38
Streptavidin Mag Sepharose, 5 × 1 ml 28-9857-99
Ordering information
Product Code number
MagRack Maxi 28-9864-41

21
What’s new
?
Capto™ ImpRes for purification and method developmentCapto SP ImpRes and Capto Q ImpRes are strong cation and strong anion exchangers for the high-throughput intermediate purification and polishing steps of a wide range of biomolecules. These media combine the high-flow characteristics of Capto media with a small particle size to deliver excellent pressure-flow properties with impressive resolution. The ability to run at higher flow rates and higher bed heights also increases flexibility in process design.
Benefits of Capto SP ImpRes and Capto Q ImpRes include:
> High-resolution intermediate purification and polishing based on the well-established Capto platform with traditional ligands
> Flexible process design due to large operational window of flow rates and bed heights
> High-throughput purifications that are easy to optimize and to scale up
> Prefilled in PreDictor 96-well plates and prepacked in HiTrap™ and HiScreen columns for rapid small-scale purification and method development
> Media available in 25 and 100 ml lab packs for scale-up
Ordering information
Product Code number
Capto SP ImpRes, 25 ml 17-5470-10
Capto Q ImpRes, 100 ml 17-5470-02
Capto SP ImpRes, 25 ml 17-5468-10
Capto SP ImpRes, 100 ml 17-5468-02
HiTrap Capto SP ImpRes, 5 × 1 ml 17-5468-51
HiTrap Capto SP ImpRes, 5 × 5 ml 17-5468-55
HiScreen Capto SP ImpRes, 1 × 4.7 ml 17-5468-15
HiTrap Capto Q ImpRes, 5 × 1 ml 17-5470-51
HiTrap Capto Q ImpRes, 5 × 5 ml 17-5470-55
HiScreen Capto Q ImpRes, 1 × 4.7 ml 17-5470-15
PreDictor Capto SP ImpRes, 6 µl, 4 × 96-well filter plates 17-5468-16
PreDictor Capto SP ImpRes, 20 µl, 4 × 96-well filter plates 17-5468-17
PreDictor Capto Q ImpRes, 6 µl, 4 × 96-well filter plates 17-5470-16
PreDictor Capto Q ImpRes, 20 µl, 4 × 96-well filter plates 17-5470-17
For more information, visit www.gelifesciences.com/protein-purification

22
What’s new
?
Celebrating 20 years of HiTrap™ columns
One of GE Healthcare Life Sciences’ well-known brands, HiTrap, was launched in 1991. The prepacked format of HiTrap columns was an immediate success,
bringing convenience and time-saving to previously laborious column chromatography.
The first six columns launched in 1991 were HiTrap Protein A HP, HiTrap Protein G HP, HiTrap Heparin HP, HiTrap Chelating HP, HiTrap Blue HP, and HiTrap NHS-activated HP.
Over the years, many successful columns have been added to the family to give academic researchers and process developers a wide range to choose from. By February 2011, the product family had grown to 135 different columns covering the most used
chromatography techniques—desalting, affinity, IEX, and HIC.
HiTrap columns are often imitated, but never duplicated and still after 20 years remain highly popular. It is amazing to think that if we connected
all HiTrap columns sold globally in 2010 together, the chain of columns would be almost 5 km (just over 3 miles) long!
19931991 1999 2000 2003 2004 2005 2006 2007 2008 2009 2011
HiTrap Pro
tein A H
P
HiTrap Pro
tein G
HP
HiTrap H
eparin H
P
HiTrap Chelatin
g HP
HiTrap Blue H
P
HiTrap N
HS-acti
vate
d HP
GSTrap™ FF
HiTrap D
esaltin
g
HiTrap H
IC Selecti
on Kit
HiTrap IE
X Selection Kit
HisTra
p™ HP
HisTra
p FF
HisTra
p FF cr
ude
HiTrap Capto
™ Q
HiTrap M
abSelect SuRe™
HiTrap IM
AC HP
GSTrap 4B
HiTrap Capto
Q Im
pRes
HiTrap Capto
SP ImpRes
MBPTrap™ H
P
StrepTr
ap™ HP
HiTrap Capto
IEX Selecti
on Kit
HiTrap Con A 4B
HiTrap column launch timeline
To learn more about HiTrap columns and to view the whole range of products, please visit www.gelifesciences.com/hitrap
23
19931991 1999 2000 2003 2004 2005 2006 2007 2008 2009 2011
HiTrap Pro
tein A H
P
HiTrap Pro
tein G
HP
HiTrap H
eparin H
P
HiTrap Chelatin
g HP
HiTrap Blue H
P
HiTrap N
HS-acti
vate
d HP
GSTrap™ FF
HiTrap D
esaltin
g
HiTrap H
IC Selecti
on Kit
HiTrap IE
X Selection Kit
HisTra
p™ HP
HisTra
p FF
HisTra
p FF cr
ude
HiTrap Capto
™ Q
HiTrap M
abSelect SuRe™
HiTrap IM
AC HP
GSTrap 4B
HiTrap Capto
Q Im
pRes
HiTrap Capto
SP ImpRes
MBPTrap™ H
P
StrepTr
ap™ HP
HiTrap Capto
IEX Selecti
on Kit
HiTrap Con A 4B
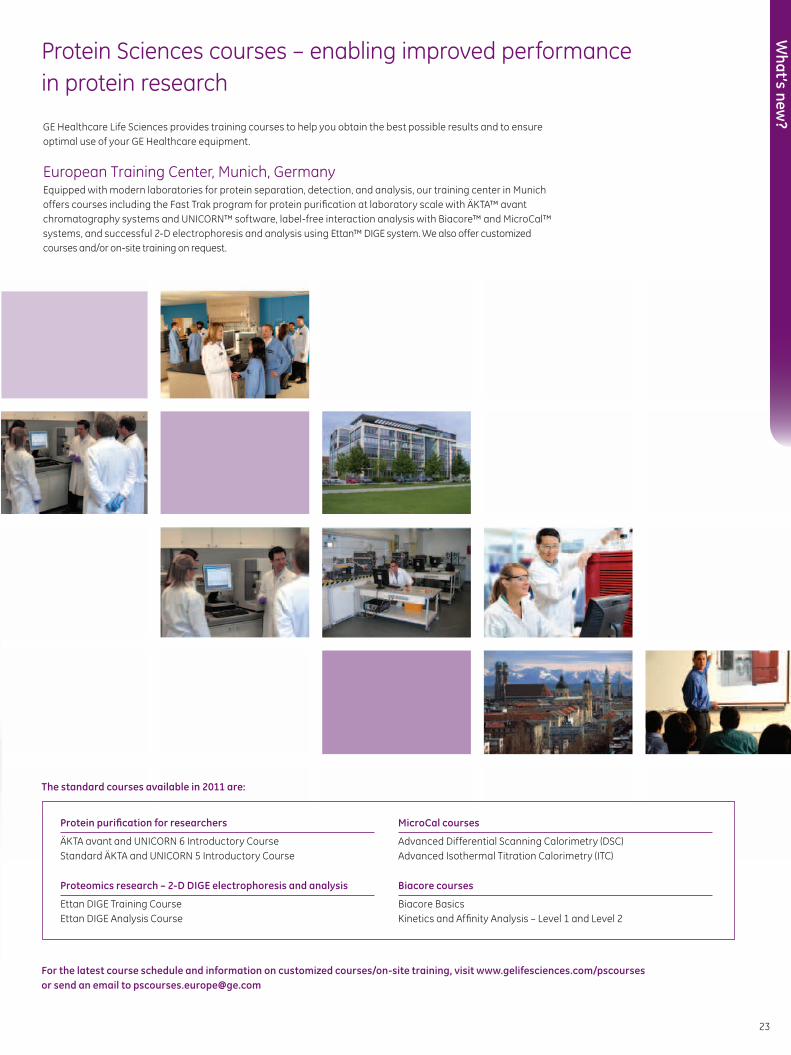
Protein Sciences courses – enabling improved performance in protein research
For the latest course schedule and information on customized courses/on-site training, visit www.gelifesciences.com/pscourses or send an email to [email protected]
The standard courses available in 2011 are:
Protein purification for researchers
ÄKTA avant and UNICORN 6 Introductory Course Standard ÄKTA and UNICORN 5 Introductory Course
Proteomics research – 2-D DIGE electrophoresis and analysis
Ettan DIGE Training Course Ettan DIGE Analysis Course
MicroCal courses
Advanced Differential Scanning Calorimetry (DSC)Advanced Isothermal Titration Calorimetry (ITC)
Biacore courses
Biacore Basics Kinetics and Affinity Analysis – Level 1 and Level 2
GE Healthcare Life Sciences provides training courses to help you obtain the best possible results and to ensure optimal use of your GE Healthcare equipment.
European Training Center, Munich, GermanyEquipped with modern laboratories for protein separation, detection, and analysis, our training center in Munich offers courses including the Fast Trak program for protein purification at laboratory scale with ÄKTA™ avant chromatography systems and UNICORN™ software, label-free interaction analysis with Biacore™ and MicroCal™ systems, and successful 2-D electrophoresis and analysis using Ettan™ DIGE system. We also offer customized courses and/or on-site training on request.
What’s new
?

For local office contact information, visit www.gelifesciences.com/contact
www.gelifesciences.com
GE Healthcare Bio-Sciences AB Björkgatan 30751 84 UppsalaSweden
GE Healthcare (UK) LimitedAmersham PlaceLittle ChalfontBuckinghamshireHP7 9NA
GE Healthcare Bio-Sciences Corp 800 Centennial AvenueP.O. Box 1327 Piscataway NJ 08855-1327USA
GE, imagination at work, and GE monogram are trademarks of General Electric Company.
ÄKTA, ÄKTAexplorer, ÄKTAmicro, Biacore, Capto, Cy, CyDye, Cytiva, DeCyder, Deep Purple, Ettan, GraviTrap, GSTrap, HisTrap, HiScreen, HiTrap, ImageQuant, Immobiline, IPGphor, MabSelect, MabSelect SuRe, MBPTrap, MicroCal, MidiTrap, PreDictor, Sephadex, Sepharose, Superdex, StrepTrap, Typhoon, and UNICORN are trademarks of GE Healthcare companies.
All third party trademarks are the property of their respective owners.
Any use of UNICORN software is subject to GE Healthcare Standard Software End-User License Agreement for Life Sciences Software Products. A copy of this Standard Software End-User License Agreement is available on request.
2-D Fluorescence Difference Gel Electrophoresis (2-D DIGE) technology is covered by US patent numbers 6,043,025, 6,127,134 and 6,426,190 and equivalent patents and patent applications in other countries and exclusively licensed from Carnegie Mellon University. CyDye: this product or portions thereof is manufactured under an exclusive license from Carnegie Mellon University under US patent numbers 5,569,587, 5,627,027 and equivalent patents in other countries. The purchase of CyDye DIGE Fluors includes a limited license to use the CyDye DIGE Fluors for internal research and development, but not for any commercial purposes. A license to use the CyDye DIGE Fluors for commercial purposes is subject to a separate license agreement with GE Healthcare.
Deep Purple Total Protein Stain is exclusively licensed to GE Healthcare from Fluorotechnics Pty Ltd. Deep Purple Total Protein Stain may only be used for applications in life science research. Deep Purple is covered under a granted patent in New Zealand entitled “Fluorescent Compounds”, patent number 522291 and equivalent patents and patent applications in other countries.
IMAC Sepharose products and Ni Sepharose products (Histidine-tagged protein purification, Lab products): Purification and preparation of fusion proteins and affinity peptides comprising at least two adjacent histidine residues may require a license under US patent numbers 5,284,933 and 5,310,663, and equivalent patents and patent applications in other countries (assignee: Hoffman La Roche, Inc).
The IN Cell Analyzer system and the In Cell Investigator software are sold under use license from Cellomics Inc. under US patent numbers: 5,989,835, 6,365,367, 6,416,959, 6,573,039, 6,620,591, 6,671,624, 6,716,588, 6,727,071, 6,759,206, 6,875,578, 6,902,883, 6,917,884, 6,970,789, 6,986,993, 7,060,445, 7,085,765, 7,117,098, 7,160,687, 7,235,373, 7,476,510 ; Canadian patent numbers CA 2282658, 2328194, 2362117, 2381344; Australian patent number AU 730100; European patent numbers EP 0983498, 1095277, 1155304, 1203214, 1348124, 1368689; Japanese patent numbers JP 3466568, 3576491, 3683591, 4011936 and equivalent patents and patent applications in other countries.
StrepTrap HP and StrepTactin Sepharose High Performance: These products are covered by US patent number 6,103,493 and equivalent patents and patent applications in other countries. The purchase of StrepTrap HP and StrepTactin Sepharose High Performance includes a license under such patents for non-profit and in-house research only. Please contact IBA ([email protected]) for further information on licenses for commercial use of StrepTactin.
CyDye: This product or portions thereof is manufactured under an exclusive license from Carnegie Mellon University under US patent number 5,268,486 and equivalent patents in the US and other countries.
The purchase of CyDye products includes a limited license to use the CyDye products for internal research and development but not for any commercial purposes. A license to use the CyDye products for commercial purposes is subject to a separate license agreement with GE Healthcare. Commercial use shall include:
1. Sale, lease, license or other transfer of the material or any material derived or produced from it.
2. Sale, lease, license or other grant of rights to use this material or any material derived or produced from it.
3. Use of this material to perform services for a fee for third parties, including contract research and drug screening.
Cardiomyocytes: GE Healthcare Cardiomyocytes are sold under license from Geron Corporation and Wisconsin Alumni Research Foundation under US patent and publication numbers: 7,425,448, 7,851,167, 6,800,480, 5,843,780, 6,200,806, 7,029,913, 7,582,479, 7,413,902, 7,297,539, 2009/0047739 and 2007/0010012 and equivalent patent and patent applications in other countries.
© 2011 General Electric Company – All rights reserved. First published May 2011.
All goods and services are sold subject to the terms and conditions of sale of the company within GE Healthcare which supplies them. A copy of these terms and conditions is available on request. Contact your local GE Healthcare representative for the most current information.
28-9957-21 AA 05/2011
GE HealthcareLife Sciences