
Direct evidence for continuous linear kinetics in the low ...
10
Direct evidence for continuous linear kinetics in the low-temperature degradation of Y-TZP M. Keuper ⇑ , K. Eder, C. Berthold, K.G. Nickel Eberhard Karls University Tübingen, Faculty of Science, Department of Geosciences, Applied Mineralogy, Wilhelmstraße 56, 72074 Tübingen, Germany article info Article history: Received 4 May 2012 Received in revised form 23 July 2012 Accepted 20 August 2012 Available online 24 August 2012 Keywords: Zirconia Low temperature degradation Bioceramics Phase transformation TZP abstract The kinetics of the tetragonal to monoclinic (t–m) transformation of zirconia in a hydrous environment at 134 °C and 3 bar pressure was studied. As surface X-ray diffraction, which is conventionally used to explore the progress, has a very limited depth of information, it distorts the quantitative results in a layer-on-layer situation and by itself is ill suited for this reason. Analyzing cross sections is more suitable; therefore, focused ion beam techniques were used to prepare artifact-free cuts. The material was subse- quently investigated by scanning electron microscopy, electron backscatter diffraction and Raman spec- troscopy. Only the combination of methods makes it possible to resolve the quantifiable details of the process. The transformation starts in the near-surface areas, forms a layer, and the growth of this layer proceeds into the bulk material following a simple linear time law (0.0624 lmh 1 for material in the chosen condition), without apparent retardation or limit. The progress yields a gradientless layer with a fixed amount of residual tetragonal zirconia (27% for 3Y-TZP in the present conditions) separated from unaffected material by a boundary, which has a roughness only in the grain size range. The kinetics indi- cates a reaction rate control, where the hydration reaction is the key factor, but is modified by the step- wise access of water to the reaction front opened by the autocatalytic transformation of zirconia with a critical hydration level. Ó 2012 Acta Materialia Inc. Published by Elsevier Ltd. All rights reserved. 1. Introduction The transformation in Y-TZP from tetragonal to monoclinic (t– m) zirconia, with both benefits regarding the mechanical proper- ties and possible problems for the application, lifetime prediction is a well-known and controversially discussed phenomenon. In re- cent times, many publications have dealt particularly with the deg- radation phenomena at low temperatures (e.g., Refs. [1–3]). At low or moderate temperatures, the t–m transformation process can be initiated by mechanical treatment [4–8] or under the influence of water and/or its vapor [1,2,9,10]). Guo [11] and Lawson [12] pro- vided good overviews of the influence of water or water vapor (see also Refs. [3,13,14]). To quantify the progress of the transformation with time, X-ray diffraction (XRD) or, to a minor extent, Raman spectroscopy are mostly used. The increase in monoclinic zirconia as a function of both time and temperature, as calculated from XRD analyses of hydrothermally altered material, was commonly interpreted to fol- low a sigmoidal trend. This shape led to kinetic models for the transformation process, which were based on the Mehl–Avrami– Johnson (MAJ) law [15]. As early as 1965, Whitney [16] described a kinetic MAJ model for ZrO 2 and the nucleation and growth pro- cess prevailing during transformation. In 1987, Lu et al. [17] re- ported a sigmoidal trend to describe transformation processes occurring in autoclaved zirconia in an air atmosphere and ex- plained it by a transformation pace decreasing with time. A loga- rithmic aging function for samples stored under humid conditions was deduced. In contrast, Lilley [1] and Lawson and Smith [18] proposed the time-dependence of transformation to be a linear process. They suggested that the transformation has no incubation time and that ‘‘the phase transformation reaches sat- uration immediately and grows inwards linearly with time’’ [12]. Thus, they proposed a simpler model for the growth process of the monoclinic phase, although their work provided only indirect analytical proof. More recently, most interpretations have gone back to the ini- tial MAJ model. For example, Gremillard et al. [19] and Cattani- Lorente et al. [20] used the MAJ approach to differentiate between a nucleation-dominated or growth-controlled transformation pro- cess in a model for the aging kinetics of zirconia. The MAJ law thus became widely accepted and can be divided into three successive states: (i) an initial state, where single and isolated tetragonal grains or nuclei at the surface begin to trans- form into the monoclinic structure; (ii) an exponential increase in the monoclinic phase, which is commonly interpreted as a 1742-7061/$ - see front matter Ó 2012 Acta Materialia Inc. Published by Elsevier Ltd. All rights reserved. http://dx.doi.org/10.1016/j.actbio.2012.08.032 ⇑ Corresponding author. Tel.: +49 7071 2976805; fax: +49 7071 293060. E-mail address: [email protected] (M. Keuper). Acta Biomaterialia 9 (2013) 4826–4835 Contents lists available at SciVerse ScienceDirect Acta Biomaterialia journal homepage: www.elsevier.com/locate/actabiomat
Transcript of Direct evidence for continuous linear kinetics in the low ...
Acta Biomaterialia 9 (2013) 4826–4835
Contents lists available at SciVerse ScienceDirect
Acta Biomaterialia
journal homepage: www.elsevier .com/locate /ac tabiomat
Direct evidence for continuous linear kinetics in the low-temperaturedegradation of Y-TZP
M. Keuper ⇑, K. Eder, C. Berthold, K.G. NickelEberhard Karls University Tübingen, Faculty of Science, Department of Geosciences, Applied Mineralogy, Wilhelmstraße 56, 72074 Tübingen, Germany
a r t i c l e i n f o a b s t r a c t
Article history:Received 4 May 2012Received in revised form 23 July 2012Accepted 20 August 2012Available online 24 August 2012
Keywords:ZirconiaLow temperature degradationBioceramicsPhase transformationTZP
1742-7061/$ - see front matter � 2012 Acta Materialhttp://dx.doi.org/10.1016/j.actbio.2012.08.032
⇑ Corresponding author. Tel.: +49 7071 2976805; faE-mail address: [email protected]
The kinetics of the tetragonal to monoclinic (t–m) transformation of zirconia in a hydrous environment at134 �C and 3 bar pressure was studied. As surface X-ray diffraction, which is conventionally used toexplore the progress, has a very limited depth of information, it distorts the quantitative results in alayer-on-layer situation and by itself is ill suited for this reason. Analyzing cross sections is more suitable;therefore, focused ion beam techniques were used to prepare artifact-free cuts. The material was subse-quently investigated by scanning electron microscopy, electron backscatter diffraction and Raman spec-troscopy. Only the combination of methods makes it possible to resolve the quantifiable details of theprocess. The transformation starts in the near-surface areas, forms a layer, and the growth of this layerproceeds into the bulk material following a simple linear time law (0.0624 lm h�1 for material in thechosen condition), without apparent retardation or limit. The progress yields a gradientless layer witha fixed amount of residual tetragonal zirconia (�27% for 3Y-TZP in the present conditions) separated fromunaffected material by a boundary, which has a roughness only in the grain size range. The kinetics indi-cates a reaction rate control, where the hydration reaction is the key factor, but is modified by the step-wise access of water to the reaction front opened by the autocatalytic transformation of zirconia with acritical hydration level.
� 2012 Acta Materialia Inc. Published by Elsevier Ltd. All rights reserved.
1. Introduction
The transformation in Y-TZP from tetragonal to monoclinic (t–m) zirconia, with both benefits regarding the mechanical proper-ties and possible problems for the application, lifetime predictionis a well-known and controversially discussed phenomenon. In re-cent times, many publications have dealt particularly with the deg-radation phenomena at low temperatures (e.g., Refs. [1–3]). At lowor moderate temperatures, the t–m transformation process can beinitiated by mechanical treatment [4–8] or under the influence ofwater and/or its vapor [1,2,9,10]). Guo [11] and Lawson [12] pro-vided good overviews of the influence of water or water vapor(see also Refs. [3,13,14]).
To quantify the progress of the transformation with time, X-raydiffraction (XRD) or, to a minor extent, Raman spectroscopy aremostly used. The increase in monoclinic zirconia as a function ofboth time and temperature, as calculated from XRD analyses ofhydrothermally altered material, was commonly interpreted to fol-low a sigmoidal trend. This shape led to kinetic models for thetransformation process, which were based on the Mehl–Avrami–Johnson (MAJ) law [15]. As early as 1965, Whitney [16] described
ia Inc. Published by Elsevier Ltd. A
x: +49 7071 293060.(M. Keuper).
a kinetic MAJ model for ZrO2 and the nucleation and growth pro-cess prevailing during transformation. In 1987, Lu et al. [17] re-ported a sigmoidal trend to describe transformation processesoccurring in autoclaved zirconia in an air atmosphere and ex-plained it by a transformation pace decreasing with time. A loga-rithmic aging function for samples stored under humidconditions was deduced. In contrast, Lilley [1] and Lawson andSmith [18] proposed the time-dependence of transformation tobe a linear process. They suggested that the transformation hasno incubation time and that ‘‘the phase transformation reaches sat-uration immediately and grows inwards linearly with time’’ [12].
Thus, they proposed a simpler model for the growth process ofthe monoclinic phase, although their work provided only indirectanalytical proof.
More recently, most interpretations have gone back to the ini-tial MAJ model. For example, Gremillard et al. [19] and Cattani-Lorente et al. [20] used the MAJ approach to differentiate betweena nucleation-dominated or growth-controlled transformation pro-cess in a model for the aging kinetics of zirconia.
The MAJ law thus became widely accepted and can be dividedinto three successive states: (i) an initial state, where single andisolated tetragonal grains or nuclei at the surface begin to trans-form into the monoclinic structure; (ii) an exponential increasein the monoclinic phase, which is commonly interpreted as a
ll rights reserved.
M. Keuper et al. / Acta Biomaterialia 9 (2013) 4826–4835 4827
3-dimensional growth of the monoclinic phase into the volume;and (iii) a ‘‘saturation phenomenon’’, as described in the work ofNakajima et al. [21], for example; according to these authors thetransformation does not increase further after reaching a certainamount of monoclinic phase in the near-surface area. This ‘‘satura-tion’’ is caused by the maximum transformable tetragonal phasecontent. In the case of the 3Y-TZP material with the distinct com-position and grain size used in the present study, the maximummonoclinic amount is �70 wt.% [3,20,22–31]. It should be men-tioned that this maximum monoclinic amount can vary, dependingon the grades of the material (cf., Ref. [31]), but the fact that even amaximum transformed material never attains 100% m-ZrO2 ap-plies accordingly to all material compositions. This is attributedto internal compressive stresses [1] induced by the volume expan-sion of the monoclinic structure, which inhibits transformation ofstatistically distributed residual tetragonal grains or clusters [20].
The transformation front in a MAJ model is commonly viewedas a gradual decrease in monoclinic ZrO2 within the transformationlayer from the surface into the interior of the sample. Conse-quently, no distinct border between transformed and unaffectedmaterial should be visible, but there should be a smooth transition.Marro et al. [23] showed that XRD data can be interpreted to beconsistent with a smooth transition. Cattani-Lorente et al. sug-gested this additionally as an exponential, gradual decrease [20].In contrast, Wada and Yokoyama argue that the transformation de-creases linearly with depth [27].
However, the assumption of a gradual transition was challengedin several studies: Recent work by Muñoz-Tabares et al. [24] pro-posed a non-linear gradient in the in-depth distribution of themonoclinic phase based on Raman spectroscopy. These authorsfound that the monoclinic phase content remained constant overa longer distance until a ‘‘sharp drop’’ occurred, after which theconcentration decreased slowly with increasing depth. Similarly,Kim et al. [32] stated that the transformation front is fully trans-formed ‘‘a little far away from the interface between the degradedand the intact layer’’, and that the amount of m-ZrO2 is graduallyreduced in this small region between a near-interface region with-in the transformation and interface itself because of microstruc-tural effects.
Thus, the shape of the boundary between altered zirconia andthe virgin material remains a subject of controversy and, if theboundary is indeed a sharp one instead of gradual, then the kinet-ics of the process may also have to be reinterpreted. To resolve thisproblem, the only practicable way is to look for direct evidence,which comes from cross sections of the transformed region pre-pared by a gentle preparation method such as focused ion beam(FIB) milling, followed by combined characterization techniquessuch as scanning electron microscopy (SEM), electron backscatterdiffraction (EBSD) and l-Raman spectroscopy, which is the subjectof the present work.
This study focuses on just one material, a 3 mol.% Y2O3 TZP,which is typical for dental materials. Whether the findings are truefor other materials and aging conditions should be investigated infurther studies.
2. Experimental
Pre-sintered rectangular white bodies of yttria-doped tetrago-nal zirconia material (VITA InCeram YZ, 3 mol.% yttria (3Y-TZP);VITA Zahnfabrik Rauter, Bad Saeckingen, Germany) with a smallalumina content <0.3 wt.% were sintered for 2 h at 1530 �C, yield-ing a dense ceramic body (q = 6.05 g cm�3) with a median grainsize in the sub-micrometer range. The sintered samples with thedimensions of �11 � 11 � 5 mm did not receive any further sur-face treatment after the sintering process. Up to three samples
for each aging time and reference were chosen to evaluate theuncertainties.
Sintered samples were analyzed by XRD and Raman spectros-copy, where only tetragonal ZrO2 was detected. With an aluminacontent <0.3 wt.%, these methods do not allow detection of dis-solved alumina or aluminous phases. XRD pattern analysis by Riet-veld refinement gave no evidence for the presence of cubiczirconia.
The sintered samples were hydrothermally aged by placingthem in an autoclave directly after the sintering process (SANO-clav, Bad Ueberkingen-Hausen, Germany) under a humid atmo-sphere at 134 �C and saturated water vapor pressure of 3 bar forstorage times between 3 and 200 h. For comparison, similar pre-pared samples were used, stored in dry atmosphere at room tem-perature for equal times.
The bulk samples were characterized by X-ray microdiffractionwith a Bruker D8 Discover GADDS h/h microdiffractometerequipped with a Co-sealed tube, a HOPG-primary monochromator,500 lm monocapillary optic with 300 lm pinhole (IFG BerlinAdlershof, Germany) and a 2-dimensional VÅNTEC-500 area detec-tor covering 40�2h and psi (l-XRD2) [33].
The relative vertical analyzing depth of XRD in a material, in thepresent case a surface layer, depends on the incidence angle of theX-ray beam if the wavelength of the anode material and the massattenuation coefficient of the material remain unchanged. Owingto the h/h setup used, the incidence angle can be chosen indepen-dently of the detector. Therefore, the analyzing depth can be mod-ified via the incidence angle. Incidence angles between 1� and 10�result with the present setup in penetration depths between �0.4and �4.2 lm, calculated with 99% of absorption in the materialwith the Lambert–Beer law [34] (see Eq. (1)). But it must be keptin mind that, on the one hand, the result is always a mean valueof the entire excitation volume with exponential decrease of infor-mation with increasing depth and, on the other hand, the realinformation depth depends strongly on the diffracted intensity ofthe individual reflection that is analyzed.
For the first information regarding the time- and depth-depen-dent amount of monoclinic zirconia in the subsurface region dur-ing the aging process, the bulk samples were measured withincidence angles varying from 1� to 10� and a detector angle vary-ing between 39� and 30� to ensure always measuring the same 2hrange.
The amounts of monoclinic ZrO2 were then calculated using thecommonly accepted formula of Garvie and Nicholson [35] modifiedby Toraya et al. [36], which gives information about the volumefraction vm of the m-phase. To verify any interpretation from ana-lytical methods, insight into the transformed subsurface areas wasobtained from local cross sections taken from those samples. Thisis commonly done by mechanical cutting, grinding and polishingprocesses, but for ZrO2-materials it is well known that mechanicaltreatment induces the t–m transformation [4–8]. Therefore, theinvestigation of mechanically prepared samples does not allowone to distinguish between the transformations due to the agingprocess and those due to the following preparation step.
To overcome this disadvantage, the cross sections were pre-pared and characterized via a combined FIB/SEM system AURI-GA�–CrossBeam� Workstation (Carl Zeiss NTS GmbH,Oberkochen, Germany) with a Ga-ion beam and a field emission(FE) cathode at the NMI (Natural and Medical Sciences Instituteat the University of Tübingen). Previous studies [37,38] confirmedthat the milling conditions chosen did not cause any artificialtransformation or re-transformation.
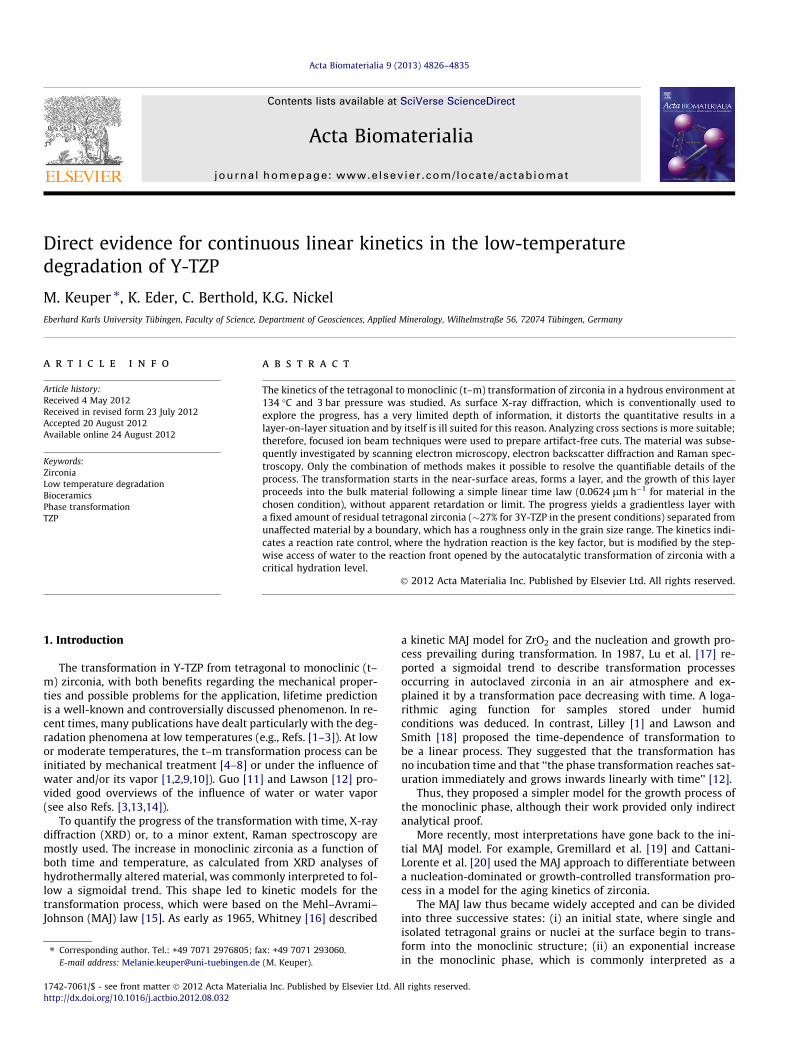
A limitation of this method is the low maximum depth of thetrench cut into the sample surface by FIB in a reasonable time.To overcome this, the geometry of the section was modified bymilling the samples on an edge at an angle of 45� (Fig. 1). In this
20 µm20 µm
Fig. 1. SEM micrographs and schematic drawing (insert) of the FIB-milled diagonalcross section on an edge of a sample.
Inte
nsity
(arb
. u.)
°2Θ (CoKα)30 35 40
As sintered
200 h140 h
72 h48 h
24 h12 h
6 h3 h
10°incidence angle
m(002)
m(-111)
m(111) t(002) t(200)
t(101)
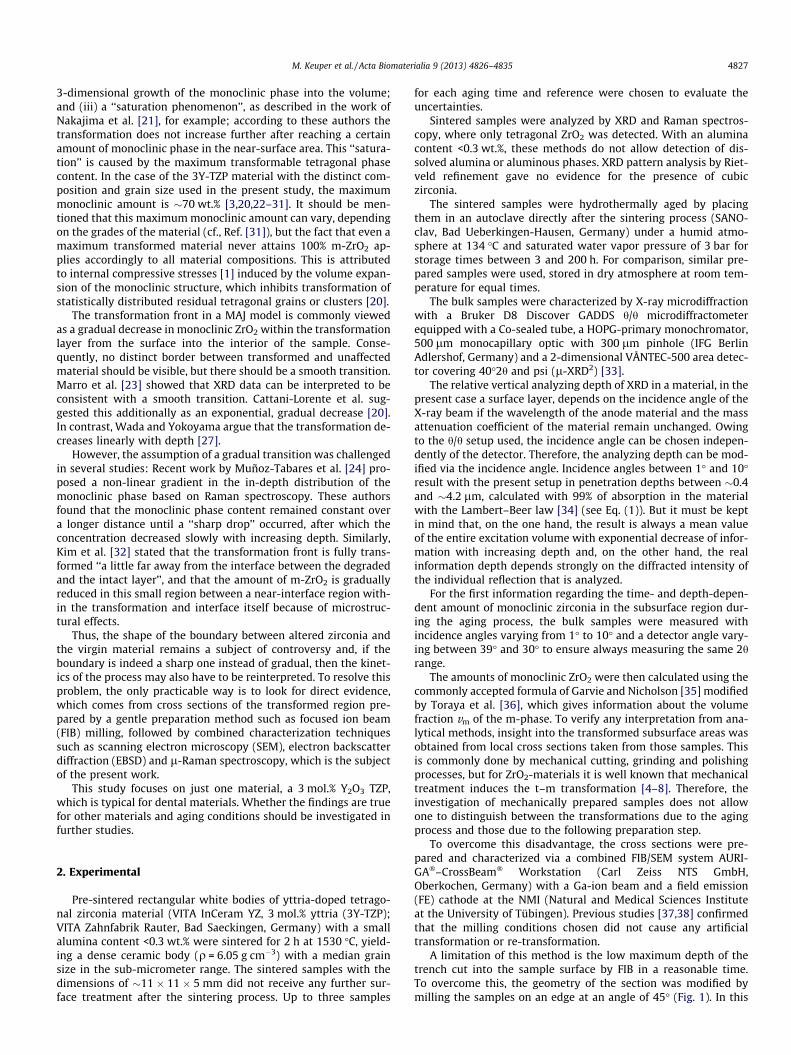
Fig. 2. Surface l-XRD data from 10� fixed incidence angle of the aged samples aftervarious storage times (listed on the right side) in hydrothermal atmosphere at134 �C. Reflexes from monoclinic and tetragonal zirconia faces are marked with mand t, respectively.
0
10
20
30
40
50
60
70
80
90
0 50 100 150 200
XRD
-Val
ues
for X
m [V
ol-%
]
aging time at 134°C [h]
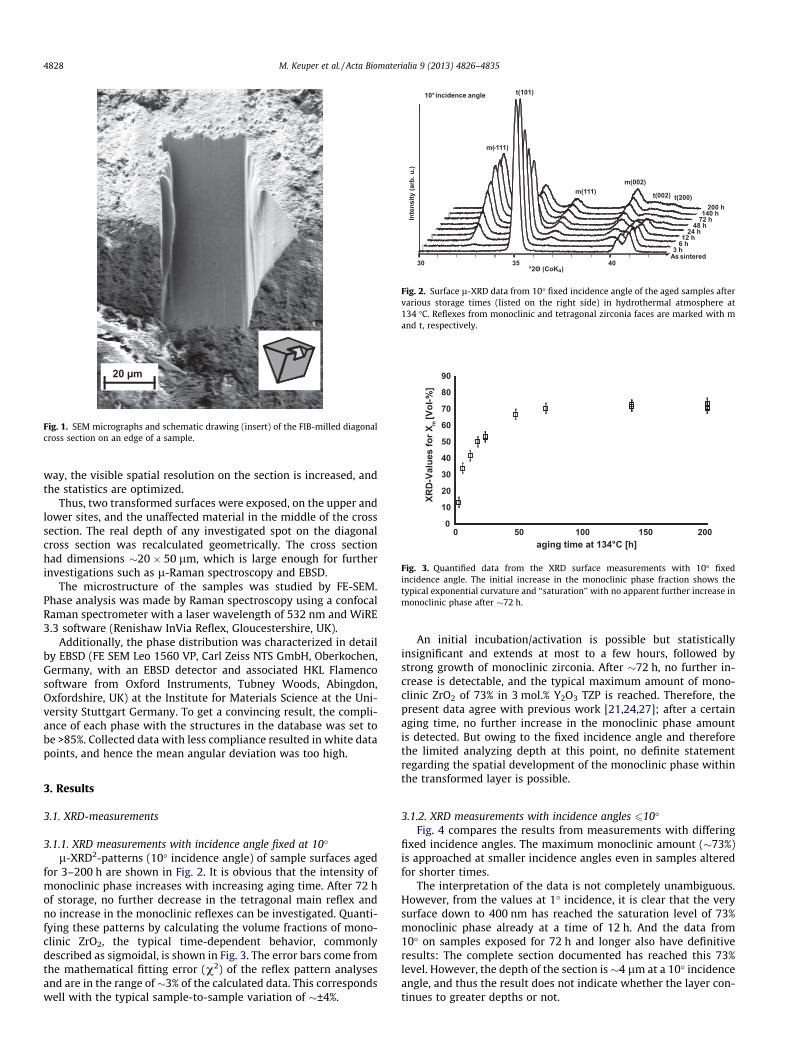
Fig. 3. Quantified data from the XRD surface measurements with 10� fixedincidence angle. The initial increase in the monoclinic phase fraction shows thetypical exponential curvature and ‘‘saturation’’ with no apparent further increase inmonoclinic phase after �72 h.
4828 M. Keuper et al. / Acta Biomaterialia 9 (2013) 4826–4835
way, the visible spatial resolution on the section is increased, andthe statistics are optimized.
Thus, two transformed surfaces were exposed, on the upper andlower sites, and the unaffected material in the middle of the crosssection. The real depth of any investigated spot on the diagonalcross section was recalculated geometrically. The cross sectionhad dimensions �20 � 50 lm, which is large enough for furtherinvestigations such as l-Raman spectroscopy and EBSD.
The microstructure of the samples was studied by FE-SEM.Phase analysis was made by Raman spectroscopy using a confocalRaman spectrometer with a laser wavelength of 532 nm and WiRE3.3 software (Renishaw InVia Reflex, Gloucestershire, UK).
Additionally, the phase distribution was characterized in detailby EBSD (FE SEM Leo 1560 VP, Carl Zeiss NTS GmbH, Oberkochen,Germany, with an EBSD detector and associated HKL Flamencosoftware from Oxford Instruments, Tubney Woods, Abingdon,Oxfordshire, UK) at the Institute for Materials Science at the Uni-versity Stuttgart Germany. To get a convincing result, the compli-ance of each phase with the structures in the database was set tobe >85%. Collected data with less compliance resulted in white datapoints, and hence the mean angular deviation was too high.
3. Results
3.1. XRD-measurements
3.1.1. XRD measurements with incidence angle fixed at 10�l-XRD2-patterns (10� incidence angle) of sample surfaces aged
for 3–200 h are shown in Fig. 2. It is obvious that the intensity ofmonoclinic phase increases with increasing aging time. After 72 hof storage, no further decrease in the tetragonal main reflex andno increase in the monoclinic reflexes can be investigated. Quanti-fying these patterns by calculating the volume fractions of mono-clinic ZrO2, the typical time-dependent behavior, commonlydescribed as sigmoidal, is shown in Fig. 3. The error bars come fromthe mathematical fitting error (v2) of the reflex pattern analysesand are in the range of �3% of the calculated data. This correspondswell with the typical sample-to-sample variation of �±4%.
An initial incubation/activation is possible but statisticallyinsignificant and extends at most to a few hours, followed bystrong growth of monoclinic zirconia. After �72 h, no further in-crease is detectable, and the typical maximum amount of mono-clinic ZrO2 of 73% in 3 mol.% Y2O3 TZP is reached. Therefore, thepresent data agree with previous work [21,24,27]; after a certainaging time, no further increase in the monoclinic phase amountis detected. But owing to the fixed incidence angle and thereforethe limited analyzing depth at this point, no definite statementregarding the spatial development of the monoclinic phase withinthe transformed layer is possible.
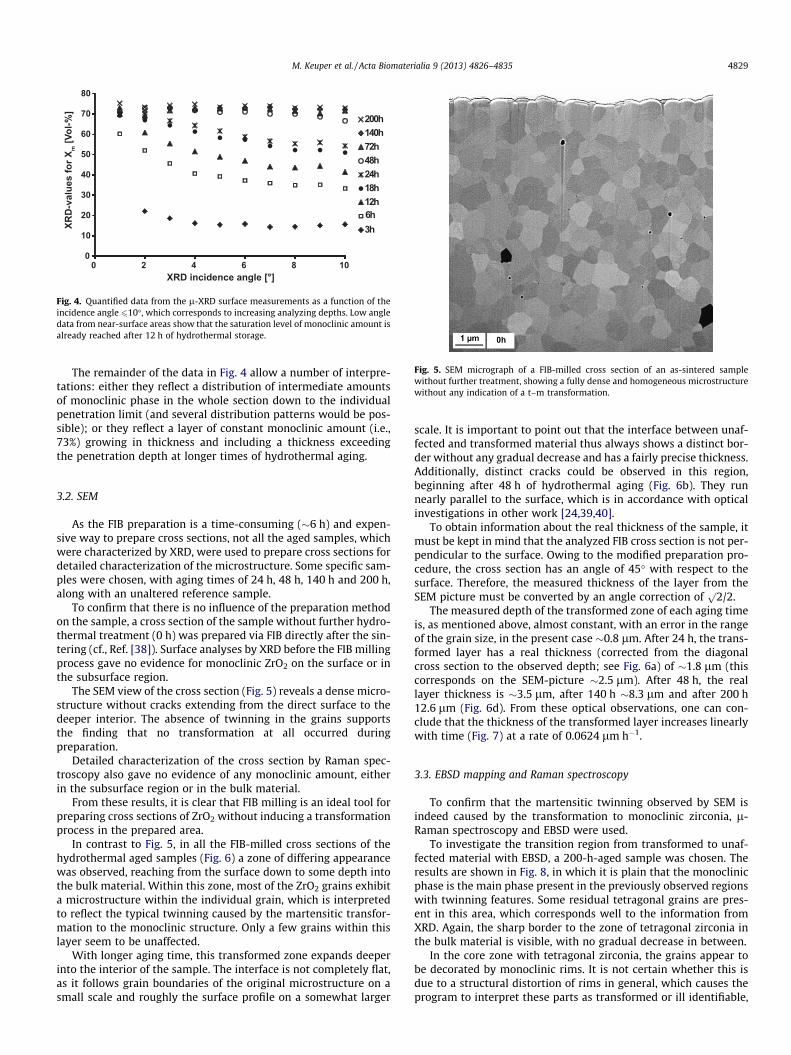
3.1.2. XRD measurements with incidence angles 610�Fig. 4 compares the results from measurements with differing
fixed incidence angles. The maximum monoclinic amount (�73%)is approached at smaller incidence angles even in samples alteredfor shorter times.
The interpretation of the data is not completely unambiguous.However, from the values at 1� incidence, it is clear that the verysurface down to 400 nm has reached the saturation level of 73%monoclinic phase already at a time of 12 h. And the data from10� on samples exposed for 72 h and longer also have definitiveresults: The complete section documented has reached this 73%level. However, the depth of the section is�4 lm at a 10� incidenceangle, and thus the result does not indicate whether the layer con-tinues to greater depths or not.
0
10
20
30
40
50
60
70
80
0 2 4 6 8 10XRD incidence angle [°]
200h140h72h48h24h18h12h6h3h
X rof seul av-D
RXm
]%-l oV[
Fig. 4. Quantified data from the l-XRD surface measurements as a function of theincidence angle 610�, which corresponds to increasing analyzing depths. Low angledata from near-surface areas show that the saturation level of monoclinic amount isalready reached after 12 h of hydrothermal storage.
Fig. 5. SEM micrograph of a FIB-milled cross section of an as-sintered samplewithout further treatment, showing a fully dense and homogeneous microstructurewithout any indication of a t–m transformation.
M. Keuper et al. / Acta Biomaterialia 9 (2013) 4826–4835 4829
The remainder of the data in Fig. 4 allow a number of interpre-tations: either they reflect a distribution of intermediate amountsof monoclinic phase in the whole section down to the individualpenetration limit (and several distribution patterns would be pos-sible); or they reflect a layer of constant monoclinic amount (i.e.,73%) growing in thickness and including a thickness exceedingthe penetration depth at longer times of hydrothermal aging.
3.2. SEM
As the FIB preparation is a time-consuming (�6 h) and expen-sive way to prepare cross sections, not all the aged samples, whichwere characterized by XRD, were used to prepare cross sections fordetailed characterization of the microstructure. Some specific sam-ples were chosen, with aging times of 24 h, 48 h, 140 h and 200 h,along with an unaltered reference sample.
To confirm that there is no influence of the preparation methodon the sample, a cross section of the sample without further hydro-thermal treatment (0 h) was prepared via FIB directly after the sin-tering (cf., Ref. [38]). Surface analyses by XRD before the FIB millingprocess gave no evidence for monoclinic ZrO2 on the surface or inthe subsurface region.
The SEM view of the cross section (Fig. 5) reveals a dense micro-structure without cracks extending from the direct surface to thedeeper interior. The absence of twinning in the grains supportsthe finding that no transformation at all occurred duringpreparation.
Detailed characterization of the cross section by Raman spec-troscopy also gave no evidence of any monoclinic amount, eitherin the subsurface region or in the bulk material.
From these results, it is clear that FIB milling is an ideal tool forpreparing cross sections of ZrO2 without inducing a transformationprocess in the prepared area.
In contrast to Fig. 5, in all the FIB-milled cross sections of thehydrothermal aged samples (Fig. 6) a zone of differing appearancewas observed, reaching from the surface down to some depth intothe bulk material. Within this zone, most of the ZrO2 grains exhibita microstructure within the individual grain, which is interpretedto reflect the typical twinning caused by the martensitic transfor-mation to the monoclinic structure. Only a few grains within thislayer seem to be unaffected.
With longer aging time, this transformed zone expands deeperinto the interior of the sample. The interface is not completely flat,as it follows grain boundaries of the original microstructure on asmall scale and roughly the surface profile on a somewhat larger
scale. It is important to point out that the interface between unaf-fected and transformed material thus always shows a distinct bor-der without any gradual decrease and has a fairly precise thickness.Additionally, distinct cracks could be observed in this region,beginning after 48 h of hydrothermal aging (Fig. 6b). They runnearly parallel to the surface, which is in accordance with opticalinvestigations in other work [24,39,40].
To obtain information about the real thickness of the sample, itmust be kept in mind that the analyzed FIB cross section is not per-pendicular to the surface. Owing to the modified preparation pro-cedure, the cross section has an angle of 45� with respect to thesurface. Therefore, the measured thickness of the layer from theSEM picture must be converted by an angle correction of
p2/2.
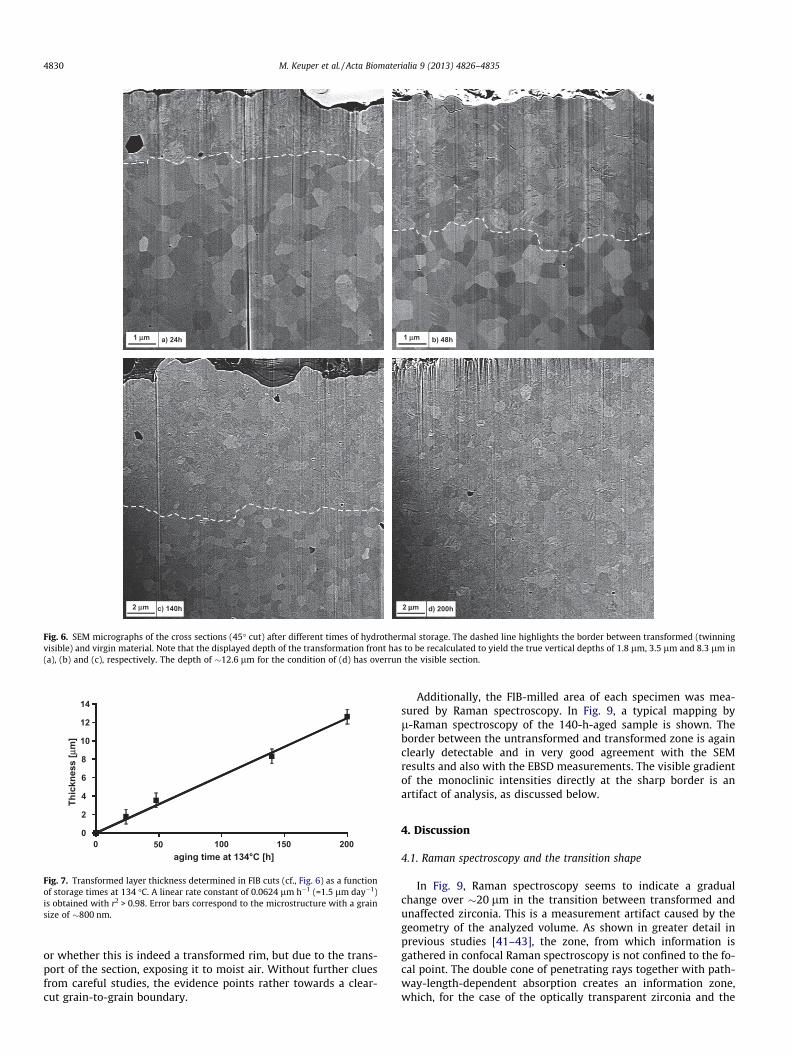
The measured depth of the transformed zone of each aging timeis, as mentioned above, almost constant, with an error in the rangeof the grain size, in the present case �0.8 lm. After 24 h, the trans-formed layer has a real thickness (corrected from the diagonalcross section to the observed depth; see Fig. 6a) of �1.8 lm (thiscorresponds on the SEM-picture �2.5 lm). After 48 h, the reallayer thickness is �3.5 lm, after 140 h �8.3 lm and after 200 h12.6 lm (Fig. 6d). From these optical observations, one can con-clude that the thickness of the transformed layer increases linearlywith time (Fig. 7) at a rate of 0.0624 lm h�1.
3.3. EBSD mapping and Raman spectroscopy
To confirm that the martensitic twinning observed by SEM isindeed caused by the transformation to monoclinic zirconia, l-Raman spectroscopy and EBSD were used.
To investigate the transition region from transformed to unaf-fected material with EBSD, a 200-h-aged sample was chosen. Theresults are shown in Fig. 8, in which it is plain that the monoclinicphase is the main phase present in the previously observed regionswith twinning features. Some residual tetragonal grains are pres-ent in this area, which corresponds well to the information fromXRD. Again, the sharp border to the zone of tetragonal zirconia inthe bulk material is visible, with no gradual decrease in between.
In the core zone with tetragonal zirconia, the grains appear tobe decorated by monoclinic rims. It is not certain whether this isdue to a structural distortion of rims in general, which causes theprogram to interpret these parts as transformed or ill identifiable,
c) 140h 2 µµm
b) 48ha) 24h
d) 200h2 µm
1 µm 1 µm
Fig. 6. SEM micrographs of the cross sections (45� cut) after different times of hydrothermal storage. The dashed line highlights the border between transformed (twinningvisible) and virgin material. Note that the displayed depth of the transformation front has to be recalculated to yield the true vertical depths of 1.8 lm, 3.5 lm and 8.3 lm in(a), (b) and (c), respectively. The depth of �12.6 lm for the condition of (d) has overrun the visible section.
0
2
4
6
8
10
12
14
0 100 150 200
Thic
knes
s [µ
m]
aging time at 134°C [h]50
Fig. 7. Transformed layer thickness determined in FIB cuts (cf., Fig. 6) as a functionof storage times at 134 �C. A linear rate constant of 0.0624 lm h�1 (=1.5 lm day�1)is obtained with r2 > 0.98. Error bars correspond to the microstructure with a grainsize of �800 nm.
4830 M. Keuper et al. / Acta Biomaterialia 9 (2013) 4826–4835
or whether this is indeed a transformed rim, but due to the trans-port of the section, exposing it to moist air. Without further cluesfrom careful studies, the evidence points rather towards a clear-cut grain-to-grain boundary.
Additionally, the FIB-milled area of each specimen was mea-sured by Raman spectroscopy. In Fig. 9, a typical mapping byl-Raman spectroscopy of the 140-h-aged sample is shown. Theborder between the untransformed and transformed zone is againclearly detectable and in very good agreement with the SEMresults and also with the EBSD measurements. The visible gradientof the monoclinic intensities directly at the sharp border is anartifact of analysis, as discussed below.
4. Discussion
4.1. Raman spectroscopy and the transition shape
In Fig. 9, Raman spectroscopy seems to indicate a gradualchange over �20 lm in the transition between transformed andunaffected zirconia. This is a measurement artifact caused by thegeometry of the analyzed volume. As shown in greater detail inprevious studies [41–43], the zone, from which information isgathered in confocal Raman spectroscopy is not confined to the fo-cal point. The double cone of penetrating rays together with path-way-length-dependent absorption creates an information zone,which, for the case of the optically transparent zirconia and the
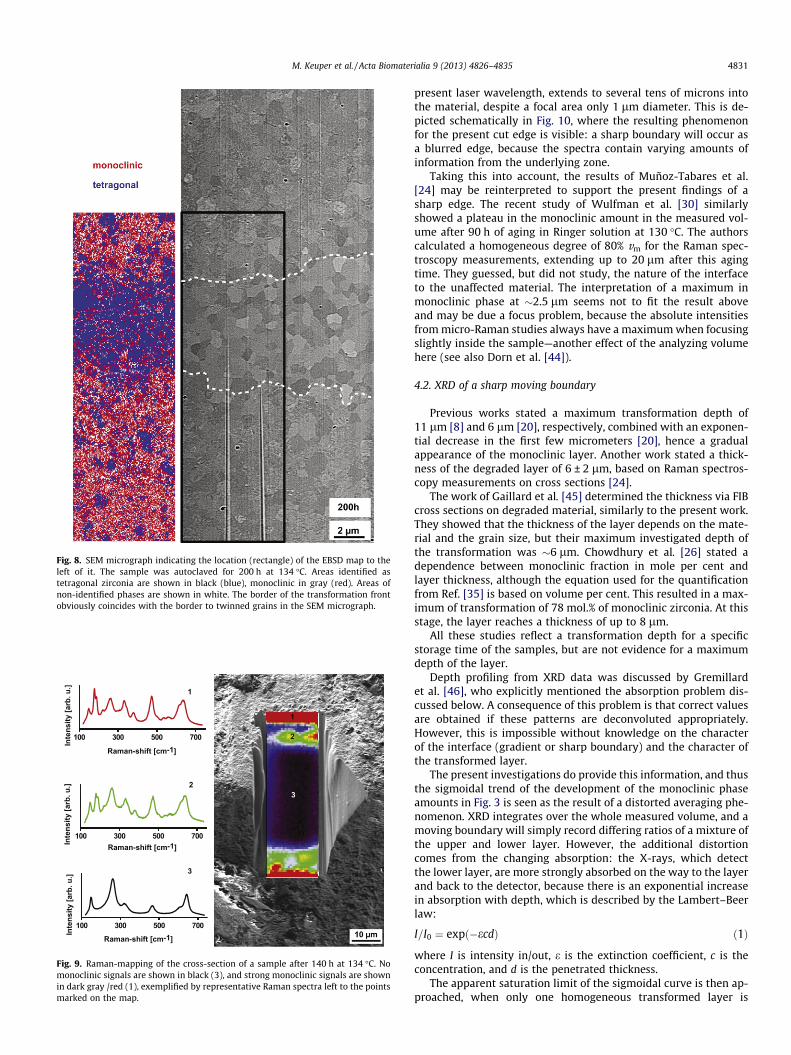
Fig. 8. SEM micrograph indicating the location (rectangle) of the EBSD map to theleft of it. The sample was autoclaved for 200 h at 134 �C. Areas identified astetragonal zirconia are shown in black (blue), monoclinic in gray (red). Areas ofnon-identified phases are shown in white. The border of the transformation frontobviously coincides with the border to twinned grains in the SEM micrograph.
100 300 500 700
100 300 500 700
100 300 500 700
Inte
nsity
[arb
. u.]
1
2
3
Raman-shift [cm-1]
Inte
nsity
[arb
. u.]
Inte
nsity
[arb
. u.]
Raman-shift [cm-1]
Raman-shift [cm-1]
3
2
1
Fig. 9. Raman-mapping of the cross-section of a sample after 140 h at 134 �C. Nomonoclinic signals are shown in black (3), and strong monoclinic signals are shownin dark gray /red (1), exemplified by representative Raman spectra left to the pointsmarked on the map.
M. Keuper et al. / Acta Biomaterialia 9 (2013) 4826–4835 4831
present laser wavelength, extends to several tens of microns intothe material, despite a focal area only 1 lm diameter. This is de-picted schematically in Fig. 10, where the resulting phenomenonfor the present cut edge is visible: a sharp boundary will occur asa blurred edge, because the spectra contain varying amounts ofinformation from the underlying zone.
Taking this into account, the results of Muñoz-Tabares et al.[24] may be reinterpreted to support the present findings of asharp edge. The recent study of Wulfman et al. [30] similarlyshowed a plateau in the monoclinic amount in the measured vol-ume after 90 h of aging in Ringer solution at 130 �C. The authorscalculated a homogeneous degree of 80% vm for the Raman spec-troscopy measurements, extending up to 20 lm after this agingtime. They guessed, but did not study, the nature of the interfaceto the unaffected material. The interpretation of a maximum inmonoclinic phase at �2.5 lm seems not to fit the result aboveand may be due a focus problem, because the absolute intensitiesfrom micro-Raman studies always have a maximum when focusingslightly inside the sample—another effect of the analyzing volumehere (see also Dorn et al. [44]).
4.2. XRD of a sharp moving boundary
Previous works stated a maximum transformation depth of11 lm [8] and 6 lm [20], respectively, combined with an exponen-tial decrease in the first few micrometers [20], hence a gradualappearance of the monoclinic layer. Another work stated a thick-ness of the degraded layer of 6 ± 2 lm, based on Raman spectros-copy measurements on cross sections [24].
The work of Gaillard et al. [45] determined the thickness via FIBcross sections on degraded material, similarly to the present work.They showed that the thickness of the layer depends on the mate-rial and the grain size, but their maximum investigated depth ofthe transformation was �6 lm. Chowdhury et al. [26] stated adependence between monoclinic fraction in mole per cent andlayer thickness, although the equation used for the quantificationfrom Ref. [35] is based on volume per cent. This resulted in a max-imum of transformation of 78 mol.% of monoclinic zirconia. At thisstage, the layer reaches a thickness of up to 8 lm.
All these studies reflect a transformation depth for a specificstorage time of the samples, but are not evidence for a maximumdepth of the layer.
Depth profiling from XRD data was discussed by Gremillardet al. [46], who explicitly mentioned the absorption problem dis-cussed below. A consequence of this problem is that correct valuesare obtained if these patterns are deconvoluted appropriately.However, this is impossible without knowledge on the characterof the interface (gradient or sharp boundary) and the character ofthe transformed layer.
The present investigations do provide this information, and thusthe sigmoidal trend of the development of the monoclinic phaseamounts in Fig. 3 is seen as the result of a distorted averaging phe-nomenon. XRD integrates over the whole measured volume, and amoving boundary will simply record differing ratios of a mixture ofthe upper and lower layer. However, the additional distortioncomes from the changing absorption: the X-rays, which detectthe lower layer, are more strongly absorbed on the way to the layerand back to the detector, because there is an exponential increasein absorption with depth, which is described by the Lambert–Beerlaw:
I=I0 ¼ expð�ecdÞ ð1Þ
where I is intensity in/out, e is the extinction coefficient, c is theconcentration, and d is the penetrated thickness.
The apparent saturation limit of the sigmoidal curve is then ap-proached, when only one homogeneous transformed layer is
10 µm 0
10
20
30
40
50
60
70
80
90
Mea
sure
men
t ste
ps [µ
m]
Intensity of monoclinic bands [arb. u.]
Ideal line: informationonly from the focus area
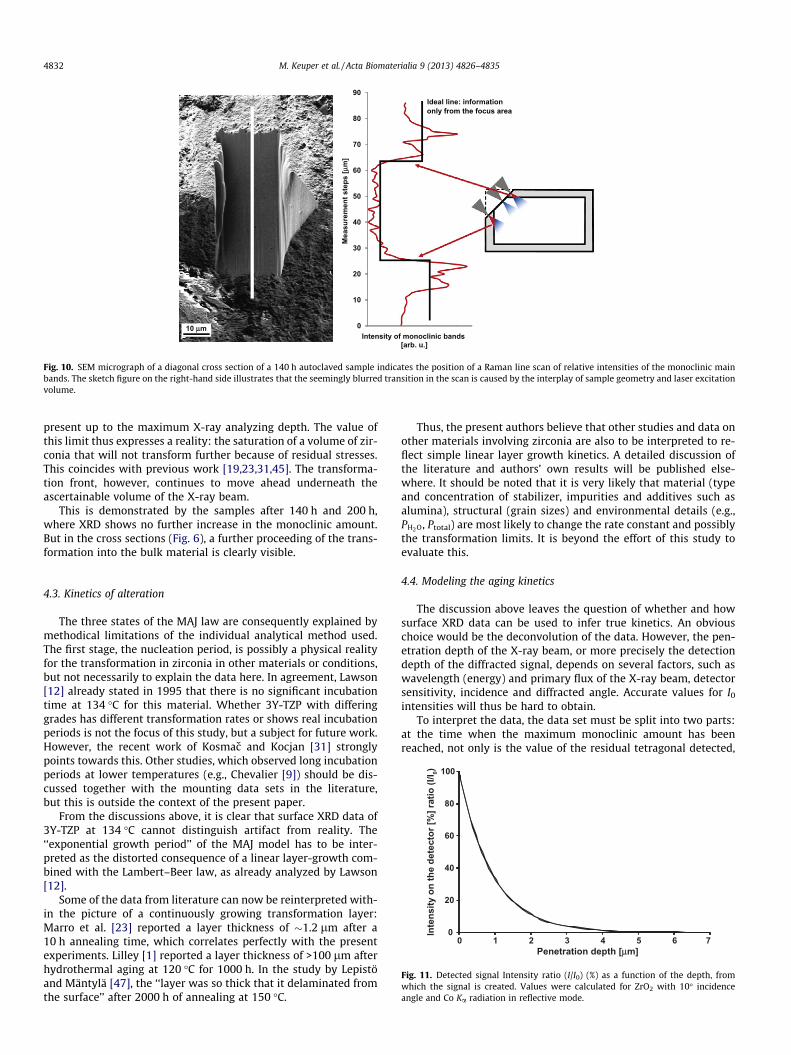
Fig. 10. SEM micrograph of a diagonal cross section of a 140 h autoclaved sample indicates the position of a Raman line scan of relative intensities of the monoclinic mainbands. The sketch figure on the right-hand side illustrates that the seemingly blurred transition in the scan is caused by the interplay of sample geometry and laser excitationvolume.
4832 M. Keuper et al. / Acta Biomaterialia 9 (2013) 4826–4835
present up to the maximum X-ray analyzing depth. The value ofthis limit thus expresses a reality: the saturation of a volume of zir-conia that will not transform further because of residual stresses.This coincides with previous work [19,23,31,45]. The transforma-tion front, however, continues to move ahead underneath theascertainable volume of the X-ray beam.
This is demonstrated by the samples after 140 h and 200 h,where XRD shows no further increase in the monoclinic amount.But in the cross sections (Fig. 6), a further proceeding of the trans-formation into the bulk material is clearly visible.
0
20
40
60
80
100
0 1 2 3 4 5 6 7
Inte
nsity
on
the
dete
ctor
[%] r
atio
(I/I 0)
Penetration depth [µm]
Fig. 11. Detected signal Intensity ratio (I/I0) (%) as a function of the depth, fromwhich the signal is created. Values were calculated for ZrO2 with 10� incidenceangle and Co Ka radiation in reflective mode.
4.3. Kinetics of alteration
The three states of the MAJ law are consequently explained bymethodical limitations of the individual analytical method used.The first stage, the nucleation period, is possibly a physical realityfor the transformation in zirconia in other materials or conditions,but not necessarily to explain the data here. In agreement, Lawson[12] already stated in 1995 that there is no significant incubationtime at 134 �C for this material. Whether 3Y-TZP with differinggrades has different transformation rates or shows real incubationperiods is not the focus of this study, but a subject for future work.However, the recent work of Kosmac and Kocjan [31] stronglypoints towards this. Other studies, which observed long incubationperiods at lower temperatures (e.g., Chevalier [9]) should be dis-cussed together with the mounting data sets in the literature,but this is outside the context of the present paper.
From the discussions above, it is clear that surface XRD data of3Y-TZP at 134 �C cannot distinguish artifact from reality. The‘‘exponential growth period’’ of the MAJ model has to be inter-preted as the distorted consequence of a linear layer-growth com-bined with the Lambert–Beer law, as already analyzed by Lawson[12].
Some of the data from literature can now be reinterpreted with-in the picture of a continuously growing transformation layer:Marro et al. [23] reported a layer thickness of �1.2 lm after a10 h annealing time, which correlates perfectly with the presentexperiments. Lilley [1] reported a layer thickness of >100 lm afterhydrothermal aging at 120 �C for 1000 h. In the study by Lepistöand Mäntylä [47], the ‘‘layer was so thick that it delaminated fromthe surface’’ after 2000 h of annealing at 150 �C.
Thus, the present authors believe that other studies and data onother materials involving zirconia are also to be interpreted to re-flect simple linear layer growth kinetics. A detailed discussion ofthe literature and authors’ own results will be published else-where. It should be noted that it is very likely that material (typeand concentration of stabilizer, impurities and additives such asalumina), structural (grain sizes) and environmental details (e.g.,PH2O, Ptotal) are most likely to change the rate constant and possiblythe transformation limits. It is beyond the effort of this study toevaluate this.
4.4. Modeling the aging kinetics
The discussion above leaves the question of whether and howsurface XRD data can be used to infer true kinetics. An obviouschoice would be the deconvolution of the data. However, the pen-etration depth of the X-ray beam, or more precisely the detectiondepth of the diffracted signal, depends on several factors, such aswavelength (energy) and primary flux of the X-ray beam, detectorsensitivity, incidence and diffracted angle. Accurate values for I0
intensities will thus be hard to obtain.To interpret the data, the data set must be split into two parts:
at the time when the maximum monoclinic amount has beenreached, not only is the value of the residual tetragonal detected,
0 2 4 6 8 10 12
0
10
30
40
50
60
70
80
0 50 100 150 200aging time at 134°C [h]
uncertainty
unce
rtai
nty
layer thickness [µµm]
X rof seul av-D
RXm
]%-l oV[
thickness-time-relation from FIB
20
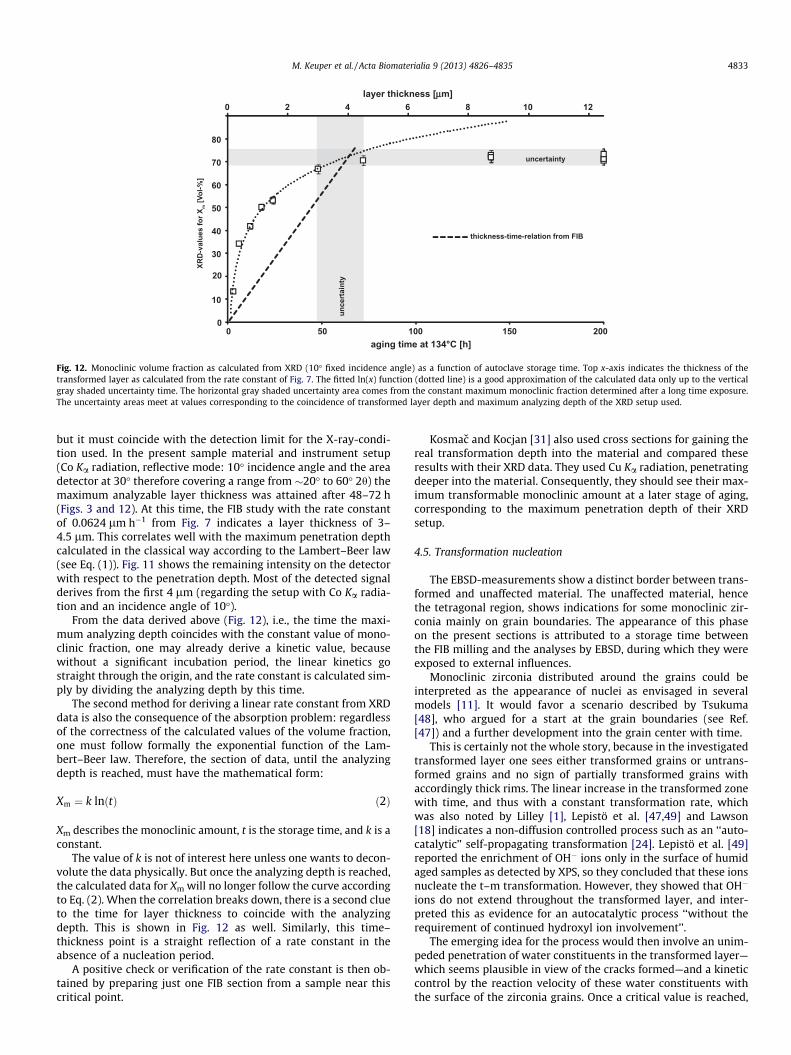
Fig. 12. Monoclinic volume fraction as calculated from XRD (10� fixed incidence angle) as a function of autoclave storage time. Top x-axis indicates the thickness of thetransformed layer as calculated from the rate constant of Fig. 7. The fitted ln(x) function (dotted line) is a good approximation of the calculated data only up to the verticalgray shaded uncertainty time. The horizontal gray shaded uncertainty area comes from the constant maximum monoclinic fraction determined after a long time exposure.The uncertainty areas meet at values corresponding to the coincidence of transformed layer depth and maximum analyzing depth of the XRD setup used.
M. Keuper et al. / Acta Biomaterialia 9 (2013) 4826–4835 4833
but it must coincide with the detection limit for the X-ray-condi-tion used. In the present sample material and instrument setup(Co Ka radiation, reflective mode: 10� incidence angle and the areadetector at 30� therefore covering a range from �20� to 60� 2h) themaximum analyzable layer thickness was attained after 48–72 h(Figs. 3 and 12). At this time, the FIB study with the rate constantof 0.0624 lm h�1 from Fig. 7 indicates a layer thickness of 3–4.5 lm. This correlates well with the maximum penetration depthcalculated in the classical way according to the Lambert–Beer law(see Eq. (1)). Fig. 11 shows the remaining intensity on the detectorwith respect to the penetration depth. Most of the detected signalderives from the first 4 lm (regarding the setup with Co Ka radia-tion and an incidence angle of 10�).
From the data derived above (Fig. 12), i.e., the time the maxi-mum analyzing depth coincides with the constant value of mono-clinic fraction, one may already derive a kinetic value, becausewithout a significant incubation period, the linear kinetics gostraight through the origin, and the rate constant is calculated sim-ply by dividing the analyzing depth by this time.
The second method for deriving a linear rate constant from XRDdata is also the consequence of the absorption problem: regardlessof the correctness of the calculated values of the volume fraction,one must follow formally the exponential function of the Lam-bert–Beer law. Therefore, the section of data, until the analyzingdepth is reached, must have the mathematical form:
Xm ¼ k lnðtÞ ð2Þ
Xm describes the monoclinic amount, t is the storage time, and k is aconstant.
The value of k is not of interest here unless one wants to decon-volute the data physically. But once the analyzing depth is reached,the calculated data for Xm will no longer follow the curve accordingto Eq. (2). When the correlation breaks down, there is a second clueto the time for layer thickness to coincide with the analyzingdepth. This is shown in Fig. 12 as well. Similarly, this time–thickness point is a straight reflection of a rate constant in theabsence of a nucleation period.
A positive check or verification of the rate constant is then ob-tained by preparing just one FIB section from a sample near thiscritical point.
Kosmac and Kocjan [31] also used cross sections for gaining thereal transformation depth into the material and compared theseresults with their XRD data. They used Cu Ka radiation, penetratingdeeper into the material. Consequently, they should see their max-imum transformable monoclinic amount at a later stage of aging,corresponding to the maximum penetration depth of their XRDsetup.
4.5. Transformation nucleation
The EBSD-measurements show a distinct border between trans-formed and unaffected material. The unaffected material, hencethe tetragonal region, shows indications for some monoclinic zir-conia mainly on grain boundaries. The appearance of this phaseon the present sections is attributed to a storage time betweenthe FIB milling and the analyses by EBSD, during which they wereexposed to external influences.
Monoclinic zirconia distributed around the grains could beinterpreted as the appearance of nuclei as envisaged in severalmodels [11]. It would favor a scenario described by Tsukuma[48], who argued for a start at the grain boundaries (see Ref.[47]) and a further development into the grain center with time.
This is certainly not the whole story, because in the investigatedtransformed layer one sees either transformed grains or untrans-formed grains and no sign of partially transformed grains withaccordingly thick rims. The linear increase in the transformed zonewith time, and thus with a constant transformation rate, whichwas also noted by Lilley [1], Lepistö et al. [47,49] and Lawson[18] indicates a non-diffusion controlled process such as an ‘‘auto-catalytic’’ self-propagating transformation [24]. Lepistö et al. [49]reported the enrichment of OH� ions only in the surface of humidaged samples as detected by XPS, so they concluded that these ionsnucleate the t–m transformation. However, they showed that OH�
ions do not extend throughout the transformed layer, and inter-preted this as evidence for an autocatalytic process ‘‘without therequirement of continued hydroxyl ion involvement’’.
The emerging idea for the process would then involve an unim-peded penetration of water constituents in the transformed layer—which seems plausible in view of the cracks formed—and a kineticcontrol by the reaction velocity of these water constituents withthe surface of the zirconia grains. Once a critical value is reached,
4834 M. Keuper et al. / Acta Biomaterialia 9 (2013) 4826–4835
the grain transforms completely, exposing the next grain to thewet condition. All in all, linear kinetics then prevail.
5. Conclusions
The present results, especially the investigation of the FIB crosssections via SEM and EBSD, present direct evidence of the transfor-mation behavior after different aging times. It is shown that thetransformation process from tetragonal to monoclinic ZrO2 underhydrothermal conditions (134 �C/3 bar saturated water vapor pres-sure) in 3 mol.% Y-TZP produces a well-defined region of mono-clinic ZrO2 with amounts of �73%. The layer itself expandscontinuously and linearly into the depth of the material withincreasing time. Gaining this information, the FIB-milled cross sec-tion investigations are most essential and the basis for furtheranalyses.
No significant gradient is detectable in this layer, which ends upwith a distinct border to the untreated bulk material with a rough-ness on the grain scale.
From these results, it is now possible to interpret the results ofthe XRD near-surface measurements correctly. This means that thetransformation layer starts already consisting of a fixed amount ofmonoclinic ZrO2 (the true saturation limit, which depends on thematerial) nearly from the very beginning and proceeds withoutgrowth restriction. Any reported so-called saturation limitationswith time are only due to the limited individual penetration depthof the analytical tool used, e.g., XRD or Raman spectroscopy. Withthe direct investigation of the FIB cross sections via SEM, it is nowpossible to ‘‘translate’’ the quantified XRD results correctly into areal layer thickness, as long as the analytical setup and the agingparameters can be clearly distinguished.
The present authors envisage the kinetics to be controlled bythe reaction velocity of water or its constituents with the rim ofzirconia grains, which are contacted by water through unimpededaccess within the transformed layer. The autocatalytic transforma-tion of single grains opens the pathway into the depth of the mate-rial, where the reaction velocity again takes control.
Acknowledgements
The authors gratefully acknowledge support by the German Re-search Association DFG under contract Ni-299/23-1. They wouldlike to thank VITA Zahnfabrik Rauter GmbH & Co. KG for kindlysupplying the material used and the support in this study, Mr.Qu and Prof. Strunk (Institute for Materials Science, UniversityStuttgart) for the EBSD measurements, and Mr. Dreher and Mr.Kern at the NMI Reutlingen for offering their FIB/SEM equipmentand their know-how.
Appendix A. Figures with essential colour discrimination
Certain figures in this article, particularly Figs. 8, 9, and 10 aredifficult to interpret in black and white. The full colour imagescan be found in the on-line version, at http://dx.doi.org/10.1016/j.actbio.2012.08.032.
References
[1] Lilley E. Review of low temperature degradation in Y-TZPs. In: Tressler RE,McNallans M, editors. Corrosion and corrosive degradation ofceramics. Westerville, OH: American Ceramic Society; 1990. p. 387–407.
[2] Chevalier J, Gremillard L, Deville S. Low-temperature degradation of zirconiaand implications for biomedical implants. Annu Rev Mater Res 2007;37(1):1–32.
[3] Lughi V, Sergo V. Low temperature degradation aging of zirconia: a criticalreview of the relevant aspects in dentistry. Dent Mater 2010;26(8):807–20.
[4] Murase Y, Kato E. Phase transformation of zirconia by ball-milling. J Am CeramSoc – Discussions and notes 1979;62(9-10):527.
[5] Kosmac T, Oblak C, Jevnikar P, Funduk N, Marion L. Strength and reliability ofsurface treated Y-TZP dental ceramics. Appl Biomater 2000;53:304–13.
[6] Juy A, Anglada M. Surface phase transformation during grinding of Y-TZP. J AmCeram Soc 2007;90(8):2618–21.
[7] Kao HC, Ho FY, Yang CC, Wei WJ. Surface machining of fine-grain Y-TZP. J EurCeram Soc 2000;20(14–15):2447–55.
[8] Borchers L et al. Influence of hydrothermal and mechanical conditions on thestrength of zirconia. Acta Biomater 2010;6(12):4547–52.
[9] Chevalier J. Low-temperature aging of Y-TZP ceramics. J Am Ceram Soc1999;82(8):2150–4.
[10] Kobayashi K, Kuwajima H, Masaki T. Phase change and mechanical propertiesof ZrO2–Y2O3 solid electrolyte after ageing. Solid State Ionics 1981;3–4:489–93.
[11] Guo X. Property degradation of tetragonal zirconia induced by low-temperature defect reaction with water molecules. Chem Mater2004;16:3988–94.
[12] Lawson S. Environmental degradation of zirconia ceramics. J Eur Ceram Soc1995;15(6):485–502.
[13] Guo X. Hydrothermal degradation mechanism of tetragonal Zirconia. J MaterSci 2001;36(15):3737–44.
[14] Guo X. On the degradation of zirconia ceramics during low-temperature annealing in water or water vapor. J Phys Chem Solids 1999;60(4):539–46.
[15] Johnson WA, Mehl RF. Reaction kinetics in processes of nucleation and growth.Trans Am Inst Min Metall Eng 1939;135:416–58.
[16] Whitney ED. Kinetics and mechanism of the transition of metastabletetragonal to monoclinic zirconia. Trans Faraday Soc 1965;61:1991–2000.
[17] Lu HY, Lin HY, Chen SY. Autocatalytic effect and microstructural developmentduring ageing of 3 mol% Y2O3–TZP. Ceram Int 1987;13(4):207–14.
[18] Lawson S, Smith PA. A new technique for monitoring aging in yttria–tetragonalzirconia polycrystals. J Am Ceram Soc 1993;76(12):3170–2.
[19] Gremillard L, Chevalier J, Epicier T, Deville S, Fantozzi G. Modeling the agingkinetics of zirconia ceramics. J Eur Ceram Soc 2004;24(13):3483–9.
[20] Cattani-Lorente M, Scherrer SS, Ammann P, Jobin M, Wiskott HWA. Lowtemperature degradation of a Y-TZP dental ceramic. Acta Biomater2011;7(2):858–65.
[21] Nakajima K, Kobayashi K, Murata Y. Phase stability of Y-PSZ in aqueoussolutions. Adv Ceram 1984;12:399.
[22] Marro F, Anglada M. Strengthening of vickers indented 3Y-TZP byhydrothermal ageing. J Eur Ceram Soc 2012;32:317–24.
[23] Marro F, Armas Z, Horwat D, Anglada M. Estimation of thickness ofhydrothermal degraded layer in 3Y-TZP by X-ray diffraction. IOP Publishing;2009.
[24] Muñoz-Tabares J, Jiménez-Piqué E, Anglada M. Subsurface evaluation ofhydrothermal degradation of zirconia. Acta Mater 2011;59(2):473–84.
[25] Muñoz-Tabares J, Jiménez-Piqué E, Reyes-Gasga J, Anglada M. Microstructuralchanges in ground 3Y-TZP and their effect on mechanical properties. ActaMater 2011;59:6670–83.
[26] Chowdhury S, Vohra YK, Lemons JE, Ueno M, Ikeda J. Accelerating aging ofzirconia femoral head implants: change of surface structure and mechanicalproperties. J Biomed Mater Res Part B: Appl Biomater 2007;81(2):486–92.
[27] Wada S, Yokoyama K. Differences in the tetragonal to monoclinic phasetransformation rate in hot water of 3 mol% Y2O3–ZrO2 ceramics underdifferent surface conditions. Nippon seramikkusu kyokai gakujutsuronbunshi 1999;107(1):92–5.
[28] Sato T, Shimada M. Control of the tetragonal-to-monoclinic phasetransformation of yttria partially stabilized zirconia in hot water. J Mater Sci1985;20(11):3988–92.
[29] Sato T, Shimada M. Transformation of yttria-doped tetragonal ZrO2
polycrystals by annealing in water. J Am Ceram Soc 1985;68:356–9.[30] Wulfman C, Djaker N, Dupont N, Ruse D, Sadoun M, la Chapelle ML. Raman
spectroscopy evaluation of subsurface hydrothermal degradation of zirconia. JAm Ceram Soc 2012;95(7):2347–51.
[31] Kosmac T, Kocjan A. Ageing of dental zirconia ceramics. J Eur Ceram Soc2012;32:2613–22.
[32] Kim YS, Jung CH, Park JY. Low temperature degradation of yttria-stabilizedtetragonal zirconia polycrystals under aqueous solutions. J Nucl Mater1994;209(3):326–31.
[33] Berthold C, Bjeoumikhov A, Brügemann L. Fast XRD2 microdiffraction withfocusing X-ray microlenses. Part Part Syst Char 2009;26:107–11.
[34] Beer A. Bestimmung der Absorption des rothen Lichts in farbigenFlüssigkeiten. Annalen der Physik 1852;162:78–88.
[35] Garvie RC, Nicholson PS. Phase analysis in zirconia systems. J Am Ceram Soc1972;55(6):303–5.
[36] Toraya H, Yoshimura M, Somiya S. Calibration curve for quantitative analysisof the monoclinic-tetragonal ZrO2 system by X-ray diffraction. J Am Ceram Soc1984;67(6):C-119–C-121.
[37] Keuper M. Nachweis der oberflächennahen Phasenumwandlung vonZirkoniumdioxid: Vergleich von Raman Spektroskopie und XRD. Diplomathesis, Tübingen: Eberhard Karls Universität; 2009.
[38] Eder K. Niedertemperaturumwandlung in dentalen ZirkoniumdioxidKeramiken: Charakterisierung und Einfluss der Farbgebung. Diploma thesis,Tübingen: Eberhard Karls Universität; 2012.
[39] Marro FG, Chintapalli R, Hvizdos P, Soldera F, Mucklich F, Anglada M. Study ofnear surface changes in yttria-doped tetragonal zirconia after low temperaturedegradation. Int J Mater Res 2009;100(1):92–6.

M. Keuper et al. / Acta Biomaterialia 9 (2013) 4826–4835 4835
[40] Soldera F, Gaillard Y, Gomila M, Muecklich F. FIB-tomography ofnanoindentation cracks in zirconia polycrystals. Microsc Microanal2007;13(S02):1510–1.
[41] De Grauw CJ, Sijtsema NM, Otto C, Grewe J. Axial resolution of confocal Ramanmicroscopes: Gaussian beam theory and practice. J Microsc 1997;188(Part3):237–79.
[42] Everall N. Confocal Raman microscopy: why the depth resolution and spatialaccuracy can be much worse than you think. Appl Spectrosc 2000;54(10):1515–20.
[43] Presser V, Keuper M, Berthold C, Nickel KG. Experimental determination of theRaman sampling depth in ZrO2 ceramics. J Appl Spectrosc 2009;63(11):1288–92.
[44] Dorn M, Nickel KG. Zirconia ceramics: phase transitions and ramanspectroscopy. In: Gogotsi Y, Domnichs S, editors. High pressure surfacescience and engineering. Bristol: Institute of Physics Publishing; 2004. p.466–519.
[45] Gaillard Y, Jimenez-Piqué E, Soldera F, Mücklich F, Anglada M. Quantificationof hydrothermal degradation in zirconia by nanoindentation. Acta Mater2008;56:4206–16.
[46] Gremillard L, Grandjean S, Chevalier J. A new method to measure monoclinicdepth profile in zirconia-based ceramics from X-ray diffraction data. Int JMater Res 2010;101(1):88–94.
[47] Lepistö T, Mäntylä T. A model for structural degradation of Y-TZP ceramics inhumid atmosphere. In: 13th annual conference on composites and advancedceramic materials. Tampere University of Technology Institute of MaterialsScience Tampere, Finland. Wiley-American Ceramic Society; 2009.
[48] Tsukuma K. Mechanical properties and thermal stability of CeO2 containingtetragonal zirconia polycrystals. Am Ceram Soc Bull 1986;65(10).
[49] Lepistö TT, Lintula PV, Mäntylä TA. TZP-ceramics in humid conditions at150 �C. Wiley Online Library; 1988.


