DIPLOMARBEIT - CORE · DIPLOMARBEIT Titel der Diplomarbeit The antimutagenic and antioxidant...
112
DIPLOMARBEIT Titel der Diplomarbeit The antimutagenic and antioxidant potential of stercobilin and urobilin in the Ames Salmonella test angestrebter akademischer Grad Magistra der Naturwissenschaften (Mag. rer. nat.) Verfasserin/Verfasser: Andrea Steyrer Matrikel-Nummer: 0402564 Studienrichtung: A474 Ernährungswissenschaften Betreuerin/Betreuer: Ao. Univ.-Prof. Dr. Karl-Heinz Wagner Wien, am 7.Juni 2010
Transcript of DIPLOMARBEIT - CORE · DIPLOMARBEIT Titel der Diplomarbeit The antimutagenic and antioxidant...

DIPLOMARBEIT
Titel der Diplomarbeit
The antimutagenic and antioxidant potential of stercobilin and urobilin in the Ames Salmonella test
angestrebter akademischer Grad
Magistra der Naturwissenschaften (Mag. rer. nat.)
Verfasserin/Verfasser: Andrea Steyrer
Matrikel-Nummer: 0402564
Studienrichtung: A474 Ernährungswissenschaften
Betreuerin/Betreuer: Ao. Univ.-Prof. Dr. Karl-Heinz Wagner
Wien, am 7.Juni 2010

ACKNOWLEDGEMENTS
I would like to express my appreciation to my thesis supervisor Prof. Dr. Karl-
Heinz Wagner who afforded the realization of this international project and
encouraged us during the whole time. Thanks for giving me the opportunity to
be part of the ‘Oxidative stress and DNA damage’ research group.
Sincere thanks to our overseas co-project leader, Dr. Andrew Bulmer. I would
like to acknowledge your helpful comments on the experiments and your
literature recommendations.
Furthermore I would like to thank Mag. Christine Mölzer for teaching us the
basics of the Ames Salmonella test. Special thanks for helpful comments on the
text, continual research support and assistance in problem solving. All the best
for your doctoral dissertation!
Many thanks also to my lab co-workers Gesa Ziesel and Roland Holler, for their
assistance, encouragement and cooperation during the whole time in our Ames
group.
Finally, I would like to thank my family who continuously supported me during
my years of study.
I
TABLE OF CONTENTS 1 LIST OF FIGURES ........................................................................... VI
2 LIST OF TABLES ........................................................................... VIII
33 LIST OF ABBREVIATIONS ............................................................... X
4 INTRODUCTION ................................................................................ 1
5 LITERATURE SURVEY ..................................................................... 3
5.1 The Ames test ..................................... ............................................. 3
5.1.1 Main features of the test procedure.................................................... 3
5.1.1.1 Historical aspects ............................................................................... 3
5.1.2 The Salmonella typhimurium tester strains ........................................ 4
5.1.2.1 Genotypes of the bacterial strains ...................................................... 4
5.1.3 Metabolic activation systems ............................................................. 6
5.1.3.1 Oxidative metabolism ......................................................................... 6
5.1.3.2 Reductive metabolism ........................................................................ 6
5.1.4 Positive and negative controls ........................................................... 7
5.1.4.1 Positive control chemicals .................................................................. 7
5.1.4.2 Negative control chemicals ................................................................ 7
5.2 Bile pigments – History, Chemistry, Metabolism .... ...................... 8
5.2.1 Historical background ......................................................................... 8
5.2.2 General chemical aspects .................................................................. 9
5.2.3 Formation of bile pigments ............................................................... 11
5.2.4 Bile pigments in mammals and other animals .................................. 16
5.3 Bile pigments – Harmful and protective aspects .... .................... 16
5.3.1 Harmful aspects and bile pigment related diseases ......................... 16

II
5.3.1.1 Toxicity of bile pigments ................................................................... 16
5.3.1.2 Neonatal jaundice and bilirubin encephalopathy .............................. 17
5.3.1.3 Crigler-Najjar-syndrome ................................................................... 17
5.3.1.4 Gilbert Syndrome ............................................................................. 18
5.3.1.5 Cell proliferation ............................................................................... 19
5.3.2 Protective aspects ............................................................................ 20
5.3.2.1 Antioxidant potential of bile pigments ............................................... 20
5.3.2.2 Antimutagenic activity of bile pigments ............................................ 24
5.3.2.3 Other postulated effects of bile pigments ......................................... 29
6 MATERIALS AND METHODS .......................................................... 33
6.1 General principles of the Ames test ............... .............................. 33
6.2 Solutions used for the assay procedure ............ .......................... 33
6.2.1 Ampicillin solution............................................................................. 33
6.2.2 Tetracycline solution ........................................................................ 33
6.2.3 Glucose solution (40%) .................................................................... 34
6.2.4 Glucose-6-phosphate solution (304mg/ml) ...................................... 34
6.2.5 Histidine-biotin solution .................................................................... 34
6.2.6 Histidine solution .............................................................................. 34
6.2.7 Biotin solution ................................................................................... 34
6.2.8 Overnight culture .............................................................................. 35
6.2.9 Master plates ................................................................................... 35
6.2.10 MgCl2/KCl solution ........................................................................... 36
6.2.11 Minimal glucose agar plates ............................................................. 36
6.2.12 NADP solution .................................................................................. 37
6.2.13 S9-Mix .............................................................................................. 37
6.2.14 Top agar ........................................................................................... 37

III
6.2.15 Vogel-Bonner solution ...................................................................... 37
6.3 Experimental design ............................... ....................................... 40
6.3.1 Chemicals and reagents .................................................................. 40
6.3.2 Bacterial strains................................................................................ 40
6.3.3 Positive control chemicals ................................................................ 41
6.3.4 Negative control chemicals .............................................................. 44
6.4 Assay procedure ................................... ......................................... 44
6.4.1 Preparation of the bile pigment samples .......................................... 44
6.4.2 Antimutagenic/Antioxidant assays.................................................... 45
6.4.3 Mutagenicity assays ......................................................................... 47
6.5 Statistical analysis .............................. ........................................... 49
6.5.1 Non statistical evaluation ................................................................. 49
6.5.2 Statistical evaluation ........................................................................ 50
7 RESULTS AND DISCUSSION ......................................................... 52
7.1 Antimutagenic testing with TA98 ................... ............................... 53
7.1.1 Mutagenicity induced by TNFone ..................................................... 53
7.1.2 Mutagenicity induced by PhiP .......................................................... 55
7.1.3 Mutagenicity induced by AFB1 ......................................................... 56
7.2 Antimutagenic and antioxidant testing with TA102 .. .................. 57
7.2.1 Mutagenicity induced by TNFone ..................................................... 57
7.2.2 Mutagenicity induced by AFB1 ......................................................... 58
7.2.3 Mutagenicity induced by t-BuOOH without S9 ................................. 60
7.2.4 Mutagenicity induced by t-BuOOH with S9 ...................................... 61
7.3 Mutagenicity assays ............................... ....................................... 67
8 CONCLUSION .................................................................................. 70

IV
9 SUMMARY ....................................................................................... 73
10 ZUSAMMENFASSUNG .................................................................... 74
11 REFERENCES ................................................................................. 75
12 APPENDIX ....................................................................................... 82
12.1 Antimutagenic assays with TA98 .................... ............................. 82
12.1.1 Single revertant numbers for TA98 .................................................. 82
12.1.2 Positive control values TA98 for Stercobilin ..................................... 84
12.1.3 Negative control values TA98 for Stercobilin ................................... 84
12.1.4 Positive control values TA98 for Urobilin .......................................... 85
12.1.5 Negative control values TA98 for Urobilin ........................................ 85
12.2 Antimutagenic/antioxidant assays with TA102 ....... .................... 86
12.2.1 Single revertant numbers for TA102 ................................................ 86
12.2.2 Positive control values TA102 for Stercobilin ................................... 88
12.2.3 Negative control values TA102 for Stercobilin ................................. 88
12.2.4 Positive control values TA102 for Urobilin ........................................ 89
12.2.5 Negative control values TA102 for Urobilin ...................................... 89
12.3 Mutagenicity assays with TA98 and TA102 ........... ...................... 90
12.3.1 Single revertant numbers for TA98 without S9 ................................. 90
12.3.2 Positive control values TA98 without S9 for Stercobilin ................... 90
12.3.3 Negative control values TA98 without S9 for Stercobilin .................. 91
12.3.4 Positive control values TA98 without S9 for Urobilin ........................ 91
12.3.5 Negative control values TA98 without S9 for Urobilin ...................... 92
12.3.6 Single revertant numbers for TA102 without S9 ............................... 92
12.3.7 Positive control values TA102 without S9 for Stercobilin ................. 93
12.3.8 Negative control values TA102 without S9 for Stercobilin ................ 94
12.3.9 Positive control values TA102 without S9 for Urobilin ...................... 94

V
12.3.10 Single revertant numbers for TA98 with S9 ...................................... 95
12.3.11 Positive control values TA98 with S9 for Stercobilin and Urobilin .... 96
12.3.12 Negative control values TA98 with S9 for Stercobilin and Urobilin ... 96
12.3.13 Single revertant numbers for TA102 with S9 .................................... 97
12.3.14 Positive control values TA102 with S9 for Stercobilin and Urobilin .. 98
12.3.15 Negative control values TA102 with S9 for Stercobilin and Urobilin . 98
13 CURRICULUM VITAE ...................................................................... 99

VI
1 LIST OF FIGURES
Figure 1: Two dimensional structure of bilirubin and biliverdin……………….. ............. 10
Figure 2: Chemical structures of stercobilin and urobilin………………………………… 11
Figure 3: Heme degradation from biliverdin to bilirubin…............................................. 13
Figure 4: Multiple steps in the reduction of unconjugated bilirubin by intestinal
microflora showing the chemical structure of the products formed………….......... ...... 15
Figure 5: Metabolism and structures of fecal pigments in mammals……………………23
Figure 6: OVNC incubated for 12 hours at 37°C ..... .................................................... 35
Figure 7: Urobilin hydrochloride .................................................................................. 40
Figure 8: Three-dimensional structure of TNFone ....................................................... 41
Figure 9: Chemical structure of t-BuOOH ................................................................... 42
Figure 10: Chemical structure of PhiP ......................................................................... 42
Figure 11: Chemical structure of AFB1 ....................................................................... 43
Figure 12: Preparation of urobilin in eight different concentrations .............................. 44
Figure 13: Poured plates drying in the incubator for 48h ............................................ 46
Figure 14: Diagram depicting the steps involved in the plates incorporation assay ..... 47
Figure 15: The modulatory effects of bile pigments, stercobilin ▲- - - ▲ (S) and urobilin
♦ ♦ (U) towards TNFone induced genotoxicity in TA98 Salmonella typhimurium
(S≥1µmol/plate, U≥0.5 and U≤0.05, p<0.05)……………………………………………... 54
Figure 16: The modulatory effects of bile pigments, stercobilin ▲- - - ▲ (S) and urobilin
♦ ♦ (U) towards PhiP induced genotoxicity in TA98 Salmonella typhimurium (p<0.05
at all concentrations tested)………………………………………………………………… 55
Figure 17: The modulatory effects of bile pigments, stercobilin ▲- - - ▲ (S) and urobilin
♦ ♦ (U) towards AFB1 induced genotoxicity in TA98 Salmonella typhimurium
(S≤1µmol/plate, U at all concentrations tested, p<0.05)………………………………... 56
Figure 18: The modulatory effects of bile pigments, stercobilin ▲- - - ▲ (S) and urobilin
♦ ♦ (U) towards TNFone induced genotoxicity in TA102 Salmonella typhimurium
(p<0.05 at all concentrations tested)……………………………………………………... .. 58

VII
Figure 19: The modulatory effects of bile pigments, stercobilin ▲- - - ▲ (S) and urobilin
♦ ♦ (U) towards AFB1 induced genotoxicity in TA102 Salmonella typhimurium
(S≤1µmol/plate, U at all concentrations tested, p<0.05)…………………………………. 59
Figure20: The modulatory effects of bile pigments, stercobilin ▲- - - ▲ (S) and urobilin
♦ ♦ (U) towards t-BuOOH induced genotoxicity in TA102 Salmonella typhimurium (S
at 1, 0.1 and 0.05µmol/plate, p<0.05)…………………………………………………....... 60
Figure21: The modulatory effects of bile pigments, stercobilin ▲- - - ▲ (S) and urobilin
♦ ♦ (U) towards t-BuOOH with S9 induced genotoxicity in TA102 Salmonella
typhimurium (U≥0.01µmol/plate, S at all concentrations tested, p<0.05)………….. .... 61
Figure 22: TA98 colonies in a mutagenicity assay without metabolic activation
(Urobilin)………………………………………………………………………………………. 67
Figure 23: Non-mutagenic potential of stercobilin (S) and urobilin (U) towards TNFone
induced genotoxicity in TA98 Salmonella typhimurium (* *, p<0.001)…… ................... 68
Figure 24: Non-mutagenic potential of stercobilin (S) and urobilin (U) towards PhiP and
AFB1 induced genotoxicity in TA98 Salmonella typhimurium (* *, p<0.001) ................ 68
Figure 25: Non-mutagenic potential of stercobilin (S) and urobilin (U) towards TNFone
and t-BuOOH induced genotoxicity in TA102 Salmonella typhimurium
(* *,<0.001)……………………………………………………………………………. ......... 69
Figure 26: Non-mutagenic potential of stercobilin (S) and urobilin (U) towards AFB1
and t-BuOOH induced genotoxicity in TA102 Salmonella typhimurium
(* *, p<0.001)…………………………………………………………………………….. ...... 69

VIII
2 LIST OF TABLES
Table 1: Ranges of spontaneous revertant colonies in the Ames Salmonella test ........ 8
Table 2: The antimutagenic potential of bile pigments and related pyrrole pigments in
the Ames test .............................................................................................................. 28
Table 3: Association between mortality risk and highest and lowest serum bilirubin
concentration in men (relative risk and confidence interval)……………................ ....... 30
Table 4: Association between mortality risk and highest and lowest serum bilirubin
concentration in women (relative risk and confidence interval)……………......... ......... 31
Table 5: Strain specific antibiotics for preparation of the master plates ....................... 35
Table 6: Chemicals and reagents used within the test procedure ............................... 39
Table 7: General overview of mutagens used in the Ames test ................................... 43
Table 8: Preparation of the bile pigment samples ....................................................... 45
Table 9: The modulatory effects of stercobilin and urobilin on genotoxicity in the
TA98 and TA102 Salmonella typhimurium strain………………………………………….52
Table 10: Modulatory effects of stercobilin and urobilin in Salmonella typhimurium
strain TA98……………………………………………………………………… .................. 63
Table 11: Modulatory effects of stercobilin and urobilin in Salmonella typhimurium
strain TA102………………………………………………………………………… ............ 66
Table 12: Single revertant numbers of stercobilin and urobilin towards TNFone and
PhiP induced genotoxicity in TA98………………………………………………………….83
Table 13: Positive control values for TNFone, PhiP and AFB1 in TA98 (Stercobilin) ... 84
Table 14: Negative control values for TNFone, PhiP and AFB1 in TA98 (Stercobilin) . 84
Table15: Positive control values for TNFone, PhiP and AFB1 in TA98 (Urobilin) ........ 85
Table 16: Negative control values for TNFone, PhiP and AFB1 in TA98 (Urobilin)...... 85
Table 17: Single revertant numbers of stercobilin and urobilin towards TNFone, t-
BuOOH and AFB1 induced genotoxicity in TA102……………………………………….. 87
Table 18: Positive control values for TNFone, t-BuOOH and AFB1 in TA102
(Stercobilin)……………………………………………………………………………… ....... 88

IX
Table 19: Negative control values for TNFone, t-BuOOH, AFB1 in TA102
(Stercobilin)…………………………………………………………………................. ........ 88
Table 20: Positive control values for TNFone, t-BuOOH and AFB1 in TA102
(Urobilin)………………………………………………………………………………………. 89
Table 21: Negative control values for TNFone, t-BuOOH and AFB1 in TA102
(Urobilin)…………………………………………………………………………………. ....... 89
Table 22: Single revertant numbers of stercobilin and urobilin towards TNFone induced
genotoxicity in TA98………………………………………………………………............... 90
Table 23: Positive control values for TNFone in TA98 (Stercobilin) ............................. 90
Table 24: Negative control values for TNFone in TA98 (Stercobilin) ........................... 91
Table25: Positive control values for TNFone in TA98 (Urobilin) .................................. 91
Table26: Negative control values for TNFone in TA98 (Urobilin) ................................. 92
Table 27: Single revertant numbers of stercobilin and urobilin towards TNFone and
t-BuOOH induced genotoxicity in TA102 ..................................................................... 93
Table 28: Positive control values for TNFone and t-BuOOH in TA102 (Stercobilin) .... 93
Table29: Negative control values for TNFone and t-BuOOH in TA102 (Stercobilin) .... 94
Table 30: Positive control values for TNFone and t-BuOOH in TA102 (Urobilin) ......... 94
Table31: Single revertant numbers of stercobilin and urobilin towards PhiP and AFB1
induced genotoxicity in TA98……………………………………………………………. . ... 95
Table32: Positive control values for PhiP and AFB1 in TA98
(Stercobilin and Urobilin)………………………………………………………………….. . 96
Table33: Negative control values for PhiP and AFB1 in TA98
(Stercobilin and Urobilin) ............................................................................................. 96
Table34: Single revertant numbers of stercobilin and urobilin towards t-BuOOH and
AFB1 induced genotoxicity in TA102 .......................................................................... 97
Table 35: Positive control values for t-BuOOH and AFB1 in TA102
(Stercobilin and Urobilin)……………………………………………………………………..98
Table 36: Negative control values for t-BuOOH and AFB1 in TA102
(Stercobilin and Urobilin)……………………………………………………………………..98

X
3 LIST OF ABBREVIATIONS
1-NP 1-nitropyrene
2-AF 2-aminofluorene
2-NF 2-nitrofluorene
3-NFA 3-nitrofluoranthene
AFB1 aflatoxin B1
AMVN 2,2-azobis (2,4-dimethylvaleronitrile)
B[α]P benzo[α]pyrene
BV biliverdin
BRT bilirubin ditaurate
CAT catalase
DMSO dimethylsulfoxide
DPPH 1,1-diphenyl-2-picrylhydradyl
GPx glutathione-peroxidase
his + histidine independence
ID50 bile pigment dose [µmol/plate] that inhibit 50% of the positive control mutagenicity
LDL low density lipoprotein
NADP nicotineamideadeninedinocleotide phosphate
NaN3 sodium azide
OVNC overnight culture

XI
PETN pentaerithrityl tetranitrate
Phip 2-amino-1-methyl-6-phenylimidazo [4, 5,-b] pyridine
(U) BR (unconjugated) bilirubin
RONS reactive oxygen and nitrogen species
ROS reactive oxygen species
S9 S9-rat liver homogenate
SOD superoxide dismutase
TA102 histidine auxotrophe salmonella typhimurium tester strain 102
TA98 histidine auxotrophe salmonella typhimurium tester strain 98
t-BuOOH teriary-butylhydroxyperoxide
TNFone 2, 4, 7- Trinitro-9-Fluorenone
UDP glucuronosyl transferase uridinediphosphoglucuronate glucuronosyl transferase
UGT1A1 hepatic uridine diphosphate glucuronosyl transferase

Introduction
1
4 INTRODUCTION
Bile pigments including bilirubin and biliverdin belong to the class of ‘porphyrin’
molecules. These coloured compounds are tetrapyrrolic, dicarboxylic acids that
are produced in the body. An adult human produces approximately 300mg
bilirubin per day which is the principal mammalian bile pigment and a catabolic
end product of the degradation of heme [PETRYKA and HOWE, 1979].
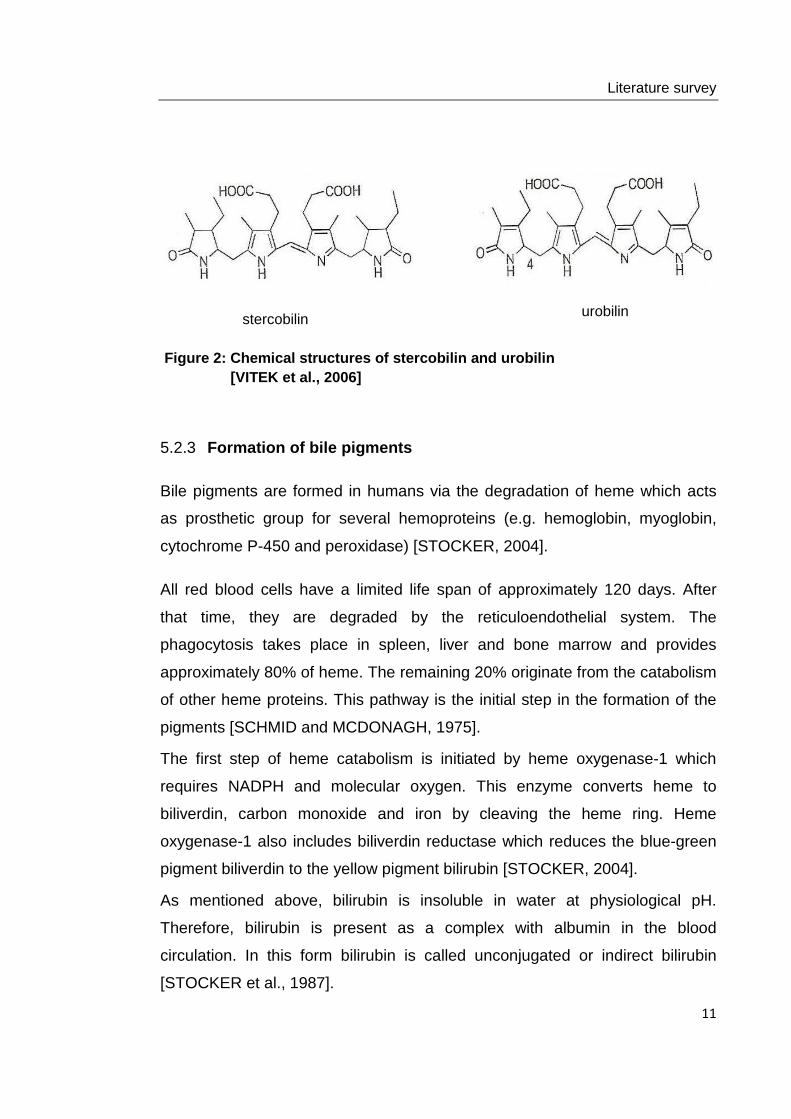
Urobilinoids including urobilin and stercobilin are degradation products formed by
bacterial reduction of bilirubin in the gastrointestinal tract. These compounds
occur primarily in the stools of human beings and provide the colouration of
faeces [VITEK et al., 2006].
For a long time, bilirubin has been associated with toxicity or illness.
Furthermore, bile pigments have been considered as waste products of heme-
catabolism leading to adverse effects if they accumulate in the body [BULMER et
al., 2008].
Over the past 20 years, researchers have expressed their interest to the variety
of endogenous antioxidant compounds that may prevent oxidative damage
[TEMME, 2001]. A series of studies has been performed to explain the
physiological relevance of bile pigments. In the mid 1900s, the beneficial effects
of bilirubin were described for the first time in an in vivo study. It was found that
bilirubin can provide antioxidant potential by protecting vitamin A from oxidation
in the lumen [BERNHARD, 1954]. As mentioned in a recent publication,
unconjugated bilirubin, biliverdin and bilirubin ditaurate possess antimutagenic
and antioxidant effects. It was shown that these compounds inhibit the
genotoxicity of different mutagens in Salmonella bacteria [BULMER et al., 2007].
Furthermore, numerous studies have demonstrated that the impact of heme
oxygenase and slightly increased serum bilirubin concentrations may protect
against oxidative stress induced diseases, such as atherosclerosis and cancer
[VITEK and OSTROW, 2009].

Introduction
2
So far, there are only a few published studies dealing with the beneficial effects
of stercobilin and urobilin. From 1868 to 1871, researchers examined these two
bile pigments in urine and feces which are formed by bacterial reduction of
bilirubin [PETRYKA and HOWE, 1979].
In continuation of formerly published data on a variety of bile pigments it was the
aim of the present study to investigate the potential antimutagenic and
antioxidant properties of stercobilin and urobilin in the Ames Salmonella test. To
my knowledge, these compounds have never been used before in this test
model. The bile pigments were tested in the presence of two bacterial strains and
different mutagens (TNFone, Phip, AFB1 and t-BuOOH) were used to provide the
formation of mutant revertants. Mutagenicity assays were performed to ensure
the non-mutagenic potential of stercobilin and urobilin.
The present study was part of the project: ‘The physiological relevance of bile
pigments - In vitro to in vivo evidence of antioxidant, anti- mutagenic and anti-
carcinogenic potential and their mechanisms of action’. Principal investigator is
A.o. Univ.-Prof. Dr. Mag. Karl-Heinz Wagner and his experimental working group
‘Oxidative stress and DNA damage’.
The entire research included eight bile pigments. My workmate Gesa Ziesel and
me investigated the modulatory effects of bilirubin dimethyl ester, biliverdin
dimethyl ester, stercobilin and urobilin and split these up between the two of us.
Mag. Christine Mölzer and Hedwig Huber studied the antimutagenic and
antioxidant effects of bilirubin, biliverdin, bilirubin ditaurate and protoporphyrin
under the same test conditions. The research activities were funded by the
Austrian Science Fund (FWF, Vienna).

Literature survey
3
5 LITERATURE SURVEY
5.1 The Ames test
5.1.1 Main features of the test procedure
The Ames Salmonella test is defined as a short-term bacterial reverse
mutation assay. This assay is used all around the world to determine the
mutagenic potential of new chemicals and drugs that can produce genetic
damage that leads to gene mutations. Furthermore, the test is an important
method for registration or acceptance of various chemicals, including drugs
and biocides. It is very important to comply with formalities and international
guidelines (e.g., Organisation for Economic Co-operation and Development
(OECD); International Commission on Harmonization (ICH)) to ensure
uniformity of the testing procedures [MORTELMANS and ZEIGER, 2000].
5.1.1.1 Historical aspects
The Ames Salmonella/microsome mutagenicity assay is named after its
developer, Dr. Bruce Ames.
In 1966, Ames and Whitfield used a spot test procedure with several histidine
mutant strains for screening chemically induced mutagenesis. In order to
perform the spot test it is necessary to apply a small amount of the test
chemical directly to the center of an agar plate. A concentration gradient is
formed after diffusion of the chemical into the agar. Mutagenic chemicals can
be detected by a ring of revertant colonies surrounding the area where the
chemical was applied. Toxic effects of a chemical are characterized by a zone
of growth inhibition [MORTELMANS and ZEIGER, 2000].
In 1973, Ames et al. established the plate incorporation assay. This assay
procedure was performed in the present study to investigate the potential
Literature survey
4
antimutagenic and antioxidant effects of stercobilin and urobilin. The
development of the plate incorporation assay was a major contributing factor
to the success of the Ames test and replaced spot test or liquid suspension
procedures. The plate incorporation assay is more sensitive and quantitative
than the spot test. A further advantage is the easier and cheaper test
performance [MORTELMANS and ZEIGER, 2000].
5.1.2 The Salmonella typhimurium tester strains
The Ames test uses a number of different Salmonella typhimurium strains
which are histidine dependent and contain some type of mutation in the
histidine operon. The bacterial strains are not able to grow on a minimal
glucose agar plate unless the cultures are supplemented with a trace amount
of histidine. That implies that only those bacteria that revert to histidine
independence (his+) are able to form colonies [BARILE, 1994].
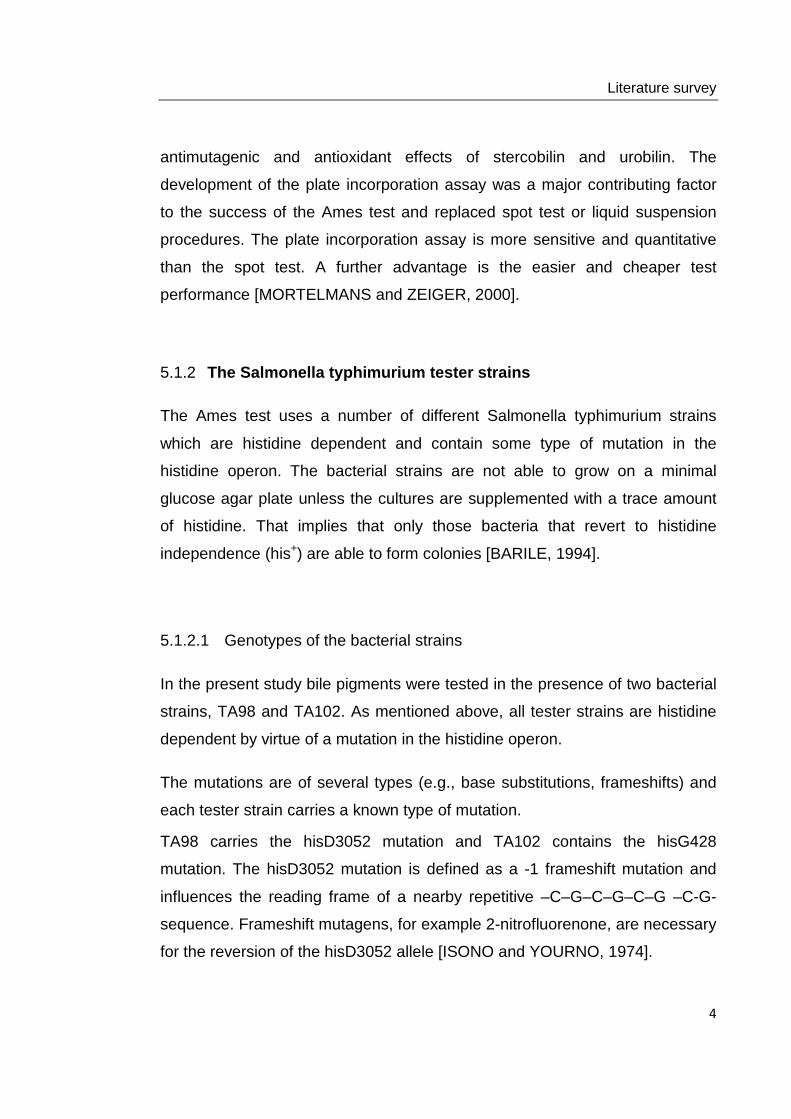
5.1.2.1 Genotypes of the bacterial strains
In the present study bile pigments were tested in the presence of two bacterial
strains, TA98 and TA102. As mentioned above, all tester strains are histidine
dependent by virtue of a mutation in the histidine operon.
The mutations are of several types (e.g., base substitutions, frameshifts) and
each tester strain carries a known type of mutation.
TA98 carries the hisD3052 mutation and TA102 contains the hisG428
mutation. The hisD3052 mutation is defined as a -1 frameshift mutation and
influences the reading frame of a nearby repetitive –C–G–C–G–C–G –C-G-
sequence. Frameshift mutagens, for example 2-nitrofluorenone, are necessary
for the reversion of the hisD3052 allele [ISONO and YOURNO, 1974].

Literature survey
5
Strain TA102 which carries the hisG428 mutation contains A·T base pairs at
the site of mutation in contrast to the other Salmonella strains that detect
mutagens damaging G·C base pairs. Furthermore, TA102 detects a number of
oxidative mutagens, for example hydroperoxides. HisG428 mutation is an
ochre mutation that can be reverted by all six possible base-pair changes
[LEVIN et al., 1982].
The plasmid pKM101 is present in both bacterial tester strains and carries an
ampicillin resistance gene. The R factor plasmid improves the error-prone
DNA repair. Additional introduction of the multi-copy plasmid pAQ1 in strain
TA102 contains a tetracycline resistance gene, which is useful for detecting
the presence of the plasmid [MORTELMANS and ZEIGER, 2000].
Moreover, strain TA98 and TA102 contain the rfa-mutation which affects the
characteristics of the bacterial cell wall by inducing a partial loss of the
lipopolysaccharide barrier. The result is an increased permeability of the cells
[MORTELMANS and ZEIGER, 2000].
Strain TA98 includes the uvrB deletion mutation which appears as a repair
pathway for DNA damage and eliminates the exact excision repair. As a result,
more DNA lesions can be repaired by the error-prone DNA repair mechanism.
This type of shift is not performed in TA102 [AMES et al., 1973].
Summing up, it can be said that TA98 is a kind of a frameshift sensitive strain
that supplies information on frameshift mutations. The tester strain TA102 can
be described as a base-pair substitution-strain which detects DNA cross-
linking damage and is sensitive to mutagens causing oxidative damage
[MARON and AMES, 1983]. Before starting the test series the strains were
checked for genetic integrity.

Literature survey
6
5.1.3 Metabolic activation systems
Some classes of chemicals are not self-acting and therefore require metabolic
activation to be biologically active. A distinction is made between oxidative-
and reductive enzyme systems [MORTELMANS and ZEIGER, 2000].
5.1.3.1 Oxidative metabolism
Several carcinogenic chemicals, such aromatic amines or polycyclic aromatic
amines have to be activated by a metabolic activation system; otherwise they
would be biologically ineffective. Humans and lower animals possess the
cytochrome-based P450 system which is present primarily in the liver. This
metabolic oxidation system is able to metabolize various chemicals into DNA-
reactive, electrophilic forms. A relevant disadvantage of the Salmonella
typhimurium strains and bacterial test systems in general, is their lack of
metabolic abilities, including the cytochrome-based P450 metabolic oxidation
system. This fact has led to the use of an exogenous mammalian organ
activation system which consists of a 9000xg supernatal fraction of a rat liver
homogenate [MARON and AMES, 1983].
5.1.3.2 Reductive metabolism
A reductive enzyme system can be used for the metabolic activation of
chemicals containing azo and diazo bonds. A reduction of such chemicals can
be obtained in the anaerobic intestinal microflora, in the intestinal wall and in
the liver of mammals, including man. Two different types of reductive in vitro
systems are commonly in use. Type 1 is based on a liver homogenate
supplemented with FMN [PRIVAL et al., 1984]. Type 2 is based on rat
intestinal microflora preparations [REID et al., 1984].

Literature survey
7
5.1.4 Positive and negative controls
Each experiment in the present study included solvent controls and diagnostic
positive controls specific for each strain and for the metabolic activation
system [MORTELMANS and ZEIGER, 2000].
5.1.4.1 Positive control chemicals
Diagnostic mutagens are used in the Ames test to ensure the efficacy of the
S9 rat liver homogenate and the reversion properties of the tester strains. The
concentration of the positive control should be calculated for each new S9-
charge, because each batch of metabolic activation is subject to fluctuations
[MORTELSMANS and ZEIGER, 2000].
5.1.4.2 Negative control chemicals
Each tester strain has a relatively constant number of spontaneous revertant
colonies. Day-to-day and laboratory-to-laboratory variations usually arise. The
spontaneous mutant frequency can also be influenced by the utilization of S9.
For instance, the spontaneous revertant values of strain TA102 will increase in
the presence of metabolic activation because the strain is highly sensitive to
the S9 addition [MORTELMANS and ZEIGER, 2000].

Literature survey
8
Strain Number of revertants
without S9
with S9
TA97 75-200 100-200
TA98 20-50 20-50
TA100 75-200 75-200
TA102 100-300 200-400
TA104 200-300 300-400
TA1535 5-20 5-20
TA1537 5-20 5-20
TA1538 5-20 5-20
Table 1: Ranges of spontaneous revertant colonies i n the Ames Salmonella test [modified: MORTELMANS and ZEIGER, 2000]
5.2 Bile pigments – History, Chemistry, Metabolism
5.2.1 Historical background
Over the years the opinion about the physiological importance of bile pigments
has considerably changed. These coloured compounds were used in the
traditional Chinese medicine for thousands of years to prevent and heal
different diseases like epilepsy, convulsions and tetany. The treatment
particularly involved the oral supplementation of gall stones and the salts of
bilirubin. Furthermore, a regular administration should imply life prolonging
properties [READ, 1976]. In the modern medicine the beneficial properties of
bile pigments were ignored for a long time. Especially bilirubin was described
as a useless by-product of heme catabolism that can be toxic [BULMER et al.,
2008].

Literature survey
9
The origin of scientific studies dates back to the 19th century. In that time, the
term ‘bilirubin’ was established [STADELER, 1864]. Fischer et al. classified all
potential isomers of protoporphyrin and the mesoporphyrins in fifteen groups
[FISCHER and ORTH, 1934].
The history of urobilinoids began in 1868. At this time, Jaffe discovered the
bile pigment urobilin in urine and feces. Urobilin combined with zinc salts
showed a strong green fluorescence [JAFFE, 1868]. In 1871, stercobilin was
identified in feces [LAIR and MASIUS, 1871]. At this time, the formation of
urobilinoids by heme degradation was still unknown.
More than forty years later, the identity of these two pigments was proven.
Further research was done in this field resulting in very important discoveries.
It was established that stercobilin and urobilin were formed by bacterial
reduction of bilirubin. The formation of both pigments via bacterial reduction
was introduced by Maly and later confirmed by other researchers [WATSON et
al., 1969].
5.2.2 General chemical aspects
The term ‘bile pigment’ describes all linear open-chain tetrapyrroles [MC
DONAGH, 1979]. Tetrapyrroles possess many different functions, such as
light harvesting pigments in higher plants, energy generation in bacterial and
eukaryotic cells, antioxidant effects, generation of ROS and cell signaling in
eukaryotic cells [VITEK and OSTROW, 2009].
The endogenous pigments, unconjugated and conjugated bilirubin, belong to
this group. Additionally, bile pigments include biliverdin and the urobilinoids,
stercobilin and urobilin. These pigments are tetrapyrrolic, dicarboxylic acids
that belong to the porphyrin family of molecules. These coloured compounds
possess two propionic acid side chains and are formed in the human body

Literature survey
10
[BULMER et al., 2008]. The unique chemical structure of the porphyrins is
responsible for their biochemical and genetic features.
Chlorophylls, hemoglobins and heme-containing enzymes are classified as
porphyrin derivatives that include metalloporphyrins as the active part [ODIN,
1997]. All bile pigments contain two free or conjugated propionate groups and
several double bonds which are susceptible to oxidation. Therefore, these
pigments can serve as antioxidants by transferring their free electrons to other
unstable chemicals. The solubility of bilirubin in water and in most lipid
solvents is poor. Bilirubin dissolves best in hydrogen bond-breaking solvents,
for example DMSO [OSTROW and CELIC, 1984].
F
Figure 1: Two dimensional structure of bilirubin an d biliverdin [BULMER et al., 2008]
unconjugated bilirubin biliverdin
Literature survey
11
Figure 2: Chemical structures of stercobilin and u robilin [VITEK et al., 2006]
5.2.3 Formation of bile pigments
Bile pigments are formed in humans via the degradation of heme which acts
as prosthetic group for several hemoproteins (e.g. hemoglobin, myoglobin,
cytochrome P-450 and peroxidase) [STOCKER, 2004].
All red blood cells have a limited life span of approximately 120 days. After
that time, they are degraded by the reticuloendothelial system. The
phagocytosis takes place in spleen, liver and bone marrow and provides
approximately 80% of heme. The remaining 20% originate from the catabolism
of other heme proteins. This pathway is the initial step in the formation of the
pigments [SCHMID and MCDONAGH, 1975].
The first step of heme catabolism is initiated by heme oxygenase-1 which
requires NADPH and molecular oxygen. This enzyme converts heme to
biliverdin, carbon monoxide and iron by cleaving the heme ring. Heme
oxygenase-1 also includes biliverdin reductase which reduces the blue-green
pigment biliverdin to the yellow pigment bilirubin [STOCKER, 2004].
As mentioned above, bilirubin is insoluble in water at physiological pH.
Therefore, bilirubin is present as a complex with albumin in the blood
circulation. In this form bilirubin is called unconjugated or indirect bilirubin
[STOCKER et al., 1987].
urobilin stercobilin

Literature survey
12
Bilirubin dissociates from its carrier protein and is taken up from blood into
hepatocytes. In the liver, unconjugated bilirubin is conjugated with glucuronic
acid by the enzyme UDP glucuronosyl transferase (UGT1A1). In this form the
bilirubin is called conjugated or direct bilirubin. Bilirubin diglucuronide is then
transported into the bile caniculi and thence into the bile. Finally, the
conjugated bilirubin reaches the duodenum via the bile duct. There it is
hydrolyzed to hydrogenated derivatives of bilirubin and finally to urobilinoids by
bacterial enzymes including β-glucuronidase [STOCKER, 2004].
The major portions of urobilinoids are excreted into the stool and provide the
colouration of feces [STOCKER, 2004]. It is established that unconjugated
bilirubin is reduced to colorless urobilinoids in the gastrointestinal tract by
intestinal microflora. The most important compounds are urobilinogen and
stercobilinogen as well as their oxidation products, urobilin and stercobilin
[VITEK et al., 2006].

Literature survey
13
heme oxygenase
O2
biliverdin reductase
CO
NADPH
NADP
Figure 3: Heme degradation from biliverdin to bilirubin [modified: VITEK and OSTROW, 2009]

Literature survey
14
Approximately 10-15% of the urobilinoids reach the enterohepatic circulation
which is characterized by reabsorption by hepatocytes, transport through the
portal vein back to the liver and re-excretion via the bile. A minor portion (1.0-
3.5mg urobilinoids per day) is eliminated from the body in the urine as water-
soluble compounds via the kidneys [KUNTZ and KUNTZ, 2008]. The reduction
of unconjugated bilirubin to urobilinoids is very efficient; therefore only 5-20mg
bilirubin per day can be found in stools of humans while the excretion of
urobilinoids range from 50-250mg per day [WITH, 1968, VITEK et al., 2006].
The involvement of specific bacteria in the reduction of unconjugated bilirubin
to urobilinoids is poorly described in the literature. Clostridium perfringens,
Clostridium ramosum, Clostridium difficile and Bacteroides fragilis are a few
microbial species which are uncontroversially involved in the reduction [VITEK
et al., 2000, GUSTAFSSON and LANKE, 1960, FAHMY et al., 1972].

Literature survey
15
Figure 4: Multiple steps in the reduction of unconjugated b ilirubin by intestinal microflora showing the chemical structure of the products formed [VITEK et al., 2006]
Literature survey
16
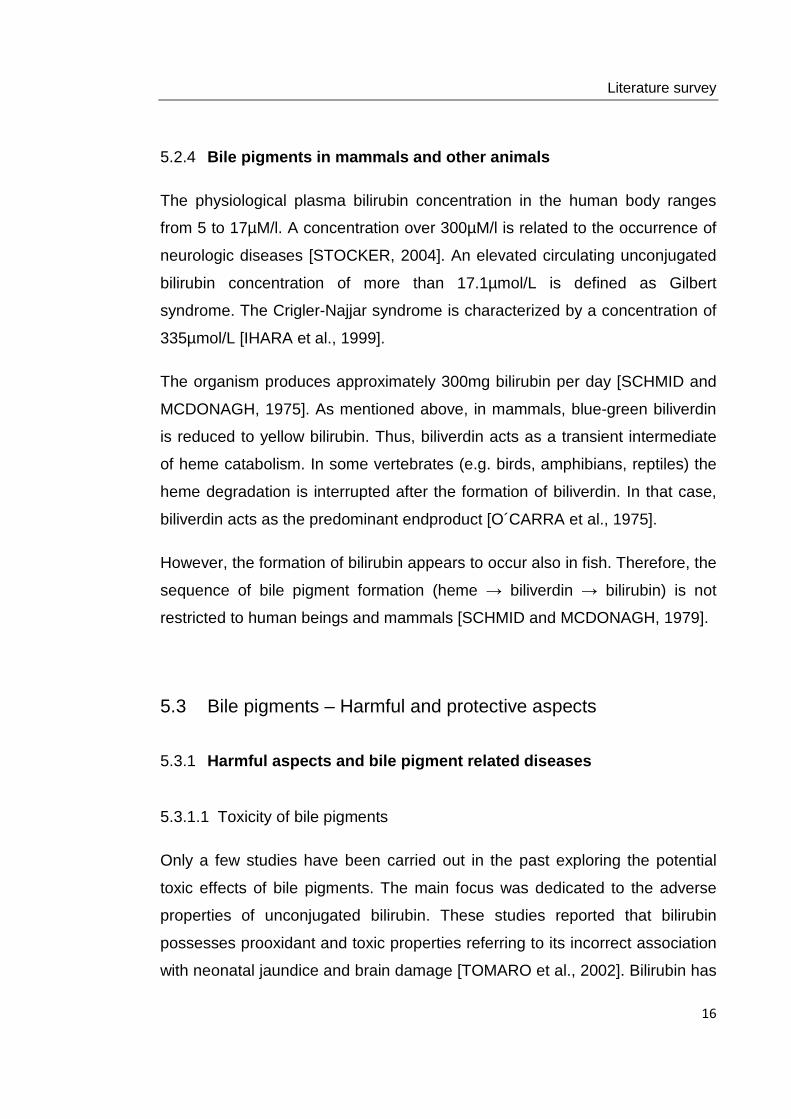
5.2.4 Bile pigments in mammals and other animals
The physiological plasma bilirubin concentration in the human body ranges
from 5 to 17µM/l. A concentration over 300µM/l is related to the occurrence of
neurologic diseases [STOCKER, 2004]. An elevated circulating unconjugated
bilirubin concentration of more than 17.1µmol/L is defined as Gilbert
syndrome. The Crigler-Najjar syndrome is characterized by a concentration of
335µmol/L [IHARA et al., 1999].
The organism produces approximately 300mg bilirubin per day [SCHMID and
MCDONAGH, 1975]. As mentioned above, in mammals, blue-green biliverdin
is reduced to yellow bilirubin. Thus, biliverdin acts as a transient intermediate
of heme catabolism. In some vertebrates (e.g. birds, amphibians, reptiles) the
heme degradation is interrupted after the formation of biliverdin. In that case,
biliverdin acts as the predominant endproduct [O´CARRA et al., 1975].
However, the formation of bilirubin appears to occur also in fish. Therefore, the
sequence of bile pigment formation (heme → biliverdin → bilirubin) is not
restricted to human beings and mammals [SCHMID and MCDONAGH, 1979].
5.3 Bile pigments – Harmful and protective aspects
5.3.1 Harmful aspects and bile pigment related diseases
5.3.1.1 Toxicity of bile pigments
Only a few studies have been carried out in the past exploring the potential
toxic effects of bile pigments. The main focus was dedicated to the adverse
properties of unconjugated bilirubin. These studies reported that bilirubin
possesses prooxidant and toxic properties referring to its incorrect association
with neonatal jaundice and brain damage [TOMARO et al., 2002]. Bilirubin has

Literature survey
17
cytoprotective properties at normal to slightly increased concentrations,
whereas high levels of plasma bilirubin are often cytotoxic [VITEK and
OSTROW, 2009].
5.3.1.2 Neonatal jaundice and bilirubin encephalopathy
Neonatal jaundice appears in almost all newborn babies. During the first two
weeks of life, unconjugated bilirubin concentrations are increased because of
the degradation of fetal red blood cells and the temporary inability of bilirubin
glucuronide formation. At the age of one month, the enzyme UDP
glucuronosyl transferase reaches its fully active and reduces the unconjugated
bilirubin concentration to the adult level [GOURLEY, 1997]. Therefore, the link
between unconjugated bilirubin and the development of neonatal jaundice or
brain damage is not exclusionary, but only relevant at high bilirubin
concentrations.
Excessively elevated unconjugated bilirubin is not able to bind albumin and
therefore it is defined as free unconjugated bilirubin which is highly lipophilic.
This fraction can diffuse into cells by passive diffusion and causes toxic
effects. Unconjugated bilirubin at high concentration can cause various types
of neurological dysfunctions (e.g. kernicterus) which are known as bilirubin
encephalopathy. Newborn infants are particularly at risk of brain damage. The
increased susceptibility is caused by the delayed development of the hepatic
conjugation system (e.g. in premature infants), the reduced binding capacity of
albumin and possible genetic lesions (e.g. Crigler-Najjar syndrome patients)
[SHAPIRO, 2003].
5.3.1.3 Crigler-Najjar-syndrome
A further example for an unconjugated hyperbilirubinemia is the Crigler-Najjar
syndrome. This potentially lethal disorder is characterized by an increased

Literature survey
18
unconjugated bilirubin concentration (15-50mg/dl) in the plasma resulting from
a deficiency of the uridinediphosphoglucuronate glucuronosyl transferase. This
enzyme is predominately responsible for the detoxification and excretion of
bilirubin [GANTLA et al., 1998]. In 1952, the rare syndrome was described by
Crigler and Najjar and was formerly called “a severe congenital familial non-
hemolytic jaundice with kernicterus”. Possible treatments are orthotopic liver
transplantation and phototherapy [CRIGLER and NAJJAR, 1952].
5.3.1.4 Gilbert Syndrome
Gilbert Syndrome is a relatively common disorder (3-17% of the general
population) which is characterized by a mildly increased serum bilirubin
concentration of approximately 17µmol/L. Individuals with Gilbert syndrome
have a reduced activity of the enzyme UDP glucuronosyl transferase. This
enzyme is needed for the synthesis of hepatic uridine diphosphate
glucuronosyl transferase (UGT1A1). In healthy people, UGT1A1 conjugates
bilirubin and eliminates it from the body. The UGT1A1 polymorphism
(UGT1A1*28) is characterized by decreased bilirubin excretion and increased
unconjugated bilirubin levels [IHARA et al., 1999, BULMER et al., 2008].
Numerous studies have been published during the past years demonstrating
the positive effects of mildly elevated serum bilirubin concentrations in the
prevention of oxidative stress-mediated disorders, especially atherosclerotic
diseases [NOVOTNY and VITEK, 2003]. Furthermore, individuals with Gilbert
syndrome suffer lower rates of cardiovascular diseases contrary to individuals
with reduced or normal serum bilirubin levels [BULMER et al., 2008].
Therefore, investigating bile pigments’ mechanism of action constitutes an
exciting new field of research.
In 2008, Bulmer et al. examined the reasons for decreased risk of
cardiovascular disease in Gilbert syndrome patients compared to healthy
individuals. The authors investigated several markers (plasma antioxidant

Literature survey
19
status, erythrocytes antioxidant enzyme activities, plasma malondialdehyde,
blood lipid profile, resistance to serum oxidation) in 21 subjects. Nine
individuals represented the Gilbert syndrome group, whereas the remaining
twelve were controls. It was established that the Gilbert syndrome group was
characterized by a significantly higher trolox equivalent antioxidant capacity
and significantly increased concentrations of unconjugated bilirubin. The
antioxidant activity was measured by FRAP-test (ferric reducing ability of
plasma) which showed significantly better results in the Gilbert syndrome
individuals. Additionally, the Gilbert syndrome patients were characterized by
a 13.6% improved resistance to serum oxidation compared to controls.
This study represented the first attempt to investigate the mechanism how
bilirubin could protect from cardiovascular disease. In order to realize the
important beneficial effects of bile pigments, this still unknown mechanism has
to be explained. After their mechanism of action has been clarified,
researchers could use the physiological effect of bile pigments to prevent
cardiovascular diseases and cancer [BULMER et al., 2008].
5.3.1.5 Cell proliferation
Only a few studies have been designed in the past to explain the potential cell
stimulating effects of biliverdin. A significant result in this field was yielded by
Lafarge-Frayssinet et al. who studied the promoting effects of biliverdin for
hepatic cells mediated by AFB1. The authors demonstrated that, in the
presence of AFB1, biliverdin enhanced the impact of neoplastic liver cell
transformation. In the absence of AFB1, this observation was not confirmed
[LAFARGE-FRAYSSINET et al., 1983]. Although some studies suggest
biliverdin can stimulate cell growth, it is important to review the findings
critically due to the high and hence non physiological biliverdin concentrations
that have been assayed [BREINHOLT et al., 1995].

Literature survey
20
5.3.2 Protective aspects
In the past 20 years, the physiological relevance of bile pigments has been
growing. Numerous studies have been carried out during the last years to
investigate the beneficial effects of bile pigments. As already mentioned, the
majority of research is dealing with the positive properties of bilirubin and
biliverdin. These compounds are said to possess antioxidant, antimutagenic,
anti-complement, anti-viral and anti-apoptotic effects [DUDNIK et al., 2001,
ROMERT et al., 1994, NAKAGAMI et al., 1993]. Only a few studies have been
published dealing with the beneficial properties of stercobilin and urobilin. To
my knowledge, these compounds have never been used before to investigate
their antimutagenic and antioxidant potency in the Ames Salmonella test.
Furthermore, numerous papers have been published exploring the positive
effects of hemin, chlorophyllin and related pyrrole pigments [ARIMOTO et al.,
1995].
Nowadays, the proof of antimutagenic and anticarcinogenic compounds is of
great importance due to the negative effects of an increased mutation rate and
the related cancer risks [ODIN, 1997].
5.3.2.1 Antioxidant potential of bile pigments
Antioxidants are a group of compounds that delay or inhibit the oxidation of an
oxidizable substrate. There are two groups of antioxidants, enzymatic and
non-enzymatic. The enzymatic antioxidant system includes superoxide
dismutase (SOD), catalase (CAT) and glutathione-peroxidase (GPx). Non-
enzymatic antioxidants are vitamin A, vitamin C, vitamin E, flavonoids, uric
acid and bilirubin [HALLIWELL and GUTTERIDGE, 1985]. Non enzymatic
antioxidants are essential in cellular defense, whereas enzymatic antioxidants
are more important in the extracellular space [STOCKER, 2004].

Literature survey
21
Many studies have been published in the last years to elucidate the possible
antioxidant properties of bile pigments, particularly of unconjugated bilirubin
and biliverdin. To my knowledge, only one study has been carried out to
investigate the antioxidant activity of urobilinoids. In this section the postulated
antioxidant effects of bile pigments will be presented and discussed.
In 1953, Bernhard et al. studied the antioxidant activity of bile pigments for the
first time. It was shown that unconjugated bilirubin and biliverdin protect
vitamin A from oxidation [BERNHARD et al., 1954]. More than 60 years later,
Stocker et al. reawaked the interest in bilirubin and its antioxidant potential.
The authors showed that bilirubin was a more efficient peroxyl radical
scavenger than α-tocopherol and vitamin C [STOCKER et al., 1987].
In a subsequent experiment, Stocker et al. studied the antioxidant potential of
albumin-bound bilirubin at concentrations found in plasma of healthy men. The
results indicated that albumin-bound bilirubin inhibited the oxidation of
albumin-bound fatty acids in vitro, particularly of albumin-bound linoleic acid.
1mol of albumin-bound bilirubin was able to scavenge 2mol of peroxyl
radicals. Furthermore, the antioxidant potential of albumin-bound bilirubin was
compared to ascorbate and urate. It was demonstrated that albumin-bound
bilirubin was more or less equally effective in scavenging peroxyl radicals like
uric acid, but less effective than vitamin C. In conclusion, the authors
established that albumin-bound bilirubin has antioxidant properties and acts as
an endogenous antioxidant [STOCKER et al., 1987].
A growing body of evidence supports the view that albumin-bound bilirubin is
also able to prevent proteins of being oxidatively damaged by different types of
reactive oxygen and nitrogen species (RONS) [STOCKER, 2004]. 40% of the
human albumin is located in the blood circulation, whereas the remaining 60%
is present in the extracellular space. Thus, the antioxidant potential of albumin-
bound bilirubin is not restricted to the plasma [BRODERSEN and STERN,
1980]. Further research revealed that albumin was present in inflammatory

Literature survey
22
exudates after leaving the blood circulation. This implies a higher possibility for
antioxidant activity at sites of elevated occurrence of RONS by phagocytic
cells [STOCKER, 2004].
Further research suggests that bile pigments possess antioxidant properties
towards lipid oxidation. In 1995, Hulea et al. studied the antioxidant effects of
free and albumin-bound bilirubin at concentrations found in blood plasma.
These two compounds were tested for their potency to inhibit the metal-
catalyzed oxidation of low density lipoprotein (LDL). Several markers were
used for determining LDL peroxidation (decreased reactivity of thiobarbituric
acid, electrophoretic mobility changes, fewer apo B fragmentations, reduced
quantity of cholesterol oxidation products). It was shown that the albumin-
bilirubin complex suppressed the metal-catalyzed oxidation of LDL in a dose
depent manner. In conclusion, bilirubin protected against oxidation of lipid
membranes in vitro. Interestingly, the inhibition in the LDL-iron-BR system
(54% inhibition) was more effective than in the copper-catalyzed reaction (30%
inhibition). This could be due to the fact that bilirubin and copper can form an
unstable complex [HULEA et al., 1995].
The antioxidant activity of urobilinoids was first described in 1996 by
Nakamura et al. who showed that these reductive bilirubin metabolites have
an antioxidant function. Urobilinoids had not been used previously to
investigate their antioxidant potential and their specific function.
Nakamura et al. prepared a synthetic urobilinogen for the experiment which
was defined as i-urobilinogen. The synthesis of the metabolite was based on
the reduction of commercial bilirubin. NMR analysis and mass spectroscopy
were used for structural conformation [NAKAMURA et al., 2006].

Literature survey
23
Figure 5: Metabolism and structures of fecal pigmen ts in mammals [NAKAMURA et al., 2006]
The aim of the previously mentioned study was to explore the radical
scavenging potential of urobilinogen compared with other antioxidants
(bilirubin, α-tocopherol and β-carotene). The radical DPPH (1,1-diphenyl-2-
picrylhydradyl) was used to evaluate antioxidant potential. Furthermore a
“challenge test” was incorporated into the study to investigate the effects of
urobilinogen on the formation of linolate hydroperoxide by AMVN (2,2-azobis
(2,4-dimethylvaleronitrile)). Generally speaking, antioxidant potential is
essential to inhibit the formation of linolate hydroperoxide. In order to explore
the effects on the formation, HPLC was used. The DPPH radical trapping
effects of the antioxidants were established by a UV/VIS spectrophotometer at
Literature survey
24
517nm absorption. In order to determine the radical scavenging activity, each
antioxidant sample was compared to the absorbance of a blank test. It was
shown that urobilinogen was the most potent among the other antioxidants.
The bilirubin metabolite decreased the absorption by 79% of the control,
whereas α-tocopherol and β-carotene showed a 35 and 29.1% reduction in
absorption, respectively. The DPPH radical scavenging activity of bilirubin
amounted 72% of the control. A similarly positive effect of urobilinogen was
obtained in the “challenge test”. In the presence of urobilinogen, the formation
of linolate hydroperoxide was inhibited by 50%. The authors concluded that
urobilinogen was able to inhibit lipid oxidation induced by free radicals
[NAKAMURA, 2006].
5.3.2.2 Antimutagenic activity of bile pigments
A number of studies have been published to elucidate the antimutagenic
potential of bile pigments. Most of the studies have used the Ames Salmonella
test for their experiments which is a suitable test system for exploring the
antimutagenic activity of different compounds. This section includes important
findings for bilirubin, biliverdin and related pyrrole pigments in this field and the
major differences are summarized in Table 2.
In 1980, researchers studied the antimutagenic effects of bilirubin, biliverdin,
hemin and chlorophyllin against benzo[α]pyrene (B[α]P) in the Ames
Salmonella test. B[α]P is characterized as a polycyclic aromatic hydrocarbon
which is often used in the Ames test. The assays were performed in the
presence of metabolic activation with the Salmonella typhimurium strain TA98.
It was established that all compounds inhibited the B[α]P induced
mutagenicity. Hemin showed the greatest antimutagenic effect, followed by
chlorophyllin, bilirubin and biliverdin [ARIMOTO et al., 1980].

Literature survey
25
This fact was confirmed in 1995 by Arimoto et al. who reported the
antimutagenic properties of hemin, chlorophyllin, bilirubin, biliverdin,
protoporphyrin, Fe- and Cu-chlorins in the Ames Salmonella test. These
compounds were investigated for their potential to inhibit the mutagenicity of
B[α]P and the metabolites benzo[α]pyrene-7,8-diol, benzo[α]pyrene-4,5-
epoxide and benzo[α]pyrene-7,8-diol-9,10-epoxide. The tests were carried out
with and without metabolic activation in the presence of the Salmonella
typhimurium strain TA100. All assays were performed with a preincubation
time of 30min. The authors reported that bilirubin and biliverdin inhibited the
mutagenicity of B[α]P with and without metabolic activation. In contrast, the
bile pigments provided only slightly antimutagenic properties against B[α]P4,5-
epoxide and B[α]P-7,8-diol-9,10-epoxide and benzo[α]pyrene-7,8-diol. Hemin
was most effective against the mutagenicity of all mutagens. It was also shown
that hemin and Fe-chlorin inhibited the enzymatic formation of 3-OH-B[α]P. A
similar effect was not observed for the bile pigments. In order to investigate
the mechanism of the effective inhibition of the 3-OH-B[α]P formation the
compounds were incubated with benzo[α]pyrene-7,8-diol-9,10-epoxide. The
different stabilities on the B[α]P metabolites were monitored with a
spectrophotometer. A degradation of benzo[α]pyrene-7,8-diol-9,10-epoxide
was observed with hemin and Cu-chlorin, whereas bilirubin and biliverdin
showed no effects.
To conclude, these two studies have shown that bile pigments inhibited the
B[α]P induced mutagenicity in the Ames Salmonella test. Bilirubin and
biliverdin were not effective in speeding up the degradation of B[α]P
metabolism [ARIMOTO et al., 1980, ARIMOTO et al., 1995].
Tang and Edenharder investigated whether porphyrins including hemin,
chlorophyllin, chlorophyll, biliverdin and bilirubin could inhibit the mutagenic
effects of 2-nitrofluorene (2-NF), 3-nitrofluoranthene (3-NFA) and 1-
nitropyrene (1-NP). These mutagens are tetracyclic (3-NFA, 1-NP) and tricyclic
(2-NF) nitroarenes. Additionally, vitamins and fruit juices were tested for their
Literature survey
26
antimutagenic potential. The antimutagenic effects of these compounds have
been tested in the Salmonella typhimurium strain TA98. All Ames assays were
performed without metabolic activation. It was shown that all tested
compounds had antimutagenic effects against the three tested mutagens.
Hemin and bilirubin were the most potent antimutagens, whereas biliverdin
and chlorophyllin showed less antimutagenic potential [TANG and
EDENHARDER, 1997].
In 2007, Bulmer and colleagues studied the antimutagenic and antioxidant
effects of bile pigments in the Ames Salmonella test. Unconjugated bilirubin,
biliverdin and bilirubin ditaurate (a synthetic, water soluble conjugate) were
tested in six different concentrations with three Salmonella typhimurium tester
strains (TA98, TA100 and TA102). The bile pigments were studied for their
potential to inhibit the mutagenicity of various mutagens including
benzo[α]pyrene (B[α]P), trinitrofluorenone (TNFone), 2-aminofluorene (2-AF),
sodium azide (NaN3) and tertiary-butyl hydroxyperoxide (t-BuOOH). The
assays were performed with (B[α]P, 2-AF and t-BuOOH) and without
metabolic activation. The assays with TNFone, NaN3 and t-BuOOH were
conducted without S9. It was shown that unconjugated bilirubin, biliverdin and
bilirubin ditaurate were antimutagenic and antioxidative against all mutagens,
except for NaN3. In this study, the Salmonella tester strain TA102 was used for
the first time to investigate the antimutagenic and antioxidant effects of bile
pigments. It was shown that bilirubin, biliverdin and bilirubin ditaurate were
able to inhibit the genotoxic effects of t-BuOOH induced oxidative stress
[BULMER et al., 2007].

Literature survey
27
Author Salmonella strain Comp ounds Mutagen Meta bolic activation Results, Discussion
Arimoto et al.
1980
TA98
hemin, chlorophyllin
BR [0-1,6µmol/plate]
BV [0-0,75µmol/plate]
B[α]P
with metabolic activation
Effects of compounds against B[α]P: hemin>BR>chlorophyllin>BV
ID50 (BR/BV/hemin): 0.05/0.5/0.01µmol
Arimoto et al.
1995
TA100
hemin, chlorophyllin, protoporphyrin, BR, BV, Cu-chlorin, Fe-chlorin
B[α]P, B[α]P(7,8)D, B[α]P(4,5)E, B[α]P(7,8)D(9,10)E
B[α]P, 2-AF, t-BuOOH (with S9)
TNFone, NaN3, t-BuOOH (without S9)
with and without S9
Effects of compounds against B[α]P: hemin=protoporphyrin>hematoporphyrin= Cu-chlorin> Fe-chlorin≥chlorophyllin>BR>BV
Effects of compounds against B[α]P(4,5)E: hemin>chlorophyllin>protoporphyrin> hematoporphyrin>BR=BV
BR and BV inhibited the mutagenic effects of B[α]P with/without S9.
They do not speed up the reduction of B[α]P metabolites.

Literature survey
28
Tang and Edenharder
1997
TA98
hemin, chlorophyllin, chlorophyll
BR [7µmol/plate]
BV[1µmol/plate]
2-NF, 3-NFA, 1-NP
without S9
Effects of compounds against all three mutagens: BR>BV
ID50 for 2-NF (BR/BV/hemin): 0.05/0.39/0.04µmol
ID50 for 1-NP (BR/BV/hemin): 0.04/0.7/0.02µmol
ID50 for 3-NF (BR/BV/hemin): 0.04/0.11/0.05µmol
Bulmer et al.
2007
TA98, TA100, TA102
BR, BV, BRT [0-2µmol]
B[α]P, TNFone, 2-AF, NaN3, t-BuOOH
B[α]P, 2-AF, t-BuOOH (with S9)
TNFone, NaN3, t-BuOOH (without S9)
Antimutagenic effects of bile pigments against all mutagens, except NaN3.
BR≥BRT>BV (TNFone)
BV≥BRT≥BR (2-AF)
BV>BRT>BR (B[α]P)
BR≥BV>BRT (t-BuOOH)
ID50 (BR/BV/BRT): 0,557/1/2,756µmol
Table 2: The antimutagenic potential of bile pigments and related pyrrole pigments in the Ames test [modified: BULMER et al., 2008]

Literature survey
29
5.3.2.3 Other postulated effects of bile pigments
As previously mentioned, the enzyme heme oxygenase-1 catalyzes the
degradation of heme to biliverdin, carbon monoxide and iron and subsequently
to bilirubin by biliverdin reductase. A number of studies have shown that this
enzyme is able to prevent oxidative stress by decreasing the amount of ROS
(reactive oxygen species). These studies established, amongst other findings,
that heme oxygenase-1 is highly overproduced in atherosclerotic lesions in
humans [WANG et al., 1998]. Further research revealed that heme oxygenase-
1 is an important protective factor which is lowly expressed in vascular diseases
and cancer [EXNER et al., 2004].
As mentioned above, bilirubin has strong antioxidant and antimutagenic
properties in vitro. This fact was confirmed and supported by several clinical
observations. An increased body of evidence confirms that bilirubin acts as
protective factor in several diseases including atherosclerosis, cancer,
inflammatory and autoimmune disorders [VITEK and SCHWERTNER, 2007].
In 2001, the link between serum bilirubin concentrations and the mortality of
cardiovascular diseases and cancer was a study background by Temme et al.
The risk of cancer mortality was divided into three groups, total cancer, lung and
non-lung cancer. Additionally, total mortality was examined. The 10-year follow-
up mortality data of approximately 10.000 subjects were provided from the
Belgium Inter-university Research on Nutrition and Health study. The
representative sample of the Belgian population included 5450 men and 4843
women. Serum bilirubin concentrations of men and women were classified into
five groups (≤ 0.2, 0.3, 0.4, 0.5, ≥ 0.6 mg/dl) and four groups (≤ 0.2, 0.3, 0.4, ≥
0.5 mg/dl), respectively. In order to reduce the number of confounders, some
variables were adjusted (age, smoking status, body mass index, total
cholesterol concentrations). Temme et al. reported that men in the highest
range (≥ 0.6mg/dl) of serum bilirubin concentrations had a 27% lower total
mortality risk compared with men in the lowest range (≤ 0.2mg/dl). Furthermore,
men in the fifth group showed a significantly lower risk (58%) for total cancer

Literature survey
30
compared with men in the first group. Data observed for non-lung cancer were
significant. The association between serum bilirubin concentration and mortality
was not shown for cardiovascular diseases. Women in the highest range (≥
0.5mg/dl) of serum bilirubin concentrations showed a 24% lower risk for total
cancer compared with women in the lowest range (≤ 0.2mg/dl). However, this
observation was not significant. Furthermore, inverse associations for total
mortality and cardiovascular diseases were not established in women. A p-
value of 0.05 was considered as significant [TIMME et al., 2001].
Serum bilirubin [mg/dl]
≤ 0.2 ≥ 0.6
p-value
No. of men 740 1190
Total mortality
Deaths/1000 person-years 19.2 10.6
No adjustment 1.00 0.55 (0.43-0.70) 0.0001
adjusted 1.00 0.73 (0.57-0.94) 0.0960
Cardiovascular diseases
Deaths/1000 person-years 6.0 4.6
No adjustment 1.00 0.78 (0.52-1.2) 0.4306
adjusted 1.00 1.02 (0.68-1.5) 0.3667
Total cancer
Deaths/1000 person-years 7.6 2.4
No adjustment 1.00 0.31 (0.20-0.49) 0.0001
adjusted 1.00 0.42 (0.26-0.68) 0.0040
Table 3: Associ ation between mortality risk and highest and lowest serum bilirubin concentration in men (relative risk a nd confidence interval) [modified: TEMME et al., 2001]
Literature survey
31
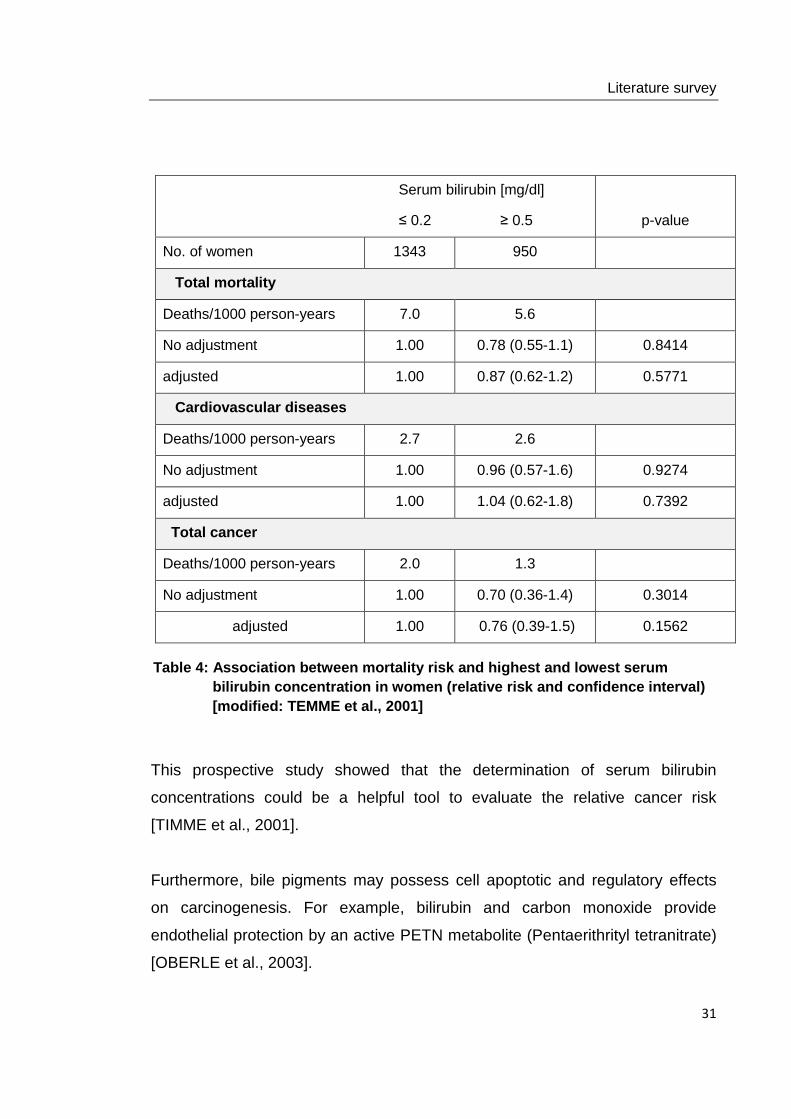
This prospective study showed that the determination of serum bilirubin
concentrations could be a helpful tool to evaluate the relative cancer risk
[TIMME et al., 2001].
Furthermore, bile pigments may possess cell apoptotic and regulatory effects
on carcinogenesis. For example, bilirubin and carbon monoxide provide
endothelial protection by an active PETN metabolite (Pentaerithrityl tetranitrate)
[OBERLE et al., 2003].
Serum bilirubin [mg/dl]
≤ 0.2 ≥ 0.5
p-value
No. of women 1343 950
Total mortality
Deaths/1000 person-years 7.0 5.6
No adjustment 1.00 0.78 (0.55-1.1) 0.8414
adjusted 1.00 0.87 (0.62-1.2) 0.5771
Cardiovascular diseases
Deaths/1000 person-years 2.7 2.6
No adjustment 1.00 0.96 (0.57-1.6) 0.9274
adjusted 1.00 1.04 (0.62-1.8) 0.7392
Total cancer
Deaths/1000 person-years 2.0 1.3
No adjustment 1.00 0.70 (0.36-1.4) 0.3014
adjusted 1.00 0.76 (0.39-1.5) 0.1562
Table 4: Association between mortality risk and hig hest and lowest serum bilirubin concentration in women (relative risk and confidence interval) [modified: TEMME et al., 2001]

Literature survey
32
Further research has demonstrated that bile pigments might possess antiviral
properties. 15 different compounds were tested for their potential to inhibit HIV-
1 protease activity. Additionally, their effects in HIV-1 viral maturation were
examined. Of these 15 compounds, only bilirubin, biliverdin, secalonic acid D
and alphazurin suppressed human and simian immunodeficiency virus protease
activity by blocking viral entry into HeLaT4 target cells. Furthermore it was
shown that stercobilin, urobilin, biliverdin dimethylester and xanthobilirubic acid
have similar antiviral properties under the same conditions. However, results of
cell culture experiments provided no inhibition of HIV-1 viral maturation by these
compounds. The results of this study suggest that increased bile pigment
concentrations may affect the course of HIV infections [McPHEE et al., 1996].
Materials and Methods
33
6 MATERIALS AND METHODS
6.1 General principles of the Ames test
The Ames Salmonella test is defined as a short-term bacterial reverse mutation
assay which is a popular and frequently used test system for the detection of
chemicals and drugs that can induce mutations [MORTELMANS and ZEIGER,
2000]. This assay was used to investigate the possible antimutagenic and
antioxidant effects of stercobilin and urobilin. Furthermore, mutagenicity assays
were performed with both bile pigments. In principle the test procedure followed
the standard plate incorporation assay which had been established by Bruce
Ames in 1973 [MARON and AMES, 1973].
6.2 Solutions used for the assay procedure
6.2.1 Ampicillin solution
0.2mg Ampicillin was solubilised in 25ml of 0.2N sodiumhydroxide. After mixing
the solution was strained through an aseptic filter. This antibiotic solution could
be stored at 4°C for four weeks.
6.2.2 Tetracycline solution
80mg of tetracycline was solubilised in 10ml of 0.2N hydrochloric acid. After
mixing the solution was aseptically filtered. This antibiotic solution could be
stored at 4°C for two weeks.

Materials and Methods
34
6.2.3 Glucose solution (40%)
For a 40% solution 400g of glucose was dissolved in 1000ml of boiling
deionised water. The prepared solution was autoclaved each time before use.
6.2.4 Glucose-6-phosphate solution (304mg/ml)
1g of glucose-6-phosphate was dissolved in 3.289ml of deionised water. Finally
the solution was sterilised through an aseptic filter. Portions of 1ml each were
stored at -20°C.
6.2.5 Histidine-biotin solution
30.9mg D-biotin and 24mg L-histidine were weighed into two separate weighing
boats. After transferring the amino acids into a 250ml Pyrex flask, 250ml of
deionised water were added. The solution was sterilised each time before use
and was stored at 4°C.
6.2.6 Histidine solution
0.25g of histidine was dissolved in 50ml of deionised water. Finally the solution
was aseptically filtered and stored at 4°C.
6.2.7 Biotin solution
6.1mg of D-biotin was mixed with 50ml of deionised water. The prepared
solution was strained through an aseptic filter and stored at 4°C.

Materials and Methods
35
6.2.8 Overnight culture
5g of Nutrient Broth No.2 are weighed into a Pyrex flask and filled up to 200ml
with deionised water. After shaking the solution was autoclaved and as soon as
the nutrient broth was cooled down strain specific antibiotics were added. For
strain TA98 625µl ampicillin solution are used, whereas TA102 additionally
needed 156µl tetracycline solution. Thereof,
12ml each were transferred into two sterile
250ml Erlenmeyer flasks. One bacterial colony
(either TA98 or TA102) was taken with an
inoculation loop from a master plate and was
added to the flask. After whirling the flasks were
recapped with a dabber and aluminium film and
were shaken in a 37°C incubator for 12 hours at
55rpm.
6.2.9 Master plates
For the preparation of two master plates, 3.2g of Oxoid agar were made up with
200ml of deionised water in Pyrex flasks. Afterwards the prepared solution was
autoclaved. Next 4.3ml of vogel-bonner- and 10.8ml of glucose solution were
added. After shaking the flasks 2.17ml of histidine- and 1.3ml of biotin solution
were added. After the agar was cooled down strain specific antibiotics were
added:
Salmonella strain Antibiotics
TA98 625µl of ampicillin
TA102 625µl of ampicillin
156µl of tetracycline
Table 5: Strain specific antibiotics for preparatio n of the master plates
Figure 6: OVNC incubated for 12 hours at 37°C

Materials and Methods
36
After the antibiotics were added the agar was poured into sterile Petri dishes,
the thickness of the agar amounted to approximately 1cm. The prepared master
plates were left under sterile conditions to dehumidify for 24 hours. After drying
the requested bacteria strain was taken with an inoculation loop from the
overnight culture and was applied on the plates lattice-like. The master plates
were incubated for 48 hours at 37°C and sealed with a tape after that. Once the
master plates had been inoculated they could be kept for 2 weeks (TA102) or
for two months (TA98), respectively at 4°C.
6.2.10 MgCl 2/KCl solution
61.5g of KCl and 40.7g of MgCl2 were dissolved in 500ml of deionised water.
The solution was sterilised trough an aseptic filter and stored at 4°C.
6.2.11 Minimal glucose agar plates
For preparation of approximately 320 minimal glucose agar plates eight 1000ml
Erlenmeyer flasks were needed. Into each flask 11.25g of Oxoid agar are
weighed and filled up to 700ml with deionised water. The flasks were recapped
with a dabber and aluminium film, and sterilised in the autoclave together with
glucose- and vogel-bonner solutions. After about 2 hours the flasks were ready
to be transferred under the laminar flow. To each of the flasks 15ml of vogel-
bonner solution and 37.5ml of glucose-solution were added under sterile
conditions. After shaking the warm agar was poured into Petri dishes. The
poured plates were dried for about 24 hours. The next day they were packed in
plastic bags and stored at 4°C. The storage time wa s 14 days.

Materials and Methods
37
6.2.12 NADP solution
A 0.135g/2ml solution was produced. 1g of NADP was dissolved in 14.814ml of
deionised water. The solution was sterilised through an aseptic filter and frozen
in portions of 1ml at -20°C.
6.2.13 S9-Mix
The use of a rat-liver S9 metabolic activation system was necessary because
bacteria do not have a cytochrome-based P450 metabolic oxidation system.
The solution was always prepared fresh and kept on ice throughout the test. For
a maximum of 100 plates 19.75ml of deionised water, 25ml of PBS buffer
(without Ca and Mg), 1ml of MgCl2, 2ml of NADP solution and 250µl of glucose-
6-phosphate-solution were pipetted into a sterile 50ml centrifuge tube. At last, 2
ml of the rat liver homogenate were added. The S9-Mix had to be cooled on ice
constantly during the test, because the solution contains highly susceptible
enzymes which are highly susceptible to oxidation. The cooled solution had to
be used within one hour.
6.2.14 Top agar
1.2g of Oxoid agar and 1g of sodium chloride were dissolved in 200ml of
deionised water and autoclaved just before each test. Before use, 20ml of the
histidine-biotin solution are added. The top agar had to be kept in a water bath
at 55°C throughout the test.
6.2.15 Vogel-Bonner solution
10g of magnesium sulphate heptahydrate, 100g of citric acid monohydrate,
500g of dibasic potassium phosphate and 175g of sodium ammonium

Materials and Methods
38
phosphate tetrahydrate were dissolved in 670ml of deionised water (45°C). The
solution was autoclaved each time before use.
Substance Abbreviation/ Source Order No. Utilisation empirical formul a
2-Amino-1-methyl-6- PhiP Toronto Research A617000 Positive control phenylimidazo[4,5,-b] Chemicals pyridine
Aflatoxin B1 AFB1 Sigma A6636 Positive control
Agar No I Oxoid/ LP011P Plates, Top agar
Ampicillin Trihydrate Sigma A6140 MP, OVNC
D-Biotin C10H16N2O3S Sigma B4639 MP
Dimethylsulfoxide DMSO Sigma D5879 solvent, negative control
D-Glucose C6H12O6 Sigma G8270 GM agar plates,
Glucose-6-Phosphat Glu-6-P Sigma G7250 S9-Mix
Potassium chloride KCl Sigma P5405 S9-Mix
Potassium phosphate dibasic K2HPO4 Sigma P3786 Vogel-Bonner-
solution
L-Histidine C6H9N3O2 Sigma H8125 Top Agar, MP

Materials and Methods
39
Magnesium chloride MgCl2 · 6H2O Sigma M9272 S9-Mix
Magnesium sulfate MgSO4 · H2O Sigma M9397 Vogel-Bonner-solution
Nutrient Broth Oxoid/Bertoni CM067B OVNC
Sodium ammonium phosphate
Na2NH2PO4 ·
4H2O Sigma S9638 Vogel-Bonner-solution
Sodium chloride NaCl Sigma S5886 Top Agar
Sodium hydroxide NaOH Sigma O6203 Ampicillin-solution
Nicotinamide adenine dinucleotide NADP Sigma N0505 S9-Mix
Dulbecco´s phosphate buffered saline
PBS PAA Laboratories H15002 Preincubation,
S9-Mix
Rat liver homogenate S9 Biomedica/ICN 50412 Plate incorporation test with S9-Mix
Tertiary-Butyl-hydroxyperoxide t-BuOOH Sigma B2633 Oxidative
mutagen
Tetracycline hydrochloride Sigma T3383 MP, OVNC
2,4,7-Trinitro-9-fluorenone TNFone Positive control
Citric acid monohydrate C6H8O7 · H2O Sigma C1909 Vogel-Bonner-
solution
Table 6: Chemicals and reagents used within the tes t procedure

Materials and Methods
40
6.3 Experimental design
Experiments in the bacterial system were designed to explore the potential
antimutagenic and antioxidant effects of stercobilin (0.01-2µmol/plate) and
urobilin (0.01-2µmol/plate and 0.0001-2µmol/plate) in the Ames Salmonella test.
6.3.1 Chemicals and reagents
The bile pigments, stercobilin hydrochloride (S) [34217-90-8] and urobilin
hydrochloride (U) [28925-89-5], were purchased from Frontier Scientific. In
order to protect bile pigments from light and avoid possible oxidative events, the
highly sensitive compounds were sealed with some adhesive tape
(see Figure 7). The S9 liver homogenate was obtained
from MP Biomedicals (Illkirch, France).
All chemicals and reagents were stored at -80°C if
necessary. All solutions, glass ware, tubes, pipettes, etc.
had to be sterile to ensure a contamination free test
system. The whole equipment was sterilised in an
autoclave.
6.3.2 Bacterial strains
The antimutagenic and antioxidant effects of stercobilin and urobilin were tested
in the presence of two bacterial strains, TA98 and TA102. It is very important to
use different Salmonella typhimurium tester strains. Since specific mutations
within the strains make them more sensitive to respond on different mutagens.
Mutations of the TA102 can be reverted by mutagens that cause oxidative
damage. The TA102 strain detects cross-linking agents and the TA98 strain
gives information on frame-shift mutations. Because of that various tester
strains are essential for the experimental procedure [MARON and AMES 1983].
Figure 7: Urobilin hydrochloride

Materials and Methods
41
6.3.3 Positive control chemicals
In order to ensure the reversion properties, the specificity of each tester and the
activity of the S9-mix, diagnostic mutagens (positive control chemicals) were
used in each Ames assay [MORTELMANS and ZEIGER, 2000].
All tests included three positive control tubes (mutagen only). Therefore a
variety of mutagens including 2, 4, 7-trinitrofluorenone (TNFone), 2-amino-1-
methyl-6-phenylimidazo [4, 5,-b] pyridine (PhiP) and aflatoxin B1 (AFB1) were
used to confirm the formation of mutant revertants. Furthermore the prooxidans
tertiary-butyl hydroxyperoxide (t-BuOOH) was used.
Tests were conducted with and without metabolic activation incorporating the
addition of the microsomal liver homogenate. The solutions of TNFone, PhiP
and AFB1 were dissolved in DMSO. The t-BuOOH solution was dissolved in
deionised water.
TNFone is a non-planar polycyclic nitro-amine and was previously found in
certain photocopy processes. In the Ames Salmonella test TNFone turned out
to be mutagenic with and without metabolic activation. A number of oral feeding
studies in animals have been carried out in the past showing that TNFone
caused different lesions including black discoloration of the skin and hair, dark
brain and gallbladder, lymphoid depletion and seminal vesicle atrophy in rats
and mice [KARI, 1992].
Figure 8: Three -dimensional structure of TNFone [BULMER et al ., 2007]
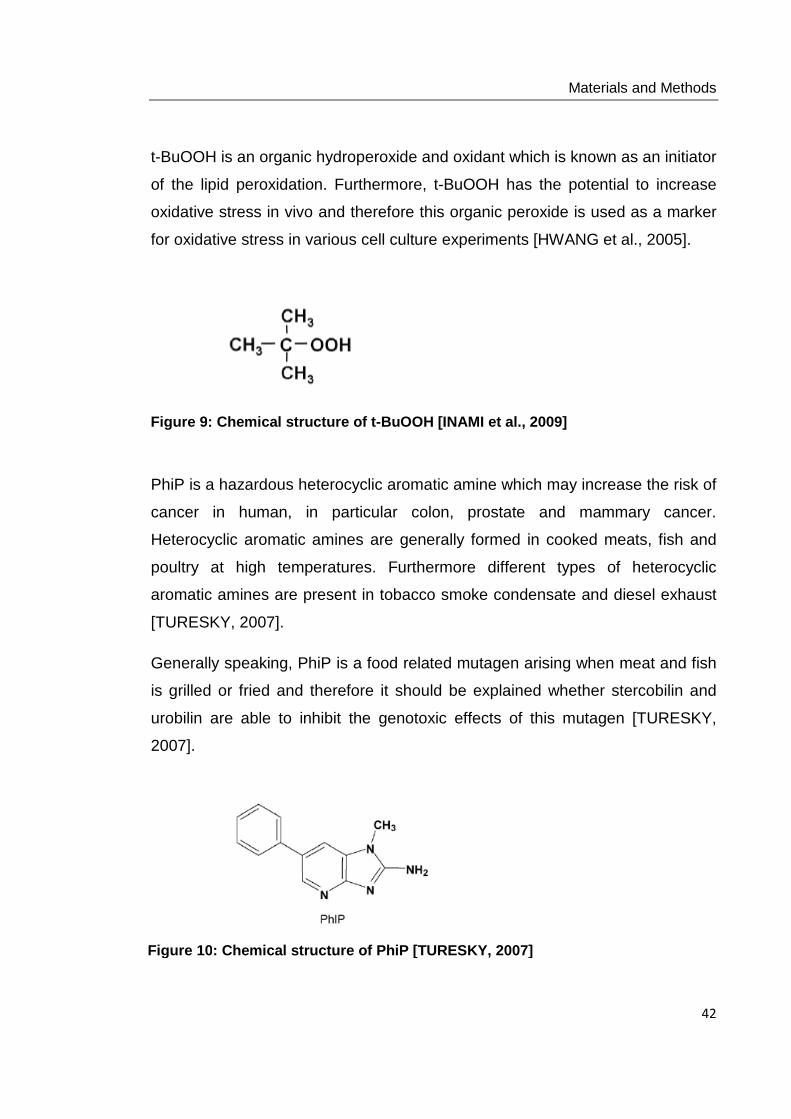
Materials and Methods
42
t-BuOOH is an organic hydroperoxide and oxidant which is known as an initiator
of the lipid peroxidation. Furthermore, t-BuOOH has the potential to increase
oxidative stress in vivo and therefore this organic peroxide is used as a marker
for oxidative stress in various cell culture experiments [HWANG et al., 2005].
PhiP is a hazardous heterocyclic aromatic amine which may increase the risk of
cancer in human, in particular colon, prostate and mammary cancer.
Heterocyclic aromatic amines are generally formed in cooked meats, fish and
poultry at high temperatures. Furthermore different types of heterocyclic
aromatic amines are present in tobacco smoke condensate and diesel exhaust
[TURESKY, 2007].
Generally speaking, PhiP is a food related mutagen arising when meat and fish
is grilled or fried and therefore it should be explained whether stercobilin and
urobilin are able to inhibit the genotoxic effects of this mutagen [TURESKY,
2007].
Figure 10: Chemical structure of PhiP [TURESKY, 2007]
Figure 9: Chemical structure of t-BuOOH [INAMI et al., 2009]

Materials and Methods
43
Aflatoxins belong to the substance class of mycotoxins which are mainly
produced as secondary metabolites by Aspergillus flavus and Aspergillus
parasiticus. These compounds are toxic, mutagenic and carcinogenic. Different
types of aflatoxins with various potency and carcinogenicity are known,
important members are aflatoxin B1, B2, G1 and G2. Of these, AFB1 turned out
to be the most common and toxic aflatoxin in animals and humans. The major
metabolite of AFB1 is M1 which is primarily present in milk [DIEKMAN and
GREEN, 1992]. Aflatoxins are food-related mutagens which occur
predominantly in peanuts, maize and corns [STROKA, 2000].
TNFone, PhiP and AFB1 induced genotoxicity was used to test the possible
antimutagenic effects of stercobilin and urobilin. t-BuOOH induced pro-oxidative
effects were used to investigate the possible antioxidant potential of these two
bile pigments.
without metabolic activation with metabolic activation
TA98 TNFone [0,0001mg/ml] Phip [0,1µmol/ml]
AFB1 [5µg/ml]
TA102 TNFone [0,07mg/ml] AFB1 [120µg/ml]
t-BuOOH [0,75*10-6mol/plate] t-BuOOH [0,75*10-6mol/plate]
Table 7: General overview of mutagens used in the A mes test
Figure 11: Chem ical structure of AFB1 [HAN et al., 2010]

Materials and Methods
44
6.3.4 Negative control chemicals
All tests included six negative control plates which contained DMSO. These
plates were necessary to determine the spontaneous mutant frequency of the
Salmonella typhimurium strains TA98 and TA102.
6.4 Assay procedure
Antimutagenic testing was performed to explain the possible antimutagenic
effects of stercobilin and urobilin against TNFone, PhiP and AFB1.
Antioxidant testing was carried out to investigate the possible antioxidant effects
of the two bile pigments against t-BuOOH. In order to assess the mutagenic
potential of stercobilin and urobilin, mutagenicity assays were performed for
each mutagen and each tester strain.
6.4.1 Preparation of the bile pigment samples
For each test a fresh bile pigment stock solution was prepared. Therefore 9mg
aliquots of the bile pigments were weighed out into eppendorf cups and
dissolved in 618µl of DMSO. After mixing, the cups were placed in an ultrasonic
bath for 3min to dispense the bile pigments homogenously. To elucidate the
efficacy of the inhibitory action of
stercobilin and urobilin against the
mutagenicity of various mutagens, the
Salmonella assays were performed in
the presence of varying doses of the
pigments.
Six different concentrations (2, 1, 0.5,
0.1, 0.05 and 0.01µmol/plate) of
stercobilin and eight different Figure 12: Preparation of urobilin in eight different concentrations

Materials and Methods
45
concentrations (2, 1, 0.5, 0.1, 0.05, 0.01, 0.005 and 0.001µmol/plate) of urobilin
were investigated. Only one test for urobilin was conducted with six
concentrations as it applied for stercobilin (TNFone, TA102).
The following dilution series was established:
stock solu tion [µl] DMSO [µl]
2µmol/plate 320 480
1µmol/plate 160 640
0,5µmol/plate 80 720
0,1µmol/plate 100 [1µM] 900
0,05µmol/plate 100 [0,5µM] 900
0,01µmol/plate 100 [0,1µM] 900
0,005µmol/plate 100 [0,05µM] 900
0,001µmol/plate 100 [0,01µM] 900
Table 8: Preparation of the bile pigment samples
6.4.2 Antimutagenic/Antioxidant assays
Antimutagenic and antioxidant activities of stercobilin and urobilin were tested in
a broad ranging spectrum (0.001 to 2µmol/ plate) in TA98 and TA102 whereas
bile pigments were dissolved in DMSO. Three plates were counted for every
concentration of each condition. Every assay included three positive control
tubes (mutagen only) and six negative control (no mutagen, no bile pigment)
tubes.
The test procedure consisted of adding 500µl PBS buffer or S9-mix, 100µl of
histidine dependent overnight culture bacteria, 100µl mutagen solution and

Materials and Methods
46
200µl PBS buffer in positive and negative control. Finally, 200µl bile pigment
solution were added to the test tubes.
All assays were performed with a preincubation time of 25 min at 37°C. After
that time, 2 ml of top agar containing biotin and histidin were added. Finally, the
contents of the tubes were vortexed and poured onto the surface of minimal
glucose agar plates.
As soon as the top agar had hardened
(after 20-25 min) the plates were placed
in a 37°C incubator for 48hours.
After expiration of this time the histidine
revertant colonies were counted.
The white spots were placed onto a flat lamp and counted manually. The
background lawns of the plates were examined by eye for thinning and for the
presence of precipitate [MORTELMANS and ZEIGER, 2000].
Figure 13: Poured plates drying in the incubator for 48h

Materials and Methods
47
Figure 14: Diagram depicting the steps involved in the plates incorporation assay [MORTELMANS and ZEIGER, 2000]
6.4.3 Mutagenicity assays
Mutagenicity assays were performed to demonstrate that stercobilin and urobilin
are not mutagenic. Therefore, the highest and the lowest concentration of the
bile pigments were screened (0.01 and 2µmol/plate). Every assay included
three positive control plates and six negative control plates. These tests were
conducted with and without metabolic activation.

Materials and Methods
48
In a typical mutagenicity assay the following substances were mixed in the
positive control tubes :
• 500µl of PBS buffer or S9-mix
• 100µl of histidine dependent overnight culture bacteria
• 100µl of the respective mutagenic substance
• 200µl of PBS buffer
In a typical mutagenicity assay the following substances were mixed in the
negative control tubes :
• 500µl of PBS buffer or S9-mix
• 100µl of histidine dependent overnight culture bacteria
• 100µl of DMSO
• 200µl of PBS buffer
In a typical mutagenicity assay the following substances were mixed in the
sample tubes :
• 500µl of PBS buffer or S9-mix
• 200µl of bile pigment solution

Materials and Methods
49
6.5 Statistical analysis
6.5.1 Non statistical evaluation
According to Mortelmans and Zeiger [MORTELMANS and ZEIGER, 2000] a
non-statistical procedure was used to evaluate the results of Salmonella
experiments:
• Positive:
A mutagenic compound forms a reproducible, dose dependent elevation
in the number of revertant colonies in one or more strains.
A weak mutagen compound forms a reproducible, dose dependent
elevation in the number of revertant colonies in one or more strains.
However, the revertant number is not double the background colonies
number.
• Negative:
A non-mutagenic compound forms no dose dependent elevation in the
number of revertant colonies in two independent assays.
• Inconclusive:
An inconclusive compound cannot be considered as a mutagen or a
nonmutagen (e.g., if there is a spread of slightly revertant counts or one
increased count).

Materials and Methods
50
In order to classify compounds as antimutagenic or promutagenic the following
equation was used:
No. of revertants (test compound) – No. of revertants (negative control) x 100
No. of revertants (positive control) – No. of revertants (negative control)
According to this equation, a compound was defined as ‘antimutagenic’ if the
relative mutagenic response fell below 50%. A compound was assessed to be
‘promutagenic’ if the relative mutagenic response elevated beyond 200%
[BULMER et al., 2007].
6.5.2 Statistical evaluation
In order to illustrate the collected test data graphically Microsoft Excel 2007 and
SPSS 17.0 were used. First of all, a Microsoft Excel spreadsheet was created
including all the counted revertant data to illustrate the modulatory effects of
stercobilin and urobilin in diagrams and curves (see Figures in chapter 7). In
order to determine antimutagenic/antioxidant effects of bile pigments, the
percent inhibition of revertant colonies compared to the positive control values
was evaluated. In mutagenicity assays, results were put in relation to negative
control values.
Appropriate statistical algorithms were used to illustrate each bile pigment in
each condition optimally. Therefore the R2 co-efficient was used to quantify the
strength of the correlation. This coefficient of determination as well as the linear
equation was superimposed onto the results figures.
The software SPSS 17.0 was used to analyse statistical significance of the test
data. First of all, the data were tested for normal distribution using the K-S test
of goodness of fit (Kolmogorov-Smirnov). This test showed that all data were

Materials and Methods
51
normally distributed. In order to investigate the revertant growth inhibition
differences between the bile pigment concentrations related to positive and
negative control values, the data were analysed with the one-way analysis of
variance (ANOVA) and the post hoc tests Bonferroni and Scheffe.
A p-value < 0.05 was considered significant.

Results and Discussion
52
7 RESULTS AND DISCUSSION
The statistical analysis revealed that stercobilin and urobilin show modulatory
effects towards genotoxicity of different mutagens. As mentioned before,
stercobilin and urobilin have not previously been investigated in the Ames
Salmonella test. Therefore, findings might be of high interest and importance.
The following section gives an overview on all the achieved results. Table 9
summarizes the collected data for both bile pigments.
Strain Mutagen
[mol/plate] S9 Compound
ID50
[µmol/plate]
ID75
[µmol/plate]
I0.5
[%]
Imax
[%] His+
TA98 TNFone
[0.3*10-6] -
S
U
2.98*
4.02*
5.77*
17.8*
15.8
19.3
32.3
50.6
453
362
PhiP
[0.1*10-8] +
S
U
0.29*
0.35
3.14
2.75
56.8
48.3
68.9
71.9
442
488
AFB1
[1.2*10-8] +
S
U
1.73*
-
-
0.18
43.9
76.9
13.1
78
274.5
316
TA102 TNFone
[0.2*10-7] -
S
U
3.35*
1.4
13.4*
6.08*
45.8
54.1
43.6
48
1218
1218
AFB1
[2.9*10-7] +
S
U
0.46
1.35
-
7.18*
40.8
45
-
55.7
1008
764
t-BuOOH
[0.75*10-6] -
S
U
-
7.15
-
-
2.1
25.9
-
22.8
1168
1482
t-BuOOH
[0.75*10-6] +
S
U
4.68
1.97
-
-
34.4
50.5
48.8
42.9
2312
824
Table 9: The modulatory effects of stercobilin and urobilin on genotoxicity in the TA98 and TA102 Salmonella typhimurium strains [according to BULMER et al., 2007]

Results and Discussion
53
• ID50: bile pigment dose [µmol/plate] required for 50% inhibition of the genotoxicity (positive control)
• ID75: bile pigment dose [µmol/plate] required for 75% inhibition of the genotoxicity (positive control)
• I0.5: inhibition of genotoxic effects [%] at 0.5µmol bile pigment per plate
• Imax: inhibition of genotoxic effects [%] at 2µmol bile pigment per plate
• His+: mean number in the positive control plates of one and two experiments, respectively
• * Result was extrapolated beyond the concentration range tested [BULMER et al., 2007]
7.1 Antimutagenic testing with TA98
In the presence of Salmonella typhimurium tester strain TA98 stercobilin and
urobilin were tested for their potency to inhibit the mutagenicity of TNFone, PhiP
and AFB1. Assays with TNFone were conducted without metabolic activation
whereas tests with PhiP and AFB1 were performed with S9. Almost all data
were significantly different from positive control values (p<0.05) and most of the
assays were repeated under the same conditions.
7.1.1 Mutagenicity induced by TNFone
Under this condition the tests on antimutagenic effects of stercobilin and urobilin
were performed without metabolic activation. Figure 15 illustrates that both bile
pigments inhibited the TNFone (0.0001 mg/ml) induced mutagenic response in
the strain TA98 in a dose dependent manner. Table 12-16 in the appendix
provide the single revertant numbers for positive/negative control and different
bile pigment concentrations. According to the extrapolated ID50 values,
stercobilin (2.98µmol) was more effective than urobilin (4.02µmol). The latter
compound showed a significant effect at all tested concentrations (with an
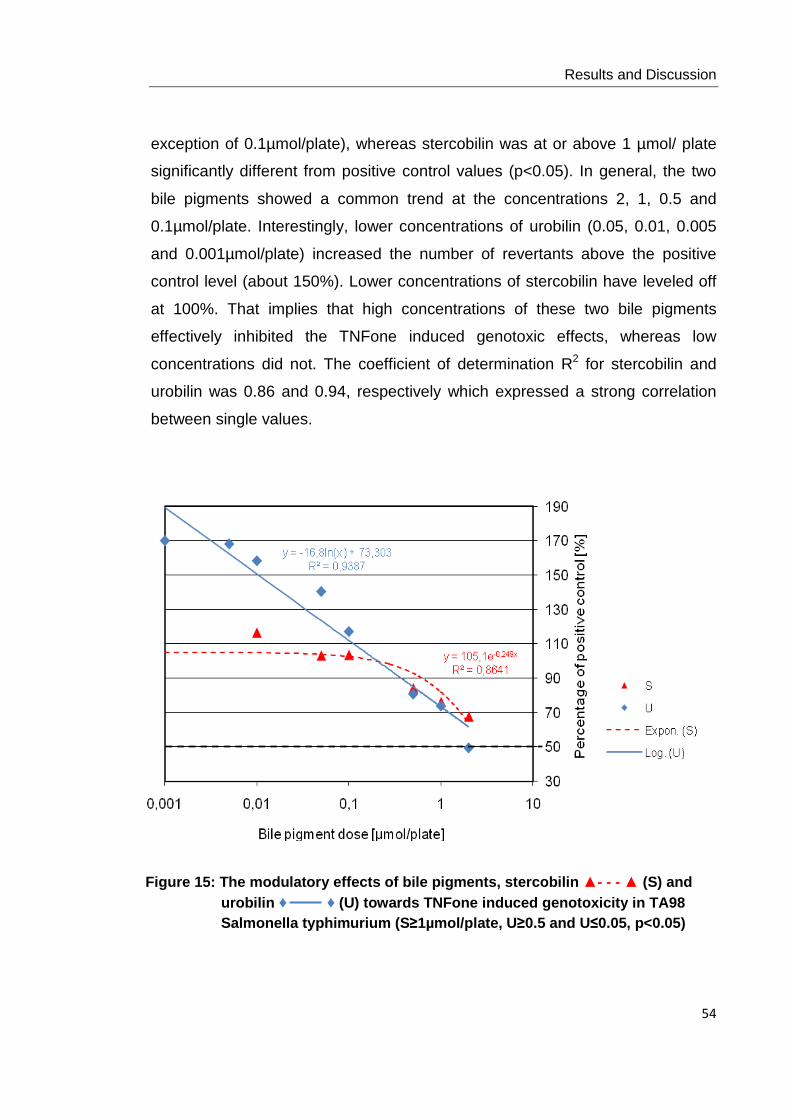
Results and Discussion
54
exception of 0.1µmol/plate), whereas stercobilin was at or above 1 µmol/ plate
significantly different from positive control values (p<0.05). In general, the two
bile pigments showed a common trend at the concentrations 2, 1, 0.5 and
0.1µmol/plate. Interestingly, lower concentrations of urobilin (0.05, 0.01, 0.005
and 0.001µmol/plate) increased the number of revertants above the positive
control level (about 150%). Lower concentrations of stercobilin have leveled off
at 100%. That implies that high concentrations of these two bile pigments
effectively inhibited the TNFone induced genotoxic effects, whereas low
concentrations did not. The coefficient of determination R2 for stercobilin and
urobilin was 0.86 and 0.94, respectively which expressed a strong correlation
between single values.
Figure 15: The modulatory effects of bile pigments, stercobi lin ▲- - - ▲ (S) and urobilin ♦ ♦ (U) towards TNFone induced genotoxicity in TA98 Salmonella typhimurium (S≥1µmol/plate, U ≥0.5 and U≤0.05, p<0.05)

Results and Discussion
55
7.1.2 Mutagenicity induced by PhiP
PhiP (0.1µmol/ml) induced mutagenicity was used to investigate the possible
antimutagenic effects of stercobilin and urobilin in the presence of metabolic
activation. Single revertant numbers, mean values and standard deviations can
be found in chapter 12, table 12-16. Figure 16 shows that the two bile pigments
suppressed the PhiP induced genotoxic effects in a dose dependent manner.
The remarkable significant antimutagenic properties of stercobilin and urobilin
against PhiP followed the same trend. Both compounds were significantly
effective at any tested concentration (p<0.05). The low ID50 of stercobilin
(0.29µmol) was similar to that of urobilin (0.35µmol). Interestingly, even low
concentrations of both bile pigments crossed the 50% line of inhibition. To sum
up, stercobilin and urobilin showed strong antimutagenic effects towards PhiP
induced genotoxicity in TA98 at any tested concentration. As mentioned above,
high R2 values (0.83 and 0.95) confirmed a strong dose dependent correlation.
Figure 16: The modulatory effects of bile pigments, stercob ilin ▲- - - ▲ (S) and urobilin ♦ ♦ (U) towards PhiP induced genotoxicity in TA98 Salmonella typhimurium (p<0.05 at all concentrations tested)

Results and Discussion
56
7.1.3 Mutagenicity induced by AFB1
In this condition, stercobilin and urobilin were tested for their antimutagenic
effects in the presence of metabolic activation. Figure 17 clearly shows that
urobilin was more effective than stercobilin. More specifically, urobilin showed
strong significantly antimutagenic effects against AFB1 (5µg/ml), even at lower
concentrations (p<0.05). A decrease in revertants was observed at higher
concentrations and vice versa. Furthermore, R2 of 0.864 pointed out a strong
correlation which ensured the results concerning antimutagenicity.
Generally speaking, stercobilin showed weak antimutagenic effects against
AFB1 characterized by an extrapolated ID50 value of 1.73µmol. Interestingly,
stercobilin showed neither a dose-relation nor a twofold reduction of revertants.
However, significant effects at any tested concentration (p<0.05), except for 2
µmol/plate (p=0.852), could be observed.
Figure 17: The modulatory effects of bile pigment s, stercobilin ▲- - - ▲ (S) and urobilin ♦ ♦ (U) towards AFB1 induced genotoxicity in TA98 Salmonella typhimurium (S≤1µmol/plate, U at all concentrations tested, p<0.05)

Results and Discussion
57
7.2 Antimutagenic and antioxidant testing with TA102
Salmonella typhimurium indicator strain TA102 was used to study the
antimutagenic and antioxidant properties of stercobilin and urobilin against the
mutagenicity of TNFone, AFB1 and t-BuOOH.
TNFone as well as t-BuOOH were tested without a metabolic activation system.
Furthermore, t-BuOOH and AFB1 were tested in the presence of S9.
Almost all data were significantly different from positive control values (p<0.05)
and most of the assays were repeated under the same test conditions.
In 2007, Bulmer et al. used the tester strain TA102 for the first time to
investigate the antimutagenic and antioxidant effects of bile pigments (bilirubin,
biliverdin, bilirubin ditaurate) in the Ames Salmonella test [BULMER et al.,
2007].
7.2.1 Mutagenicity induced by TNFone
To elucidate the efficacy of inhibitory action of stercobilin and urobilin against
the mutagenicity of TNFone (0.07mg/ml), the Salmonella assays were
performed without metabolic activation.
Both bile pigments showed a significant and dose-dependent inhibition of
TNFone induced genotoxic effects (p<0.05). The ID50 for stercobilin and urobilin
was approximately 3.35 and 1.4µmol, respectively. According to this value
urobilin was more effective than stercobilin.
In general, both compounds shared a common trend in suppressing the number
of His+ revertants compared to the positive control values (see Figure 18).
Furthermore, high concentrations of stercobilin and urobilin reduced the number
of revertants approximately by 50%.

Results and Discussion
58
7.2.2 Mutagenicity induced by AFB1
In this condition the antimutagenic effects of stercobilin and urobilin were tested
in the presence of metabolic activation. 120mg/ml AFB1 was used as mutagen.
Urobilin inhibited the AFB1 induced mutagenic response in a dose dependent
manner. All used concentrations provided strong significant antimutagenic
effects (p<0.05). In order to inhibit 50% of positive control, 1.35µmol urobilin per
plate were needed. Furthermore, a twofold reduction was achieved at the
highest concentration tested (see Figure 19).
Under these conditions, only an antimutagenic tendency could be observed for
stercobilin. More precisely, no dose-related inhibitory response could be
Figure 18: The modula tory effects of bile pigments, stercobilin ▲- - - ▲ (S) and urobilin ♦ ♦ (U) towards TNFone induced genotoxicity in TA102 Salmonella typhimurium (p<0.05 at all concentrations tested)
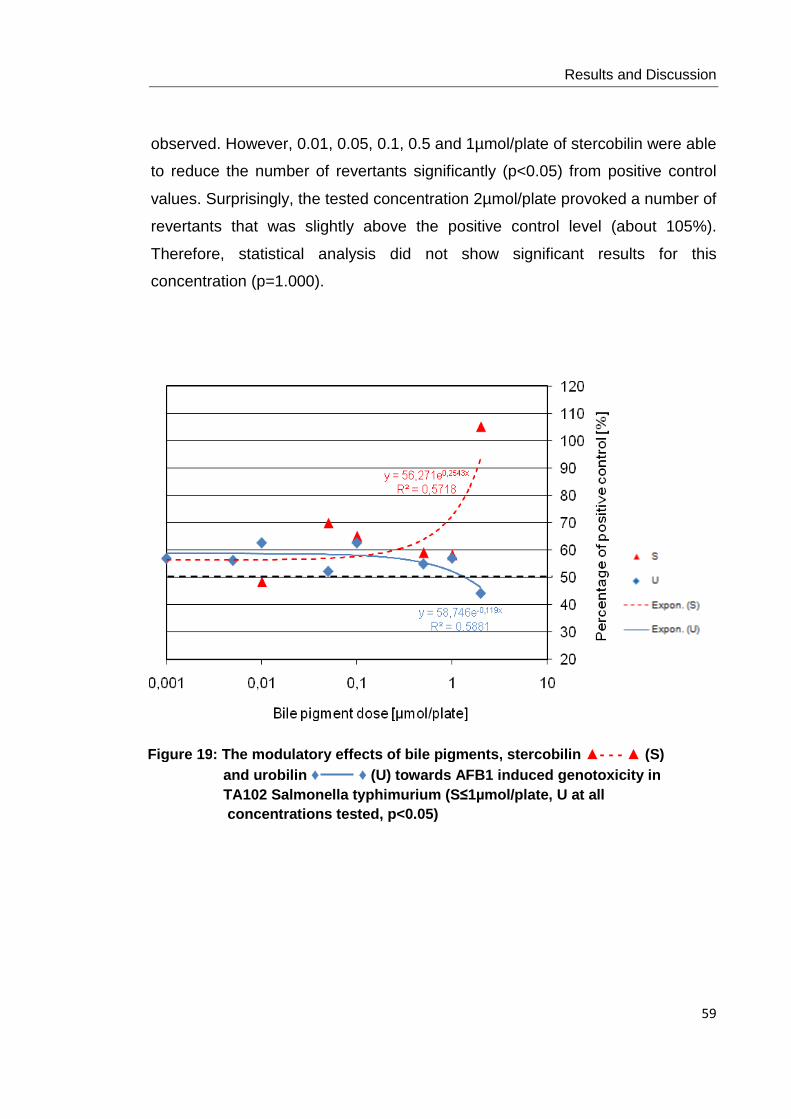
Results and Discussion
59
observed. However, 0.01, 0.05, 0.1, 0.5 and 1µmol/plate of stercobilin were able
to reduce the number of revertants significantly (p<0.05) from positive control
values. Surprisingly, the tested concentration 2µmol/plate provoked a number of
revertants that was slightly above the positive control level (about 105%).
Therefore, statistical analysis did not show significant results for this
concentration (p=1.000).
Figure 19: The modulatory effects of bile pigments, stercobi lin ▲- - - ▲ (S) and urobilin ♦ ♦ (U) towards AFB1 induced genotoxicity in TA102 Salmonella typhimurium (S≤1µmol/plate, U at all concentrations tested, p<0.05)

Results and Discussion
60
7.2.3 Mutagenicity induced by t-BuOOH without S9
t-BuOOH (0.75*10-6 mol/plate) induced genotoxicity was used to investigate the
possible antioxidant effects of stercobilin and urobilin. When metabolic
activation was absent, the bile pigments provoked an inconclusive effect that
cannot be observed as antioxidant. Stercobilin and urobilin were not able to
reduce the number of revertants in a dose dependent manner. It can be seen
from Figure 20 that urobilin was more effective than stercobilin. However, none
of the tested concentrations afforded a significant protection against t-BuOOH
induced pro-oxidative effects (p>0.05). Stercobilin caused a significant effect at
the concentrations 0.05, 0.1 and 1µmol/plate. Nevertheless, this bile pigment
did not reveal any antioxidant potential under the chosen test conditions. It is
crucial to note that these results do not imply promutagenicity of bile pigments.
In summary, these findings suggest that stercobilin and urobilin were not able to
attenuate t-BuOOH induced mutation.
Figure 20: The modulatory effects of bile pigments, s tercobilin ▲- - - ▲ (S) and urobilin ♦ ♦ (U) towards t-BuOOH induced genotoxicity in TA102 Salmonella typhimurium (S at 1, 0.1 and 0.05µmol/plate, p<0.05)
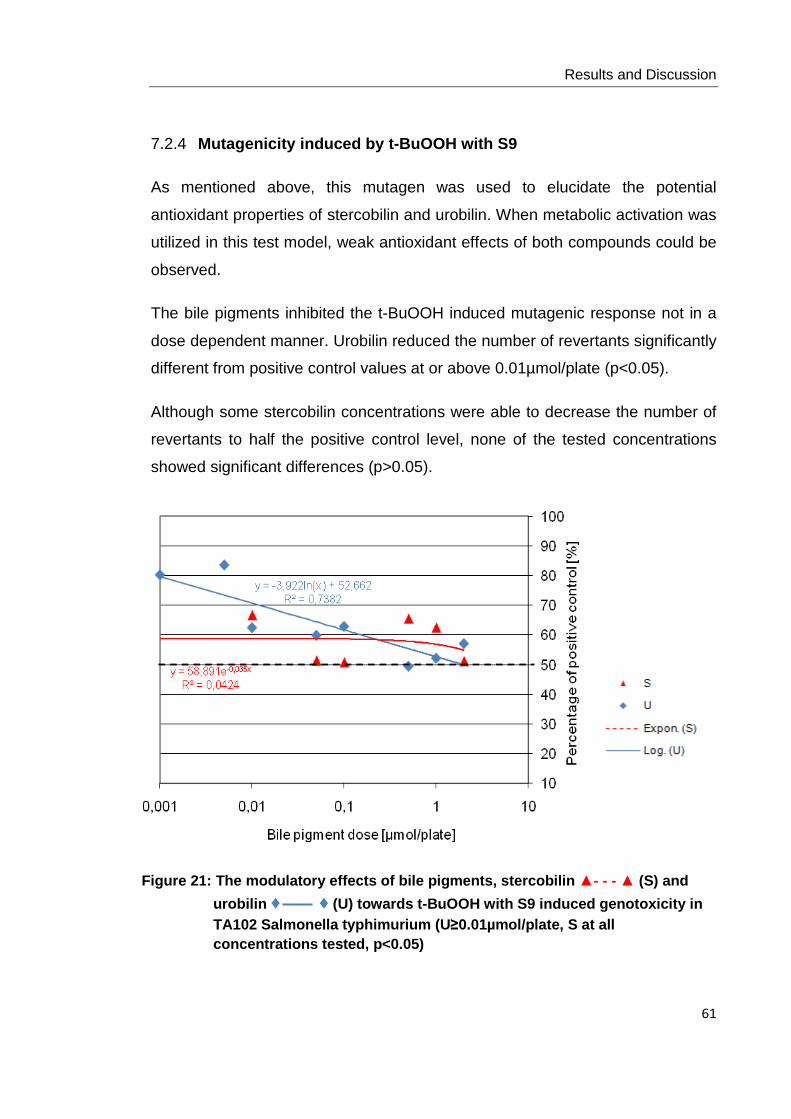
Results and Discussion
61
7.2.4 Mutagenicity induced by t-BuOOH with S9
As mentioned above, this mutagen was used to elucidate the potential
antioxidant properties of stercobilin and urobilin. When metabolic activation was
utilized in this test model, weak antioxidant effects of both compounds could be
observed.
The bile pigments inhibited the t-BuOOH induced mutagenic response not in a
dose dependent manner. Urobilin reduced the number of revertants significantly
different from positive control values at or above 0.01µmol/plate (p<0.05).
Although some stercobilin concentrations were able to decrease the number of
revertants to half the positive control level, none of the tested concentrations
showed significant differences (p>0.05).
Figure 21: The modulatory effects of bile pigments, stercobi lin ▲- - - ▲ (S) and
urobilin ♦ ♦ (U) towards t-BuOOH with S9 induced genotoxicity in TA102 Salmonella typhimurium (U≥0.01µmol/plate, S at all concentrations tested, p<0.05)

Results and Discussion
62
Numerous studies have been carried out during the past investigating the
beneficial effects of bile pigments. These studies focused predominantly on the
antimutagenic and antioxidant effects of bilirubin, biliverdin and related pyrrole
pigments including hemin and chlorophyllin. However, available data on the
beneficial effects of stercobilin and urobilin are sparse and therefore, this project
attempted to fill this gap in current research. The present study aimed to test
whether stercobilin and urobilin could selectively suppress the genotoxic effects
of specific mutagens with different conformations.
In Salmonella typhimurium strain TA98, both bile pigments were able to inhibit
the mutagenicity of TNFone, PhiP and AFB1. In the presence of this tester
strain, stercobilin was the most effective antimutagen for PhiP. Urobilin was
most active for AFB1. As mentioned earlier, tester strain TA98 is suitable for
detecting frameshift mutations [MARON and AMES, 1983].
More precisely, in the presence of 0.3*10-6 mol TNFone per plate, stercobilin
was more effective than urobilin. The bile pigment dose that inhibited
mutagenicity to 50% of the positive control was found to be approximately
3µmol for stercobilin and 4µmol for urobilin. Therefore, the inhibition potency
was in the order S>U (see Figure 15).
In a recently published study, bilirubin, biliverdin and bilirubin ditaurate were
tested for their potency to inhibit the mutagenicity of TNFone in Salmonella
typhimurium strain TA98. All three compounds suppressed this genotoxic effect
in a dose dependent manner (BR≥BRT>BV) [BULMER et al., 2007].
Taken together, these findings as well as our achieved results suggest that
stercobilin, urobilin, bilirubin, biliverdin and bilirubin ditaurate influenced the
impact of TNFone to destroy DNA structure [BULMER et al., 2008].
Concerning the PhiP results, stercobilin and urobilin showed strong
antimutagenic effects in the presence of metabolic activation. 0.1*10-8 mol of
PhiP were added to each plate. Both compounds were potent antimutagens
which reduced the number of histidine revertants dose-related and significantly

Results and Discussion
63
different from positive control (p<0.05). In Salmonella typhimurium strain TA98,
stercobilin was the most effective antimutagen for PhiP. Since there are no
published studies available dealing with the modulatory effects of bile pigments
towards PhiP induced genotoxicity, comparative results are lacking.
As previously mentioned, urobilin was the most potent antimutagen for AFB1 in
the presence of Salmonella typhimurium tester strain TA98. A remarkable ID75
of 0.18µmol as well as an Imax of approximately 80% could be observed. As
shown in Figure17, AFB1 induced genotoxicity (1.2*10-8 mol/plate) was less
strongly inhibited by stercobilin. Therefore, the order of effectiveness was U>S.
In the present study, antimutagenicity of stercobilin and urobilin towards AFB1
induced genotoxicity was tested for the first time, therefore comparative data
are missing.
In 1995, Breinholt et al. studied the antimutagenic properties of chlorophyllin
against the mutagenicity of AFB1. It was shown that this compound of
porphyrin-like structure suppressed AFB1 induced cancer in fish [BREINHOLT
et al., 1995].
TNFone PhiP AFB1
Stercobilin - ↓↓↓ -
Urobilin ↓ ↓↓ ↓↓↓
Table 10: Modulatory effects of stercobilin and u robilin in Salmonella typhimurium strain TA98
- ID50 not calculable
↓ 50% inhibition of positive control at 2µmol/plate
↓↓ 50% inhibition of positive control between 1 and 0.1µmol/plate and at 0.01 and 0.001 µmol/plate
↓↓↓ 50% inhibition of positive control at each concentration
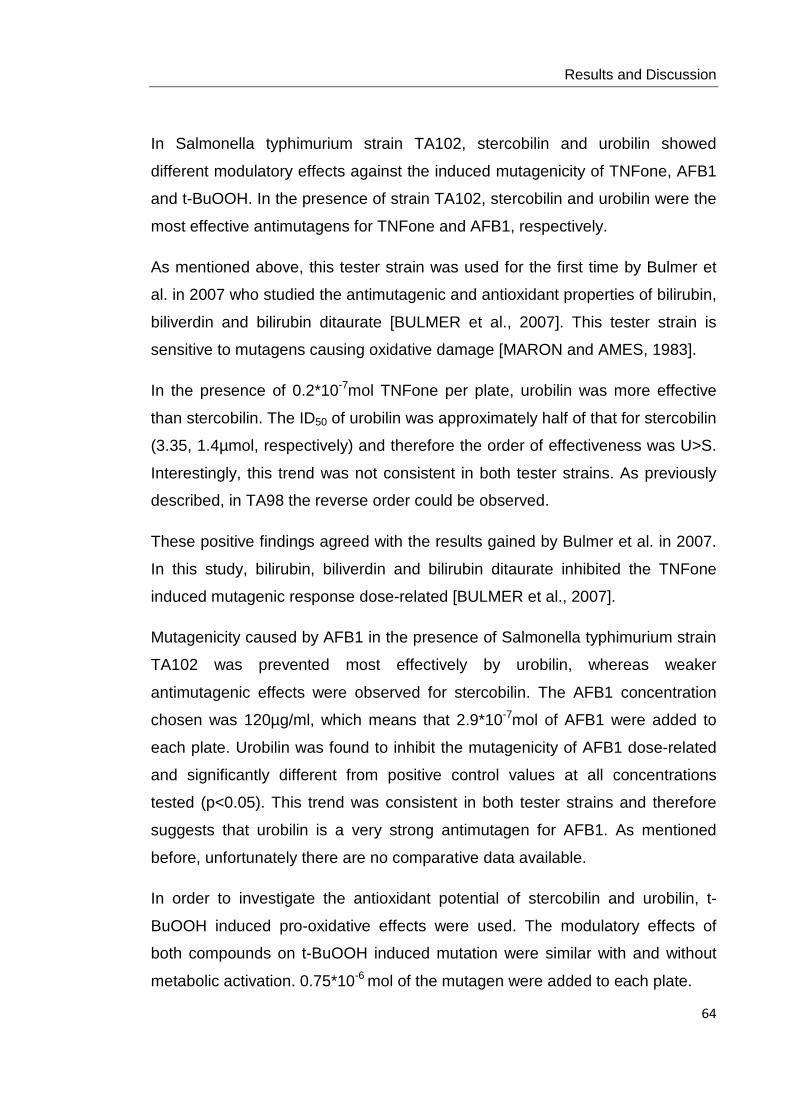
Results and Discussion
64
In Salmonella typhimurium strain TA102, stercobilin and urobilin showed
different modulatory effects against the induced mutagenicity of TNFone, AFB1
and t-BuOOH. In the presence of strain TA102, stercobilin and urobilin were the
most effective antimutagens for TNFone and AFB1, respectively.
As mentioned above, this tester strain was used for the first time by Bulmer et
al. in 2007 who studied the antimutagenic and antioxidant properties of bilirubin,
biliverdin and bilirubin ditaurate [BULMER et al., 2007]. This tester strain is
sensitive to mutagens causing oxidative damage [MARON and AMES, 1983].
In the presence of 0.2*10-7mol TNFone per plate, urobilin was more effective
than stercobilin. The ID50 of urobilin was approximately half of that for stercobilin
(3.35, 1.4µmol, respectively) and therefore the order of effectiveness was U>S.
Interestingly, this trend was not consistent in both tester strains. As previously
described, in TA98 the reverse order could be observed.
These positive findings agreed with the results gained by Bulmer et al. in 2007.
In this study, bilirubin, biliverdin and bilirubin ditaurate inhibited the TNFone
induced mutagenic response dose-related [BULMER et al., 2007].
Mutagenicity caused by AFB1 in the presence of Salmonella typhimurium strain
TA102 was prevented most effectively by urobilin, whereas weaker
antimutagenic effects were observed for stercobilin. The AFB1 concentration
chosen was 120µg/ml, which means that 2.9*10-7mol of AFB1 were added to
each plate. Urobilin was found to inhibit the mutagenicity of AFB1 dose-related
and significantly different from positive control values at all concentrations
tested (p<0.05). This trend was consistent in both tester strains and therefore
suggests that urobilin is a very strong antimutagen for AFB1. As mentioned
before, unfortunately there are no comparative data available.
In order to investigate the antioxidant potential of stercobilin and urobilin, t-
BuOOH induced pro-oxidative effects were used. The modulatory effects of
both compounds on t-BuOOH induced mutation were similar with and without
metabolic activation. 0.75*10-6 mol of the mutagen were added to each plate.

Results and Discussion
65
When metabolic activation was missing, stercobilin and urobilin were not
effective in inhibiting the mutagenicity of t-BuOOH in Salmonella typhimurium
TA102 (see Fig.20). More precisely, urobilin was less active and stercobilin had
no effect.
In the presence of metabolic activation, both compounds were not able to
reduce number of revertants to half of the positive control (see Fig.21). Taken
together, stercobilin and urobilin did not reveal antioxidant effects towards t-
BuOOH induced genotoxicity.
The results obtained differ from a recently published study where bilirubin and
biliverdin were demonstrated to inhibit t-BuOOH induced mutation [BULMER et
al., 2007]. Under these conditions, bilirubin was more effective than biliverdin.
A growing body of evidence supports the view that bilirubin possesses strong
antioxidant properties and acts as a chain-breaking compound [STOCKER et
al., 1987a].
Furthermore, there is increasing evidence that the antioxidant potential of
bilirubin could be explained by bilirubin´s capacity to donate two electrons and
form a non-radical complex. Stocker et al. demonstrated that biliverdin can only
accept one electron [STOCKER et al., 1987]. This fact could be a possible
explanation why bilirubin was more effective than biliverdin in inhibiting t-
BuOOH induced mutagenic response.
As mentioned above, in the presence of t-BuOOH, stercobilin and urobilin
showed inconclusive effects that cannot be observed as being antioxidant.
Unfortunately there are no comparative data available on the antioxidant
properties of stercobilin and urobilin towards mutagenicity induced by t-BuOOH.
Therefore further research is needed to confirm or refute our findings in the here
presented study.

Results and Discussion
66
TNFone AFB1 t-BuOOH
(-S9)
t-BuOOH
(+S9)
Stercobilin - ↓ - ↓↓↓
Urobilin ↓↓↓ ↓↓ - ↓↓
Table 11: Modulatory effects of stercobilin and uro bilin in Salmonella typhimurium strain TA102
- ID50 not calculable
↓ 50% inhibition of positive control at 0.01µmol/plate
↓↓ 50% inhibition of positive control at 1 and 0.05µmol/plate (AFB1) and at 1 and 0.5µmol/plate (t-BuOOH +S9)
↓↓↓ 50% inhibition of positive control at 2, 0.1 and 0.05µmol/plate (stercobilin) and at 2, 1 and 0.5µmol/plate (urobilin)

Results and Discussion
67
7.3 Mutagenicity assays
A recent study revealed that bilirubin, biliverdin and bilirubin ditaurate had no
mutagenicity against Salmonella typhimurium strains TA98, TA100 and TA102
[BULMER et al., 2007]. In order to ensure the non-mutagenic potential of
stercobilin and urobilin in the present study, mutagenicity assays were
conducted in concentrations of 0.01 and 2µmol/plate. Ames assays were
carried out with and without metabolic activation using TA98 and TA102 strains.
Altogether, four tests (TA98 TNFone, TA98 PhiP and AFB1 with S9, TA102
TNFone and t-BuOOH and TA102 AFB1 and t-BuOOH with S9) were performed
to confirm non-mutagenic potential of the bile pigments.
Obviously, stercobilin and urobilin did not show any mutagenic effects in TA98
and TA102 (see Figure 23-26). This was true for every chosen test condition. All
tested concentrations were significantly different from doubled negative control
values (p<0.001) and significantly different from positive control values
(p>0.05).
The following figures 23-26 show that none of the mutagenicity assays provided
a dose-related increase in the number of revertant colonies. Furthermore, a
two-fold increase of revertants could not be noticed in any test. Single revertant
numbers as well as positive/negative control values for each test can be found
in chapter 12 (Table 22-36). Generally it can be said that all data were situated
in the negative control range. Interestingly, the majority of tested bile pigment
concentrations reduced the number of histidine revertants compared to the
negative control (DMSO).
Figure 22: TA98 colonies in a mutagenicity assay without metabolic activation (urobilin)
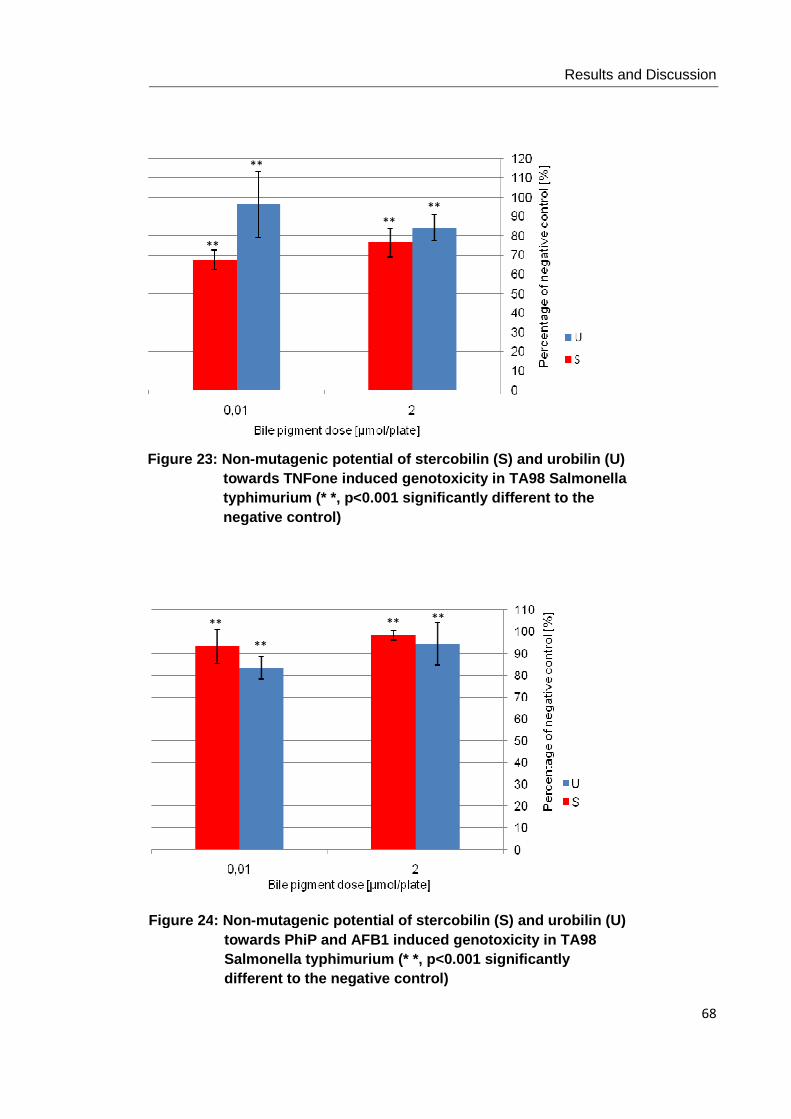
Results and Discussion
68
**
**
**
**
**
**
** **
Figure 23: Non -mutagenic potential of stercobilin (S) and urobilin (U) towards TNFone induced genotoxicity in TA98 Salmonella typhimurium (* *, p<0.001 significantly different to the negative control)
Figure 24: Non -mutagenic potential of stercobilin (S) and urobilin (U) towards PhiP and AFB1 induced genotoxicity in TA98 Salmonella typhimurium (* *, p<0.001 significantly different to the negative control)

Results and Discussion
69
**
**
**
**
**
**
**
**
Figure 25: Non -mutagenic potential of stercobilin (S) and urobilin (U) towards TNFone and t-BuOOH induced genotoxicity in TA102 Salmonella typhimurium (* *, p<0.001 significantly different to the negative control )
Figure 26: Non -mutagenic potential of stercobilin (S) and ur obilin (U) towards AFB1 and t-BuOOH induced genotoxicity in TA102 Salmonella typhimurium (* *, p<0.001 significantly different to the negative control)

Conclusion
70
8 CONCLUSION
The aim of the present study was to investigate the antimutagenic and
antioxidant potential of stercobilin and urobilin in the Ames Salmonella test. This
is the first study to report that degradation products of bilirubin possess
modulatory effects towards the genotoxicity of different mutagens. In
continuation of formerly published data on a variety of bile pigments including
bilirubin and biliverdin, novel findings of the present study might be of great
physiological relevance.
As mentioned at the beginning, this study was part of the project: ‘The
physiological relevance of bile pigments in vitro to in vivo evidence of
antioxidant, antimutagenic and anti-carcinogenic potential and their
mechanisms of action’. In the course of this project the protective effects of
eight bile pigments (bilirubin, biliverdin, bilirubin ditaurate, protoporphyrin,
bilirubin dimethyl ester, biliverdin dimethyl ester, stercobilin and urobilin) were
investigated in bacterial system, cell culture experiments and a human trial.
Experiments in the bacterial system revealed that stercobilin and urobilin alone
did not induce mutagenicity in TA98 and TA102. All presented data were
significantly different from doubled negative control values (p<0.001) and
significantly different from positive control values (p>0.05). This fact supports
antimutagenicity of bile pigments and their physiological importance.
Antimutagenic testing in the presence of Salmonella typhimurium TA98 and
TA102 indicated that stercobilin and urobilin possessed antimutagenic
properties against the mutagenicity induced by TNFone, PhiP and AFB1.
Almost all experimental data were significantly different from positive control
values (p<0.05). Chapter 12 includes all single revertant numbers,
positive/negative control values, mean values and standard deviations. An

Conclusion
71
Antimutagenic potential could be observed independent of tester strain and
metabolic activation.
TNFone induced mutagenic response was used to investigate the
antimutagenic potential of stercobilin and urobilin in the absence of metabolic
activation. The results clearly show that both compounds were able to suppress
the TNFone induced genotoxic effect dose-related in TA98 and TA102. The
order of effectiveness according to ID50 values was S>U for TA98 and U>S for
TA102. However, TA98 provided weaker antimutagenic effects, especially at
lower concentrations.
PhiP induced mutagenicity was used to test the possible antimutagenic effects
of stercobilin and urobilin in the presence of metabolic activation. Assays were
conducted with Salmonella typhimurium strain TA98. Both compounds showed
strong antimutagenic effects against the genotoxicity of this food related
mutagen. The order of effectiveness was S>U.
Another food related mutagen, aflatoxin (AFB1), was used to investigate the
antimutagenic potential of stercobilin and urobilin in the presence of metabolic
activation. Antimutagenic testing with this mutagen was carried out with
Salmonella typhimurium strain TA98 and TA102. Mutagenicity caused by AFB1
was prevented most effectively by urobilin, whereas weaker antimutagenic
effects were observed for stercobilin. This trend was consistent in both tester
strains (U>S).
In order to determine the antioxidant potential of stercobilin and urobilin, pro-
oxidative effects of an organic hydroperoxide were used. Regarding Salmonella
typhimurium strain TA102 in the antioxidant assays, stercobilin and urobilin
could not show protection against oxidative stress induced by t-BuOOH.
However, in the presence of metabolic activation, both compounds showed a
tendency to act as antioxidant.

Conclusion
72
Summarizing the results of the antimutagenic assays in TA98 and TA102,
strong antimutagenic potential (PhiP, AFB1 TA98 and TNFone) as well as
antimutagenic tendencies (AFB1 TA102) of stercobilin and urobilin were
observed in the presence of all mutagens. Most significant results were
obtained against the mutagenicity induced PhiP (both compounds) and the
mutagenicity of AFB1 (urobilin).
Summarizing the findings of the antioxidant assays in TA102, no protective
effect was observed towards the genotoxicity of t-BuOOH without metabolic
activation. However, stercobilin and urobilin showed weak antioxidant effects in
the presence of metabolic activation.
The total findings of the present study suggest that both degradation products of
bilirubin, stercobilin and urobilin, possess broad ranging antimutagenic effects
against a variety of mutagens in the Ames Salmonella test. Nevertheless,
further confirmation of our findings is required to clarify the mechanisms of
antimutagenic action. Furthermore, more research is needed to determine the
antioxidant potential of stercobilin and urobilin.

Summary
73
9 SUMMARY
The aim of the present study was to investigate the antimutagenic and
antioxidant potential of the bile pigments, stercobilin and urobilin, in the Ames
Salmonella test. The experiments in the bacterial system were designed with
two Salmonella typhimurium tester strains, TA98 and TA102. Different
mutagens including 2, 4, 7- trinitro-9-fluorenone (TNFone), aflatoxin B1 (AFB1),
2-amino-1-methyl-6-phenylimidazo [4, 5,-b] pyridine (PhiP) und tert-
butylhydroxyperoxide (t-BuOOH) were used to confirm the formation of mutant
revertants. Six doses of stercobilin (0.01, 0.05, 0.1, 0.5, 1 and 2 µmol/plate) and
eight doses of urobilin (0.001, 0.005, 0.01, 0.05, 0.1, 0.5, 1 and 2 µmol/plate)
were screened. In order to ensure non-mutagenic potential of bile pigments,
mutagenicity assays were performed. Tests were conducted without (TNFone,
t-BuOOH) and with (PhiP, AFB1 and t-BuOOH) metabolic activation.
Summarizing the results of the present study, stercobilin and urobilin could
afford significant protection against TNFone, PhiP and AFB1 induced
mutagenicity. Antimutagenicity was observed in the presence of these three
mutagens independent of tester strain and metabolic activation. Antioxidant
testing in the TA102 strain revealed that stercobilin and urobilin could not
effectively inhibit the genotoxic effects of t-BuOOH induced oxidative mutations.
Therefore, stercobilin and urobilin showed weak antioxidant effects in this test
system.
To conclude, these findings suggest apparent beneficial properties of stercobilin
and urobilin. During the course of this project, further research will be done in
this field exploring the mechanisms of antimutagenic and antioxidant action.
Studies in literature so far have primarily focused on bilirubin and biliverdin, so
there are no comparative data for stercobilin and urobilin in the Ames
Salmonella test available. Therefore, results of the present study might be of
great interest and importance for further research in this field.

Zusammenfassung
74
10 ZUSAMMENFASSUNG
Das Ziel der vorliegenden Studie war die Abschätzung des antimutagenen bzw.
antioxidativen Potentials von den beiden Gallenpigmenten Stercobilin und
Urobilin im in vitro Ames Test. Für die Untersuchung wurden die
Bakterienstämme Salmonella typhimurium TA98 und TA102 verwendet. Als
mutagene Substanzen wurden 2, 4, 7- Trinitro-9-Fluorenon (TNFone), Aflatoxin
B1 (AFB1), 2-Amino-1-methyl-6-phenylimidazo [4, 5,-b] Pyridin (PhiP) und tert-
Butylhydroxyperoxide (t-BuOOH) herangezogen. Die Testkonzentrationen der
Gallenfarbstoffe reichten von 0.001 bis 2 µmol/Platte (Urobilin) bzw. von 0.01
bis 2 µmol/Platte (Stercobilin). Um sicherzustellen, dass die beiden
Gallenpigmente kein mutagenes Potential aufweisen, wurde dies in
Mutagenitätstests überprüft. Die Tests wurden sowohl ohne (TNFone, t-
BuOOH) als auch mit (PhiP, AFB1, t-BuOOH) metabolischer Aktivierung
durchgeführt.
Die Ergebnisse der vorliegenden Studie haben gezeigt, dass die beiden
Gallenpigmente antimutagenes Potential gegenüber TNFone, PhiP und AFB1
aufweisen. Die entsprechende induzierte Mutagenität konnte, unabhängig von
Bakterienstamm und metabolischer Aktivierung, signifikant inhibiert werden. Die
durch t-BuOOH induzierten pro-oxidativen Effekte wurden von Stercobilin und
Urobilin nicht durchgehend signifikant gehemmt. Dies lässt bei diesem Test auf
eine tendenzielle antioxidative Schutzwirkung der Gallenpigmente schließen.
Zusammenfassend lässt sich sagen, dass Stercobilin und Urobilin
antimutagene Eigenschaften aufweisen, die im Zuge des Gesamtprojektes noch
näher erforscht und beleuchtet werden.
Da es sich hierbei um Pigmente handelt, deren antimutagenes bzw.
antioxidatives Potential im Ames Test noch nicht erforscht worden ist, sind
diese Untersuchungsergebnisse möglicherweise von erheblicher
physiologischer Relevanz und großem Interesse für weitere Forschung.
References
75
11 REFERENCES
ARIMOTO S, NEGISHI T, HAYATSU H. Inhibitory effect of hemin on the mutagenic activities of carcinogens. Cancer Letters 1980; 11: 29-33.
ARIMOTO S, KAN-YAMA K, RAI H, HAYATSU H. Inhibitory effect of hemin, chlorophyllin and related pyrrole pigments on the mutagenicity of benzo[α]pyrene and its metabolites. Mutation Research 1995; 345: 127-135.
AMES BN, LEE FD, DURSTON WE. An improved bacterial test system for the detection and classification of mutagens and carcinogens. Proceedings of the National Academy of Sciences 1973; 70: 782-786.
BERNHARD K, RITZEL G, STEINER KU. The biological importance of bile pigments. Bilirubin and biliverdin as antioxidants for vitamin A and essential fatty acids. Helvetica Chimica Acta 1954; 37: 306-313.
BREINHOLT V, SCHIMERLIK M, DASHWOOD R, BAILEY G. Mechanisms of chlorophyllin anticarcinogenesis against aflatoxin B1: complex formation with the carcinogen. Chemical Research in Toxicology 1995; 8: 506-514.
BRODERSEN R, STERN L. Binding of bilirubin to albumin. Critical Reviews in Clinical Laboratory Sciences 1980; 11: 307-399.
BULMER AC, RIED K, BLANCHFIELD JT, WAGNER KH. The anti-mutagenic properties of bile pigments. Mutation Research 2008; 658: 28-41.
BULMER AC, RIED K, COOMBES JS, BLANCHFIELD JT, TOTH I, WAGNER KH. The anti-mutagenic and antioxidant effects of bile pigments in the Ames Salmonella test. Mutation Research 2007; 629: 122-132.
CRIGLER JF, NAJJAR VA. Congenital familial nonhemolytic jaundice with kernicterus. Pediatrics 1952; 10: 169-180.

References
76
DIEKMAN MA, GREEN ML. Mycotoxins and reproduction in domestic livestock. Journal of Animal Science 1992; 70: 1615-1627.
DUDNIK LB, TSYUPKO AN, KHRENOV AV, ALESSENKO AV. Effect of bilirubin on lipid peroxidation, sphingomyelinase activity, and apoptosis induced by sphingosine and UV irradiation. Biochemistry (Moscow) 2001; 66: 1019-1027.
EXNER M, MINAR E, WAGNER O, SCHILLINGER M. The role of heme oxygenase-1 promoter polymorphisms in human diseases. Free Radical Biology and Medicine 2004; 37: 1097-1104.
FAHMY K, GRAY CH, NICHOLSON DC. The reduction of bile pigments by faecal and intestinal bacteria. Biochimica et Biophysika Acta 1972; 264: 85-97.
FISCHER H, ORTH H. In: Die Chemie des Pyrrols. Akademische Verlagsgesellschaft m.b.H. Leipzig, 1934.
GANTLA A, BAKKER CTM, DEOCHARAN B, THUMMALA NR, ZWE INER J, SINAASAPPEL M, CHOWDHURY JR, BOSMA PJ, CHOWDHURY NR . Splice-site mutations: A novel genetic mechanism of Crigler-Najjar-syndrome Type 1. American Journal of Human Genetics 1998; 62: 585-592.
GOURLEY GR. Bilirubin metabolism and kernicterus. Advances in Pediatrics 1997; 44: 173-229.
GUSTAFFSON BE, LANKE LS. Bilirubin and urobilinoids in germfree, ex-germfree and conventional rats. The Journal of Experimental Medicine 1960; 112: 975-981.
HALLIWELL B, GUTTERIDGE JMC. Free Radicals in Biology and Medicine. Journal of Free Radicals in Biology & Medicine 1985; 1: 331-332.

References
77
HAN Z, ZHENG Y, LUAN L, CAI Z, REN Y, WU Y. An ultra-high-performance liquid chromatography –tandem mass spectrometry method for simultaneous determination of aflatoxins B1, B2, G1, G2, M1 and M2 in traditional Chinese medicines. Analytica Chimica Acta 2010; 664: 165-171.
HORN F, MOC I, SCHNEIDER N, GRILLHÖSL C, BERGHOLD S , LINDENMEIER G. Hämoglobin-Abbau. In: Biochemie des Menschen. Georg Thieme Verlag KG, 2005; 501-504.
HULEA SA, WASOWICZ, KUMMEROW FA. Inhibition of metal-catalyzed oxidation of low density lipoprotein by free and albumin-bound bilirubin. Biochemica et Biophysica Acta 1995; 1259: 29-38.
HWANG J, TSENG T, TSAI Y, LEE H, CHOU F, WANG C, CH U C. Protective effects of baicalein on tert-butyl hydroperoxide-induced hepatic toxicity in rat hepatocytes. Journal of Biomedical Science 2005; 12: 389-397.
IHARA H, HASHIZUME N, SHIMIZU N, AOKI T. Threshold concentration of unbound bilirubin to induce neurological deficits in a patient with type I Crigler-Najjar syndrome. Annals of Clinical Biochemistry 1999; 36: 347-352.
INAMI K, OKAZAWA M, MOCHIZUKI M. Mutagenicity of aromatic amines and amides with chemical models for cytochrome P450 in Ames assay. Toxicology in Vitro 2009; 23: 986-991.
ISONO K, YOURNO J. Chemical Carcinogens as Frameshift Mutagens: Salmonella DNA Sequence Sensitive to Mutagenesis by Polycyclic Carcinogens. Proceedings of the National Academy of Sciences 1974; 71: 1612-1617.
JAFFE M. Zentralbl. Med. Wiss. 1869; 6: 241
KARI F. NTP technical report on the toxicity studies of trinitrofluorenone (Cas No. 129-79-3) administered by dermal application and dosed feed to F344/N rats and B6C3F1 mice. Toxicity report series 1992; 1-D4.

References
78
KUNTZ E, KUNTZ HD. Biochemistry and functions of the liver. In: Hepatology Textbook and Atlas. Springer Medizin Verlag Heidelberg, 2008; 38, 106.
LAIR CF, MASIUS JB. Zentralbl. Med. Wiss. 1871; 9: 369
LEVIN DE, HOLLSTEIN M, CHRISTMAN MF, SCHWIERS EA, A MES BN. A new Salmonella tester strain (TA102) with A•T base pairs at the site of mutation detects oxidative mutagens. Proceedings of the National Academy of Sciences 1982; 79: 7445-7449.
MARON D, AMES BN. Revised methods for the Salmonella mutagenicity test. Mutation Research 1983; 113: 173-215.
McPHEE F, CALDERA PS, BEMIS GW, McDONAGH AF, KUNTZ ID, CRAIK CS. Bile pigments as HIV-1 protease inhibitors and their effects on HIV-1 viral maturation and infectivity in vitro. Biochemical Journal 1996; 320: 681-686.
MINETTI M, MALLOZZI C, DI STASI AM, PIETRAFORTE D. Bilirubin is an effective antioxidant of peroxynitrite-mediated protein oxidation in human blood plasma. Archives of Biochemistry and Biophysics 1998; 352: 165-174.
MORTELMANS K, ZEIGER E. The Ames Salmonella/microsome assay. Mutation Research 2000; 455: 29-60.
NAKAGAMI T, TOYOMURA K, KINOSHITA T, MORISAWA S. A beneficial role of bile pigments as an endogenous tissue protector: anti-complement effects of biliverdin and unconjugated bilirubin. Biochimica et Biophysica Acta 1993; 1158: 189-193.
NAKAMURA T, SATO K, AKIBA M, OHNISHI M. Urobilinogen, as a bile pigment metabolite, has an antioxidant function. Journal of Oleo Science 2006; 55: 191-197.
NOVOTNY L, VITEK L. Inverse relationship between serum bilirubin and atherosclerosis in men: A meta-analysis of published studies. Experimental Biology and Medicine 2003; 228: 568-571.

References
79
O’CARRA P. Porphyrins and Metalloporphyrins (K. M. Smith) 123 Elsevier, Amsterdam, 1975.
ODIN AP. Antimutagenicity of the porphyrins and non-enzyme porphyrin-containing proteins. Mutation Research 1997; 387: 55-68.
OSTROW JD, CELIC L. Bilirubin chemistry, ionization and solubilization by bilt salts. Hepatology 1984; 4: 38-45.
PRIVAL MJ, BELL SJ, MITCHELL VD, PEIPERL MD, VAUGHA N VL. Mutagenicity of benzidine and benzidine-congenor dyes and selected monoazo dyes in a modified Salmonella assay. Mutation Research 1984; 136: 33-47.
READ BE. Chinese material medica: Animal drugs. Taipei: Southern Materials Center, Inc.; 1976.
REID TM, MORTON KC, WANG CY, KING CM. Mutagenesis of azo dyes following metabolism by different reductive/oxidative systems. Environmental Mutagenesis 1984; 6: 247-259.
ROMERT L, JANSSON T, CURVALL M, JENSSEN D. Screening for agents inhibiting the mutagenicity of extracts and constituents of tobacco products. Mutation Research 1994; 322: 97-110.
SCHMID R, MC DONAGH AF. The enzymatic formation of bilirubin. Annals of the New York Academy of Sciences 1975; 244: 533-552.
SHAPIRO SM. Bilirubin toxicity in the developing nervous system. Pediatric Neurology 2003; 29: 410-421.
STÄDELER G. Justus Liebigs Ann. Chem. 132, 323 (1864)
STOCKER R. Antioxidant Activities of Bile pigments. Antioxidants & Redox Signaling 2004; 6: 841-849.

References
80
STOCKER R, GLAZER AN, AMES BN. Antioxidant activity of albumin-bound bilirubin. Proceedings of the National Academy of Sciences 1987a; 84: 5918-5922.
STOCKER R, YAMAMOTO Y, MC DONAGH AF, GLAZER AN, AME S BN. Bilirubin is an antioxidant of possible physiological importance. Science 1987b; 235: 1043-1046.
STROKA J, VAN OTTERDIJK R, ANKLAM E. Immunoaffinity clean-up prior thin-layer chromatography (TLC) for the determination of aflatoxins in various food matrices. Journal of Chromatography A 2000; 904: 251-256.
TANG X, EDENHARDER R. Inhibition of the mutagenicity of 2-nitrofluorene, 3-nitrofluoranthene and 1-nitropyrene by vitamins, porphyrins and related compounds, and vegetable and fruit juices and solvent extracts 1997; 35: 373-378.
TEMME EHM, ZHANG J, SCHOUTEN EG, KESTELOOT H. Serum bilirubin and 10 year mortality risk in a Belgian population. Cancer Causes and Controls 2001; 12: 887-894.
TOMARO ML, BATTLE AM. Bilirubin: its role in cytoprotection against oxidative stress. The international Journal of Biochemistry & Cell Biology 2002; 34: 216-220.
TURESKY RJ. Formation and biochemistry of carcinogenic heterocyclic aromatic amines in cooked meats. Toxicology Letters 2007; 168: 219-227.
VITEK L, KOTAL P, JIRSA M, MALINA J, CERNA M, CHMEL AR D, FEVERY J. Intestinal colonization leading to fecal urobilinoid excretion may play a role in the pathogenesis of neonatal jaundice. Journal of Pediatric Gastroenterology and Nutrition 2000; 30: 294-298.
VITEK L, MAJER F, MUCHOVA L, ZELENKA J, JIRASKOVA A , BRANNY P, MALINA J, UBIK K. Identification of bilirubin reduction products formed by Clostridium perfringens isolated from human neonatal fecal flora. Journal of

References
81
chromatography. B, Analytical technologies in the biomedical and life sciences 2006; 833: 149-157.
VITEK L, OSTROW JD. Bilirubin Chemistry and Metabolism; Harmful and Protective Aspects. Current Pharmaceutical Design 2009; 15: 2869-2883.
VITEK L, SCHWERTNER HA. The heme catabolic pathway and its protective effects on oxidative stress-mediated diseases. Advances in Clinical Chemistry 2007; 43: 1-57.
WANG L-J, LEE T-S, LEE F-Y, PAI R-C, CHAU L-Y. Expression of Heme Oxygenase-1 in Atherosclerotic Lesions. American Journal of Pathology 1998; 152: 711-720.
WATSON CJ, WEIMER M, MOSCOWITZ A, LIGHTNER DA, PETR YKA ZJ, DAVIS E. Biochem. Med. 2, 484 (1969)
WITH TK. Bile pigments in feces. In: With TK Ed, Bile pigments. Chemical, Biological and Clinical Aspects. Academic Press 1969; 585-613.

Appendix
82
12 APPENDIX
12.1 Antimutagenic assays with TA98
12.1.1 Single revertant numbers for TA98
Mutagen Bile pigment dose [µmol/plate] 2 1 0.5 0.1 0.05 0.01 0.005 0.001
TNFone
Stercobilin
303 347 379 500 460 554 - -
312 343 384 427 472 567 - -
306 345 381 480 470 461 - -
mean 307 345 381 469 467 527 - -
sd 4.6 2.0 2.5 37.7 6.4 57.8 - -
% of Pos 67.8 76.2 84.2 103.6 103.2 116.5 - -
sd % of Pos 1.0 0.4 0.6 8.3 1.4 12.8 - -
Urobilin
181 264 284 402 532 572 621 634
192 269 294 445 494 613 594 582
163 268 298 425 499 534 611 630
mean 179 267 292 424 508 573 609 615
sd 14.6 2.6 7.2 21.5 20.6 39.5 13.7 28.9
% of Pos 49.4 73.8 80.7 117.1 140.4 158.3 168.1 170.0
sd % of Pos 4.0 0.7 2.0 5.9 5.7 10.9 3.8 8.0
PhiP +S9
Stercobilin
143 196 191 199 226 257 - -
151 202 214 221 219 242 - -
164 182 196 215 230 241 - -
mean 153 193 200 212 225 247 - -
sd 10.6 10.3 12.1 11.4 5.6 9.0 - -
% of Pos 31.1 39.4 40.9 43.2 45.9 50.3 - -
sd % of Pos 2.2 2.1 2.5 2.3 1.1 1.8 - -
Urobilin 123 226 272 268 261 266 292 236
147 238 255 237 302 246 290 269

Appendix
83
142 250 230 250 259 239 254 232
mean 137 238 252 252 274 250 279 246
sd 12.7 12.0 21.1 15.6 24.3 14.0 21.4 20.3
% of Pos 28.1 48.7 51.7 51.5 56.1 51.3 57.1 50.3
sd % of Pos 2.6 2.5 4.3 3.2 5.0 2.9 4.4 4.2
PhiP S9 Repetition
Stercobilin
123 143 174 162 189 195 - -
131 159 180 172 192 181 - -
111 162 185 178 175 - - -
mean 122 155 180 171 185 188 - -
sd 10.1 10.2 5.5 8.1 9.1 9.9 - -
% of Pos 30.9 39.3 45.6 43.4 47.1 47.8 - -
sd % of Pos 2.6 2.6 1.4 2.1 2.3 2.5 - -
AFB1 +S9
Stercobilin
302 191 180 175 201 207 - -
256 182 193 171 212 134 - -
262 165 181 169 195 134 - -
mean 273 179 185 172 203 158 - -
sd 25.0 13.2 7.2 3.1 8.6 42.1 - -
% of Pos 111.3 73.0 75.2 69.9 82.5 64.5 - -
sd % of Pos 10.2 5.4 2.9 1.2 3.5 17.2 - -
Urobilin
71 76 71 82 78 92 104 116
68 70 69 78 77 99 91 106
70 71 79 79 61 102 112 118
mean 70 72 73 80 72 98 102 113
sd 1.5 3.2 5.3 2.1 9.5 5.1 10.6 6.4
% of Pos 22.0 22.9 23.1 25.2 22.8 30.9 32.3 35.8
sd % of Pos 0.5 1.0 1.7 0.7 3.0 1.6 3.4 2.0
AFB1 +S9 Repetition
Stercobilin
196 209 175 243 204 176 - -
206 214 172 196 183 168 - -
167 166 153 190 175 154 - -
mean 190 196 167 210 187 166 - -
sd 20.3 26.4 11.9 29.0 15.0 11.1 - -
% of Pos 62.6 64.8 55.0 69.2 61.8 54.8 - -
sd % of Pos 6.7 8.7 3.9 9.6 4.9 3.7 - -
Table 12: Single revertant numbers of stercobilin a nd urobilin towards TNFone and PhiP induced genotoxicity in TA98

Appendix
84
12.1.2 Positive control values TA98 for Stercobilin
TNFone PhiP +S9 PhiP +S9
Repetition AFB1 +S9
AFB1 +S9 Repetition
Positive I 467 463 425 291 321
Positive II 495 481 433 284 260
Positive III 396 527 323 162 328
mean 453 490 394 246 303
sd 51.0 33.0 61.3 72.5 37.4
% of Pos 100 100 100 100 100
sd % of Pos 11.3 6.7 15.6 29.5 12.3
Table 13: Positive control values for TNFone, PhiP and AFB1 in TA98 (Stercobilin)
12.1.3 Negative control values TA98 for Stercobilin
TNFone PhiP +S9 PhiP +S9
Repetition AFB1 +S9
AFB1 +S9 Repetition
Negative I 26 57 73 44 49
Negative II 33 59 80 47 51
Negative III 51 64 70 41 52
Negative IV 50 62 70 47 55
Negative V 43 52 70 63 48
Negative VI 39 51 67 61 42
mean 40 58 72 51 50
sd 9.8 5.2 4.5 9.2 4.4
% of Pos 8.9 11.7 18.2 20.6 16.3
sd % of Pos 2.2 1.1 1.1 3.7 1.5
Table 14: Negative control values for TNFone, PhiP and AFB1 in TA98 (Stercobilin)

Appendix
85
12.1.4 Positive control values TA98 for Urobilin
TNFone PhiP +S9 AFB1 +S9
Positive I 353 526 312
Positive II 341 472 331
Positive III 392 467 306
mean 362 488 316
sd 26.7 32.7 13.1
% of Pos 100 100 100
sd % of Pos 7.4 6.7 4.1
Table15: Positive control values for TNFone, PhiP a nd AFB1 in TA98 (Urobilin)
12.1.5 Negative control values TA98 for Urobilin
TNFone PhiP +S9 AFB1 +S9
Negative I 30 55 55
Negative II 35 55 55
Negative III 38 42 42
Negative IV 25 66 66
Negative V 37 70 70
Negative VI 27 42 42
mean 32 55 55
sd 5.4 11.7 11.7
% of Pos 8.8 11.3 11.3
sd % of Pos 1.5 2.4 2.4
Table 16: Negative control values for TNFone, PhiP and AFB1 in TA98 (Urobilin)

Appendix
86
12.2 Antimutagenic/antioxidant assays with TA102
12.2.1 Single revertant numbers for TA102
Mutagen Bile pigment dose [µmol/plate]
2 1 0,5 0,1 0,05 0,01 0,005 0,001
TNFone
Stercobilin
666 676 743 760 727 815 - -
686 693 658 774 688 991 - -
707 793 580 695 660 1022 - -
mean 686 721 660 743 692 943 - -
sd 20.5 63.2 81.5 42.2 33.7 111.6 - -
% of Pos 56.4 59.2 54.2 61.0 56.8 77.4 - -
sd % of Pos 1.7 5.2 6.7 3.5 2.8 9.2 - -
Urobilin
625 509 685 769 783 1045 - -
642 591 589 721 792 882 - -
- 566 402 741 810 724 - -
mean 634 555 559 744 795 884 - -
sd 12.0 42.0 143.9 24.1 13.7 160.5 - -
% of Pos 52.0 45.6 45.9 61.1 65.3 72.6 - -
sd % of Pos 1.0 3.5 11.8 2.0 1.1 13.2 - -
t-BuOOH
Stercobilin
1303 1412 1115 1416 1429 1462 - -
1293 1489 1137 1382 1475 1318 - -
- 1394 1178 1354 1501 1302 - -
mean 1298 1432 1143 1384 1468 1361 - -
sd 7.1 50.5 32.0 31.0 36.5 88.1 - -
% of Pos 111.1 122.6 97.9 118.5 125.7 116.5 - -
sd % of Pos 0.6 4.3 2.7 2.7 3.1 7.5 - -
Urobilin
1268 1231 1130 1567 1430 1621 1043 1436
1152 1199 1066 1039 1423 1506 1161 1489
1012 1249 - 1580 1449 1159 883 1431
mean 1144 1226 1098 1395 1434 1429 1029 1452
sd 128.2 25.3 45.3 308.7 13.5 240.5 139.5 32.1
% of Pos 77.2 82.8 74.1 94.2 96.8 96.4 69.4 98.0
sd % of Pos 8.7 1.7 3.1 20.8 0.9 16.2 9.4 2.2
t-BuOOH +S9

Appendix
87
Stercobilin
1221 1503 1643 1176 1231 1524 - -
1210 1393 1391 1230 1105 1578 - -
1123 1445 - 1118 1226 1531 - -
mean 1185 1447 1517 1175 1187 1544 - -
sd 53.7 55.0 178.2 56.0 71.3 29.4 - -
% of Pos 51.2 62.6 65.6 50.8 51.4 66.8 - -
sd % of Pos 2.3 2.4 7.7 2.4 3.1 1.3 - -
Urobilin
384 482 495 553 583 521 648 697
407 440 444 501 574 543 791 696
621 370 285 502 324 481 629 593
mean 471 431 408 519 494 515 689 662
sd 130.7 56.6 109.5 29.7 147.0 31.4 88.6 59.8
% of Pos 57.1 52.2 49.5 62.9 59.9 62.5 83.6 80.3
sd % of Pos 15.9 6.9 13.3 3.6 17.8 3.8 10.7 7.2
AFB1 +S9
Stercobilin
993 581 578 745 602 455 - -
1180 580 601 625 963 473 - -
1009 605 612 601 551 539 - -
mean 1061 589 597 657 705 489 - -
sd 103.7 14.2 17.3 77.1 224.6 44.2 - -
% of Pos 105.2 58.4 59.2 65.2 70.0 48.5 - -
sd % of Pos 10.3 1.4 1.7 7.7 22.3 4.4 - -
Urobilin
312 442 452 491 394 481 367 473
341 474 410 484 382 495 468 427
363 392 399 462 422 461 455 406
mean 339 436 420 479 399 479 430 435
sd 25.6 41.3 28.0 15.1 20.5 17.1 54.9 34.3
% of Pos 44.3 57.1 55.0 62.7 52.3 62.7 56.3 57.0
sd % of Pos 3.3 5.4 3.7 2.0 2.7 2.2 7.2 4.5
Table 17: Single revertant numbers of stercobilin a nd urobilin towards TNFone, t- BuOOH and AFB1 induced genotoxicity in TA102

Appendix
88
12.2.2 Positive control values TA102 for Stercobilin
TNFone t-BuOOH t-BuOOH +S9 AFB1 +S9
Positive I 1306 1086 1992 1006
Positive II 1402 1250 2500 1003
Positive III 1375 - 2444 1015
mean 1218 1168 2312 1008
sd 160.6 116.0 278.5 6.2
% of Pos 100 100 100 100
sd % of Pos 13.2 9.9 12.0 0.6
Table 18: Positive control values for TNFone, t-BuOOH and AFB1 in TA102 (Stercobilin)
12.2.3 Negative control values TA102 for Stercobilin
TNFone t-BuOOH t-BuOOH +S9 AFB1 +S9
Negative I 371 341 480 421
Negative II 318 311 465 495
Negative III 235 323 428 415
Negative IV 369 329 382 433
Negative V 320 385 405 461
Negative VI 339 310 - 445
mean 325 333 432 445
sd 49.8 27.9 40.7 29.6
% of Pos 26.7 28.5 18.7 44.1
sd % of Pos 4.1 2.4 1.8 2.9
Table 19: Negative control values for TNFone, t-BuOOH, AFB1 in TA102 (Stercobilin)

Appendix
89
12.2.4 Positive control values TA102 for Urobilin
TNFone t-BuOOH t-BuOOH +S9 AFB1 +S9
Positive I 1306 1601 905 721
Positive II 1402 1553 810 759
Positive III 1375 1291 758 811
mean 1218 1482 824 764
sd 160.6 166.9 74.5 45.2
% of Pos 100 100 100 100
sd % of Pos 13.2 11.3 9.0 5.9
Table 20: Positive control values for TNFone, t-BuOOH and AFB1 in TA102 (Urobilin)
12.2.5 Negative control values TA102 for Urobilin
TNFone t-BuOOH t-BuOOH +S9 AFB1 +S9
Negative I 371 392 237 303
Negative II 318 411 255 291
Negative III 235 333 292 290
Negative IV 369 371 223 259
Negative V 320 337 229 272
Negative VI 339 391 185 314
mean 325 373 237 288
sd 49.8 31.7 35.5 20.1
% of Pos 26.7 25.1 28.7 37.7
sd % of Pos 4.1 2.1 4.3 2.6
Table 21: Negative control values for TNFone, t-BuOOH and AFB1 in TA102 (Urobilin)

Appendix
90
12.3 Mutagenicity assays with TA98 and TA102
12.3.1 Single revertant numbers for TA98 without S9
Mutagen Bile pigment dose [µmol/plate]
2 0,01
TNFone
Stercobilin
47 36
42 36
39 36
mean 43 38
sd 4.0 2.9
% of Neg 76.4 67.5
sd % of Neg 7.2 5.2
Urobilin
54 53
54 53
47 71
mean 52 59
sd 4.0 10.4
% of Neg 84.2 96.2
sd % of Neg 6.6 16.9
Table 22: Single revertant numbers of stercobilin a nd urobilin towards TNFone induced genotoxicity in TA98
12.3.2 Positive control values TA98 without S9 for Sterco bilin
TNFone
Positive I 417
Positive II 425
Positive III 434
mean 425
sd 8.5
Table 23: Positive control values for TNFone in TA98 (Stercobilin)

Appendix
91
12.3.3 Negative control values TA98 without S9 for Sterco bilin
TNFone
Negative I 58
Negative II 59
Negative III 57
Negative IV 60
Negative V 51
Negative VI 50
mean 56
sd 4.3
% of Neg 100
sd % of Neg 7.6
Table 24: Negative control values for TNFone in TA98 (Stercobilin)
12.3.4 Positive control values TA98 without S9 for Urobil in
TNFone
Positive I 462
Positive II 478
Positive III 442
mean 461
sd 18.0
Table25: Positive control values for TNFone in TA98 (Urobilin)

Appendix
92
12.3.5 Negative control values TA98 without S9 for Urobil in
TNFone
Negative I 63
Negative II 62
Negative III 56
Negative IV 61
Negative V 60
Negative VI 66
mean 61
sd 3.3
% of Neg 100
sd % of Neg 5.4
Table26: Negative control values for TNFone in TA98 (Urobilin)
12.3.6 Single revertant numbers for TA102 without S9
Mutagen Bile pigment dose [µmol/plate]
2 0,01
TNFone
Stercobilin
337 225
349 243
312 250
mean 333 239
sd 18.9 12.9
% of Neg 83.0 59.7
sd % of Neg 4.7 3.2
Urobilin
341 366
353 335
400 411
mean 365 371
sd 31.2 38.2
% of Neg 92.3 93.8
sd % of Neg 7.9 9.7
t-BuOOH Stercobilin 337 225

Appendix
93
349 243
312 250
mean 333 239
sd 18.9 12.9
% of Neg 83.0 59.7
sd % of Neg 4.7 3.2
Urobilin
341 366
353 335
400 411
mean 365 371
sd 31.2 38.2
% of Neg 92.3 93.8
sd % of Neg 7.9 9.7
Table 27: Single revertant numbers of stercobilin a nd urobilin towards TNFone and t-BuOOH induced genotoxicity in TA102
12.3.7 Positive control values TA102 without S9 for Sterc obilin
TNFone t-BuOOH
Positive I 1106 1653
Positive II 1121 1641
Positive III 1109 -
mean 1112 1647
sd 7.9 8.5
Table 28: Positive control values for TNFone and t-BuOOH in TA102 (Stercobilin)

Appendix
94
12.3.8 Negative control values TA102 without S9 for Sterc obilin
TNFone t-BuOOH
Negative I 397 397
Negative II 427 427
Negative III 395 395
Negative IV 402 402
Negative V 417 417
Negative VI 367 367
mean 401 401
sd 20.7 20.7
% of Neg 100 100
sd % of Neg 5.2 5.2
Table29: Negative control values for TNFone and t-BuOOH in TA102 (Stercobilin)
12.3.9 Positive control values TA102 without S9 for Urobi lin
TNFone t-BuOOH
Positive I 1092 1309
Positive II 1045 1151
Positive III 1107 1158
mean 1081 1206
sd 32.3 89.3
Table 30: Positive control values for TNFone and t-BuOOH in TA102 (Urobilin)

Appendix
95
12.3.10 Single revertant numbers for TA98 with S9
Mutagen Bile pigment dose [µmol/plate]
2 0,01
Phip
Stercobilin
49 47
51 43
49 51
mean 50 47
sd 1.2 4.0
% of Neg 98.3 93.1
sd % of Neg 2.3 7.9
Urobilin
51 41
42 45
50 40
mean 48 42
sd 4.9 2.6
% of Neg 94.4 83.2
sd % of Neg 9.8 5.2
AFB1
Stercobilin
49 47
51 43
49 51
mean 50 47
sd 1.2 4.0
% of Neg 98.3 93.1
sd % of Neg 2.3 7.9
Urobilin
51 41
42 45
50 40
mean 48 42
sd 4.9 2.6
% of Neg 94.4 83.2
sd % of Neg 9.8 5.2
Table31: Single revertant numbers of stercobilin an d urobilin towards PhiP and AFB1 induced genotoxicity in TA98

Appendix
96
12.3.11 Positive control values TA98 with S9 for Stercobili n and Urobilin
PhiP AFB1
Positive I 349 123
Positive II 385 151
Positive III 422 162
mean 385 145
sd 36.5 20.1
Table32: Positive control values for PhiP and AFB1 in TA98 (Stercobilin and Urobilin)
12.3.12 Negative control values TA98 with S9 for Stercobil in and Urobilin
PhiP AFB1
Negative I 56 56
Negative II 50 50
Negative III 48 48
Negative IV 50 50
Negative V 51 51
Negative VI 48 48
mean 51 51
sd 2.9 2.9
% of Neg 100 100
sd % of Neg 5.8 5.8
Table33: Negative control values for PhiP and AFB1 in TA98 (Stercobilin and Urobilin)

Appendix
97
12.3.13 Single revertant numbers for TA102 with S9
Mutagen Bile pigment dose [µmol/plate]
2 0,01
t-BuOOH
Stercobilin
361 313
380 325
391 307
mean 377 315
sd 15.2 9.2
% of Neg 102.7 85.7
sd % of Neg 4.1 2.5
Urobilin
292 307
314 332
306 343
mean 304 327
sd 11.1 18.4
% of Neg 82.7 89.1
sd % of Neg 3.0 5.0
AFB1
Stercobilin
361 313
380 325
391 307
mean 377 315
sd 15.2 9.2
% of Neg 102.7 85.7
sd % of Neg 4.1 2.5
Urobilin
292 307
314 332
306 343
mean 304 327
sd 11.1 18.4
% of Neg 82.7 89.1
sd % of Neg 3.0 5.0
Table34: Single revertant numbers of stercobilin an d urobilin towards t-BuOOH and AFB1 induced genotoxicity in TA102

Appendix
98
12.3.14 Positive control values TA102 with S9 for Stercob ilin and Urobilin
t-BuOOH AFB1
Positive I 1914 725
Positive II 2003 701
Positive III 1902 694
mean 1940 707
sd 55.2 16.3
Table 35: Positive control values for t-BuOOH and AFB1 in TA102 (Stercobilin and Urobilin)
12.3.15 Negative control values TA102 with S9 for Stercobil in and Urobilin
t-BuOOH AFB1
Negative I 388 388
Negative II 404 404
Negative III 327 327
Negative IV 387 387
Negative V 355 355
Negative VI 344 344
mean 368 368
sd 29.9 29.9
% of Neg 100 100
sd % of Neg 8.1 8.1
Table 36: Negative control values for t-BuOOH and AFB1 in TA102 (Stercobilin and Urobilin)
Curriculum Vitae
99
13 CURRICULUM VITAE
Personal information
Name: Andrea Steyrer
Address: Seidengasse 32/2/57, 1070 Vienna
Telephone number: 0664/3445740
Email: [email protected]
Date of Birth: September 25th, 1985
Citizenship: Austria
Education
06/2004 High School Diploma at the Bundesrealgymnasium Krems with emphasis on natural science
10/2004-06/2010 Study of Nutritional Sciences, Facultaty of Life Sciences, University of Vienna Title of master thesis: “The antimutagenic and antioxidant potential of stercobilin and urobilin in the Ames Salmonella test” Supervisor: Ao. Univ. Prof. Dr. Karl-Heinz Wagner
Work Experience
08/2007 Internship at the laboratory Mühl-Speiser, 1010 Vienna
02/2008-02/2009 Marginally employed at Bank Austria, 1010 Vienna
05/2008-08/2008 Internship in the canteen kitchen of a retirement home, 3550 Langenlois
09/2009 Internship at the University of Vienna, Department of Nutritional Sciences, 1090 Vienna
Professional Qualifications
• PC: MS Office, SPSS
• Languages: German, English, Latin
Further interests
Tennis, music, literature, films, travelling…