
DIGITRONIC MULTIPOINT AUTOCALIBRATION MANUAL · DIGITRONIC MULTIPOINT AUTOCALIBRATION MANUAL...
16
…best to fit DIGITRONIC MULTIPOINT AUTOCALIBRATION MANUAL Version: 01 Submission date: 2017-08-18 www.digitronicgas.com
Transcript of DIGITRONIC MULTIPOINT AUTOCALIBRATION MANUAL · DIGITRONIC MULTIPOINT AUTOCALIBRATION MANUAL...

…best to fit
DIGITRONIC MULTIPOINT
AUTOCALIBRATION MANUAL
Version: 01
Submission date: 2017-08-18
www.digitronicgas.com

…best to fit www.digitronicgas.com
Autocalibration in briefAutocalibration has been re‐engineered to allow a quick and reliable calibration of the gas
system on thevehicle. Once installed the system and selected the main gas devices, after the
idle calibration, theexecution of the autocalibration enables a training mode, and after a petrol
drive and a trial gas mode drive, the system is calibrated.
AUTOCALIBRATION RELEASE NOTES
Appliance of AutocalibrationAll the ECUs in the table below have the feature, or can be upgraded to have it, both for CNG
and LPG fuels; missing ECU models are not compatible with the feature.
The ECU needs to be updated in the software at least at the following versions
The feature is available since PC Software Tool Version 6.07.00.06 or later.
If PC Tool connects to an ECU that doesn’t run a firmware with the autocalibration feature, the
Tool PC will disable the related buttons.
If you connect a PC Software Tool Version older than 06.07.00.06 and inside the Gas ECU
there is the firmware version MP32 Ver 5.63 or later, MP48 Ver 11.37, MP48OBD Ver 9.69 the
tool doesn’t connect and advice you to update the software version.
MP32 Ver 5.63 or later
MP48 Ver 11.37 or later
MP48OBD Ver 9.69 or later

…best to fit www.digitronicgas.com
Prerequisites to AutocalibrationIn order to execute the procedure, gas equipment is supposed to be installed and tested,
petrol and gas in the tanks, warm engine.
Hence should be executed a standard system calibration (fuel, engine, sensors, injectors,…)
and specific vehicle strategies enabled, if necessary.
Autocalibration procedureStart the IDLE AUTOCALIBRATION by selecting the command GO TO MIN CALIBRATION in
the following menu with the Calibration PC tool connected to the ECU.
STEP ONE
ENABLE THE AUTOCALIBRATION by check the command on the top of the chart. The ECU
will enter in a learning mode composed by several steps.
The step one consists driving in petrol mode, the system acquires samples in the
Injection‐time/Mapspace. The vehicle driver, driving the vehicle both at idle and on‐road, must
try to cover as much red dots as he can, until a red line is drawn. In this activity the PC
software ease the acquisition suggesting which area still needs to be covered, or deleting
mistaken samples.
…best to fit www.digitronicgas.com
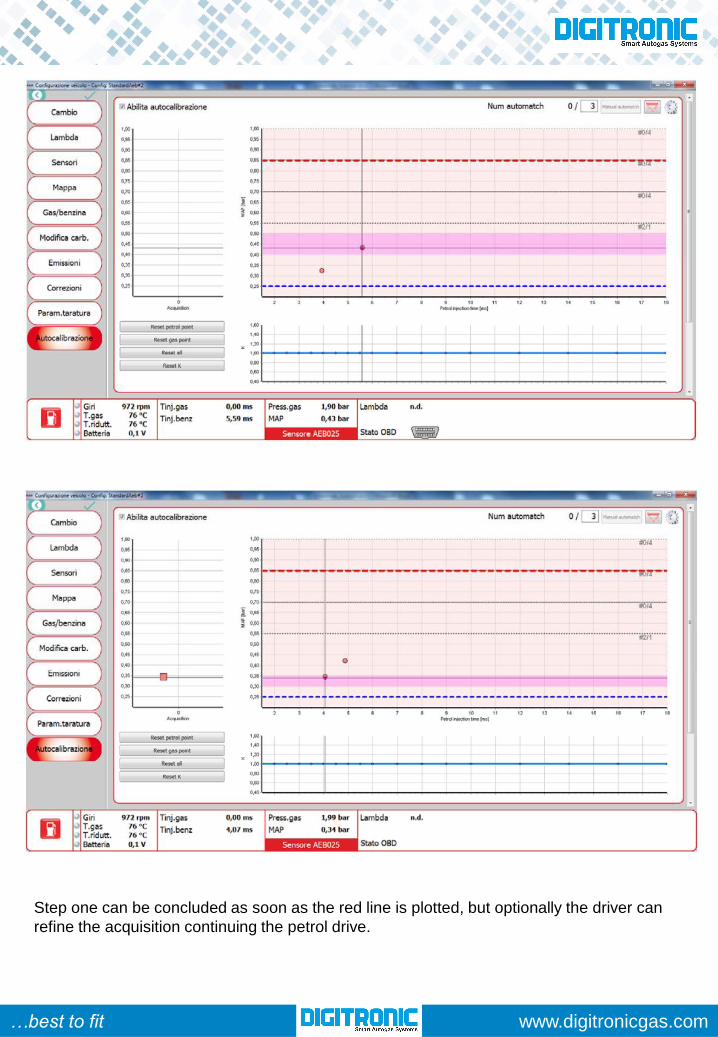
Step one can be concluded as soon as the red line is plotted, but optionally the driver can
refine the acquisition continuing the petrol drive.

…best to fit www.digitronicgas.com
As soon as the driver switches to gas, the system runs step two
STEP TWO
Consist driving in gas mode (for a number of times calibrated in the “num automatch” value).
As in step one, the user must drive in a trial gas mode, in order to acquire green dots and
achieve the drawing of a line.The system acquired the green line the first time

…best to fit www.digitronicgas.com
The system acquired the green line the last time, the autocalibration is ended
The procedure finishes as the number of automatch reaches the required number of
executions; the autocalibration output is K Vector (blue line) different from the usual K map.
Autocalibration is an optional feature: it is possible
• to continue using K maps achieved manually, or saved in archived calibrations
• reset autocalibration K Factor vector
• re‐execute totally or in part the procedure
Autocalibration software controls• Autocalibration enable
Enables the autocalibration feature. The most common use is to switch the control on, reset
previous stored data, if present, then begin with the petrol‐mode acquisition, until the
systems completes the number of automatch. Then the system applies the K Factor values in
the graph below.
Note: if the Autocalibration is disabled, the system does not use the K Factor correction
calculated in the autocalibration, so the enable flag must be switched to on permanently.
• Num Automatch (default 3)
Is the number of iteration of the gas‐mode acquisition. At each iteration the green line tends
to the red line. The lower is the value, the quicker is the procedure; the higher the value, the
longer will be the procedure, but more accurate in most cases.
• Manual automatch button
The button is automatically enabled in case of coherence of the acquired data; it causes the
acquisition of the gas samples, going to the next automatch.
…best to fit www.digitronicgas.com
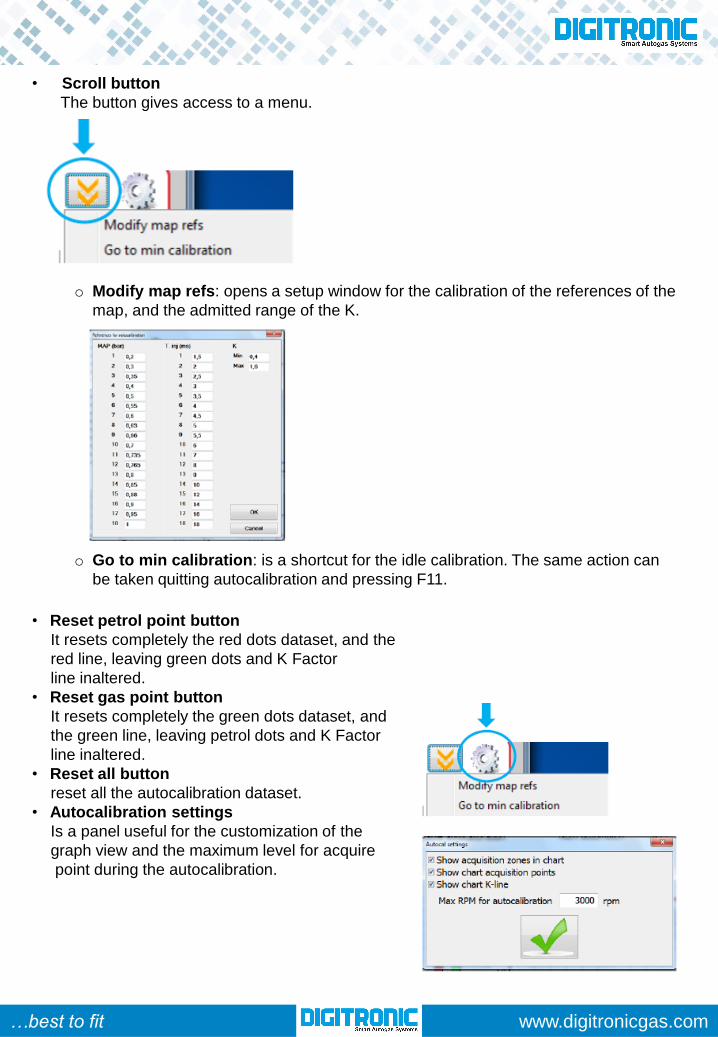
• Scroll button
The button gives access to a menu.
o Modify map refs: opens a setup window for the calibration of the references of the
map, and the admitted range of the K.
o Go to min calibration: is a shortcut for the idle calibration. The same action can
be taken quitting autocalibration and pressing F11.
• Reset petrol point button
It resets completely the red dots dataset, and the
red line, leaving green dots and K Factor
line inaltered.
• Reset gas point button
It resets completely the green dots dataset, and
the green line, leaving petrol dots and K Factor
line inaltered.
• Reset all button
reset all the autocalibration dataset.
• Autocalibration settings
Is a panel useful for the customization of the
graph view and the maximum level for acquire
point during the autocalibration.

…best to fit www.digitronicgas.com
MAP Chart items and controls:The map chart is an active control, intended to reduce the time of completion of the
autocalibration. It displays multiple data, and using the mouse actions the user can:
• Select and delete one or more dots
• Drag up and down the maximum MAP threshold
• Drag up and down the minimum MAP threshold
• Red rhombus dot: is the current working point of the acquisition. It is visible only if the
ECU is connected and the engine is on, and the fuel is petrol. Around rhombus there is
a highlighted line dark red, show you the subzone of the zone where you drive. You can
collect one point for each subzone, there are 4 subzone for each one of them.
• Green rhombus dot: is the current working point of the acquisition. It is visible only if the
ECU is connected and the engine is on, and the fuel is gas. Around rhombus there is
a highlighted line dark red, show you the subzone of the zone where you drive. You can
collect one point for each subzone, there are 4 subzone for each one of them.
• Green dots: are the samples acquired during the trial gas mode.
• Red dots: are the samples acquired during the petrol mode.
…best to fit www.digitronicgas.com
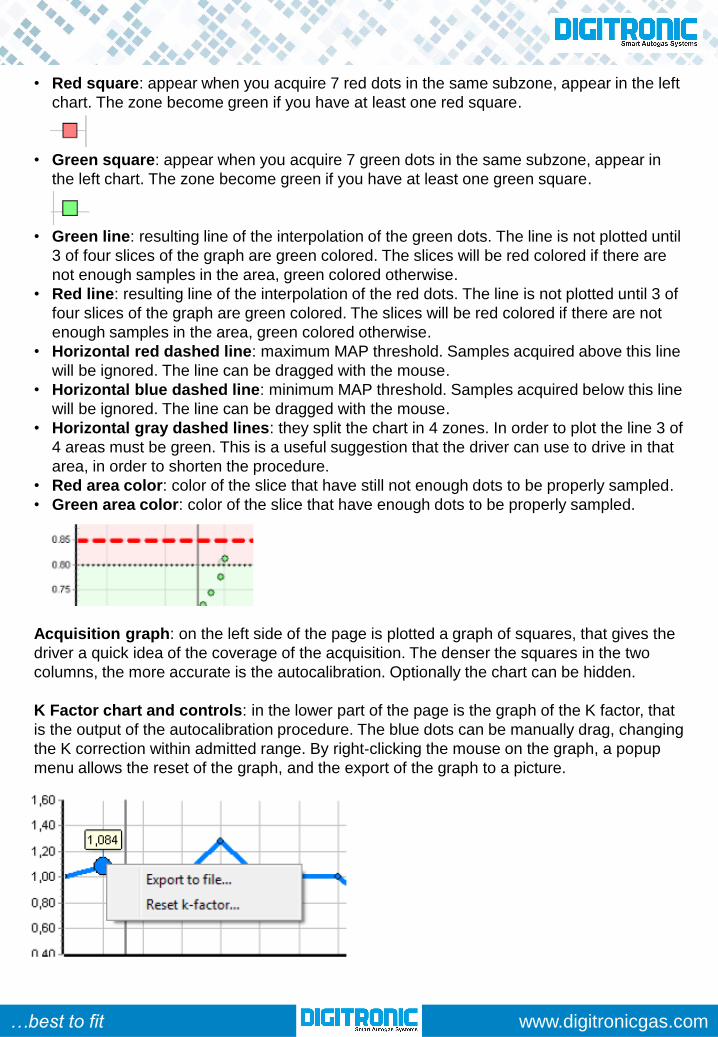
• Red square: appear when you acquire 7 red dots in the same subzone, appear in the left
chart. The zone become green if you have at least one red square.
• Green square: appear when you acquire 7 green dots in the same subzone, appear in
the left chart. The zone become green if you have at least one green square.
• Green line: resulting line of the interpolation of the green dots. The line is not plotted until
3 of four slices of the graph are green colored. The slices will be red colored if there are
not enough samples in the area, green colored otherwise.
• Red line: resulting line of the interpolation of the red dots. The line is not plotted until 3 of
four slices of the graph are green colored. The slices will be red colored if there are not
enough samples in the area, green colored otherwise.
• Horizontal red dashed line: maximum MAP threshold. Samples acquired above this line
will be ignored. The line can be dragged with the mouse.
• Horizontal blue dashed line: minimum MAP threshold. Samples acquired below this line
will be ignored. The line can be dragged with the mouse.
• Horizontal gray dashed lines: they split the chart in 4 zones. In order to plot the line 3 of
4 areas must be green. This is a useful suggestion that the driver can use to drive in that
area, in order to shorten the procedure.
• Red area color: color of the slice that have still not enough dots to be properly sampled.
• Green area color: color of the slice that have enough dots to be properly sampled.
Acquisition graph: on the left side of the page is plotted a graph of squares, that gives the
driver a quick idea of the coverage of the acquisition. The denser the squares in the two
columns, the more accurate is the autocalibration. Optionally the chart can be hidden.
K Factor chart and controls: in the lower part of the page is the graph of the K factor, that
is the output of the autocalibration procedure. The blue dots can be manually drag, changing
the K correction within admitted range. By right‐clicking the mouse on the graph, a popup
menu allows the reset of the graph, and the export of the graph to a picture.

…best to fit www.digitronicgas.com
How the autocalibration works:The maximum correction of the K‐factor will be in the range maximum 1.5 minimum 0.5.
Every automatch can modify the K‐factor ±20% in according to the previous value.
K‐Factor = 1
In this example after the first automatch the maximum correction is +20% also if should
be +40%
…best to fit www.digitronicgas.com
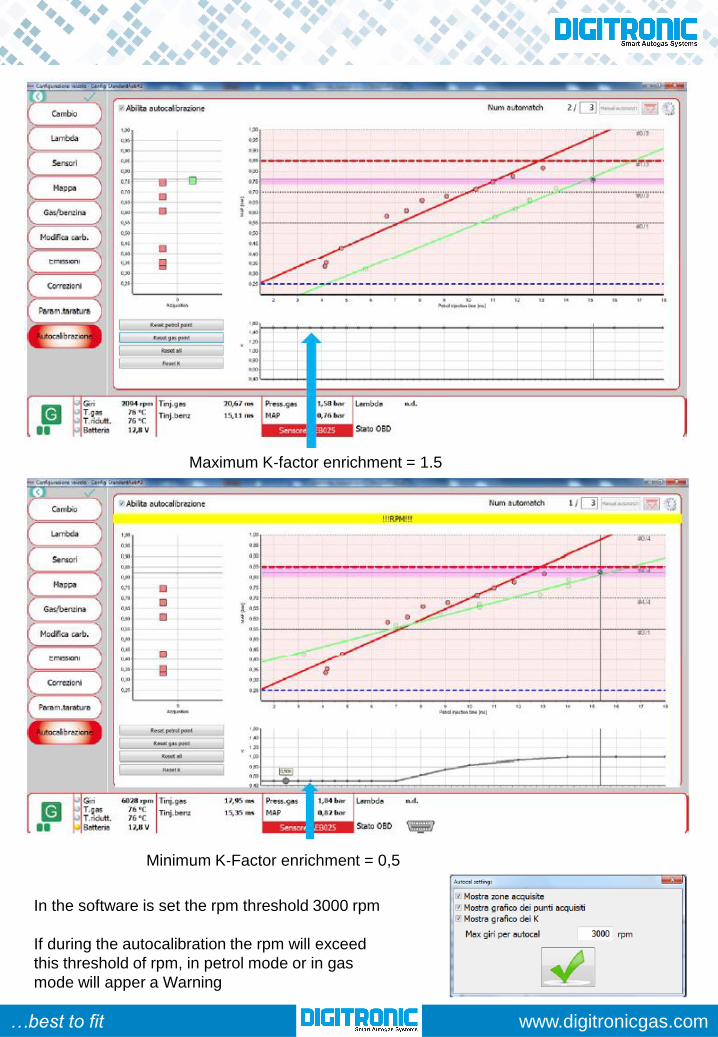
Maximum K‐factor enrichment = 1.5
Minimum K‐Factor enrichment = 0,5
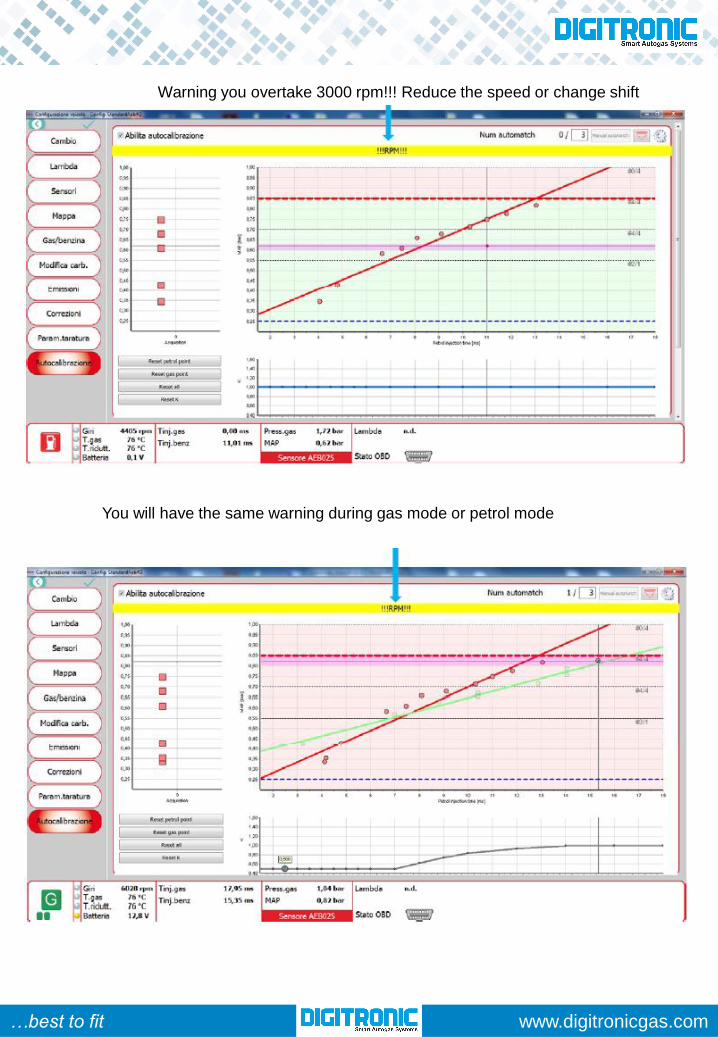
In the software is set the rpm threshold 3000 rpm
If during the autocalibration the rpm will exceed
this threshold of rpm, in petrol mode or in gas
mode will apper a Warning
…best to fit www.digitronicgas.com
Warning you overtake 3000 rpm!!! Reduce the speed or change shift
You will have the same warning during gas mode or petrol mode

…best to fit www.digitronicgas.com
User interface and the software request for obtain a green zone.We improve the user interface for semplify the autocalibration, we add for each zone the
mimimum number of point you need to acquire and highlighted the subzone where you drive
around the rhombus dot with an horizontal line in order to know where are you trying to take
the dots.
For collecting all the points and obtain a green zone you will have to satisfy all the following
requirement:
• Have the number of the dot equal to that one on the right of the zone chart #4/4
• One dot for each zone must be acquired ≥ 7 times and in the left chart will appear a
square.
during petrol mode or during gas mode
• The addiction of the number of the acquisition for every dots in each zone must be higher
than the value set in the configuration, you cannot change it and it’s less during gas
acquisition and higher during petrol acquisition after that the zone will be green.
Number of dots to acquire for each zone.
Line highlighted for show the subzone where you will take the dot

…best to fit www.digitronicgas.com
Dot acquired 7 time or more
If you satisfy all the three requirements the zone become green

…best to fit www.digitronicgas.com
Requirements:
• Have the number of the dot equal to that one on the right of the zone chart #4/4
• One dot for each zone must be acquired ≥ 7 times and in the left chart will appear
a square.
during petrol mode or during gas mode
• The addiction of the number of the acquisition for every dots in each zone must be higher
than the value set in the configuration, you cannot change it and it’s less during gas
acquisition and higher during petrol acquisition after that the zone will be green.
In this case the zone is not green because you need to acquire one more dot as the
indication suggest you
FOR MORE INFORMATION
AND TECHNICAL SUPPORT QUERIES
VISIT:
WWW.DIGITRONICGAS.COM


![Point-to-Multipoint and Multipoint-to-Multipoint · PDF filedefined by IEEE 802.1Qay [2] is representative carrier Ethernet . Abstract — We have implemented point-to-multipoint (PtMP)](https://static.fdocuments.net/doc/165x107/5a75c0147f8b9a4b538cb6cd/point-to-multipoint-and-multipoint-to-multipoint-defined-by-ieee-8021qay.jpg)


