
Digital Governance: Is Krishna a Glimpse of the Future? · Digital Governance: Is Krishna a Glimpse...
57
Working Paper 512 June 2019 Digital Governance: Is Krishna a Glimpse of the Future? Abstract The state of Andhra Pradesh is recognized as a leader in using technology to improve the delivery of public services, programs and subsidies. Many of its innovations were piloted in Krishna District, which has been visited by development agencies and delegations from many countries. This paper reports on research to better understand the functioning and effectiveness of its reforms to strengthen state capacity by digitalizing service delivery. Against the wider backdrop of the use of Aadhaar in India, it summarizes Andhra’s reforms, which go beyond those of most other jurisdictions in the measures taken to strengthen accountability, offer choice of service provider, and incorporate feedback loops using the vast amount of data generated by a real-time digital service system as well as beneficiary responses. It reports the results from surveys of beneficiaries who receive food rations through the Public Distribution System (PDS) and/or pensions, and on the response of landowners and tenant farmers to the digitization of land records, another important program. The results suggest strong support for the digitalization of these programs. The way in which the reforms have been implemented has indeed led to substantial improvements in delivery (as seen by beneficiaries) as well as, probably, significant fiscal savings. Is this case, then, a model for other Indian states and for other countries? Perhaps yes from a technology perspective; there are many lessons that apply to a wide range of programs and services and that others can usefully draw on. The picture is more complex from a political economy perspective, as suggested by some of the particular features of Andhra. www.cgdev.org Arshi Aadil, Alan Gelb, Anurodh Giri, Anit Mukherjee, Kyle Navis, and Mitul Thapliyal
Transcript of Digital Governance: Is Krishna a Glimpse of the Future? · Digital Governance: Is Krishna a Glimpse...

Working Paper 512 June 2019
Digital Governance: Is Krishna a Glimpse of the Future?
Abstract
The state of Andhra Pradesh is recognized as a leader in using technology to improve the delivery of public services, programs and subsidies. Many of its innovations were piloted in Krishna District, which has been visited by development agencies and delegations from many countries. This paper reports on research to better understand the functioning and effectiveness of its reforms to strengthen state capacity by digitalizing service delivery. Against the wider backdrop of the use of Aadhaar in India, it summarizes Andhra’s reforms, which go beyond those of most other jurisdictions in the measures taken to strengthen accountability, offer choice of service provider, and incorporate feedback loops using the vast amount of data generated by a real-time digital service system as well as beneficiary responses. It reports the results from surveys of beneficiaries who receive food rations through the Public Distribution System (PDS) and/or pensions, and on the response of landowners and tenant farmers to the digitization of land records, another important program. The results suggest strong support for the digitalization of these programs. The way in which the reforms have been implemented has indeed led to substantial improvements in delivery (as seen by beneficiaries) as well as, probably, significant fiscal savings.
Is this case, then, a model for other Indian states and for other countries? Perhaps yes from a technology perspective; there are many lessons that apply to a wide range of programs and services and that others can usefully draw on. The picture is more complex from a political economy perspective, as suggested by some of the particular features of Andhra.
www.cgdev.org
Arshi Aadil, Alan Gelb, Anurodh Giri, Anit Mukherjee, Kyle Navis, and Mitul Thapliyal
Center for Global Development2055 L Street NW
Washington, DC 20036
202.416.4000(f) 202.416.4050
www.cgdev.org
The Center for Global Development works to reduce global poverty and improve lives through innovative economic research that drives better policy and practice by the world’s top decision makers. Use and dissemination of this Working Paper is encouraged; however, reproduced copies may not be used for commercial purposes. Further usage is permitted under the terms of the Creative Commons License.
The views expressed in CGD Working Papers are those of the authors and should not be attributed to the board of directors, funders of the Center for Global Development, or the authors’ respective organizations.
Digital Governance: Is Krishna a Glimpse of the Future?
Arshi AadilMicroSave Consulting
Alan GelbCenter for Global Development
Anurodh GiriMicroSave Consulting
Anit MukherjeeCenter for Global Development
Kyle NavisCenter for Global Development
Mitul Thapliyal MicroSave Consulting
We thank Vikram Pratap Sharma, Anusha Jain Anuj Mukherjee, and Seth Garz for their valuable contributions to this paper as well as participants in seminars in Cambridge, London, and Washington, DC who offered critiques and suggestions.
This paper is co-published by MicroSave Consulting.
The Center for Global Development is grateful for contributions from the Bill & Melinda Gates Foundation in support of this work.
Arshi Aadil, Alan Gelb, Anurodh Giri, Anit Mukherjee, Kyle Navis, and Mitul Thapliyal, 2019. “Digital Governance: Is Krishna a Glimpse of the Future?” CGD Working Paper 512. Washington, DC: Center for Global Development. https://www.cgdev.org/publication/digital-governance-krishna-glimpse-future-working-paper

Contents
Executive summary .......................................................................................................................... 1
1. Introduction and overview ......................................................................................................... 6
2. Digital governance reforms: a brief overview ......................................................................... 9
3. Digital reforms in Krishna District, Andhra Pradesh .......................................................... 10
4. Methodology ............................................................................................................................... 12
5. Data analysis and results ........................................................................................................... 15
5.1 Overview of the sample ..................................................................................................... 15
5.2 PDS: Aadhaar-based biometric authentication .............................................................. 16
5.3 Delivery of social pensions: flexible benefits transfer design....................................... 31
5.4 The digitization of land records: differential benefits for landowners and tenant farmers ............................................................................................................................ 37
5.5 Financial inclusion, access, and empowerment: focus on Business Correspondents (BCs) ............................................................................................................... 41
6. Innovation in monitoring and feedback—towards real time governance ........................ 45
7. Conclusion................................................................................................................................... 47
References ........................................................................................................................................ 51
Annex 1. Sample description ........................................................................................................ 53

1
Executive summary
India has emerged at the forefront of the transformation towards a digital state, bringing together three pillars—digital ID (the Aadhaar unique identification system), mobile communications, and financial inclusion—to help improve state capacity to deliver public services, benefits and subsidies. This paper reports on research undertaken in Krishna District in the state of Andhra Pradesh (AP) to better understand the functioning and effectiveness of its reforms to digitize service delivery. AP has been recognized as a leader in this area and “Digital Krishna” has been at the vanguard of digital reforms.
Against the backdrop of India-wide digital strategy, AP and Krishna stand out in several ways:
• Full coverage. Aadhaar is held by virtually all residents and integrated into all public programs, effectively making it mandatory to receive any kind of services, subsidies and transfers.
• User choice via portability. Aadhaar verification of grain deliveries has been introduced throughout the PDS supply chain. Accurate deliveries are essential for the stock-flow reconciliation needed for efficient portability. Beneficiaries can collect their food rations from any service point in the state. The objectives are to enable them to shift towards better service providers and to facilitate mobility.
• Accountability for service access. This includes the use of iris scanners as a backup and clearly mandating the Village Revenue Officer (VRO) to authenticate on behalf of beneficiaries if technology fails.
• User voice: towards real-time governance. Real-time data on service delivery is complemented by a feedback mechanism, to identify problems through timely beneficiary surveys. These efforts have evolved into a real-time governance system (RTGS), that aims to track all digital transactions in real time.
We surveyed beneficiary households, “fair price shop” (FPS) owners selling subsidized (PDS) rations and business correspondents (BCs)—three key constituencies impacted by the reforms—and collected information from focus group meetings and interviews with a range of people and public officials. The approach was to compare experience of digitization in three areas: the PDS ration system, the delivery of pensions, and the digitization of land records, and to better understand its positive and negative features. We are not trying to assess whether AP and Krishna should continue with their current suite of benefits and services but to understand whether, and how, digital technology can contribute to state capacity to serve citizens more effectively through a range of mechanisms.
The PDS ration system: better service and fiscal savings
Seventy percent of beneficiaries responded that the new system was better than the previous one while 28 percent viewed it as worse.

2
• Both groups cited the elimination of diversion of rations and the timeliness of delivery as gains, with some noting improvements in the weighing system.
• The main factor driving views of “worse” was difficulties experienced with the biometric authentication system, either mismatches or connectivity problems.
Rating differences across gender, age and other characteristics are small. Those most dependent on the system for food tended to rate the digital PDS a little less favorably, but no subgroup considers the new system as worse.
The backup systems for managing technology failures appear to be working. Only 2 percent of respondents reported being denied rations due to digital failure and almost all of these saw their problem resolved speedily, mostly through the VRO. Exclusion did not emerge as an issue either in focus group discussions. These flagged several other policies to limit exclusion including allowing infirm beneficiaries to nominate someone to pick up rations on their behalf.
Portability was strongly endorsed by beneficiaries and dealers. Twelve percent of the former had taken advantage of it, either to get better service or for geographic flexibility. Dealers cited the possibility of attracting more customers as well as the ability to close shop if needed because customers had other options. All five dealers who disliked portability reported that it had reduced their income. Virtually all dealers endorsed the digitized supply-chain reforms because they now received the correct amounts of grains.
Digitization appears to have led to substantial fiscal savings. Even while maintaining generous access to the PDS system, seeding rolls with Aadhaar resulted in the elimination of duplicates and ghosts. Gains also came through stock-flow reconciliation, which prevents dealers from diverting unclaimed rations. Together, and after allowing for an increase in dealer margins to compensate them for reduced opportunity to gain from diversion, the digital reforms are estimated to have saved about 33 percent of the cost of the program. The cost of the digitization program for the PDS would be covered by about two months of these savings.
Social pensions: back to direct delivery—but with Aadhaar
AP has experimented with several methods of pension delivery, manually at village offices, then through the post office, then through direct deposits into bank accounts, and, most recently, cash payments directly from panchayat offices with delivery verified by Aadhaar authentication. Officials will deliver to the homes of pensioners who are unable to physically go to the panchayat office. Portability is also an option, but few pensioners seem to be aware of it.
Pensioners express a strong preference for direct panchayat delivery, relative to either through the bank or post office. They valued the predictability of payment. Very few reported skimming by officials or other corruption, practices that had been complained of under the previous pre-Aadhaar manual system.

3
The reversion to direct payment appears to run counter to the India-wide trend towards payment through bank accounts. In this case, it appears that the banking channel was not working as effectively as expected. Not all villages were served by BCs and the low pension delivery fee negotiated between the state and the banks (only 0.2 percent for pensions) provided insufficient incentive for them to effect “last mile” delivery to pensioners who then needed to visit their local bank. In addition, if biometric authentication failed, the VRO would be on hand at the panchayat office as a mandated backup.
AP’s experience provides a useful reminder that incentives need to be adequate through the delivery chain for delivery to be effective. More research on “last mile” delivery would be useful. It might be more cost effective to negotiate an adequate delivery fee with a financial intermediary than to incur the administrative costs of in-house delivery.
Digital land records: a plus for owners but no gain for tenants
AP’s land program includes the digitization of land records, linking to the Aadhaar of the owner, and more recently, working with GPS mapping and drones to resolve disputed boundaries and assigning a unique identifier (Bhudhaar) to each land parcel. Awareness of Aadhaar linkage was not universal but most of those aware had moved to digital records. All of these were landowners.
Judging by the near-universal views of this group, digital land records are providing their expected benefits to owners—ease of proving ownership and lower transactions costs for land-related transactions. Seventy seven percent reported using their digitized records to obtain loans and 29 percent to obtain seed subsidies. Only 37 percent had previously received these benefits.
Not much has changed for tenant farmers however. Landlords are reluctant to issue Loan Eligibility Certificates while Certificates of Cultivation are barely recognized as a valid document. Aadhaar-linked digital land records have not yet helped tenant farmers as had been hoped.
Financial inclusion and empowerment: a perspective from BCs
The profession of BC offers an avenue of advancement for women. Seventy three percent of our respondents were female. Most saw their jobs as important ones, a blend of social and financial service, though not particularly well-remunerated. Women customers appear to be more comfortable dealing with women BCs.
Women BCs report doing more to assist poor and vulnerable groups to access financial services. Where they are available, they appear to play a valuable role as “digital translators”. Nevertheless, it is not clear that the banking system has a viable business model for BCs and it is less clear how their role will evolve as UPI and other innovations boost the volume of digital payments and reduce the role of cash.

4
Towards cashless PDS Payments: two steps forward but one and a half back
With the onset of demonetization in November 2016 AP’s PDS system showed a remarkable capacity to respond. The share of cashless transactions in total purchases increased from nothing to 83 percent in only three and a half months. Thereafter it declined sharply, falling back to less than 10 percent by the end of 2017.
The survey provides useful insights on the factors encouraging and discouraging digital payments. On the plus side, the need for change is no longer an issue. On the minus side, 44 percent of beneficiaries said that they did not trust cashless payments while 71 percent cited the inability to check their balances while transacting on the e-POS system of the FPS. While they can pay the dealer though their own mobiles using UPI, this is not automatically reflected as a transaction in the PDS system. More will be needed to ensure a seamless payment system if beneficiaries are to return to cashless payments on a large scale.
Towards real-time governance
APs digital delivery system generates a huge volume of administrative data, much of it in real-time. With digital authentication at each point of service, it is possible to track service delivery in every district, panchayat and village, and at each service facility. These data can provide rapid feedback on service delivery, including to pinpoint cases of failed transactions and require corrective action in real time.
A second feedback loop comes through surveys of customer satisfaction. In addition to the possibility of calling a hotline, beneficiaries receive a robocall after a service asking for feedback. Negative responses roll over into an operator, one of 2000 in a call center. Complaints are routed automatically to the local government responsible for the facility concerned; standard resolution time is 24 hours. Based on indicators of service delivery and resolution of complaints, districts, villages and programs are rated on service satisfaction indices, referred to colloquially as the “Happiness Index”. These are a management tool for state and local governments.
The study did not independently verify how completely this system is applied to ensure performance standards, but it appears to have a considerable effect. Officials are very conscious of the scores of their jurisdictions and focus group meetings indicate that beneficiaries see it as having an important role, including to contain corruption. Relative to other states, AP appears to be well ahead in the integration of digital feedback into delivery systems.
Implications of the findings
Digital technology has provided important benefits, because it has been integrated into a comprehensive package including four essential elements: wide access; clear accountability; user choice; and user voice. These elements could be taken as benchmarks by a wide range of digitization programs in other contexts.

5
Equally important, the main priority has been to improve service rather than immediately save fiscal resources. Relative to any other states, AP maintains a generous safety net. It could use data from its Smart Pulse Surveys to trim its PDS enrolment but has so far chosen not to do this but to seek efficiency gains instead.
There are still areas of concern. One is remote biometric authentication, which still is not as smooth as desirable despite continuing efforts. More experimentation and analysis is needed in this area. The (non-digital) processes for enrollment into benefits programs are also slow and (reportedly) politicized at local levels. The study also throws up “last-mile” delivery issues for the banking system that inhibits the realization of the full potential of direct benefit transfers. The state government is aware of the need for improvements and it would be interesting to see whether and how the political transition of 2019 affects the scope and durability of the digital reforms going forward.
Is Krishna/AP then a model for other states or countries? Global technology trends argue in favor. However, three issues would need to be resolved for any potential application:
• Is the model compatible with social choice—in particular as concerns the nature of the ID system? The approach requires Aadhaar-like capabilities; not every country might be comfortable with this.
• Is there the baseline capacity to operate such a system? A real-time feedback system such as that in AP will crumble under the weight of a high level of failures and complaints.
• Is there political will to prioritize service delivery over other objectives, including bureaucratic discretion? Unlike many other jurisdictions, AP has a long history in this area, including a record of using social audits to monitor quality.
Krishna/AP therefore offers many lessons for other efforts to implement digital delivery systems. Many jurisdictions could adopt elements of its approach even if moving to the full model may only be feasible for some.

6
1. Introduction and overview
India has emerged as one of the countries at the forefront of the transformation towards a digital state, bringing together three pillars—digital ID (the Aadhaar unique identification system), mobile communications, and financial inclusion—to help improve state capacity to deliver public services, benefits and subsidies. Reforms are being implemented at scale, in a large variety of sectors (fertilizers, LPG cylinders for household use, food rations, pensions and other social transfers) and across programs that use a range of mechanisms for delivering support (including in-kind subsidy delivery, voucher systems and direct income transfers). Some programs are centrally administered but many are managed by individual states, which vary considerably in terms of capacity and in the uptake of the new digital approaches.
India has thus emerged as a veritable laboratory to understand the experience and impact of digital governance at both the macro and micro levels, and across different geographies and segments of the population, both rural and urban. Its approach has generated considerable debate and controversy, both with India and outside. Its experience is being followed by many development agencies and by countries where such reforms are at an earlier stage.
This paper reports on research undertaken in Krishna District in the state of Andhra Pradesh, India, to better understand the functioning and effectiveness of its reforms to digitize service delivery. Andhra Pradesh (AP) is a particularly interesting candidate for the study of these reforms. Over the last two decades, the state has been recognized as a leader in its political commitment to use technology for development. Hyderabad, the capital of the undivided state until 2013,1 has emerged as a hub for the IT industry and is host to many renowned global companies such as Microsoft and Google. There is a ready pool of technically skilled graduates from several higher education institutions spread across the state. More importantly, Andhra Pradesh has fostered a culture of innovation within the state government, providing incentive for administrators to try out new ideas, especially in the use of technology to improve public service delivery. For example, in 2006 it introduced India’s first large-scale test of making benefit payments through biometric smartcards, a program that represented a forerunner of the Aadhaar-enabled reforms (Muralidharan, Niehaus and Sukhtankar, 2016).
Within Andhra Pradesh itself, Krishna district has been at the vanguard of digital reforms. Its efforts and innovations have attracted the interest of development agencies, so that “Digital Krishna” is frequently visited by international delegations from developing countries. A number of new digital governance initiatives, such as the use of cashless transactions for the PDS ration system and of high-frequency administrative data for real time governance, were first experimented with in Krishna and then scaled up to the state level. AP is one of the three states that was covered in the 2017-2018 State of Aadhaar
1 In 2013, the region of Telengana comprising 31 districts was carved out as a separate state with Hyderabad as its capital. The remaining 13 districts are now part of the current Andhra Pradesh. A new state capital, Amravati, is under construction.

7
Report, which painted a picture of an advanced digital system for the delivery of public services and transfers (IDinsight 2018). There are, however, no in-depth, independent, studies on the experience and perception of beneficiaries, as well as the service providers who have been directly affected by its reforms.
Our study aims to fill this gap in the literature, to better understand how the reforms are seen by those who are most impacted by them. We surveyed households, PDS shop owners and banking correspondents—three key constituencies impacted by the digital governance reforms—and collected information from focus group meetings and interviews with a range of people and public officials. We implemented the study in partnership with MSC (formerly MicroSave), an organization with considerable experience in analyzing India’s digital programs and a partner in a previous joint study on Rajasthan. While the state and district governments were aware of the study and facilitated it in various ways, we were very conscious of the need for the research to proceed independently of possible government influence.
Even as many studies look at difficult cases to identify problems in implementation, there is a need to study the cases that are reputed to be successes—such as AP state and Krishna district—and that are supposed to have surmounted many of the teething difficulties that inevitably accompany the introduction of new systems.2 Are these reputed success cases more hype than reality? Recognizing also that every case has its own specific features, do they offer lessons for other states in India and for other countries implementing digital governance reforms? Do they point to the future?
Our focus on digital governance and the implementation of policies and programs should not be confused with the different question of what policies and programs the state should try to implement. There is currently intense debate in India around the mechanisms through which the state should deliver the approximately $71 billion that it spends on benefits and social assistance every year.3 Some argue that it would be more effective to shift from the current in-kind PDS provision of subsidized food towards a cash transfer system or combine diverse programs into a Universal Basic Income (UBI) grant. Some of the digital reforms have indeed moved in this direction. For example, the PaHaL-Ujjwala reforms shifted from LPG price subsidies to a cash transfer system which effectively provides a voucher for the refill of cylinders.4 Some states, such as Maharashtra, are considering how to offer their citizens a choice between receiving rations or cash transfers.5 Digital identification and
2 At the time of our surveys, Krishna’s digital reforms had been ongoing for some five years, about twice as long as those of Rajasthan, a state covered in a previous study (Gelb, Mukherjee and Navis, 2018). As noted in that study, it was not always easy to separate out views on the “steady state” of the new system from the (sometimes difficult) experiences of the transition. 3 Recently announced income support program for farmers (PM-KISAN) would raise this to $81 billion. This is for central government alone; we do not have estimates for the substantial additional spending by states. 4 Under PaHaL, the subsidy is transferred into bank accounts after the delivery of LPG refills. Ujjwala provides a subsidized LPG connection to poor households. 5 We use the term ‘cash transfer’ to mean any form of direct payment from central and state governments to beneficiaries of government programs, including through bank accounts. These include schemes that are under

8
payments systems do, of course have the potential to open up new ways for citizens and states to interact with each other, including to shift from price subsidies towards individualized transfers, a topic we have discussed in other work (Gelb, Mukherjee 2019). Here, we are not trying to assess whether AP and Krishna should continue with their current suite of benefits and services but to understand whether, and how, digital technology can contribute to state capacity to serve citizens more effectively through a range of mechanisms.
The purpose of this paper, therefore, is to focus specifically on the role of Aadhaar-enabled digital technologies in the design and implementation of a digital governance framework and what Krishna and AP suggest about their use to improve efficiency, equity and quality of public subsidies and transfers. The objectives are:
• To investigate the experience and perception of beneficiaries in three very different examples of Aadhaar based reforms—Public Distribution System (PDS), pensions and the digitization of land records;
• To understand the perceived impact of digital reforms on intermediaries, such as PDS shop owners and banking correspondents (BCs);
• To better understand components of reforms and how they reinforce each other, including the use of data and technology to enable innovative, real time feedback mechanisms;
• To make a rough estimate of fiscal savings from digitization in the PDS system.
In Section 2, we briefly review some background on digital governance reforms, recognizing the debates that they have provoked in India and elsewhere. Section 3 provides a brief description of initiatives to use digital technology to improve the delivery of services in Krishna and their scaling up to the state level. Our research methodology is outlined in Section 4 and the main results for the three programs—PDS, pensions and land record digitization—are set out in Section 5. In Section 6, we consider the introduction of “real-time governance” through data-driven feedback to improve the quality and accountability of public service delivery. This is a logical extension of a real-time digital delivery model which generates huge volumes of transactions-based data, and an area where AP appears to be ahead of other digitized programs.
Section 7 concludes with some lessons from our study and recommendations for policymakers as they implement digital governance initiatives in the future. We conclude that Krishna, and AP more broadly, have achieved some impressive results and that they offer important lessons on the positive potential for digital service delivery reforms and on how to manage the transition towards digitized service delivery. These lessons are especially important because many other states and countries are seeing a rapid expansion in the digital pillars that can be used to reform service delivery. The questions in this case are more
the Direct Benefit Transfer (DBT) Mission, as well as income support and voucher-type reimbursements for purchase of goods such as LPG cylinders.

9
around the governance and capacity preconditions for similarly far-ranging reforms to be successful.
2. Digital governance reforms: a brief overview
In many countries across the world, digital technology is transforming how citizens interact with states. This move from traditional to digital governance may be considered as a potential gain in state capacity. Digital ID, including the use of biometrics, is making it easier for governments to know who their constituents are and to whom their public services and subsidies should be targeted. Mobile telecommunications and social media are being increasingly used to disseminate information and solicit feedback on the quality of public services. Financial systems, including mobile money, are facilitating G2P government payments directly to the bank accounts of beneficiaries as well as P2G payments by the public for government services. The effect can be to reduce transactions costs and leakages and strengthen accountability. However, the impact on beneficiaries, and on citizens more broadly, depend on whether, and how, these technological tools are harnessed for better and more efficient governance. Technology is neutral, and examples from many countries show a wide range of both benefits and risks (Gelb and Metz 2018).
Through its implementation of a broad-based digitization strategy, India provides many examples of efforts to use technology to reform public service delivery. Digital governance reform in India rests on three pillars popularly known as the ‘JAM trinity’ (Government of India, 2016). From mid-2015, the financial inclusion program known as Jan Dhan Yojana (JDY) has opened nearly 311 million bank accounts, helping India achieve 80 percent coverage of those older than 15 years in 2017 compared to only 53 percent in 2014 (Demirgüç-Kunt et. al., 2018). Following a nationwide rollout in 2011, the Aadhaar program has registered over 1.2 billion individuals on its biometric database, achieving almost universal coverage in just over five years. Finally, mobile phone subscriptions increased from 17 per 100 inhabitants in 2007 to 85 in 2016, achieving almost universal access within a decade (ITU, 2018). The relatively low cost of data-enabled value-added services is providing an opportunity to integrate mobile services into the overall digital governance framework, including for G2P payments and subsidies.
The digital reforms themselves have been contentious, and the government has faced a series of legal challenges to requiring the use of Aadhaar to receive public benefits. This is perhaps not surprising, since the rollout of Aadhaar, and the strong push for its integration into a wide range of government programs and services, preceded the legislation of a framework for its operation.6 In October 2018, the Supreme Court ruled that the Aadhaar could be mandated only for particular purposes—to access public subsidies and payments, and to file income taxes. However, even before the Supreme Court judgement, several central agencies, such as the Ministry of Petroleum and the Department of Fertilizers, had embarked on ambitious reforms to overhaul their LPG and fertilizer subsidy programs (Mittal, Mukherjee and Gelb 2017, MicroSave 2018). Several state governments also had
6 For overviews of the Aadhaar program and its use see IDInsight 2016, 2017.

10
initiated wide-ranging reforms of their own public service delivery systems, for example, mandating biometric authentication to receive food rations from the public distribution system (PDS) system and for social pensions.
Even though the evidence is still emerging, it is clear that implementation experience varies across states as well as across programs. Dreze et.al. (2017) report on the disappointing results in Jharkhand where the reforms appear to have resulted in “pain without gain.” Gelb, Mukherjee and Navis (2018) report more favorable results for Rajasthan, but with some reservations. Similarly, from surveys of rural households in three states, Rajasthan, Andhra Pradesh and West Bengal, IDinsight (2018) reports a generally favorable reaction to the Aadhaar-enabled reforms while also noting a number of adverse impacts. These studies indicate the risk of increasing exclusion while attempting to achieve efficiency gains through digitally enabled service delivery, including through point-of-service biometric verification. Even though backup methods of verification are supposed to prevent technology failure from excluding legitimate beneficiaries, it appears that often they are not being used, especially in situations where beneficiaries have little power and grievance redressal mechanisms are weak at the local level.
3. Digital reforms in Krishna District, Andhra Pradesh
Over nearly a decade, Krishna district in Andhra Pradesh has put in place a comprehensive digital governance framework, making it a leader in the state as well as in India as a whole. It continues to be an innovation hub—several digital reforms that were first piloted in the district have been scaled up to the state level and beyond. While the systems considered in this paper are AP-wide and not confined to Krishna, the district therefore provides a case at the frontier of digital governance, potentially holding lessons both for other states in India and globally.
Full coverage. Krishna is believed to have been the first district to fully implement online Aadhaar authentication. Aadhaar is integrated into all public programs, effectively making it mandatory to receive any kind of services, subsidies and transfers. Aware of the importance of technical constraints that hinder remote authentication, early on the district administration focused its efforts on improving connectivity. It encouraged operators to build out their systems and fitted electronic Point-of-Sale (ePOS) devices with multiple SIM cards that can switch between different network providers. It also experimented with new forms of portable antennae to help ePOS devices communicate in areas of weak connectivity.
Krishna prioritized Aadhaar enrolment starting in 2011 and reached virtually universal coverage by early 2016. High Aadhaar coverage made it a candidate to be included in the first phase of the Direct Benefit Transfer (DBT) programs introduced by the federal government from 2013 onwards, including the initial rollout of the direct benefit transfer of LPG cooking gas subsidy (DBT-L). Since one of the key components of DBT programs was the linking of Aadhaar with bank accounts, this provided a boost to bridge the gap in financial access which was already prevalent in the district. With almost universal coverage of Aadhaar-linked beneficiary lists and bank accounts, it was the first district to pilot cashless transactions in PDS following India’s demonetization in November 2016.

11
User choice via portability. In addition to being the first district to fully implement Aadhaar authentication at point-of-service, computerization and the use of Aadhaar verification was introduced throughout the PDS supply chain. Food consignments were electronically recorded as they transited through successive warehouses, and the handoff from delivery vehicles to Fair Price Shop (FPS) owners was verified by both sides using Aadhaar verification and electronic weighing. This eliminated ambiguity over how much grain was actually delivered to the shops, an essential step towards successfully implementing stock-flow reconciliation across the FPS system to prevent dealers from diverting supplies unclaimed by legitimate beneficiaries by the end of the month.
Reconciliation, in turn, paved the way for another innovation—AP being among the first states to pilot portability in PDS, wherein beneficiaries could collect their food rations from any fair price shop within the district.7 Providing choice to customers complicates the projection of demand for any particular shop and requires permitting the shops to carry over more generous levels of supplies. Portability has now been extended to cover the whole state as well to other sectors such as social pensions although it is less advanced than for the PDS. The objective has been to enable beneficiaries to shift towards better service providers, and to increase convenience, including for internal migrants who might otherwise not find it possible to collect their rations.8,9
Accountability for service access. A further noteworthy initiative has been a concerted effort to address technology-related exclusion due to the implementation of digital systems. To improve Aadhaar authentication rates especially in PDS and pension distribution, both fingerprint and iris readers are currently in use. If all other modes of authentication fail, the Village Revenue Officer (VRO) has been mandated to authenticate on behalf of the beneficiary.10 The aim of these measures is to both reduce the chances of exclusion and to fix clear accountability for service within the local government. These policies are consistent with the efforts made by successive state governments to use technology as a tool to improve governance and service delivery in Andhra Pradesh. We explore this in more detail in Section 5, together with the efforts to further reduce the range of individual discretion using facial biometrics for difficult cases.
7 Chhattisgarh was the first state to pilot portability in two districts. Source: https://negd.gov.in/writereaddata/files/Case%20Study%20-%20COREPDS%2C%20Chhattisgarh.pdf 8 There are some small exceptions to portability, notably for the special allocations provided through the FPS at times of festivals and other special occasions. These are one-off programs so that dealers cannot carry over stocks to satisfy unexpected surges in demand from beneficiaries outside their normal catchment area. 9 Krishna has also started to roll out some further programs to restructure and upgrade the FPS system, transitioning shops towards modern “village malls” with online electronic inventory management systems that carry a range of non-perishable goods. Such a system could be useful, for example, if the ration system were to become more flexible or to transition towards a voucher or income transfer program. 10 The VRO is the lowest level of Gazetted Officer with the authority to represent the President and the State. The logic of this assignment is that the officer should be responsible for approving access to state funds on the part of the claimant.

12
User voice: towards real-time governance. Mandating processes to handle exceptions may not be enough. How can one be sure that local officials will follow the prescribed protocols? Some assurance can be provided by using real-time data generated by the system to locate possible problems. Data can be used to track service points that are failing to disperse as expected, or to check on a particular FPS if there is no follow-up to a failed effort to authenticate to draw rations. But administrative data cannot encompass the many possible dimensions of service that shape beneficiary experience. Krishna therefore complemented its system to monitor implementation in real time by a feedback mechanism to identify and address problems faced by beneficiaries, carrying out regular beneficiary surveys. This “second feedback loop” supplements high-frequency administrative data flowing from the use of Aadhaar-based authentication to access services.
These efforts have evolved into what is arguably the most significant innovation—the implementation of a real-time governance system (RTGS). A signature digital governance initiative of the state government, the proof of concept was tested in 2017. The objective is to use the power of information to verify, track and monitor all digital transactions in real time, enabling the administration to rectify errors, address problems and solicit feedback in an integrated way. With the scaleup to the state level, RTGS data is now receiving the highest level of political and administrative scrutiny. It is probably no exaggeration to posit this as a new mode of governance that aims to make delivery of public services inclusive, efficient and responsive in real-time to the needs of the citizens.
The goal of the study. While the novelty and sophistication of these digital innovations and reforms are not in doubt, there is no independent evidence of whether and how they offer a tangible improvement in the delivery of public services, subsidies and transfers from the beneficiary’s point of view. Data on the quality of services from beneficiary surveys carried out by the state government is not in the public domain. Moreover, while digital systems do improve trackability and analysis of service quality at a granular level, they cannot capture user preferences and constraints to the use of digital systems, at both individual and societal levels.
We aim to fill this gap in our understanding of digital governance reforms through a representative survey of beneficiary households and service providers, taking Krishna as a frontier case for reasons described above. Our primary objective is to assess the perception and experience of digital reforms from the point of view of beneficiaries of public programs, and the response from service providers to a change in incentives and accountability. We explain our survey methodology in detail in the next section and present the findings in Section 5.
4. Methodology
Krishna is the richest district in Andhra Pradesh in terms of per capita income. It ranks first in gross value added in agriculture in the state, underscoring the importance of the sector in the economic development of the district. Following the bifurcation of Andhra Pradesh with the carve-out of Telangana in 2013, Amravati in Krishna district was chosen as the site for the new capital. This is further expected to benefit the district, with investments in physical

13
and digital infrastructure in the years to come. A summary of district level characteristics is presented in Table 1.
Table 1. Krishna district factsheet
Krishna Population (Census 2011) 4.5 million Area sq. km 8,727 Population density/km2 518 Literacy Rate (%) 66.6 Number of Sub-districts (Mandals) 50 Number of PDS beneficiaries 3.23 million
Our objective is to compare the perception and experience of beneficiaries using the new digital mechanism against the previous delivery systems. We undertook a field survey of 562 beneficiary households representing all the administrative regions of the district. Our sample consisted of 444 households from nine rural subdistricts (mandals) and the remaining 118 from two major urban agglomerations (Figure 1). In addition to households, we also surveyed 53 fair price shop owners and 45 business correspondents to understand how these changes affect those that provide services to the beneficiaries.
We focused specifically on three areas which have been impacted by digitalization—PDS, social pensions and digitization of land records. While the first two are in the form of delivery of in-kind subsidies and cash transfers respectively, land records involve moving from paper-based to online system of record keeping, seeding of Aadhaar and using digital land certificates to access credit and other agricultural inputs. In a district where agriculture is the most important economic activity, digitization of land records is an important element of digital governance. It is not a simple change; land boundaries have to be accurately surveyed and disputes have to be resolved if the digitized records are to be useful; the ownership of each piece of land also has to be clear and transparent. Implemented well, it has significant potential to improve transparency and legal protection of land ownership and, by reducing transactions costs, better target and deliver services to farmers.11
11 Andhra Pradesh has recently piloted the use of satellite mapping and drones in Krishna district to accurately geofence each parcel of land, and assign a unique number to it, the “Aadhaar for land”, known as Bhudhaar

14
Figure 1. Distribution of sample households
We deployed a mixed method survey, including both quantitative and qualitative assessments. We administered detailed questionnaires separately for households, fair price shop owners and business correspondents. The questionnaire design was to be conversational and balanced, to enable comparison of current and previous systems based on beneficiary recall, and to elicit tradeoffs between positive and negative implications of the reform from their point of view. The qualitative study, which included focus group discussions as well as stakeholder interviews and participatory rural assessments, was used to verify and supplement the quantitative analysis, providing insights into individual and social attributes not captured by the quantitative tools.12 Women were a key focus of our survey—they constitute two-thirds of all respondents and formed a large share of all focus groups for the qualitative survey.
The quantitative survey was conducted between June and July 2018, followed by the qualitative assessment in August–September 2018. While the state government and district administration gave the necessary permission to carry out the survey, they were not involved in the design of the instruments or in the survey process. We appreciate their support and their willingness to maintain the integrity and independence of the survey process. We present our main findings in the next section.
12 In total, 26 focus group discussions were conducted, PDS: 9 (Total Respondents: 54), Pension: 9 (Total Respondents: 62), and Land Records: 8 (Total Respondents: 42)
87 Respondents 2 Mandals
136 Respondents 2 Mandals
252 Respondents 5 Mandals
87 Respondents 2 Mandals

15
5. Data analysis and results
We begin with a consideration of the PDS system, before moving on to pensions, land records, and ending with business correspondents. We draw on the separate module of fair price shop owners to supplement our household PDS module to provide a more comprehensive picture of the functioning of the new digital delivery systems.
5.1 Overview of the sample
Our beneficiary household sample comprises 562 individuals surveyed in 51 different clusters, including villages and urban wards. The mean age of our respondents is 56, two-thirds are female and 82 percent live in rural areas. We intended our sample households to have experienced at least one of the three digital reforms, namely, PDS, pensions and land record digitization. Accordingly, one of the criteria for sample selection was whether the household was eligible to participate in such programs. As we see from Figure 2, all households in the sample report that they are currently authorized to lift rations, with over 80 percent receiving some other form of social assistance benefit.
We did not seek, in the study, to investigate the selection processes that determine whether a particular individual or household qualified for a program. As explained below in the case of the Janmbhoomi committees, the selection processes have not been perfect, but exclusion problems in this area reflect the working of administrative processes rather than the digital reforms.
Figure 2. Key sample statistics
The majority of our sample report having no formal schooling, this high number reflecting the tendency for respondents to be somewhat older than the national average. Three-quarters had held Below Poverty Line (BPL) cards issued by the state, a percentage which is
0
20
40
60
80
100
120
140
Number of respondents by age
Rural Urban
Pensioner, 39%
Agricultural labour, 27%
Owner-cultivator,
12%
Non-agricultural labour, 8%
Other non-farm, 8%
Tenant farmer, 3%
Others, 3%
Principal source of household income
0
10
20
30
40
50
60
70
80
90
100
PDS NSAP PAHAL NREGS
Percentage of Households Receiving Benefits from...

16
higher than that of BPL households in AP, as judged by national criteria 13 Following the 2013 enactment of the National Food Security Act (NFSA), the central government identified 26.82 million AP beneficiaries in priority households, or 54 percent of the state population, to be eligible for PDS financed from its budget allocation.14 However, in common with other South Indian states, AP has operated a relatively generous safety net for many years and decided not to exclude other, existing, beneficiaries who would need to be covered from the state’s own revenues.15 Its package of food rations is also more varied than the standard ration paid for by the central government.
From Table 1, after the seeding of Aadhaar the PDS ration system covers 71 percent of the population of Krishna. Many are included who would not be judged as BPL by national standards. Nevertheless, approximately 35 percent of the sample report relying on PDS rations for more than half of their monthly food consumption. Households who report their primary source of income as social pensions constitute 39 percent of our sample, followed by agricultural labor and owner-cultivators. Just over a quarter of our sample own (agricultural) land. In summary, our sample is weighted towards women, the elderly, and probably the more vulnerable, segments of the population especially in rural areas. As per the selection criteria, all of the respondents had experienced the change to Aadhaar-based digital service delivery reform in Krishna district. The detailed table of sample characteristics is provided in Annex 1.
The ubiquity of Aadhaar coverage stands out. Every respondent reported they had an Aadhaar number, while 99 percent of respondents said that someone in their family had a bank account linked to Aadhaar. Ninety one percent report that all members of their household have Aadhaar numbers, including children and even infants. These numbers suggest sustained momentum to ensure high Aadhaar coverage across the population three years after the initial waves of registration, a key concern for ID reforms in any context. The strong link with benefit programs is, no doubt, a major driver.
5.2 PDS: Aadhaar-based biometric authentication
5.2.1 Analytical results
We asked respondents for their preferences about the new PDS system where beneficiaries had to authenticate themselves at the fair price shop in order to access food rations. Figure 3
13 The BPL/APL classification was discontinued after the enactment of the National Food Security Act (2013). Our survey questionnaire asked respondents about their PDS category pre-NFSA as determined by the state. AP, like most South Indian states, has been more generous than many others. Reserve Bank (2013) estimates compiled for the combined states of (the new) AP and Telangana placed the percentage of population below the BPL line at only 9.2 percent in 2011. At present, only Priority Households (PHH) receive PDS rations; up to 75 percent of rural and 50 percent of urban population can be covered.. 14 Department of Food & Public Distribution (2013) 15 AP has followed the same approach of respecting established rights in other areas. In 2015 the state introduced a policy limiting households to at most one pension but grandfathered existing pension recipients from this restriction.

17
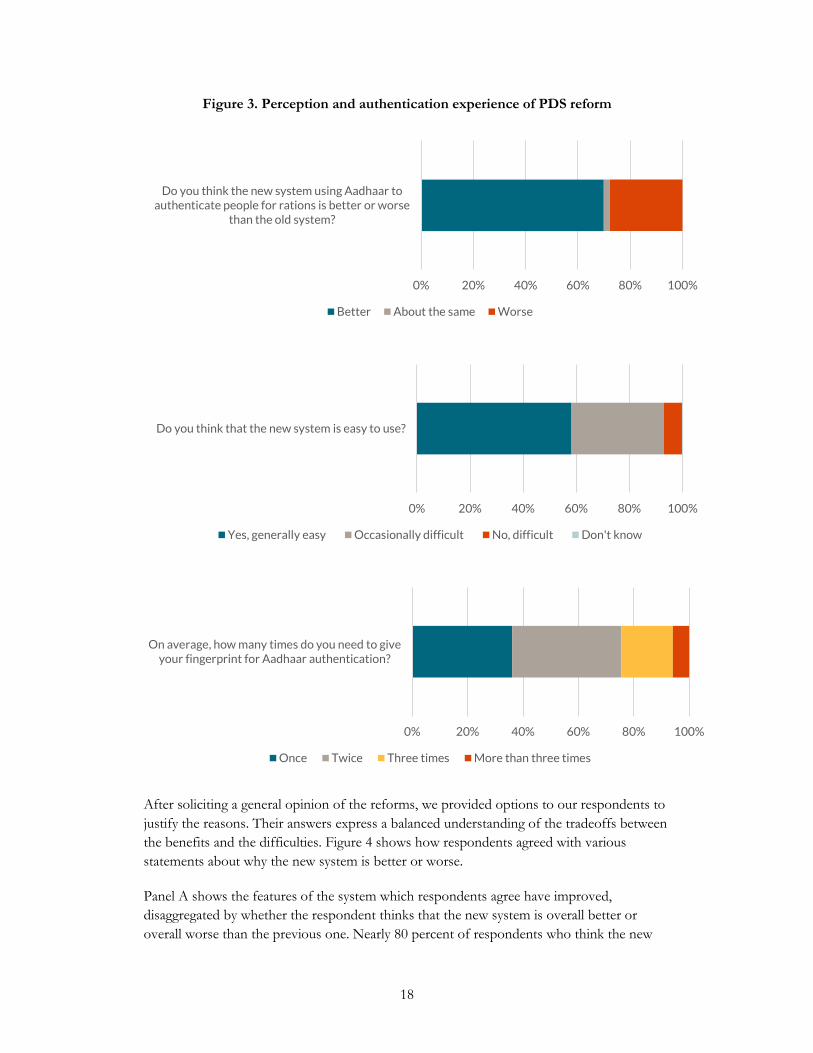
shows three sets of responses: their overall perception of the new system compared to the previous method without Aadhaar, the ease of use of the new system, and the Aadhaar authentication experience. Seventy percent respond that the new system is better, although 28 percent think that it is worse—a slightly higher level of both support and critical feedback than encountered in our Rajasthan survey. Fifty eight percent report that they find the new system easy to use while 7 percent find it difficult. Three-quarters of the respondents report being able to authenticate themselves after two tries on average, while 6 percent say it takes them more than three times to authenticate at the fair price shop.
Responding to a separate question, almost nine percent say that fingerprint authentication often fails altogether. Among these, 73 percent (6.2 percent of the full sample) report they are often told by FPS shop owners to return another day, and 54 percent (4.6 percent of the full sample) are asked to send another household member to authenticate. As we show in a later section, aggravating encounters between beneficiaries and the authentication system have a strong influence on the overall perception of the reforms.
18
Figure 3. Perception and authentication experience of PDS reform
After soliciting a general opinion of the reforms, we provided options to our respondents to justify the reasons. Their answers express a balanced understanding of the tradeoffs between the benefits and the difficulties. Figure 4 shows how respondents agreed with various statements about why the new system is better or worse.
Panel A shows the features of the system which respondents agree have improved, disaggregated by whether the respondent thinks that the new system is overall better or overall worse than the previous one. Nearly 80 percent of respondents who think the new
0% 20% 40% 60% 80% 100%
Do you think the new system using Aadhaar toauthenticate people for rations is better or worse
than the old system?
Better About the same Worse
0% 20% 40% 60% 80% 100%
Do you think that the new system is easy to use?
Yes, generally easy Occasionally difficult No, difficult Don't know
0% 20% 40% 60% 80% 100%
On average, how many times do you need to giveyour fingerprint for Aadhaar authentication?
Once Twice Three times More than three times

19
system is better (70 percent of all respondents) cite the elimination of diversion of rations as the main reason for their opinion. A similar proportion are happy about the improved timeliness of the delivery of food rations compared to the earlier system. Almost half of the respondents who hold positive view of digital reforms in PDS are of the opinion that these benefits have come without any offsetting negative features.
Considering now those respondents with an adverse view of the new system (28 percent of the total), only 30 percent (about 9 percent of all respondents) think that nothing at all has improved. Some 46 percent recognize that diversion has reduced while around 60 percent acknowledge that timeliness and weighing systems are better than in the earlier system. The survey therefore points to the reality that digitizing delivery systems may involve a mix of positives and negatives, and that these will be weighted differently by beneficiaries leading to differing overall views.
Figure 4. Tradeoffs in Beneficiary Experience of PDS Reform
Note: Denominators for each column represent the number of respondents who said that the new system was better (n = 390) or worse (n = 155).
Panel B focuses on factors that may contribute to a negative view. Authentication failures and increased transaction time are seen as the two main drawbacks of the new system, even by those who hold a positive overall view of the reforms. Among those viewing the new system as worse, fully 100 percent consider frequent authentication failures as a reason. Such uniform feedback makes it clear that the end-user interaction with authentication processes
0%10%20%30%40%50%60%70%80%90%
100%
Rations don’t get
diverted (+)
Grains aredelivered on
time (+)
Weighingsystem
improved(+)
Nothing hasbecome
worse (+)
A: New system is better because...
Better Worse
0%10%20%30%40%50%60%70%80%90%
100%
Nothing hasbecome
better (-)
Transactiontime
increased (-)
Auth.failures arefrequent (-)
B: New system is worse because...
Better Worse

20
is an important determining factor in the user’s perception of the introduction of Aadhaar for PDS food ration distribution.16
This is substantiated when we analyze the opinion of the new system disaggregated by authentication attempts. Figure 5 shows a clear downward trend in the relative proportion of beneficiaries who consider the new system better, as opposed to worse, as the number of authentication attempts reported increases. The better-worse ratio is very high for those who require only a single authentication attempt but falls about one at three attempts or more. Similarly, regarding the ease of use, the proportion of respondents who find it either occasionally difficult or difficult goes up with the number of authentication attempts needed. The power of these relationships—even in a situation where special efforts have been made to prevent authentication failure from leading to actual exclusion—suggests that policy makers need to focus on streamlining and improving authentication processes for digital governance reforms.
Figure 5. Perception of PDS reform by number of authentication attempts
Opinion of new PDS system?
Is the new PDS system easy to use?
Do certain groups see the picture differently to others? We have broken down the results by all our demographic characteristics. In general, our analysis fails to find statistically significant relationships between them and preference for digital reforms. Gender, age, type of dwelling, household size, declared income or landholding status might have been expected to correlate with experiences and preferences, but there are few systematic relationships. As might have been expected, older respondents do report more authentication problems than younger ones, but this does not carry over into preference differences. We do find some differences between the three categories of ration card holders (Figure 6): BPL respondents report less favorably than APL households on each of the three
16 The survey also offered the opportunity to flag other positive and negative aspects but few respondents took advantage of this option.
0%
5%
10%
15%
20%
25%
30%
35%
40%
Once Twice Three or more
Average number of attempts required to authenticate
Better Worse
0%
20%
40%
60%
80%
100%
Once Twice Three+
Average number of attempts required to authenticate
Easy Occasionally difficult Difficult

21
criteria—overall view, ease of use and attempts to authenticate. However, this progression does not carry on to the AAY households, supposedly the poorest group. Also, as noted previously, we have some uncertainty over the meaning of these classifications in the case of Andhra Pradesh. 17
Figure 6. Perception and authentication experience by category of PDS ration card
Note: Sample includes 83 APL card holders, 423 BPL card holders, and 56 AAY card holders.
Only one household attribute appears to be systematically related to views of the new system—the degree of self-declared dependence on the PDS system. Table 2 shows this relationship, disaggregated by the contribution of PDS to overall household food consumption. There is no significant difference in the views of those who report dependence of 0-25 percent and 25-50 percent, but respondents reporting higher dependence have a less favorable view of the new system. Moreover, this tendency is strongest for the most dependent group that reports relying on the system for 75-100 percent of their food supplies. These relationships are robust to controlling for the mandals where respondents reside, which makes location-specific explanations less likely.
At the same time, this may be an example where statistical methods focusing on the marginal probabilities obscure the larger picture that emerges from the data. Figure 7 shows the underlying responses using the same categories as the analysis in Table 2. These figures show generally less positive views among the category that reports most reliance on the PDS system. They report needing more efforts to authenticate, and fewer think that the new system is easy to use. Nevertheless, even among this group that relies on PDS the most, 59 percent think that the new system is better than the previous one. So far, we have not been able to identify a category of respondents who think it worse.
17 Note that majorities of all three categories still express positive perceptions of the new system and their encounters with it. (We would consider two attempts at authentication to be within the bounds of a successful authentication experience).
0% 50% 100%
AAY
BPL
APL
Is the new PDS system easy to use?
Easy Occasiona Difficult
0% 50% 100%
AAY
BPL
APL
What is your opinion of the new system?
Better About the same Worse
0% 50% 100%
AAY
BPL
APL
How many attempts on average to authenticate?
Once Twice Three+

22
Putting these two results together suggests a useful approach towards the difficult task of balancing efficiency and equity criteria. Any association suggesting that those most reliant on the system for their food security are the most likely to encounter problems is cause for concern on grounds of equity. However, this is mitigated if the group still finds the system an improvement. This approach could be used to assess other system reforms.
Table 2. Perception and authentication experience by importance of PDS in household consumption
Is new PDS system easy to use? Opinion of new system How many times to
authenticate?
Pctg of food from PDS
rations Easy
Occa-sionally difficult
Difficult Better About
the Same
Worse Once Twice Three or More
0 to 25 (n=78)
-0.0815 0.0633 0.0182 -0.0303 0.00167 0.0287 0.0241 -0.00637 -0.0178 (0.171) (0.164) (0.208) (0.593) (0.584) (0.593) (0.661) (0.681) (0.653)
25 to 50 (n=289) Base case Base case Base case
50 to 75 (n=112)
-0.166** 0.124** 0.0422* -0.112* 0.00519* 0.107* 0.000712 -0.000167 -0.000545 (0.002) (0.002) (0.013) (0.031) (0.046) (0.032) (0.988) (0.988) (0.988)
75 to 100 (n=83)
-0.266*** 0.185*** 0.0811** -0.160** 0.00656* 0.154** -0.112* 0.00634 0.105* (0.000) (0.000) (0.002) (0.007) (0.015) (0.008) (0.020) (0.472) (0.039)
Observations 557 557 557 558 558 558 562 562 562
p-values in parentheses: * p<0.05, ** p<0.01, *** p<0.001 Values represent the marginal probability (calculated from an ordered logistic regression and relative to the base case) that a respondent in the row category responds with the answer in the column title. E.g. respondents for whom PDS rations represent 50-75 percent of their monthly food intake are 16.6 percent less likely than those for whom PDS rations represent 25-50 percent of their monthly food intake to report that the new PDS system is easy to use.

23
Figure 7. Perception and authentication experience by importance of PDS in household consumption
5.2.2 Inconvenience or exclusion? Handling technological failures
In order to ensure that genuine beneficiaries are not excluded from obtaining their food rations, the government has implemented several alternative protocols and methods for authentication and verification. As noted earlier, the ePoS machines can switch between alternative wireless service providers reducing the chances of authentication failures due to problems in connectivity. The latest version of these machines integrates fingerprint and iris scan capability, as well as the option to send a geotagged time-stamped photograph: this is used for pensioners who are otherwise not able to authenticate themselves.
Nevertheless, it does not always appear that the full range of protocols is followed in every case of technology failure. Responses suggest a range of likely follow-up actions: 21 percent of the beneficiaries report recourse to iris while only one percent report using a one-time-password (OTP)18. Twenty one percent cite recourse to the VRO. However, three-quarters of our respondents report that FPS owners may tell them to return another day when authentication fails or request them to send another household member listed on the ration card. FPS owners thus often throw the burden of failure back onto the beneficiaries. This can be a source of major inconvenience unless fingerprint failures are indeed very rare.
Does the problem extend beyond inconvenience to actual exclusion? Of our sample, only 12 respondents (2 percent) reported having actually being denied rations at some point over the last 12 months because of technology authentication failure.19 Seven resorted to the VRO to resolve the problem; 3 to the Sarpanch and 2 to the District Supply Officer. Ten of the 12
18 Iris scanners were only distributed to all FPS owners in August 2018, while this survey was carried out in June–July 2018, so it is possible that this finding underestimates current iris scan usage. OTPs have been discontinued in AP so that these responses would have been based on recall. 19 The other reason given is that rations were not available at the time.
46%
52%
65%
55%
0% 50% 100%
75-100
50-75
25-50
0-25
Is the new PDS system easy to use?
Easy Occasionally diff. Difficult
59%
64%
75%
72%
0% 50% 100%
75-100
50-75
25-50
0-25
What is your opinion of the new system?
Better About the same Worse
31%
40%
36%
36%
30%
33%
42%
47%
0% 50% 100%
75-100
50-75
25-50
0-25
How many times to authenticate?
Once Twice Three or more

24
cases report that the matter was resolved within 7 days. This, together with qualitative feedback from the discussion groups, suggests that incidents of actual exclusion from the PDS system for reasons of technology failure are very rare. The results support the findings of the State of Aadhaar Report which find that the incidence of reported exclusion in AP state is extremely low.20 Feedback also offered examples of other policies to limit exclusion. The elderly and bed-ridden may nominate another person to lift rations on their behalf.
Another way to reduce exclusion is through beneficiary feedback, which can be used to track cases of denial of rations and encourage prompt action. As described in Section 5, our qualitative survey reported at least one instance where a fair price shop dealer, who had sent away a customer after fingerprint authentication failed, was contacted within a few minutes of the failure and instructed to recall the customer and use an alternative method to authenticate. The system may not work routinely in this way, but it illustrates the potential of a real-time governance system to track service delivery in real time.
5.2.3 Expanding choice: portability, stock management and the supply chain
Portability enables beneficiaries to authenticate and lift their ration from any FPS outlet in the state. This empowers beneficiaries to choose providers on the basis of quality of service delivery, in addition to providing greater flexibility to intra-state migrants who were disadvantaged by the earlier system. Twelve percent of respondents reported actively using portability, of whom 82 percent viewed the option positively. Two-thirds of these report that they appreciate it because they can go to a dealer who gives better service, notably the right quantity of grains. Nearly half cite the geographic flexibility offered by portability if they are away from their home location. Finally, 43 percent value the option to go elsewhere if one FPS shop is closed.
Considering views from the supply side, all but two of the FPS dealers we surveyed report having served people outside of their designated area. Eighty seven percent of FPS owners are of the view that portability is good for them. Major reasons include an increase in customers from other areas, higher incomes, and greater flexibility to close the shop without inconveniencing customers. All five of the dealers who thought portability was not good for them said that it reduced their income; we cannot isolate the reasons, but it is possible that this reflected greater consumer choice reducing demand for poor service.
As noted previously, portability requires allowing dealers some flexibility on carry-over stocks from month to month. The digital re-stocking system allows dealers to draw up to 20 percent extra rations over their allotted limit on a monthly basis. Officials can monitor the overall monthly draw on FPS shops in real time, to adjust the baseline amount as needed when replenishing stocks.
For this system to work, it is essential to ensure that the actual deliveries to the FPS correspond to the levels that are supposed to be. As noted, digitalization of the supply chain
20 The State of Aadhaar Report (IDinsight, 2018, p. 24) found the lowest exclusion rates in AP, with 0.3% reporting exclusion due to non-Aadhaar reasons and 0.8% due to Aadhaar reasons only.

25
was introduced to prevent the diversion of grains and other supplies higher up in the chain. The system tracks movement of grains from the central warehouse to mandal-level warehouses and then to FPS shops using GPS-tracked trucks following predetermined routes, weighs the foodgrains electronically at each transfer point, and requires dual biometric verification for the transfer from truck to FPS. Dealers are required to assess their stocks, place orders, and make payments on a monthly basis.
Ninety four percent of the FPS owners find the digitized supply chain system better than the previous system. The proportion of owners who report getting the right quantity of supplies increased by 12 percentage points with the introduction of the GPS system to 98 percent. The same group uniformly says it is better because the grain supply is more timely and that they get the right quantity of grains. These reforms appear to reduce diversion in the supply chain and enable better stock management, which in turn increases the level of accountability for FPS dealers and facilitates portability. At the same time, the previous system was apparently not a disaster; only 17 percent reported that they did not receive the promised quantity of grains before the reforms. 21
5.2.4 Cashless transactions
The last major reform that we consider here was the introduction of cashless PDS payments following the India-wide demonetization of November 2016. Krishna district piloted the proof of concept which was quickly scaled up to include all PDS outlets in the state. The cashless payment system allowed beneficiaries to pay for their rations using a direct transfer from a bank account linked to their Aadhaar registration. As Figure 8 shows, official data indicates that the proportion of cashless transactions in Krishna increased very quickly and peaked at 83 percent in May 2017. While the general shortage of cash in the aftermath of demonetization forced many to use the cashless mode, the move was also supported by strong government directives, a widespread public information campaign and incentives such as lucky draw prizes.
However, unlike the other reforms examined in this study, there has been a major reversal; the proportion of cashless payments has retreated significantly as the effect of demonetization waned and cash came back into circulation. It had declined to around 10 percent at the time of our survey in June 2018.
21 Two respondents (4 percent) say it is worse because grain supplies are delayed and a separate pair say that they get less quantity of grains. However, in an apparent inconsistency, all four respondents also agreed that the grains were both delivered in a more timely fashion and that they received the right amount of grain.

26
Figure 8. Cashless transactions in PDS
Source: https://epos.ap.gov.in/ePos/pos_abstract.jsp
In contrast to the official figures, 27 percent of our respondents report that they use cashless payments. There may be two reasons for the difference. First, there may be limited overlap between people who pay through cashless mode every month. Second, the official figure only represents cashless transaction through the Aadhar-enabled payment system (AePS) available on PoS devices at PDS shops. Many dealers now offer alternative modes of digital payments, including through Unified Payment Interface (UPI) apps, mobile wallets and credit or debit cards. This may be easier for the customer but raises the problem of linking that particular payment to the particular transaction set out in the e-POS.
For those who do use cashless payments, the main reason cited was that it eliminates the need to provide small change for PDS purchases. For those who do not use cashless, among other responses, 44 percent indicate that they do not trust the system, but this still leaves a majority that apparently do. However, 71 percent of respondents report as a problem the inability to check their bank account balance to ensure that they have sufficient funds to make the payment. In addition to possible constraints relating to digital capacity, an apparent reason is that the electronic transactions are made through the e-POS machine do not enable the customer to check the balance on his or her account.
A variety of concerns would need to be addressed to encourage beneficiaries to shift back to digital payments for PDS on a large scale. The reporting of cashless transactions would also need to include all methods of digital payment, not only those undertaken through the e-PoS at the fair price shop.
0%
10%
20%
30%
40%
50%
60%
70%
80%
90%
Nov
-16
Dec
-16
Feb
-17
Mar
-17
May
-17
Jul-
17
Au
g-1
7
Oct
-17
Dec
-17
Jan
-18
Mar
-18
May
-18
Cashless transactions in Krishna (as a percentage of total transactions)
2016 2017 2018

27
Interestingly, we do find strong associations between being a cashless user and more positive views of the reforms. Cashless users rate ease of use more highly, report easier authentication experiences, and offer better opinions of the new PDS system. The causal pathways of this association are quite debatable. Do cashless users have better outcomes and perceptions of the new system because they are already predisposed to like and adopt new technologies? Or, have they simply enjoyed a smoother transition to the new system, enabled in part by cashless payments? Either way, the smaller subsample of self-reported cashless users is among the groups which appear to have better overall perception of Aadhaar based PDS reforms than the average beneficiary.
From the FPS owners’ perspective, just under half used cashless transactions at the time of the survey. Of these, 40 percent said they were using it to comply with government instructions but 81 percent found it easier than cash. A few FPS owners lamented that they lost out on extra revenue because cashless payments provided for exact change.22 Dealers also noted that non-ration items could not be billed through the e-PoS machines in the same transaction as for rations, and that this increased the complexity of payment for customers who might have wanted to purchase a wider range of products—something that is being encouraged through the conversion of FPS into “Village Malls”.
If cashless is to move forward for PDS, the functionality of the payments ecosystem would need to be upgraded to also make it easier for FPS owners to offer better user experience for beneficiary-customers going forward.
5.2.4 Further insights from qualitative surveys
Two issues flagged through qualitative feedback and affecting the PDS system bear mentioning here. First, unreliable mobile connectivity remains as a technical constraint that contributes to dissatisfaction with the new reforms. As noted, the ePoS machines used for authentication can accommodate up to two SIM cards to allow network flexibility. The government identified the networks with the strongest signal for each FPS outlet and initially paid for both.23 Even with these improvements, a large majority of FPS dealers reported that connectivity was sometimes a problem for authentication. The state government was making major efforts to improve connectivity, including rolling out fiber-optic cable to every FPS, but more needs to be done to address this obstacle.
Second, even though efforts have been made to minimize digital exclusion, this does not mean that exclusion does not exist for other reasons. Our focus groups confirmed a bottleneck already identified by the government in the ration card enrolment process. After new applicants have submitted all necessary documents and completed the physical and document verification steps, the process calls for their applications to be sent to the local
22 Allowing FPS dealers to round up to the nearest INR 10 is a norm that allows them to make a bit more money off of each non-rounded transaction, but eliminating this practice should not be missed by beneficiaries. 23 The government now pays the cost for the network that the dealer identifies to have the best signal strength in his or her area

28
Janmbhoomi committee for approval24. However, this approval stage can reportedly take up to two years, and some respondents complained that the committees have become politicized. The government had identified this blockage, and has utilized the statewide Smart Pulse Survey to identify eligible households, bypassing the Janmbhoomi committees to issue new ration cards. However, the frequency of surveys and data errors still constitute problems.
5.2.5 Savings from PDS digitization
It is not possible to provide a complete picture of fiscal costs and savings of moving towards digital governance in AP but we can offer some partial and indicative estimates for the reform of the public distribution system (PDS).
Savings estimates are based on (i) the numbers of ration cards and units before and after the Aadhaar seeding exercise; and (ii) the unclaimed stocks remaining in the FPS that dealers could have diverted in the absence of effective stock-flow reconciliation. These estimates of the savings from cleaning the rolls and preventing diversion do not include savings that may have been generated by reform of the supply chain down to the FPS level, including mechanisms to ensure accountability as stocks are passed down from one level to the next.25
As already noted, AP, like most other South Indian states, has traditionally maintained a relatively generous social safety net. Table 3 shows the numbers of ration cards and units before and after the Aadhaar seeding process for Krishna District and for AP, which, in PDS terms, is about 11.5 times as large as Krishna. The percentage decline in units was larger than that for cards since the exercise captured changes in family composition that reduced, on average, the number of members per family. The table also shows the implied savings in rice rations corresponding to the reduction of ration cards.
As repeatedly stressed by the government, the reduction in the number of beneficiary cards did not reflect a deliberate policy to exclude actual beneficiaries who had previously been receiving rations. Even after the reduction, the PDS roll amounted to over 70 percent of the population, so that central government funding covered only about 65% of AP’s total roll.26 Even though this creates powerful incentives for AP to derive savings from reforms, the approach has been to first try to secure them from improvements in implementation before embarking on a radical restructuring of programs and eligibility. 27 28 This contrasts with the
24 Janmbhoomi committees are a sub-committee of the Village Development Committees tasked with implementing government welfare schemes and handling face-to-face interactions with beneficiaries. 25 The costs cited for the digital reforms do, however, include some related to the supply chain. 26 Central government funding also only covers funding for the rice subsidy; the costs of the rest of the package are covered from the state budget. The reduction in ration card units does not allow for the additional registration of some new, legitimate beneficiaries who, we understand, were added at the same time, since this is not a “cost” of digitization. 27 We were advised that the Smart Pulse Surveys included information that could have been used to trim the PDS rolls but that this policy had not yet been employed for this purpose. 28 An issue on the table at the time of our third visit, in November 2018, was on how savings from implementation should be divided between the central and state governments. Not surprisingly, the position of

29
approach taken in Rajasthan, where the digitization process was accompanied by a contentious effort to pare back the number of recipients to the levels supported by central government (Gelb, Mukherjee, and Navis, 2018).
A second component of savings comes from effective stock reconciliation, preventing the diversion of products that are carried forward by dealers between months and not picked up by the intended recipients. On average, the share of ration units taken up is reported at around 87%. It may seem surprising that as much as 13% of allocated rations is not collected (even with the added convenience provided by portability), but this is perhaps related to the relatively wide access to enrolment permitted for the social safety net. Table 4 illustrates estimated savings in Krishna from averted diversion in terms of subsidized commodities and total rupees for the period May–August 2015. From the 35-month record of these savings (May 2015–March 2018) the average comes to Rs 5.13 crore per month and the share of the rice subsidy represents 80%. This percentage agrees with the proportion as calculated from the standard allocation bundle of ration commodities.
Table 3. Reductions in PDS cards and units on Aadhaar seeding
S.No. Particulars Andhra Pradesh
Krishna
1 No. of BPL Ration Cards existing prior to Aadhaar seeding 13,530,437 1,190,012
2 No. of BPL Ration Cards after Aadhaar seeding 12,631,004 1,130,319
3 No. of Cards reduced on Aadhaar Seeding 958,533 26,603
4 No. of Units existing prior to Aadhaar seeding 42,598,529 3,631,475
5 No. of units after Aadhaar Seeding 34,879,488 3,237,378
6 Net Reduction in Units after Aadhaar Seeding 7,719,041 392,157
7 Implied Saving in Rice Quantity per Annum (in MTs) 403142.46 16940.943
Source: Government of Andhra Pradesh
the AP government was that since any savings would derive from measures that they had implemented, any savings should accrue to them.
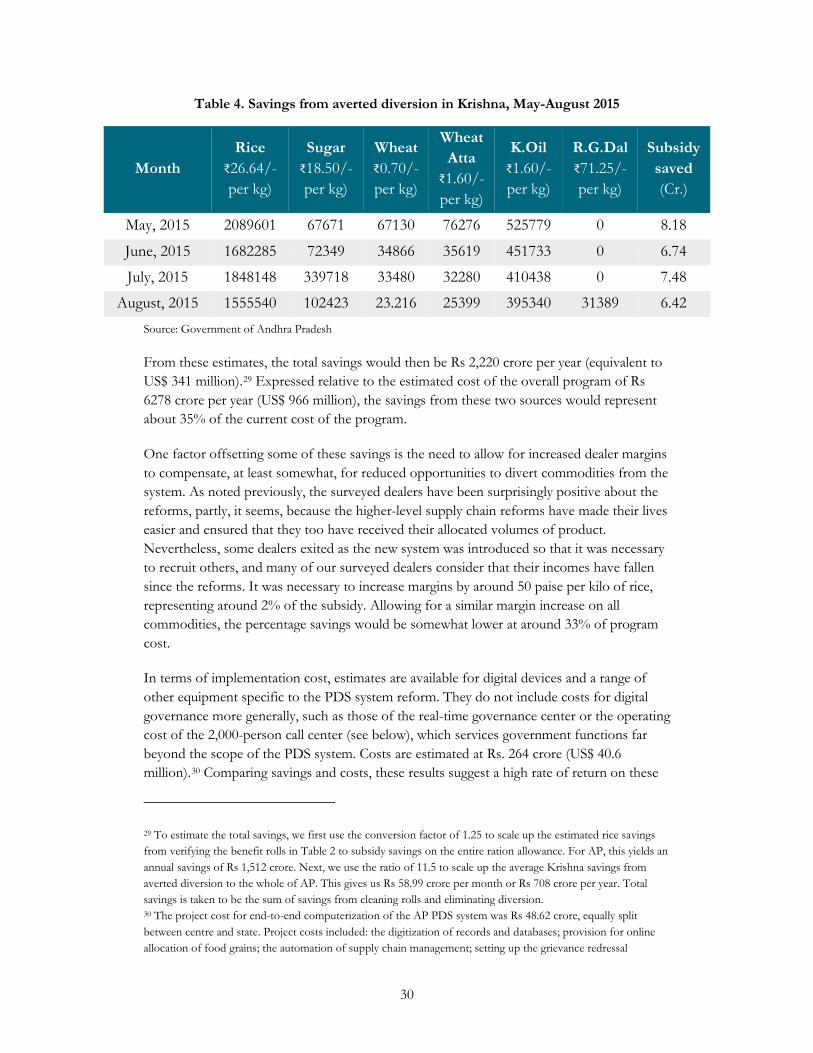
30
Table 4. Savings from averted diversion in Krishna, May-August 2015
Month Rice
₹26.64/-per kg)
Sugar ₹18.50/- per kg)
Wheat ₹0.70/- per kg)
Wheat Atta
₹1.60/- per kg)
K.Oil ₹1.60/- per kg)
R.G.Dal ₹71.25/- per kg)
Subsidy saved (Cr.)
May, 2015 2089601 67671 67130 76276 525779 0 8.18
June, 2015 1682285 72349 34866 35619 451733 0 6.74
July, 2015 1848148 339718 33480 32280 410438 0 7.48
August, 2015 1555540 102423 23.216 25399 395340 31389 6.42 Source: Government of Andhra Pradesh
From these estimates, the total savings would then be Rs 2,220 crore per year (equivalent to US$ 341 million).29 Expressed relative to the estimated cost of the overall program of Rs 6278 crore per year (US$ 966 million), the savings from these two sources would represent about 35% of the current cost of the program.
One factor offsetting some of these savings is the need to allow for increased dealer margins to compensate, at least somewhat, for reduced opportunities to divert commodities from the system. As noted previously, the surveyed dealers have been surprisingly positive about the reforms, partly, it seems, because the higher-level supply chain reforms have made their lives easier and ensured that they too have received their allocated volumes of product. Nevertheless, some dealers exited as the new system was introduced so that it was necessary to recruit others, and many of our surveyed dealers consider that their incomes have fallen since the reforms. It was necessary to increase margins by around 50 paise per kilo of rice, representing around 2% of the subsidy. Allowing for a similar margin increase on all commodities, the percentage savings would be somewhat lower at around 33% of program cost.
In terms of implementation cost, estimates are available for digital devices and a range of other equipment specific to the PDS system reform. They do not include costs for digital governance more generally, such as those of the real-time governance center or the operating cost of the 2,000-person call center (see below), which services government functions far beyond the scope of the PDS system. Costs are estimated at Rs. 264 crore (US$ 40.6 million).30 Comparing savings and costs, these results suggest a high rate of return on these
29 To estimate the total savings, we first use the conversion factor of 1.25 to scale up the estimated rice savings from verifying the benefit rolls in Table 2 to subsidy savings on the entire ration allowance. For AP, this yields an annual savings of Rs 1,512 crore. Next, we use the ratio of 11.5 to scale up the average Krishna savings from averted diversion to the whole of AP. This gives us Rs 58.99 crore per month or Rs 708 crore per year. Total savings is taken to be the sum of savings from cleaning rolls and eliminating diversion. 30 The project cost for end-to-end computerization of the AP PDS system was Rs 48.62 crore, equally split between centre and state. Project costs included: the digitization of records and databases; provision for online allocation of food grains; the automation of supply chain management; setting up the grievance redressal

31
digital investments. The costs of the items included in this estimate would be recovered by some 2 months of total savings or around 5 months of savings from averted diversion alone.
These estimates are, of course, specific to Krishna and AP, and they may not extrapolate automatically to programs in other states. They depend on the possibility of making substantial savings in both the benefit rolls and by reducing diversion. The first reflects, among other things, the initial conditions prevailing before reform and the degree of “slack” in the ration card system. Regarding the second, it is possible that, because of the efficiency of stock-flow reconciliation, dealers in AP have been permitted to carry forward larger volumes of stocks than would otherwise have been the case, and that the savings from preventing diversion appear correspondingly higher. High carryovers—which are important to ensure that rations are available when requested and to give slack for portability—no longer run the risk of being diverted by dealers. Nevertheless, the estimates suggest that investment in digitized systems can produce a high rate of return while, at the same time, improving service quality.31
5.3 Delivery of social pensions: flexible benefits transfer design
5.3.1 Overview and timeline of pension reform
India’s social pension system provides a monthly subsistence payment to persons who qualify for old age, widow or disability benefits as per the norms of the National Social Assistance Program. State governments can supplement the base amount provided by the national program and can determine the mode of delivery. Compared to other states, Andhra Pradesh has a generous social pension system. As shown in Figure 9, it has experimented with several alternative delivery mechanisms over the last decade.
Traditionally, gram panchayat (village government) offices had distributed monthly pensions but the process was marred by complaints about lack of timeliness of payments, bogus beneficiaries and petty corruption. From May 2009, the system changed to direct deposits into a designated private bank, requiring beneficiaries to open accounts in order to receive their pensions. In 2015, pension distribution shifted to post offices; there had also been a major increase in the amount of the pension from Rs.200 to Rs.1000 the previous year following the election of a new government.32 However, the 2 percent commission charged
mechanisms; and the automation of the FPS. In addition, AP purchased its e-PoS machines while most of the other states leased them; this required an additional Rs 215.42 crore (representing 142.66 crore for e-POS and Iris readers with the rest for service, maintenance and other expenses) resulting in a total investment cost of around Rs 264 crore. 31 Although it is not specific to the PDS system, we can also make a comparison with the cost of the call center maintained by the government. There are 2000 call responders; we might budget them at ₹200,000 per year which is the pay at a low level for AP government employees. This would put the cost at ₹40 crore per year, about 1.8 percent of the estimated level of savings on the PDS system. 32 On January 25, 2019 AP revised its pensions; old age and widow from 1,000 to 3,000, and disabled from 1,500 to 3,000.

32
by the postal department was considered too high. The government shifted back to DBT—direct benefit transfers to Aadhaar-linked bank accounts—within six months of initiating the change, resulting in uncertainty and disruption of the system. The intention was to enable pensions to be withdrawn close to home through mobile business correspondents (BCs), but the negotiated fee structure (a commission of only 0.2 percent) left them inadequately incentivized to serve pensioners. This resulted in inconvenience, especially to the elderly and infirm, who would need to visit bank branches to cash out.
In January 2018, the government made the final change. It reverted back to the earlier system of pension distribution from panchayat offices, but this time requiring Aadhaar authentication at the point of pension delivery. To minimize the chance of exclusion, VROs were authorized to authenticate on behalf of beneficiaries unable to do so themselves. In 2018 a portability option was introduced, enabling pensioners to be paid at any panchayat office in the state. Forty percent of the gram panchayats in Krishna now offer this facility, but it has, so far, been little used; currently, only 912 pensioners take advantage of it.
Figure 9. Alternative modes of social pension delivery, 2009–2019
This reversion to direct government distribution offers a notable counterpoint to the trend, in India and elsewhere, of providing social assistance via direct benefit transfer through the banking system. In considering the motivation for such a change, one could imagine two competing hypotheses. First, the recentralization of the process into the hands of the bureaucracy reflected efforts to re-establish control of the distribution process to recapture rents. Second, the change in the distribution channel addressed the perceived weakness of the banking correspondent network and aimed to provide a better cash-out option for beneficiaries. In our survey, we sought to resolve this question by asking beneficiaries to compare the previous and current mechanisms of pension distribution.
03
04 02
01 05
Pre-2009
Panchayat based pension
distribution (manual)
May 2009 - Dec 2014
Cash based pension
distribution through
Axis banks/BCs
Jan 2015 - June 2015
Pension distribution
through post office
(Aadhaar authentication)
June 2015 - Jan 2018
Direct benefit transfer in
bank accounts
Jan 2018 - Present
Through Panchayat (Aadhaar
authentication)

33
5.3.2 Pensions sample: overview and analysis
Our sample of pensioners include 482 respondents, of whom 71 percent are female. Two-thirds have no formal education, 79 percent are rural with a mean age of 57.33 Most of our sample report retrieving their pension payments from a panchayat office, although 10 percent say that the panchayat officers come to their home to deliver their pension.
We asked beneficiaries to compare the current panchayat system to the DBT mode through the banks and also to the earlier system of distributing pensions through the post office. They expressed strong preferences for the panchayat system. Eighty six percent preferred it compared to the bank/BC delivery method. For those who had the experience of the post office system, the reaction was similar: 84 percent preferred the panchayat based cash distribution. We also asked the pensioners about their experience with the panchayat system. Did they need to pay commissions to officials to receive pensions? Only 2 respondents answered in the affirmative, indicating that bureaucratic rent seeking does not seem to be the reason for this change. We also asked whether they were not comfortable having officials present when they received their pensions. Again, very few agreed with this, suggesting again that the rent-seeking hypothesis is not the main reason for the change.
We asked all respondents what they thought was better or worse about the new system relative to both of the two previous systems.34 Figures 10 and 11 describe the results disaggregated by whether or not the respondent thought that the new system is, overall, better or worse than, respectively, the bank system or the post office. As with the PDS system, respondents display a high level of nuance in their perceptions. Positive reasons cited by both groups (Figures 10 and 11) included receiving the correct amount and timely payment. The major drawbacks, mainly by the small number of ‘worse’ responses, related to irregular panchayat office hours and the need to make multiple visits. Overall, there appears to be overwhelming support and preference for direct cash disbursal with Aadhaar authentication over direct transfer through banks—an example of a flexible service delivery mechanism that addresses challenges faced by beneficiaries to access their entitlements.
The survey response, therefore, appears to bear out our second hypothesis—that the last mile banking channel was not functioning as expected. Interviews with beneficiaries, business correspondents, bank and local government officers provide more information. The direct bank transfer model assumes that beneficiaries would prefer direct transfer since they can easily access their pensions either through bank branches or mobile BCs, who can disburse cash on the basis of Aadhaar authentication. However, contrary to our expectations, this option seemed not to work smoothly for several reasons. First, accessibility to bank branches is a challenge, particularly for the elderly, most of whom prefer
33 This data reflects the mean age of respondents who answered yes to a question asking whether they or anyone in their household receives a social pension, so the true age of the pension recipient may be higher than this. 34 Due to an error in the survey instructions, the respondents who think the new system is worse were not asked about the possible factors which are better in Figure 11. However, because the number of “better” respondents far outweighs the number of those who thought the new system was worse (Panel A) this introduces only a minor conservative bias to the results of Panel B.

34
to withdraw the entire amount in cash at the beginning of the month Second, the coverage of BCs is not ubiquitous and the incentive for them to distribute pension is very low—they receive only Rs.2 for disbursing the pension amount of Rs.1000—about ten percent of the commission from other banking transactions. 35 This is compounded by a third factor; the low overdraft limit set by the banks. BCs can serve at most 20 beneficiaries in a single trip even though the demand for their services could be considerably higher in their area of operation; more than this would require a time-consuming return to their bank. In addition, BCs have little option but to refer beneficiaries to bank branches in case of failure to authenticate through Aadhaar. In contrast, as noted below, this problem can be resolved through VRO authentication in the panchayat-based delivery system.
It is possible that the failure of the bank-based DBT model largely reflects a less-than-adequate incentive structure for the banking system to deliver pensions. The additional transactions costs of the current direct payment model for government officials is not clear. More research on “last mile” delivery options and costs would be useful.
35 The average cash-out fee for a number of mobile money systems, including M-Pesa and BKash, is around 2 percent (Amin, 2014). This suggests that the 0.2 percent fee offered to the BCs is indeed low relative to alternative systems.

35
Figure 10. Perception of Aadhaar-Panchayat pension distribution system, compared to the previous bank/BC system
Note: Denominators for each bar represent the number of respondents who said that the new system was better (n = 326) or worse (n = 51). Gray bars in the right-hand graph represent missing data.
326, 86%
51, 14%
The present system compared to the old bank/BC system is…
Better Worse
0% 20% 40% 60% 80% 100%
Pension more regular (+)
Get the correct amount (+)
There is never a shortage of cash (+)
Still get pension even if auth. fails (+)
No need to travel to bank/BC to get cash(+)
Panchayat office far from my home (-)
Panchayat office hours are irregular (-)
Need to go more than once to collect mypension (-)
Panchayat officer irregular, have to followup (-)
Takes more time to collect pension (-)
Used to do do other transactions with BCat same time (-)
Prefer to collect pension without officialspresent (-)
I need to pay to get my pension (-)
Better Worse

36
Figure 11. Perception of Aadhaar-Panchayat Pension Distribution system, Compared to the Post Office.
Note: Denominators for each bar represent the number of respondents who said that the new system was better (n = 258) or worse (n = 48).
5.3.3 Steps to mitigate exclusion of beneficiaries
We asked pensioners what they would do if their fingerprint authentication failed. Eighty percent indicated that they would request the VRO to authenticate on their behalf. This suggests a high degree of awareness about the processes mandated in cases of biometric failure. 36 Twenty percent cited using iris while 2 percent suggested manual authentication using a photograph. Krishna is experimenting with face recognition as a way to further reduce the range of bureaucratic discretion in cases where human backup is required; there have been concerns that too much reliance on discretion may have opened up the possibility of some questionable transactions. Integrated readers are now being tested that can capture fingerprints, iris and face.
Having the VRO option handy is surely one of the attractions of collecting the pension at the panchayat office rather than from a bank correspondent—even if one is available to service the location. In the first case, the manual backup should be close at hand; in the second, there may be no other options for the BC than to direct the pensioner to go to the bank office or to offer to come back again another day. In addition, panchayat offices are often located not too far away from the local FPS, making it convenient for pensioners to combine pension and ration pickup in one visit.
36 All nine respondents who noted there had actually been an occasion when they did not receive their pension due to authentication failure said that they had requested the VRO to withdraw on their behalf, indicating that they had utilized this form of exception management.
258, 84%
48, 16%
The present system compared to the old
post office system is…
Better Worse
0% 20% 40% 60% 80% 100%
Pension more regular (+)
Get the correct amount (+)
Don't need to pay postman for delivery (+)
No need to travel to the post office tocollect (+)
Panchayat office is far from my home (-)
Panchayat office hours are irregular (-)
Need to go more than once to collect mypension (-)
Panchayat officer irregular, have to followup (-)
I need to pay to get my pension (-) Better Worse

37
5.3.4 Improving efficiency through portability
The new pension distribution system has also introduced portability similar to that for the PDS. Our survey, however, revealed low awareness of this option, and indeed, only 912 beneficiaries had enrolled for this option across all of AP as of October 2018. Compared to PDS, where portability was introduced after digitization of supply chain and stock management were put in place, it appears that the absence of real-time cash reconciliation across panchayat accounts is one of the limitations of the current system. Portability does require greater effort on the part of the administration to eliminate double-counting, and to track beneficiaries who are may use the VRO rather than direct Aadhaar authentication. Beneficiaries were generally in favor of portability and its potential to help them increase convenience and save time and travel costs. AP could readily increase the flexibility of pension delivery, perhaps even offering a choice between panchayats and banks, with some modest improvements in the backend of the funding system.
5.3.5 Qualitative survey insights
Our focus groups revealed a few other insights about the pension delivery system. As with the PDS, Janmbhoomi committees have proved to be a bottleneck in the application approval process. To circumvent this problem, the state government has used the Smart Pulse survey as a mechanism to automatically enroll beneficiaries who fulfill the pension eligibility criteria. Focus group participants confirmed that the panchayat model is preferred to bank transfer. The majority of beneficiaries reported having pensions delivered at home in the first week of every month. Participants were not all fully comfortable with banks. Some recounted experiences where pensions were not credited but BCs withdrew funds from their savings account without authorization, further reducing their trust in the direct benefit transfer method. However, the return to a panchayat-based distribution system—even one verified by Aadhaar authentication—leaves more room for human intervention leakage than is ideal and we were told that some suspicious transactions by VROs had been flagged. This has motivated the administration to strictly monitor cases of authentication failure and use alternative methods of Aadhaar verification, including the piloting of facial recognition technologies to further shrink the range of human discretion.
5.4 The digitization of land records: differential benefits for landowners and tenant farmers
5.4.1 Overview and Timeline
As set out in the Indian Constitution, the management of land and collection of land revenue is a key responsibility of the State governments. In rural areas, land records form the basis for farmers to receive a variety of government benefits, inputs such as seeds and fertilizers, as well as agricultural credit. Proving titles and demarcating boundaries can be complex because of traditional, paper-based systems of recordkeeping, leading to disputes over property rights and cumbersome legal processes related to sale and transfer of land.

38
To address these challenges, the digitization of land records started at the national level in 1998 with most states moving to a system of electronic land titles and deeds. Andhra Pradesh has built on this initiative, by seeding the digitized land records with Aadhaar thereby linking the physical land holding to a unique personal identifier. As a further extension, from November 2018, Andhra Pradesh has used satellite imagery, GPS and drones to accurately geofence and assign a unique 11-digit Bhudhaar number to every digitized parcel of landholding, with Krishna as one of the first districts to implement the scheme in the state.
Aadhaar based land record digitization is seen as an important advance in the move towards more efficient and transparent system of land management which could help to reduce transactions costs in providing services and benefits to the farm sector. However, there is still little empirical evidence on how these changes affect landowners and tenant farmers.
5.4.2 Land records sample overview and analysis
Our survey questionnaire included a module on perception and experience of the Aadhaar-based land record digitization process. This was administered to a sub-sample of 185 land owners and/or tenant farmers who fulfilled our selection criteria. The sample of land owners and tenant farmers is almost exclusively rural, with only a few cases of urban residents owning agricultural land. Awareness about Aadhaar linkage is not universal—37 percent of respondents stated that they were not aware that all land records must be digitized through Aadhaar. Among the 63 percent that were aware, Figure 12 shows that three-quarters of them had digital land record certificates. These 87 respondents—all landowners—formed the basis of our investigation into the perceptions of, and experiences with, the new system.

39
Figure 12. Awareness and use of digital land records
Our survey indicates that digital land records are providing the expected benefits to land owners judging by the near-universal preference for the new system (85 out of 87 cases). The only two dissenters both took issue with land measurements and difficulties with resolving inaccuracies. As shown in Figure 13, ease of proving ownership and greater transparency in administrative processes are cited as the main reasons for the positive view of the reforms.
No, 37%
Yes, and I have one, 75%
Yes, but I do NOT have one,
25%
Yes, 63%
A: Are you aware that all land records have been digitized?
0% 20% 40% 60% 80% 100%
To apply for an agricultural loan
Because I wanted to have therecord of my land
B: Why did you get a digital land record certificate?
0% 25% 50%
Don't know/can't say
I have never needed it
There is some dispute with myland
I think it would be tedious to getit
I am a tenant farmer
C: Why do you not have a digital land certificate?

40
As land records become increasingly linked to distribution of inputs such as seed and fertilizer, as well as the recent moves in some states to provide income support to farmers on the basis of their landholdings, there is an also an expectation that having digitized land records will help them access public subsidies and transfers in the future. Of the landowners who held a digitized certificate many reported having used it to obtain loans (77 percent) and seed subsidies (29 percent). Only 37 percent of those who had so used the digital certificates reported that they had received these benefits prior to digitization. It therefore appears that the digital system is facilitating wider access to such programs.
Figure 13.
5.4.3 Limitation: the case of tenant farmers
A further objective of land record digitization has been to help farmers prove their tenancy without infringing on the property rights of the landowners. The Revenue Department issues an annual Loan Eligibility Certificate (LEC) to tenant farmers subject to the consent of the landlord, which can then be used to access government agricultural subsidies, crop insurance and loans. The Agriculture Department can also issue a Certification of Cultivation (CoC) valid for 6 months without the consent of the landlord. This is intended to help banks issue agricultural credit that does not require collateral. This is a complex system that has traditionally led to disputes and put tenant farmers at a disadvantage.
Has Aadhaar-based digitization addressed this problem? The experience of 13 tenant farmers included in our quantitative survey indicates that not much has changed for them. Only one possessed an LEC and four others CoCs. Our qualitative research indicates that tenant farmers are confused about the difference between LECs and CoCs and the benefits they should provide, while landlords are unwilling to consent to LEC over fears about loan settlement in the case of a tenant default. Banks do not want to issue credit based on LECs, while CoCs are not even considered a valid document. Some banks are apparently willing to issue joint liability group loans, but even these still require a certain amount of collateral. These problems are not new: they existed in the earlier system. But our focus group discussions suggest that Aadhaar-linked digital land records are have not yet been able to benefit tenant farmers as intended.
38%
40%
55%
55%
Easier to get crop loans
Transfer of land will becomeeasier
Easier to prove ownership of land
More transparency in land-relatedareas
What has become better?

41
5.5 Financial inclusion, access, and empowerment: focus on Business Correspondents (BCs)
5.5.1 Overview and Context
Convenient and reliable access to financial services is an important pillar of the digital governance strategy. As outreach agents of the banking sector servicing the needs of the local community, business correspondents are expected to play a critical role in providing access to government benefits and transfers. Services provided by BCs include depositing and withdrawing cash from basic savings accounts, loan repayment, and fund transfers. Their salaries and commissions vary depending on the bank, volume of business generated and achievement of monthly targets. Technology plays an important role especially with the increasing coverage of Aadhaar-enabled financial services. BCs carry micro-ATMs that enable them to perform e-KYC Aadhaar authentication, which was first implemented at scale in Krishna district from early 2016. Understanding how BCs work, their experience of using Aadhaar authentication and the challenges they face can yield provide important insights on the contribution of financial inclusion to the success of digital governance in Krishna district and beyond.
5.5.2 Business Correspondents sample and analysis
Our survey questionnaire included a module which was administered to 45 BCs who served the villages and urban wards which were part of our household survey. The BC sample had a median age of 32. Seventy three percent were female, and all but one had finished high school. BCs are assigned a particular area of operation; 71 percent of our sample are mobile, while the balance operate from one location. Three-quarters of the BCs serve rural areas; 60 percent of them began their present job after 2014. Our respondents serve an average of 460 clients, of whom an average of 226 are monthly active customers. BCs estimate they serve an average of around 43 customers per day, with wide variation in the number and the volume of business generated. Some key sample characteristics are summarized in Table 5.
Eighty percent of our sample BCs utilize the ePoS machine as their primary device.37 Almost none of them have a backup device but 93 percent say their experience of using the ePoS machines is good. Nevertheless, there are occasions when the technology does not work as expected. To encourage BCs to service beneficiaries of government programs, the Krishna district administration provides a toll-free number for technical support. Any software or hardware issues should be resolved within days of the complaint. In the case of a major problem, devices are replaced altogether.
37 The rest use a laptop (9 percent), tablet micro ATM (9 percent), or mobile phone interface (4 percent).

42
Table 5. Business correspondents summary statistics
Characteristic Statistic/Category Observation
Age Mean 32.9
Education level
Didn't complete HS 2%
Completed HS 44%
Graduate 40%
Post graduate 13%
Gender Female 73%
Male 27%
How long been a BC? Mean 4 years, 2 months
Average number of kilometers traveled in a day Mean 9
Number of customers served on average per month Mean 460
Cash distributed on average per month Mean ₹637,000
Figure 14 shows the perception and experience of BCs regarding the use of the Aadhaar-enabled financial services. Transactions are seen as fast, in part due to less paperwork, and the authentication procedure is seen as generally easy. Given our previous results showing that the authentication experience is a key component of perceptions, it is worthwhile considering the difference between authentication not working sometimes and often. Figure 14 indicates that 69 percent of the positive response are related to the ease of authentication, while 71 percent of the negative responses are due to the fact that authentication sometimes does not work. The overlap of these two categories represents 47 percent of the BCs, which suggests that the threshold for ease of use can indeed include occasions when authentication does not work. In other words, even if authentication does not succeed every time, the problem may not be so serious as to switch an overall preference.

43
Figure 14. BC’s perception of Aadhaar-enabled financial services
We also asked BCs how they think their customers perceive their services and experience Aadhaar. Eighty two percent think their customers like Aadhaar authentication, primarily due to convenience and transparency. Interestingly, Figure 15 demonstrates that BCs generally think that customers need two or more attempts to authenticate, on average. This is a useful validation of the feedback obtained when we asked about the use of BC services in our household survey. The responses are not too different but BC’s are somewhat less positive about fingerprint authentication than their clients. Both responses are, of course, on the basis of recall.
In the event of authentication failure, only one BC we surveyed reported using an iris scan as a backup option. Three-quarters might ask the person to visit a bank, and 70 percent might tell them to come back another day. While BCs can provide convenient local access to banking services, their options are limited in responding to customers in case Aadhaar authentication fails. Unlike the case of the VRO in PDS and pensions, there is no automatic local “human backup” close at hand.
0%
10%
20%
30%
40%
50%
60%
70%
80%
Takes less timeto process
transactions
Requires lesspaper work
Authenticationprocedure is easy
Authenticationdoesn't work
sometimes
Authenticationdoesn't work
often
Transaction timehas increased
Like Don't Like

44
Figure 15. Authentication experience of BCs and respondents based on recall
5.5.3 Perceptions from the user side
Somewhat surprisingly, only 10 percent of our sample households report transactions with BCs. This is modest compared to the general impression of widespread access to the BC network. About four-fifths of respondents who do use BCs at least once a month are women. Men visit BCs primarily to query their bank balances or carry out a quick, low-value transaction, while women often make savings deposits. BC’s report that most customers visit them to withdraw remittances, salary, LPG subsidy, or to check their bank account balance.
When we asked BCs about how their services are perceived, all but one said that customers are happy using them. All but two said it was easier for customers to use a BC than go to a bank branch, and three-quarters said that they required less transaction time than a bank. These are interesting for understanding BC perceptions, but are not fully in line with our finding that so few households use them in the first place.
Our household survey provides a useful counterpoint from the customer side. While cash withdrawal was by far the largest reason for using a BC, only four percent reported it as the preferred way to withdraw cash. Part of this comes down to trust, with respondents saying that they trust banks more than BCs and ATMs. BCs are relied upon as emergency backups when cash is needed immediately. Our focus group respondents noted that BCs are not available in all villages, are hamstrung by fixed withdrawal and deposit limits, are not fully trusted to be confidential with users’ information, and there is apparently a general perception that BCs are primarily supposed to assist “uneducated people” with banking.
5.5.4 BCs impact on women’s empowerment and financial inclusion
The most encouraging signs emerging from our BC sample are that 84 percent of the respondents are happy being BCs and that their responses offer tangible evidence of women’s contributions to extending financial inclusion. As might have been expected, many of the women (nearly half) like the job mainly because it generates income but all female BCs say that the job gives them respect as a woman. Eighty nine percent see the job as a socially important one. All seven of the unhappy BCs (including six women) said that the income is insufficient—the only unanimously negative factor. This echoes qualitative findings that
0%
10%
20%
30%
40%
50%
60%
Once Twice Thrice More than three
On average, how many attempts does it take to authenticate?
BCs Respondents

45
most BCs do not see their work as providing an adequate primary income source. On the institutional side, one bank manager said that they prefer female BCs because customers are more comfortable with them. This aligns with our findings in the household survey, which show that four-fifths of the BC users are women.
Not only are women BCs reaching other women, but they also report serving MGNREGA job guarantee program workers and pensioners more frequently than do male BCs, suggesting that female BCs are doing more to extend financial inclusion to other vulnerable groups. Likewise, women have expressed appreciation for the flexibility of the job which allows them to change hours—although some have also said they would prefer fixed hours to avoid being expected to work on holidays. Nonetheless, the positive feedback from the female BCs points to the potential for them to play a potent role in closing the financial inclusion gap across genders.
Looking forward, one has to wonder about the future role of BCs. If mobile money and payments gain widespread adoption in India they could very easily displace many of the services that BCs provide, such as a managing remittances and payments, and checking bank balances. The cash-in cash-out role of BCs could perhaps remain important but could be expected to decline gradually over time as the use of physical cash erodes. One enduring role which BCs have inadvertently filled, but might be called upon to do more, is to serve as digital translators in helping less-educated users enroll in and master mobile money platforms. This is especially true in the context of our sample, which is predominantly older. At the same time, the mixed experience with E-mitras in Rajasthan suggests caution in relying on a commercial model to provide such assistance (Gelb, Mukherjee and Navis 2018).
6. Innovation in monitoring and feedback—towards real time governance
As explained previously, one of the distinctive features of Krishna and AP has been to build an integrated system to monitor digitized service delivery on the basis of the massive volumes of real-time data it generates, and to integrate on top of this a systematic feedback system for customers. A full analysis of these Real Time Governance (RTG) monitoring and feedback arrangements would be a study in itself, and beyond the scope of this paper. Our survey results and qualitative group discussions point to the importance of this system in helping to ensure that the administration remains responsive to user needs. We therefore offer a brief overview of some elements.38
38 The account provided of the system is based on interviews with state and local officials and employees at the RTGS as well as qualitative beneficiary feedback. This falls short of the requirements for rigorous analysis but provides at least a first picture of how the feedback system build on, and feeds back into, the digital system to administer and provide services and benefits.

46
As background, it is worth noting that the current iteration of RTG has been able to build on a foundation of social audits and community scorecards that seems to have been particularly strong in AP. Aiyar and Walton (2014) note that between 2006 and 2012, AP was a leader in this area, conducting social audits in 21,000 gram panchayats across the state. They attribute this to the combination of a political movement aiming to improve social programs and the presence of an activist bureaucrat in a powerful strategic position who sought support from civil society to set up systems for conducting regular audits. These may have not relied on ICT to any great degree, but the prospect was in the wind. Babajanian (2015) outlines a conceptual feedback loop using ICT tools to connect citizens to reporting and grievance redressal mechanisms to increase transparency and accountability, although the speed of the loop, as envisaged, was slower than what AP appears to have been able to achieve.
The first feature of the present system is the ability to track transactions-related data in real-time, by service and program, by mandal, district and village, and down to the level of the individual service provider.39 The real-time administrative data can be used, for example, to identify systemic problems, such as a failure to move rations or payments through to beneficiaries as scheduled, for any program and in any district, mandal or village in the state, or to monitor the progress of fingerprint authentication over time. Real-time data can be used to monitor individual transactions to strengthen exceptions management. To quote from a focus group meeting:
A customer in Agiripialli was not able to authenticate his fingerprints even after multiple attempts. The dealer asked him to visit some other time. Within 10-15 minutes of the incident, she got a call from the collector’s office demanding a response as to why did she not use IRIS to authenticate and asked the person to leave without giving grains. She immediately called the person back and gave his grain entitlement after IRIS based authentication. This was the first time the dealer used the IRIS device. The dealer said, “Government is more focused for the ones who face any sort of issues in getting their grains.”
A second feedback loop is provided by surveys of customer satisfaction. Service complaints can be made through calls to a hotline by dialing 1100 but views on service are also actively solicited. Each PDS and pension beneficiary is required to be part of the Praja Sadhikara Survey (PSS); every month they, as well as beneficiaries of the PDS and other services, receive a robocall in the voice of the Chief Minister soliciting views about the quality of the service. Was the customer treated courteously? Were the expected benefits provided? Did the customer have to pay a bribe to secure them? Reportedly, the current rate of response to the calls stands at about 15 percent. For a typical FPS, this would translate into some 60 pieces of feedback per month.
39 AP also tracks the attendance of public officials by fingerprint authentication.

47
Responses that are negative roll over into a human system to generate complaints. For this purpose, and to handle the 1100 calls, AP maintains a call center staffed by 2,000 operators. Once logged, complaints are forwarded to the relevant district offices and further down the line for action. The standard time for their resolution is 24 hours. People have also registered complaints in other ways, for example, uploading videos of streets not cleaned. These cases, too, are required to be addressed in real time.
Based on indicators of service delivery, as well as complaint resolution, mandals, districts, villages and individual service programs are rated on service satisfaction indexes (colloquially referred to as “Happiness Indexes” by officials and RTGS staff). The ratings are updated every three hours. Together with dashboards monitoring complaints resolution and other indicators, they are brought together on the screens at the RTGS center for scrutiny. They are not made public, but they act as a management tool for state and local governments. Officials have been suspended for poor ratings; if a service provider, such as a FPS, receives consistently negative ratings, we understand that its license can be cancelled.
We are not able to independently verify how completely or thoroughly this system is used to enforce performance standards but, based on our discussions. officials are well aware of it and of their assigned goals for improvement on the “Happiness Index League Table”. In contrast with performance systems that take a long time to produce indicators, they cannot respond to critical feedback with the standard dismissals that (i) the problems identified were in the past, (ii) that they were aware of them and that (iii) measures have already been initiated to resolve them. From focus group meetings and interviews, the rapid feedback loop does seem to play an important role. For example, speaking of the system of panchayat pension delivery, a local official observed to us: Before, officials would deduct a fee of Rs. 100 from the Rs. 1000 pension payment; now they are afraid to do so.
7. Conclusion
The example of Krishna District/Andhra Pradesh offers a range of powerful lessons on how governments can build on some digital basics—identification, communication, financial inclusion—to improve the effectiveness and the inclusivity of a range of services and programs.
The overall picture that emerges from our surveys is highly favorable. Digital technology, as applied in this case, has provided some important benefits, in terms of both efficiency and inclusion. This is because it has been integrated into a comprehensive package combining the four elements of policy set out in Section 3: (i) wide access, (ii) clear accountability, including to resolve technology failure, (iii) user choice of provider, and (iv) user voice, to supplement the management capability enabled by real-time analysis of the vast quantity of data generated by the system. We are not able to isolate the particular contribution of individual components—for example, to test whether the VRO accountability model would still work effectively in the absence of the real-time customer feedback loop—but that has

48
not been the objective of the study. We would rather argue that the logic of the four elements is to work together in a self-reinforcing mode.
This is not to say that Krishna and AP have reached Nirvana. The research has flagged at least four areas of continuing difficulties. The first involves an apparently slow and variable process of selecting beneficiaries into programs. This could usefully be subject to the types of performance norms and standards built into the delivery system, with applications and processing logged and reported, and clear avenues for appeal against excessive delays. 40 Second, experience with remote biometric authentication is still uneven, a particular concern considering the efforts that Krishna and AP have made in this area. Third, there is some dissonance in the business correspondent model, which seems to play a less significant role in benefit transfer than might have been expected. This may reflect the policy of offering only very low commissions, but the record is less than encouraging for proposals to route payments to the poor through the banks. More research is needed in these areas. Finally, the benefits from the digitization of land records, which are seen very favorably by landowners, are yet to percolate down to the (poorer) tenant farmers.
This then raises the question of whether the Krishna-AP model can be considered as the way of the future, for other Indian states and, more generally, for other countries. In framing this question, we again stress that the question is about implementation, rather than the choice of policies and programs. India’s PDS food ration system has come under criticism for many reasons, so that some want to replace it by cash transfers, vouchers or Universal Basic Income (UBI). In addition, AP’s program ensemble includes a number of minor measures that other jurisdictions might not care to adopt, for example, to provide a benefit on the occasion of marriage. The question is whether other jurisdictions should adopt the same philosophy of prioritizing access, accountability, choice and voice in the administration of their programs, and whether they can copy or adapt this example to use digital technology to strengthen a wide range of programs and services. Is such a recommendation appropriate and is it practical?
Technology trends argue in favor of the possibility. Digital identification systems are spreading across the developing world, although not all have the functionality of the Aadhaar. Similarly, an ever-increasing proportion of the world’s population has access to digital communications and, through this, potentially to financial inclusion. The costs of managing big data, such as those generated by real-time digital service delivery systems, are falling rapidly. However, we note three features of the Krishna—AP situation that might not be replicable in other cases.
The first is the question of social choice, in particular as concerns ID systems. The Aadhaar is at the heart of these reforms. While its use for the provision of benefits has been approved by India’s Supreme Court, such a system might not be politically acceptable in all countries.
40 As noted previously, the government has made efforts to speed up enrollment through the PSS survey but remain concerned about errors and potential exclusion. We understand that some 280,000 new ration cards have been added through the surveys.

49
Some elements of the Krishna model could be adapted, but it is not clear whether comparable benefits and monitoring systems could be implemented in the absence of an Aadhaar-like ID system using online authentication at points of service.
The second is the matter of capacity. As noted, Andhra Pradesh is generally recognized as a state with above-average administrative capacity in India and is probably also ahead of most other states in the digital sphere. Its digital service delivery system has required several years of sustained effort and pressure to reach its current capability, including to roll out the digital foundations for the reforms. It also had a prior history of social audits. Similar progress might not be achievable by a less capable or stable administration. There is probably a performance threshold effect for a real-time governance system-- the incidence of complaints should be manageably low and there needs to be capacity to respond. Negative feedback could otherwise overwhelm the system.
Third, and perhaps most complex, is the political economy of service delivery—conditions under which the government will prioritize improvements in delivery over other objectives, including bureaucratic discretion. Perhaps the most remarkable feature of the Krishna—AP system is less that it works—there is probably little in its digital reforms that would be revolutionary in the context of a high technology, data-driven private company like Amazon or Google—than that it is allowed to work. Why here, rather than elsewhere?
Without delving too deeply into the possible reasons, we note again some pre-existing forerunners, including the general prioritization of ICT and the history of social audits. However, many other jurisdictions in India have ICT capacity, and many operate various versions of performance audits and scorecards. Such factors alone cannot provide the answer.
More unusual perhaps has been the stance of the state government. Together with the prioritization of ICT there has been a consistent focus on strengthening service delivery. Schjodt (2018) offers a multi-dimensional comparison between AP and several other states and stresses the importance of commitment from the highest levels of government which is seen as essential to overcome a range of powerful local vested interests. In NREGS, for example, state level political elites in Andhra Pradesh played a critical role in giving space to activist bureaucrats and civil society actors to innovate and experiment in areas that was aligned with the overall political narrative of transparency and accountability (Aiyar and Walton 2015). In considering the present case, it is also notable how strongly the global happiness index enters into official communications. Districts are rated by the index criteria and their performance is prominently displayed in posts that include the portrait of the Chief Minister. To quote from the state’s Vision 202941:
“Happiness of the people of Andhra Pradesh is the supreme goal of the government and people’s well-being and happiness is being put at the forefront of state’s efforts.
41 Sunrise Andhra Pradesh Vision 2029 (no date)

50
Measuring and Understanding Happiness
The Government of Andhra Pradesh aims to be amongst the top three states in the country by the year 2022 and the most developed state by the year 2029. Ensuring a happy and globally competitive society is the state’s vision and people’s happiness and well-being is being put at the forefront of the state’s efforts and gauging levels of happiness across 13 districts has been undertaken for this purpose.”
As shown by many examples, technology is neutral; its impact depends on how it is used. ID systems can exclude as well as include; digital processes can create hurdles as well as streamline processes. While we cannot definitively answer the question “why here and not somewhere else?” Krishna-AP does appear to offer a good example of high-level goals driving the application of digital technology to improve service delivery. Its success is at least as much about objectives as the application of technology to service delivery. It will be interesting to see whether, and how, these objectives evolve following the political transition of 2019.

51
References
Aiyar, Y. & Walton, M. (2015). Rights, accountability and citizenship: India’s emerging welfare state. In Deolalikar, A. B., Jha, S., & Quising, P. F. (Eds.), Governance in Developing Asia: Public Service Delivery and Empowerment (pp. 260-295). Cheltenham, UK: Edward Elgar Published Limited.
Amin, A. (2014, August 25). The Cost of bKash (and friends) [Blog post]. CEME Inclusive Commerce Blog. Retrieved from https://sites.tufts.edu/inclusivecommerceblog/2014/08/25/the-cost-of-bkash/.
Babajanian, B. (2015). Citizen empowerment in service delivery. In Deolalikar, A. B., Jha, S., & Quising, P. F. (Eds.), Governance in Developing Asia: Public Service Delivery and Empowerment (pp. 229-259). Cheltenham, UK: Edward Elgar Published Limited.
Demirgüç-Kunt, A., Leora K., Dorothe S., Saniya A., & Hess, J. (2018). The Global Findex Database 2017: Measuring Financial Inclusion and the Fintech Revolution. Washington, DC: World Bank. Retrieved from https://globalfindex.worldbank.org/#data_sec_focus.
Department of Food & Public Distribution, Government of India. (2013). COVERAGE OF POPULATION UNDER NATIONAL FOOD SECURITY ACT, 2013. Retrieved from https://dfpd.gov.in/1sGbO2W68mUlunCgKmpnLF5WHm/EstdStatewiseNFSA.pdf.
Drèze, J., Khalid, N., Khera, R., & Somanchi, A. (2017). Aadhaar and Food Security in Jharkhand. Economic & Political Weekly, 52(50), 51. Retrieved from http://www.im4change.org/siteadmin/tinymce/uploaded/Aadhaar%20and%20Food%20Security%20in%20Jharkhand%20Pain%20without%20Gain.pdf.
Gelb, A. & Diofasi Metz, A. (2018). Identification Revolution: Can Digital ID be Harnessed for Development? Washington, DC: Center for Global Development.
Gelb, A. & Mukherjee, A. (2019). Reforming Fuel Subsidies: Can Digital Technologies Improve State Capacity and Effectiveness? Manuscript submitted for publication.
Gelb, A., Mukherjee, A., & Navis, K. (2018). Digital Governance in Developing Countries: Beneficiary Experience and Perceptions of System Reform in Rajasthan, India. CGD Working Paper 489. Washington, DC: Center for Global Development. Retrieved from https://www.cgdev.org/publication/digital-governance-developing-countries-beneficiaryexperience-and-perceptions-system.
IDinsight. (2018). State of Aadhaar Report 2017-18. New Delhi, India: Abraham, R., Bennett, E. S., Bhusal, R., Dubey, S., Li, Q. S., Pattanayak, A., & Shah, N. B. Retrieved from https://stateofaadhaar.in/wp-content/uploads/State-of-Aadhaar-Report_2017-18.pdf.
International Telecommunications Union. (2018). Statistics. International Telecommunications Union. Retrieved from https://www.itu.int/en/ITUD/Statistics/Pages/stat/default.aspx.
Ministry of Finance, Government of India. (2016). Economic Survey – Volume I. New Delhi, India.
Mittal, N., Mukherjee, A., & Gelb, A. (2017). Fuel Subsidy Reform in Developing Countries: Direct Benefit Transfer of LPG Cooking Gas Subsidy in India. Center for Global Development. Retrieved

52
from https://www.cgdev.org/sites/default/files/fuel-subsidy-reformdeveloping-countries-india.pdf.
Muralidharan, K., Niehaus, P., & Sukhtankar, S. (2016). “Building State Capacity: Evidence from Biometric Smartcards in India.” American Economic Review, 106(10), 2895–2929.
Reserve Bank of India. (2013). Table 162 : Number and Percentage of Population Below Poverty Line. Retrieved from https://www.rbi.org.in/scripts/PublicationsView.aspx?id=15283.
Schjodt, R. (2018) “Social Accountability in the Delivery of Social Protection: India” Development Pathways Case Study, May.
Sunrise Andhra Pradesh Vision 2029. (no date). Happiness Index. Retrieved from http://apvision.ap.gov.in/happynessindex.php.

53
Annex 1. Sample description
Question Answer
All (column sums to 100)
Female Male (row sums to 100) Total
Location Rural 82.2 65.4 34.6 462 Urban 17.8 75.0 25.0 100
Education
No formal schooling 60.9 73.7 26.3 342 Primary and below 22.1 57.3 42.7 124
Completed primary b.. 8.9 70.0 30.0 50 Completed High School 5.7 37.5 62.5 32
Graduate 2.1 50.0 50.0 12 Post graduate 0.4 50.0 50.0 2
Ration card category ANT 10.0 76.8 23.2 56 BPL 75.3 68.6 31.4 423 APL 14.8 53.0 47.0 83
What percentage of your monthly food consumption comes from PDS?
0-25 13.9 68.0 32.1 78 25-50 51.4 65.4 34.6 289 50-75 19.9 63.4 36.6 112 75-100 14.8 77.1 22.9 83
Does someone in your household receive ______ social pension?
Social pension (old age, widow, disability, etc.) 86.7 70.2 29.8 487
NREGS 38.3 60.9 39.1 215 Cooking gas subsidy(PAHAL) 66.0 65.8 34.2 371
Scholarship 5.7 62.5 37.5 32 JSY 0.5 66.7 33.3 3
Respondent Owns a cell phone Yes 63.3 58.2 41.9 356
What is the principal source of income for the household?
Agricultural labour 27.4 62.3 37.7 154 Non-agricultural la.. 8.0 64.4 35.6 45
Other non-farm occu.. 7.8 63.6 36.4 44 Tenant farmer 2.7 60.0 40.0 15
Owner-cultivator 12.5 41.4 58.6 70 Pensioner 39.1 80.0 20.0 220
Others 2.5 71.4 28.6 14
Do all other household members have Aadhaar number (including children and infants)
No 8.0 84.4 15.6 45 Some have 1.2 100.0 0.0 7
Yes 90.7 65.1 34.9 510
Is your bank account also linked to Aadhaar? No 1.2 42.9 57.1 7 Yes 12.6 62.0 38.0 71
Total 13.9 60.3 39.7 78
Which is the most convenient way for you to withdraw cash when you need it?
ATM 4.4 68.0 32.0 25 BC 4.4 80.0 20.0 25
Branch 91.1 66.4 33.6 512
What type of house do you have? Cemented house 84.5 67.0 33.1 475 Thatched house 15.5 67.8 32.2 87
Do you have access to electricity? Yes 97.7 66.9 33.2 549 Does the household own land? Yes 25.8 47.6 52.4 145
Landowner and household owns more than an acre
One acre or less 16.0 52.2 47.8 90 More than one acre 9.8 40.0 60.0 55
Total 25.8 47.6 52.4 145 Age (in completed years) Mean 54.5 57.9
How many people are in your household? Mean 2.5 3.1 How many children live in your household? Mean 0.6 0.6
Household income Mean 3135.9 3865.7

54
How many bank accounts does the household have? Mean 2.0 2.4