DIgestion report Aqua regia - ECN - Your energy. Our … 2005 HORIZONTAL – 18 Digestion of solid...
28
July 2005 HORIZONTAL – 18 Digestion of solid matrices Part 1: Digestion with Aqua Regia Report of evaluation study Monika I.Kisser NUA-Umweltanalytik GmbH, Austria
Transcript of DIgestion report Aqua regia - ECN - Your energy. Our … 2005 HORIZONTAL – 18 Digestion of solid...

July 2005
HORIZONTAL – 18
Digestion of solid matrices Part 1: Digestion with Aqua Regia
Report of evaluation study
Monika I.Kisser
NUA-Umweltanalytik GmbH, Austria

Acknowledgement This work has been carried out with financial support from the following EU Member States: UK, Germany, France, Italy, Spain, Nordic countries, Netherlands, Denmark, Austria, EU DG
XI and JRC, Ispra. Cooperation in practical work has taken place with Fernwärme Wien, where the open
microwave digestion has been conducted. Cooperation with Ricarda Koopmann of “Hessisches Dienstleistungszentrum für Landwirtschaft, Gartenbau und Naturschutz
(HDLGN)“ in Kassel had taken place by changing digested solutions.

CONTENTS
1. INTRODUCTION 6 2. DESCRIPTION OF THE EVALUATION STUDY 7 2.1 Procedures of Aqua regia digestion 7 2.1.1 Thermal heating digestion with Aqua regia: 7 2.1.2 Closed Microwave digestion with Aqua regia: 8 2.1.3 Open Microwave digestion with Aqua regia: 10 2.1.4 11 2.1.5 Comparison of aqua regia digestion carried out in different laboratories: 12 2.2 Influence of particle size on results of measurements 13 3. MATERIALS 13 4. RESULTS: 14 4.1 Statistical evaluation of the data of the three digestion methods 14 4.2 Comparison of the three digestion methods 21 4.3 Influence of small variations of digestion conditions 22 4.4 Influence of particle size 24 5. CONCLUSIONS 26
HORIZONTAL – 18 3

LIST OF TABLES
Table 1 Programme for closed microwave oven................................................................ 8 Table 2 Programme for open microwave digestion ......................................................... 11 Table 3 Performed aqua regia digestions ......................................................................... 12 Table 4 Performed aqua regia digestions in Hessen ........................................................ 12 Table 5 Particle size of soil SO-16R Eurosoil for digestion with aqua regia................... 13 Table 6 Characterisation of playground samples for aqua regia digestion ...................... 13 Table 7 Statistical evaluation of open and closed microwave digestion for soil sample
SO16R................................................................................................................. 15 Table 8 Statistical evaluation of open microwave and thermal heating digestion for
soil sample SO16R.............................................................................................. 16 Table 9 Statistical evaluation of closed microwave and thermal heating digestion for
soil sample SO16R.............................................................................................. 17 Table 10 Comparison of two methods of aqua regia digestion for sludge......................... 19 Table 11 Comparison of three methods of aqua regia digestion for clay soil SO4............ 20 Table 12 Comparison of different digestion methods........................................................ 21 Table 13 Recovery rate of aqua regia digestion in comparison to total content measured
by XRF................................................................................................................ 22 Table 14 Robustness study - Influence of digestion in different laboratories.................... 23 Table 15 Influence of particle size ..................................................................................... 24
LIST OF FIGURES
Figure 1 Apparatus for thermal heating digestion............................................................... 8 Figure 2 Apparatus for closed microwave digestion........................................................... 9 Figure 3 Example for the matrix composted garbage, CW1 (UB0109)............................ 10 Figure 4 Example for the matrix soil, SO4 clay soil (UB0114) ........................................ 10 Figure 5 Example for the matrix sludge, SL4 (UB0111) .................................................. 10 Figure 6 Apparatus for open microwave digestion ........................................................... 11 Figure 7 Comparison 2 of three digestion methods of aqua regia digestion for compost
CW1.................................................................................................................... 18 Figure 8 Comparison 2 of three digestion methods of aqua regia digestion for compost
CW1 with standard deviation.............................................................................. 18 Figure 9 Comparison of two digestion of aqua regia digestion for sludge........................ 19 Figure 10 Comparison of three methods for clay soil SO4 ................................................. 20 Figure 11 Influence of particle size on closed microwave digestion of SO-16R ................ 25
4 HORIZONTAL – 17

SUMMARY
The present report describes the robustness study for aqua regia digestion in the project HORIZONTAL. The three methods for aqua regia digestion described in the horizontal draft standard (2), thermal heating, closed microwave digestion and open microwave digestion were used for the digestion of different samples of compost, sludge and soil prepared by JRC (4). Statistical evaluation of the data and comparison of the three methods within limits for deviation of 10% respectively 20% have been done. The influence of performance parameters and particle size on the results has been evaluated in this study.
HORIZONTAL – 18 5

1. INTRODUCTION
The overall objective of the European project "Horizontal" is to develop horizontal and harmonised European standards in the fields of sludge, soil and treated biowaste and to facilitate regulation of these major streams in the multiple decisions related to different uses and disposal governed by EU Directives. The revision of the Sewage Sludge Directive 86/278/EEC, the upcoming Directive on the Biological Treatment of Biodegradable Waste and the Soil Monitoring Directive calls for standards on sampling, on hygienic and biological parameters and on methods for inorganic and organic contaminants and for mechanical properties of these materials. The work for developing horizontal and harmonised European standards is split up in coherent Work Packages (WP), each of which addresses a main aspect of all relevant standards required, or likely to be required, in EU regulations regarding sludge, biowaste and soil. In many European countries, digestion methods used for solid environmental samples such as waste, sludge and soil are based on the use of aqua regia in accordance with the relevant European and International standards for the different areas. However, in some European countries, e.g. the Nordic countries, the digestion methods are primarily based on the use of nitric acid. In the previous desk study on digestion of solid matrices (1) a detailed comparison of standards for the digestion prior to the determination of trace elements demonstrated the possibilities of preparing horizontal standards in this field. It was concluded that partial methods, which are most frequently used for digestion in these fields are acceptable. More partial methods have been investigated, however with a focus on digestion using aqua regia and digestion using nitric acid. If results from different methods are used and compared it is of vital importance that the methods used provide comparable results with a sufficiently high reproducibility for the elements and matter in question. The present report describes the results of an evaluation study (Phase II) under WP 6: Inorganic Parameters: Evaluation of the draft horizontal standards for: • Digestion of solid matrices part 1: Digestion by Aqua regia Covering sludge, soil, treated biowaste and neighbouring fields.
6 HORIZONTAL – 17

2. DESCRIPTION OF THE EVALUATION STUDY
2.1 Procedures of Aqua regia digestion In the desk study on digestion of solid matrices (1) one major difference in the existing standards was identified. The ISO standard on aqua regia digestion of soil and the EN standard on digestion of soil improvers and growing media include only digestion by the use of hot-plate heating, while the EN standards on digestion of waste and sludge also include methods for microwave heating. To take into account the developments that have taken place in many European laboratories, the development of a harmonised horizontal standard that includes both hot-plate heating and microwave-oven heating (open and closed heating) was proposed (2). Data exist for waste and sludge samples that suggest that comparable data can be obtained, but for other matrices more investigations are needed. In this evaluation study digestions of soil, sludge and treated biowaste were carried out by using the three different methods (thermal heating, closed microwave, open microwave) described in the proposed draft standard on aqua regia digestion (2).
2.1.1 Thermal heating digestion with Aqua regia: Procedure: The procedure of method A of the draft standard (2) was followed. Mass of test portion: about. 3g of sample moistened with 0,5ml H2O 7ml HNO3, Suprapur, VWR art.:1.00318 21ml HCL, Suprapur, VWR art.:1.00441 The absorptions vessel was filled with 6ml HCL, Suprapur, VWR art.:1.00441 and 2ml HNO3, Suprapur, VWR art.:1.00318. Programme: 2h under reflux conditions with condensation zone 1/3 the height of the condenser Cool down Addition of the content from the absorption vessel via the condenser Both the absorptions vessel and the condenser were rinsed with doubled deionised water. The digest was transferred to a volumetric flask and filled up to 200ml with doubled deionised water. Before measurement the sample was allowed to settle down. Measurement: Instrument: ICP-OES. Optima 3000XL, Perkin Elmer Sample Preparation: sample dilution with aqua regia in following Steps 10,100, 1000 Internal Standardisation with Ytterbium calibration in aqua regia matrix
HORIZONTAL – 18 7

Apparatus for digestion: composed glassware and heating devices by NUA-UA GmbH Location: NUA-Umweltanalytik GMBH Südstadtzentrum 4 2344 Maria Enzersdorf
Figure 1 Apparatus for thermal heating digestion
2.1.2 Closed Microwave digestion with Aqua regia: Procedure: The procedure of method B of the horizontal draft standard (2) was followed. Mass of test portion: about 0,5g of sample Added reagents: 2ml HNO3, Suprapur, VWR art.:1.00318 6ml HCL, Suprapur, VWR art.:1.00441 Quartz vessels were used and cleaned by cooking with aqua regia Programme for a batch of 6 samples: Table 1 Programme for closed microwave oven Time (min) Power(W) 2 250 2 0 5 250 5 400 5 500
8 HORIZONTAL – 17

After digestion the vessels were allowed to cool down, transferred quantitatively to a volumetric flask and filled to 50ml with doubled deionised water. Before measurement the sample was allowed to settle down. Measurement: Instrument: ICP-OES. Optima 3000XL, Perkin Elmer Sample Preparation: sample dilution with aqua regia in following Steps 10,100, 1000 Internal Standardisation with Ytterbium Calibration in aqua regia matrix Apparatus for digestion: Anton Paar, Multiwave Location: NUA-Umweltanalytik GMBH Südstadtzentrum 4 2344 Maria Enzerdorf
Figure 2 Apparatus for closed microwave digestion
HORIZONTAL – 18 9
Recording of temperature and pressure was done during digestion. The following figures show the temperature/pressure diagram for the three sample types characterised in this study. Figure 3 Example for the matrix composted garbage, CW1 (UB0109)
Figure 4 Example for the matrix soil, SO4 clay soil (UB0114)
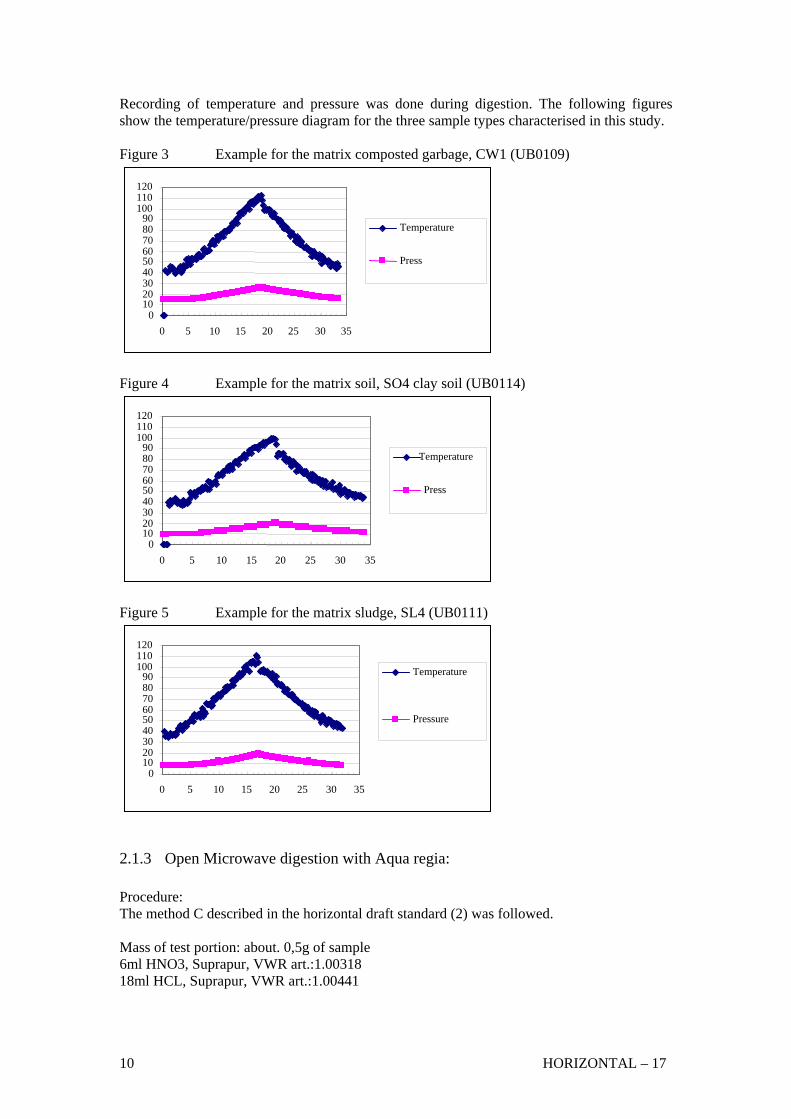
Figure 5 Example for the matrix sludge, SL4 (UB0111)
2.1.3 Open Microwave digestion with Aqua regia: Procedure: The method C described in the horizontal draft standard (2) was followed. Mass of test portion: about. 0,5g of sample 6ml HNO3, Suprapur, VWR art.:1.00318 18ml HCL, Suprapur, VWR art.:1.00441
0 102030405060708090
100110120
Temperature
Press
0 5 10 15 20 25 30 35
0 102030405060708090
100110120
Temperature
Press
0 5 10 15 20 25 30 35
0 102030405060708090
100110120
Temperature
0 5 10 15 20 25 30 35
Pressure
10 HORIZONTAL – 17

Instrument: CEM Star System Location: Fernwärme Wien Simmeringer Haide 11. Haidequerstrasse 6 1110 Wien
Figure 6 Apparatus for open microwave digestion Programme for a batch of 2 samples Table 2 Programme for open microwave digestion
Time (min) Temperature(°C) 3 103 12 103 3 103 12 103
After digestion the vessels were allowed to cool down, transferred quantitatively to a volumetric flask and filled to 50ml with doubled deionised water. Before measurement the sample was allowed to settle down.
2.1.4
HORIZONTAL – 18 11

Table 3 Performed aqua regia digestions
Number of digestions performed by NUA
Samples grain size
number of digestions/ method
closed microwave
open microwave
conventional heating
Internal sample number
SO4 clay soil <125µm 5 5 5 5 UB0114 SO13 soil <2mm 5 5 5 UB0117 SO16 R Eurosoil < 2mm 5 5 5 5 UB0118 CW1 compost <125µm 5 5 5 5 UB0109 CW5 compost <125µm 3 3 3 UB0110 SL4 sludge <125µm 3 3 3 UB0111 SL11S sludge <125µm 3 3 UB0112 Reference materials: CRM 143R <125µm 3 3 3 WQB 1 <125µm 3 3 3
2.1.5 Comparison of aqua regia digestion carried out in different laboratories: Additional to these digestions carried out by NUA, digest from HDLGN, another cooperation partner of project HORIZONTAL, were sent to NUA for analysis. Because the results of the round robin test for the validation of EN 13657 (6, 9) have indicated that the performance in different labs may influence reproducibility, this gives opportunity to check this possible influence. At HDLGN thermal heating digestions and closed microwave digestions were carried out according to the draft horizontal standard (2). Before thermal heating or microwave digestion the samples were standing at room temperature over night. Thermal heating was done in conventional glassware, acids were of analytical grade and deionised water was used. Cleaning was done by rinsing with deionised water. Closed microwave digestions were conducted in Teflon tubes, nitric acid was of analytical grade, HCl suprapur, and doubled deionised water was used. Cleaning of the vessels was done by rinsing three times with nitric acid. Digestion time: 30 minutes Table 4 Performed aqua regia digestions in Hessen
Number of digestions performed by HDLGN Hessen
Samples grain size
number of digestions/ method
closed microwave
open microwave
conventional heating
Internal sample number
SO4 clay soil <125µm 3 3 3 UB0223 SO13 soil <2mm 3 3 3 UB0226 SO16 R Eurosoil < 2mm 3 3 3 UB0224 CW1 compost <125µm 3 3 3 UB0225
12 HORIZONTAL – 17

2.2 Influence of particle size on results of measurements Investigations were carried out for soil samples in order to estimate the necessary and sufficient pre-treatment for the different matrices, and to verify their applicability in terms of optimised reproducibility. Special emphasise is given to the necessary particle size. Coherence with the relevant horizontal standard on pre-treatment of soil, sludge and biowaste is secured. Robustness tests for the validation of EN 13657 (8) have shown, that for aqua regia digestion an influence of the particle size for refractory matrices has to be supposed. The influence of particle size on digestion with aqua regia was evaluated by using one of the soil samples, as the matrix soil seems to be a more refractory matrix. Eurosoil SO-16R was chosen for measuring the influence of particle size on recovery rates as this is a sample with well known characterisation available with a particle size of < 2mm. the sample was milled and sieved at NUA to a grain size of < 500µm and < 100 µm with a ball mill of inert material (achat) used routinely for trace analysis of heavy metals. Table 5 Particle size of soil SO-16R Eurosoil for digestion with aqua regia Particle size
Number of digestions NUA/ thermal heating
Number of digestions NUA/ closed microwave
Number of digestions NUA/ open microwave
Number of digestions Kassel/ thermal heating
Number of digestions Kassel/ closed microwave
< 2mm 5 5 5 3 3 < 500 µm 5 < 100 µm 5
3. MATERIALS
Samples (so-called playground samples) for the evaluation study were samples made available through Work package 1. The general characteristics of the samples used in the evaluation study are described in (4) and the respective reports of interlaboratory comparisons (10, 11). A list of the samples used in this study is given in the following table: Table 6 Characterisation of playground samples for aqua regia digestion Corg
Sample id. Sample description wgt. %
SO-4
(equivalent to BCR-144)
Clay soil,
Speyer, Germany
Ball-milled and sieved
< 125 µm
1,65
SO-13 Terra rossa,
Spain
Air dried, identical to BCR-484,
< 2 mm
1,69
SO-16R uncontaminated soil, UK,
EUROSOIL 3R, IRMM-433-3
Air dried, sieved
< 2 mm
2,6
CW-1 Composted garbage, Dried and ball-milled 12,1
HORIZONTAL – 18 13

Munich, Germany
CW-5 Compost,
Fulda, Germany
11,5
SL-4 Sewage sludge, domestic, Essen, Germany (= BCR 144)
Ball-milled and sieved
< 125 µm
29
SL-11 Sewage sludge, electronic industry, Turin, Italy
Ball-milled and sieved
< 125 µm
3,2
For control purposes two additional certified reference materials, used normally for checking the routine analyses, were digested three times with each method and analysed. These reference materials are CRM-143R and WQB 1. The reference values are shown in the results.
4. RESULTS:
4.1 Statistical evaluation of the data of the three digestion methods The results of the different methods were evaluated by statistical means according to ISO 16489 by comparing method per method. Outliers were eliminated by Grubb’s test in case of at least 5 results per parameter and method available. Excel sheets with detailed results and statistical evaluation of all samples are amended as annex named. For the matrix compost playground sample CW 1, for the matrix soil the samples SO-4, SO-13 and SO-16R were evaluated extensively according 16489. For the matrix sludge has been validated for previous standards (6,7), only a comparison of the means has been done to check if any deviation occurred. As typical example for the results, the evaluation of the data of EUROSOIL SO-16R has been chosen. Statistical evaluation (F-test, mean-t-test) indicate equality only for some parameters, but these parameters vary from each pair of compared methods to the next.
14 HORIZONTAL – 17

Table 7 Statistical evaluation of open and closed microwave digestion for soil sample SO16R
SO 16R methode of reference closed microwave
methode of comparison open microwave
methode of reference
methode of comparison
arithmetic mean
coefficient of variation
arithmetic mean without outlier
coefficient of variation
recovery %
F-test result
arithmetric mean -t-test
"average" standard deviation
standard deviation without outlier
standard deviation without outlier
Arsenic 8,71 2,98 8,93 6,01 2,53 not equal equal 0,39 0,10 0,54Mercury 0,14 14,66 0,11 14,35 -19,96 not equal not equal 0,02 0,02 0,01Cadmium 0,48 5,43 0,45 3,33 -6,14 equal equal 0,02 0,03 0,01Cobalt 7,48 6,32 7,25 8,50 -3,16 equal equal 0,55 0,47 0,62Aluminium 14386,96 42,62 7385,57 6,27 -48,66 not equal not equal 4348,15 6131,74 463,25Calcium 1420,22 8,01 1292,14 3,23 -9,02 not equal not equal 85,66 113,71 41,77Chromium 22,94 23,85 15,00 4,80 -34,60 not equal not equal 3,87 5,47 0,15Copper 17,12 14,64 15,70 3,66 -8,28 not equal equal 1,27 1,71 0,57Iron 22563,11 7,67 21772,68 7,72 -3,50 equal equal 1515,99 1331,97 1679,97Potassium 2794,28 77,54 755,26 6,07 -72,97 not equal equal 1532,41 2166,67 45,87Magnesium 2906,16 21,40 1989,25 4,23 -31,55 not equal not equal 353,24 492,42 84,17Manganese 997,72 13,82 1001,21 2,76 0,35 not equal equal 57,67 76,71 27,68Nickel 17,56 12,93 14,39 5,01 -18,06 equal not equal 1,24 1,59 0,72Lead 60,02 14,79 55,36 4,94 -7,75 not equal equal 6,32 8,88 1,09Sulphur 1504,10 11,15 1158,09 1,60 -23,00 not equal not equal 119,26 167,64 18,50Zink 120,16 29,44 104,12 3,82 -13,36 equal not equal 3,81 3,63 3,98Phosphor 2481,15 11,61 1992,51 3,23 -19,69 not equal not equal 208,66 288,01 64,27
HORIZONTAL – 18 15

Table 8 Statistical evaluation of open microwave and thermal heating digestion for soil sample SO16R
methode of reference open microwave
methode of comparison thermal heating
methode of reference
methode of comparison
arithmetic mean without outlier
coefficient of variation
arithmetic mean without outlier
coefficient of variation
recovery %
F-test result
arithmetric mean -t-test
"average" standard deviation
standard deviation without outlier
standard deviation without outlier
Arsenic 8,93 6,01 8,87 0,67 -0,73 not equal equal 0,38 0,54 0,06Mercury 0,11 14,35 0,11 3,98 -2,76 equal equal 0,01 0,01 0,00Cadmium AAS 0,45 3,33 0,45 0,84 0,41 not equal equal 0,01 0,01 0,00Cobalt AAS 7,25 8,50 7,55 4,58 4,15 equal equal 0,50 0,62 0,35Aluminium 7385,57 6,27 12993,83 6,89 75,94 equal not equal 712,82 463,25 895,33Bor 3,61 17,16 12,68 76,86 251,45 not equal equal 8,96 0,62 12,66Barium 74,47 4,17 85,73 3,70 15,11 equal not equal 3,14 3,10 3,17Calcium 1292,14 3,23 1466,33 3,28 13,48 equal not equal 45,29 41,77 48,54Cobalt ICP 9,91 59,74 10,46 10,67 5,49 not equal equal 0,79 0,11 1,12Chromium 15,00 4,80 22,11 1,33 47,41 equal not equal 0,23 0,15 0,29Copper 15,70 3,66 17,10 6,68 8,91 equal not equal 0,90 0,57 1,14Iron 21772,68 7,72 24232,50 5,62 11,30 equal not equal 1529,10 1679,97 1361,60Potassium 755,26 6,07 2299,67 2,87 204,49 equal not equal 57,08 45,87 66,42Lithium 8,56 6,39 17,15 10,23 100,49 not equal not equal 1,25 0,21 1,75Magnesium 1989,25 4,23 3109,50 5,25 56,32 equal not equal 129,87 84,17 163,25Manganese 1001,21 2,76 1049,28 4,12 4,80 equal equal 36,30 27,68 43,24Nickel 14,39 5,01 18,48 4,39 28,41 equal not equal 0,77 0,72 0,82Lead 55,36 4,94 64,71 8,05 16,89 not equal not equal 3,76 1,09 5,21Sulphur as SO4 1158,09 1,60 1508,29 7,31 30,24 not equal not equal 79,02 18,50 110,21Zink 104,12 3,82 117,24 4,28 12,60 equal not equal 4,56 3,98 5,07Phosphor as P2O5 1992,51 3,23 2385,08 8,03 19,70 not equal not equal 142,92 64,27 191,63
16 HORIZONTAL – 17

Table 9 Statistical evaluation of closed microwave and thermal heating digestion for soil sample SO16R
methode of reference closed microwave
methode ofcomparison closedmicrowave
methode of reference
methode of comparison
arithmetic mean without outlier
coefficient of variation
arithmetic mean without outlier
coefficient of variation
recovery %
F-test result
arithmetric mean -t-test
"average" standard deviation
standard deviation without outlier
standard deviation without outlier
Arsenic 8,60 2,98 8,87 0,67 3,09 #DIV/0! not equal 0,07 0,10 0,00Mercury 0,14 14,66 0,11 3,98 -22,17not equalnot equal 0,01 0,02 0,00Cadmium 0,48 5,43 0,45 0,84 -5,75not equalequal 0,02 0,03 0,00Cobalt 7,48 6,32 7,55 4,58 0,85equal equal 0,41 0,47 0,35Aluminium 14386,96 42,62 12993,83 6,89 -9,68not equalequal 4381,77 6131,74 895,33Calcium 1420,22 8,01 1466,33 3,28 3,25not equalequal 84,32 113,71 35,93Chromium 22,94 23,85 22,11 1,33 -3,59not equalequal 3,87 5,47 0,29Copper 16,43 14,64 17,10 6,68 4,07equal equal 1,45 1,71 1,14Iron 22992,45 7,67 24232,50 5,62 5,39equal equal 1346,87 1331,97 1361,60Potassium 2794,28 77,54 2299,67 2,87 -17,70not equalequal 1532,49 2166,67 51,17Magnesium 2756,59 21,40 3109,50 5,25 12,80not equalequal 366,83 492,42 163,25Manganese 955,95 13,82 1049,28 4,12 9,76equal equal 62,27 76,71 43,24Nickel 16,95 12,93 18,48 4,39 9,01not equalequal 1,19 1,59 0,55Lead 60,02 14,79 64,71 8,05 7,83equal equal 7,28 8,88 5,21Sulphur as SO4 1504,10 11,15 1508,29 7,31 0,28equal equal 141,86 167,64 110,21Zink 107,72 29,44 117,24 4,28 8,84equal equal 3,62 3,63 3,62Phosphor as P2O5 2481,15 11,61 2385,08 8,03 -3,87equal equal 244,61 288,01 191,63
HORIZONTAL – 18 17

For clarification of the magnitude of the differences for each kind of matrix - compost, sludge and soil – some examples are pointed out in the following tables and figures. Results in the diagrams are showing some parameters of similar content in the respective sample showing the means, in some cases with or without standard deviation. One obvious result of these comparisons is that there is no tendency in one special direction, the variation of the results for the single parameters indicates that none of the three method checked lead to significant higher results.
CW 1 Comparison three digestion methods
0,00
5,00
10,00
15,00
20,00
25,00
As Hg Cd Co Cd Co Li
mg/
kg
closed vessel arithmeticmean without outlier
open vessel arithmeticmean without outlier
thermal heatingarithmetic mean withoutoutlier
Figure 7 Comparison 2 of three digestion methods of aqua regia digestion for compost
CW1
CW1 Comparison of three digestion methods 2
0,00
500,00
1000,00
1500,00
2000,00
2500,00
Chromium
Coppe
r
Manga
nese
Nickel
Lead Zin
k
mg/
kg
closed vessel arithmeticmean without outlierclosed vessel standarddeviationopen vessel arithmeticmean without outlieropen vessel standarddeviationthermal heating arithmeticmean without outlierthermal heating standarddeviation
Figure 8 Comparison 2 of three digestion methods of aqua regia digestion for compost
CW1 with standard deviation
18 HORIZONTAL – 17

Table 10 Comparison of two methods of aqua regia digestion for sludge
SL4 closed microwave mg/kg
thermal heating mg/kg
arithmetic mean
standard deviation
arithmetic mean
standard deviation
As 5,99 0,27 5,88 0,04 Hg 1,57 0,06 1,41 0,03 Cd 3,24 0,03 3,30 0,07 Co 7,47 0,69 6,92 0,10 Ag 16,21 0,45 16,67 0,29 Al 8575,53 450,38 9070,67 409,44 B 28,99 0,48 35,30 2,50 Ba 476,05 35,44 518,44 21,42 Be 3,02 0,07 3,01 0,05 Ca 36168,75 639,01 36731,11 308,42 Cd 3,91 0,19 3,90 0,04 Co 13,33 0,34 12,84 0,10 Cr 445,41 8,35 470,07 19,62 Cu 636,47 22,10 722,22 32,89 Fe 46638,65 1273,71 68688,89 7915,20 K 935,11 35,55 1155,56 30,96 Li 5,41 0,17 5,86 0,13 Mg 4529,30 75,33 4610,22 64,24 Mn 409,79 11,81 416,44 6,05 Na 1242,67 21,03 1280,22 24,13 Ni 871,53 50,93 906,67 37,12 Pb 476,37 7,96 479,22 17,60 SO4 15505,10 423,53 13982,22 274,25 Sr 103,04 1,48 86,44 0,77 Zn 2953,42 138,48 3406,67 41,63 P2O5 45901,03 2947,16 48688,89 2059,49
SL4 Comparison of methods
0,002,004,006,008,00
10,0012,0014,0016,0018,00
As Hg Cd Co Ag Be Cd Co Li
mg/
kg
closed microwavearithmetic meanclosed microwavestandard deviationthermal heatingarithmetic meanthermal heatingstandard deviation
Figure 9 Comparison of two digestion of aqua regia digestion for sludge
HORIZONTAL – 18 19

Table 11 Comparison of three methods of aqua regia digestion for clay soil SO4 SO4 closed vessel microwave open vessel microwave thermal heating
mg/kg arithmetic mean
standard deviation
arithmetic mean
standard deviation
arithmetic mean
standard deviation
As 28,32 1,16 28,07 0,87 30,45 0,91Hg 0,25 0,05 0,21 0,01 0,20 0,00Cd 0,24 0,00 0,23 0,00 0,23 0,01Co 3,45 0,07 3,17 0,08 4,00 0,08Al 11780,88 4281,39 4484,65 100,77 11732,83 833,39B 6,28 4,41 3,70 1,01 18,68 7,00Ba 111,00 10,53 97,13 2,34 113,14 2,06Be 1,15 0,06 Ca 4735,92 435,33 3993,67 114,31 4801,42 113,35Cd 1,09 0,12 1,06 0,03Co 4,56 1,42 4,87 1,28Cr 26,27 5,91 17,58 0,50 26,34 1,04Cu 12,77 0,56 12,66 0,70 14,74 2,38Fe 15035,17 780,16 11775,19 505,02 14559,00 895,05K 1442,41 1164,18 512,25 18,28 1770,33 19,68Li 11,94 3,85 5,26 0,18 13,17 0,77Mg 1630,79 361,85 952,46 29,59 1763,00 78,29Mn 288,29 13,42 273,08 6,10 294,54 10,32Na 170,16 44,63 179,37 7,63 209,00 73,15Ni 13,52 1,65 10,37 0,32 14,58 0,33Pb 39,47 2,05 37,93 4,35 38,92 4,69SO4 2492,16 79,16 2147,10 29,21 2576,58 88,78Sr 29,39 10,12 16,91 0,49 28,43 1,12Zn 51,26 1,93 40,18 4,08 50,42 11,22P2O5 1319,74 41,71 1196,53 36,75 1419,71 58,24
Comparison of three methods for clay soil SO4
0,00
10,00
20,00
30,00
40,00
50,00
60,00
As Cr Cu Li Ni Pb Sr Zn
mg/
kg
closed vesselmicrowave arithmeticmeanclosed vesselmicrowave standarddeviationopen vesselmicrowave arithmeticmeanopen vesselmicrowave standarddeviationthermal heatingarithmetic mean
thermal heatingstandard deviation
Figure 10 Comparison of three methods for clay soil SO4
20 HORIZONTAL – 17

4.2 Comparison of the three digestion methods In order to summarise the results and to check the magnitude of eventual deviations, additional evaluation of the data has been done (see Annex, named “Vergleich_xxx”) by comparing the means of all methods with each other and with the overall mean. Limits were defined with ±5% and ±10% deviation of the overall mean and checked for what type of sample, for which method and which parameter deviations bigger than ±5% (in the table 12 shown as >10%) or ±10% (in the table 13 shown as >20%) could be detected. Table 14 Comparison of different digestion methods Element analytical method
Compost CW1 results/ deviation
CompostCW 5deviation
Sludge SL4 results/ deviation
Soil SO4results/ deviation
Soil SO13 deviation
Soil SO16Rresults/ deviation
As-AAS ov>th>cv/ <10%
<10% cv>th <10%
th>cv>ov <10%
<10% ov>th>cv <10%
Hg-AAS th>cv>>ov/ >10%,<20%
>10%, <20%
- cv>ov>th >20%
<10% cv>ov=th >10%
Cd-AAS th>cv>ov/ <10%
<10% th>cv <10%
cv>ov=th <10%
<10% cv>ov=th <10%
Cd-ICP th>ov>cv/ <10%
- cv>th <1%
cv>th(>>AAS)<10%
<10% -
Co-AAS th>>ov>cv/ >10%,<20%
<10% cv>th <10%
th>>cv>>ov >10%,<20%
<10% th>cv>ov <10%
Co-ICP th=cv>ov/ <10%
<10% cv>th <10%
th>cv <10%
<10% th>ov>cv >10%
Cr-ICP th>cv>>ov/ >10%,<20%
<10% th>cv <10%
th>>cv>>ov >20%
<10% cv>th>ov >20%
Cu-ICP th>ov>cv <10%
<10% th>cv >10%, <20%
th>>cv>>ov >20%
<10% cv>th>ov >10%,<20%
Ni-ICP th>ov>cv/ <10%
<10% th>cv <10%
th>>ov>cv >20%
<10% th>cv>ov >20%
Pb-ICP ov>th>cv/ <10%
<10% th>cv <1%
cv>ov>th <10%
>20% th>cv>ov >10%,<20%
Zn-ICP cv>>th>ov/ >10%,<20%
<10% th>cv >10%, <20%
th>>cv>>ov >20%
<10% cv>th>ov >10%,<20%
Explanations: cv = microwave closed vessel; ov = microwave open vessel; th = thermal heating th>cv means mean of all results obtained by thermal heating digestion is bigger than means of all results obtained by digestion with closed vessel microwave Discussion of data evaluation in detail for each sample: CW1 (compost): In general good correlation, Hg, Co-AAS, Cr, Zn >10%, but <20% deviation Results of Cd- ICP >10% higher than Cd-AAS Results of Co-ICP >10% higher than Co-AAS CW5 (compost): Comparison of closed microwave and thermal heating only; Very good correlation, only Hg and K>10%, Al >20%, standard deviation very small
HORIZONTAL – 18 21

SL4 (sludge): Comparison of closed microwave and thermal heating only; Correlation of Cu, Zn >10%, other heavy metals <10%, deviation of results between the two methods of B, Fe, K Results of Cd- ICP >10% higher than Cd-AAS Results of Co-ICP >10% higher than Co-AAS SO4 (clay soil): In general deviation in many cases > 20%, e.g. Cr deviation >20% (cv/ov/th=17,6/22/26,9), standard deviation strongly influenced by different labs performing digestion SO13 (soil): Comparison of closed microwave and thermal heating only; Very good correlation, only B (maybe error) does not correlate, K and Na >10% and Pb >20%, standard deviation strongly influenced by different labs performing digestion
4.3 Influence of small variations of digestion conditions The recovery rate of aqua regia digestion depends strongly on the matrix of the sample (1). The recovery rate decreases the more refractory the matrix of the sample is. This fact has to be taken into account also when comparing different methods or the same method conducted in different labs. Small variations in pre-treatment or digestion conditions may influence the recovery rate especially in case of refractory matrices. This fact was proven in the pre-normative research study and the robustness study of EN 13657 (6, 8). The data obtained for aqua regia digestion are compared in table 15 with the results from characterisation study (4). Table 16 Recovery rate of aqua regia digestion in comparison to total content measured by
XRF SO4 – Clay soil (Germany) SO13 – Terra Rossa (Spain) Parameter Aqua
regia closed vessel
Total content –XRF*
Recovery rate %
Parameter Aqua regia closed vessel
Total content –XRF*
Recovery rate
Cr mg/kg 26 110 23,6 Cr mg/kg 31 95 32,6 Cu mg/kg 13 77 16,9 Cu mg/kg 240 312 76,9 Hg mg/kg 0,25 0,64 39,1 Hg mg/kg 0,45 0,43 104 Ni mg/kg 14 75 18,7 Ni mg/kg 27 52 51,9 Pb mg/kg 41 81 50,6 Pb mg/kg 101 119 84,9 Zn mg/kg 52 290 17,9 Zn mg/kg 412 523 78,8 CW1 - Composted garbage SL4 – Sewage sludge Parameter Aqua
regia closed vessel
Total content –XRF*
Recovery rate %
Parameter Aqua regia closed vessel
Total content –XRF*
Recovery rate
Cr mg/kg 198 270 73,3 Cr mg/kg 445 729 61,0 Cu mg/kg 618 618 100 Cu mg/kg 636 645 98,6 Hg mg/kg 7,48 6,8 110 Hg mg/kg 1,57 1,39 113 Ni mg/kg 229 185 124 Ni mg/kg 872 956 91,2 Pb mg/kg 1661 1474 113 Pb mg/kg 476 580 82,1 Zn mg/kg 2002 1938 103 Zn mg/kg 2953 4033 73,2 * Results from characterisation study of JRC (4)
22 HORIZONTAL – 17

As aqua regia digestion is not a method to obtain “true contents” of species, special care has to be taken to perform it as similar as possible in each lab to obtain equivalent results. In analysing digests produced in different labs with the same methods in one lab, it was tried to check these possible sources of error. Variations in sample pre-treatment could not be checked by this method, for the same samples were digested, prepared by JRC ready for digestion (4). Table 17 Robustness study - Influence of digestion in different laboratories
SO4 Clay Soil results of digestion with Aqua regia, closed microwave
mean of 8 digestions (with Kassel)
mean of 5 digestions (without Kassel)
arithmetic mean in mg/kg
standard deviation
coefficient of variation
arithmetic mean in mg/kg
standard deviation
coefficient of variation
total mean
deviation mean
total mean -10%
total mean +10%
As -AAS 28,32 1,16 4,09 28,32 1,16 4,09 Hg-AAS 0,25 0,05 19,05 0,25 0,05 19,05 Cd-AAS 0,24 0,01 3,08 0,24 0,01 3,08 Co-AAS 3,45 0,07 1,93 3,45 0,07 1,93 Al-ICP 11780,88 4281,39 36,34 8705,72 488,09 5,61 10243,30 >20% 9218,97 11267,63B-ICP 6,28 4,41 70,26 3,14 1,01 32,09 4,71 >20% 4,24 5,18Ba-ICP 114,86 14,63 12,74 105,65 1,65 1,56 110,25 99,23 121,28Ca-ICP 4735,92 435,33 9,19 4429,73 59,41 1,34 4582,83 4124,54 5041,11Cd-ICP 1,09 0,12 11,23 1,09 0,98 1,19Co-ICP 4,56 1,42 31,24 5,58 0,19 3,36 5,07 4,56 5,57Cr-ICP 26,27 5,91 22,51 22,03 0,66 3,01 24,15 21,73 26,56Cu-ICP 12,97 0,77 5,91 12,47 0,15 1,21 12,72 11,45 13,99Fe-ICP 15035,17 780,16 5,19 14917,78 440,01 2,95 14976,48 13478,83 16474,12K-ICP 1442,41 1164,18 80,71 933,10 70,75 7,58 1187,75 >20% 1068,98 1306,53Li-ICP 11,94 3,85 32,20 9,17 0,39 4,28 10,56 >20% 9,50 11,61Mg-ICP 1630,79 361,85 22,19 1370,64 36,07 2,63 1500,71 1350,64 1650,78Mn-ICP 293,27 18,78 6,40 288,85 3,97 1,37 291,06 261,96 320,17Na-ICP 170,16 44,63 26,23 202,14 3,33 1,65 186,15 167,54 204,77Ni-ICP 13,52 1,65 12,23 12,33 0,22 1,75 12,92 11,63 14,22Pb-ICP 40,59 3,71 9,13 38,82 1,98 5,11 39,71 35,74 43,68S as SO4-ICP 2524,63 117,48 4,65 2455,16 33,91 1,38 2489,89 2240,90 2738,88Sr-ICP 29,39 10,12 34,44 22,09 0,63 2,84 25,74 >20% 23,17 28,31Zn-ICP 52,11 3,00 5,75 50,61 1,67 3,31 51,36 46,22 56,49P as P2O5-ICP 1351,34 97,35 7,20 1307,14 41,56 3,18 1329,24 1196,31 1462,16
The difference between the digestion solutions produced at NUA and the ones obtained in Kassel seem to have the same scheme for most of analysed samples: the contents of Na, K, B, Pb, Cr are higher in the samples digested by Kassel. The differences obtained by using the same method in different labs lead for both methods checked in that way - closed microwave and thermal heating digestion – to one important conclusion: They are in the same order of magnitude as the differences obtained by different methods of aqua regia digestion in the same lab.
HORIZONTAL – 18 23

4.4 Influence of particle size In order to check the influence of particle size one soil sample available with a grain size of <2mm, SO-16R, was milled to a particle size of <500µm and <100µm and digested 5 times for each particle size by closed microwave digestion. Evaluation of data was done by comparing mean and standard deviation of the analysed parameters. Table 18 Influence of particle size
SO 16R < 2mm < 0,5mm < 0,1mm
Parameter arithmetic mean
standard deviation
coefficient of variation
arithmetic mean
standard deviation
coefficient of variation
arithmetic mean
standard deviation
coefficient of variation
Cadmium 0,48 0,03 5,43 0,49 0,01 1,72 0,58 0,01 2,12Cobalt 7,48 0,47 6,32 5,41 0,23 4,21 6,34 0,26 4,07Aluminium 10026,93 729,31 7,27 10179,14 740,23 7,27 11996,27 1706,30 14,22Barium 84,24 3,13 3,71 79,48 2,01 2,52 80,50 39,73 49,36Calcium 1405,11 79,03 5,62 1497,21 92,15 6,15 1838,63 80,72 4,39Cobalt 9,77 1,74 17,82 6,60 0,31 4,71 8,26 0,16 1,99Chromium 19,06 0,32 1,66 18,85 0,53 2,81 23,09 0,92 3,97Copper 17,24 2,82 16,33 14,62 0,64 4,39 19,42 1,02 5,27Iron 22603,73 1259,70 5,57 23362,71 1288,82 5,52 26422,93 913,81 3,46Potassium 1236,71 66,46 5,37 1274,81 51,20 4,02 1638,81 155,23 9,47Lithium 12,32 0,44 3,56 13,32 0,35 2,59 16,30 0,93 5,71Magnesium 2504,56 141,48 5,65 2597,48 69,93 2,69 3145,48 134,24 4,27Manganese 1027,12 147,68 14,38 1020,89 21,73 2,13 1243,14 58,14 4,68Nickel 16,46 0,77 4,66 15,46 1,02 6,61 20,66 0,83 4,04Lead 54,10 2,69 4,96 56,86 5,81 10,21 76,39 2,92 3,83Sulphur as SO4 1435,94 46,85 3,26 1521,58 63,67 4,18 1783,75 35,12 1,97Strontium 7,70 0,88 11,45 8,39 0,39 4,60 9,71 0,63 6,44Zink 107,27 3,81 3,55 97,08 49,30 50,78 130,73 4,19 3,20Phosphor as P2O5 2480,92 153,62 6,19 2591,18 162,05 6,25 3059,10 86,46 2,83
To point out possible differences the results of selected parameters are shown in a diagram (figure 11). This makes the influence of smaller particle size for rather refractory matrix visible. This fact was already shown in previous studies (13, 14) for waste and soil materials, but it cannot be detected for sewage sludge and other organic matrices. The influence of particle size on the grade of digestion (recovery rate) and therefore the representativity of results is visible for refractory matrix. Therefore it has to be laid down in the standard; the proposal is to prescribe the particle size with 200µm to 500µm, as a particle size of 100µm leads to higher results that may influence the robustness of the method.
24 HORIZONTAL – 17

Influence of particle size
0,00
20,00
40,00
60,00
80,00
100,00
120,00
140,00
160,00
Co AAS Ba Co ICP Cr Cu Li Ni Pb Sr Zn
mg/
kg
UB0118A UB0118B UB0118C UB0118D UB0118E UB0118AF-500µmUB0118AG-500µm UB0118AH-500µm UB0118AI-500µm UB0118AJ-500µm UB0118AA-100µm UB0118AB-100µmUB0118AC-100µm UB0118AD-100µm UB0118AE-100µm
Figure 11 Influence of particle size on closed microwave digestion of SO-16R
HORIZONTAL – 18 25

5. CONCLUSIONS
Evaluation of the analytical results of this robustness study in combination with previous pre-normative research and validation of the two standards EN 13346 and EN 13657 lead to these conclusions: • One obvious result of the statistical evaluation of the data is that there is no tendency in
one special direction, the variation of the results for the single parameters indicates that none of the three method checked lead to significant higher results.
• The differences obtained by using the same method in different labs lead for both methods checked in that way - closed microwave and thermal heating digestion – to one important conclusion: They are in the same order of magnitude as the differences obtained by different methods of aqua regia digestion in the same lab.
• The comparison of the three aqua regia digestion methods shows in most cases deviations of smaller than 10%. Only for very refractory matrices as clay soil, deviations of over 20% are possible for selected parameters. Results for organic matrix as sludge and compost correlate in most cases.
• The influence of particle size on the grade of digestion (recovery rate) and therefore the representativity of results is visible for refractory matrix. Therefore it has to be laid down in the standard; the proposal is to prescribe the particle size with 200µm to 500µm, as a particle size of 100µm leads to higher results that may influence the robustness of the method.
• Pre-treatment and performance of digestion has to be prescribed in very detail to succeed in comparable results.
26 HORIZONTAL - 17

REFERENCES
1. K.J.Andersen and M.I Kisser. “Digestion of Solid Matrices – Desk study Horizontal” March 2004. www.ecn.nl/library/horizontal.
2. K.J.Andersen and M.I Kisser. “Digestion soil, sludge, biowaste and waste for the extraction of aqua regia soluble elements – Horizontal Draft Standard” March 2004. www.ecn.nl/library/horizontal
3. K.J.Andersen and M.I Kisser. “Chemical Analysis - Digestion sediment, sludge, soil, biowaste and waste for the extraction of nitric acid soluble fraction of trace elements – Horizontal Draft Standard” March 2004. www.ecn.nl/library/horizontal
4. Gawlik, B.M., F. Bo, F. Sena, L. Roncari, G. Locoro & R. Vivian: Characterisation of “Playground” samples to be used in the context of Project “Horizontal”. Part 1: Inorganic parameters. SWCR-Report No 03/07/2004.
5. Youden, W.J. & E.H. Steiner: Statistical manual of the AOAC, Published by AOAC International. 1975.
6. EN 13657: Characterisation of waste – Digestion for subsequent determination of aqua regia soluble portion of elements, 2002
7. EN 13346 Characterisation of sludge – Determination of trace elements and phosphorus – Aqua regia extraction methods 2000
8. Giove,A.; Politi,M.; Cavallo,G.: Robustness study on standard methods developed by CEN TC 292/WG3, Italy 2000
9. Muntau, H.; Kisser, M. I.; Yuste, C.; Giove, A.; Bianchi, M.: The validation of CEN draft standards for the analysis of waste, Joint Research Centre, European Commission EUR 19680 EN, European Communities 2000
10. Certificate of BCR-144 (SL4)
11. Gawlik, B.M., Crößmann, G., Bianchi, M., Muntau, H. (1999) In: B. M. Gawlik and H. Muntau (Eds.), EUROSOILS II – Laboratory reference materials for soil-related studies. EUR 18983 EN
12. ISO 16489
13. Kisser, M.I.; Hollensteiner,C: Pre-normative research for EN 13657, study for the Austrian Ministry of Environment, Ma. Enzersdorf, 1996
14. Dreher, P.; Kisser, M.I.; Peticka. R.; Scharf, W.: “Erden aus Abfällen”, study for the Austrian Ministry of Environment, Austria, 2000
HORIZONTAL - 17 27
ANNEX
All the analytical data and statistical evaluation of the data are submitted as excel files in electronic form, named either “result_xxx”, “Vergleich_xxx” or “SO 16R Table Statistic.xls”, where “xxx” is the name of the respective playground sample as described in (4) and the internal sample name.
28 HORIZONTAL - 17