Dielectric decrement as a source of ion-specific...
12
THE JOURNAL OF CHEMICAL PHYSICS 134, 074705 (2011) Dielectric decrement as a source of ion-specific effects Dan Ben-Yaakov, 1 David Andelman, 1, a) and Rudi Podgornik 2 1 Raymond and Beverly Sackler School of Physics and Astronomy Tel Aviv University, Ramat Aviv, Tel Aviv 69978, Israel 2 Department of Theoretical Physics J. Stefan Institute, Department of Physics Faculty of Mathematics and Physics and Institute of Biophysics Medical Faculty, University of Ljubljana 1000 Ljubljana, Slovenia (Received 1 November 2010; accepted 11 January 2011; published online 17 February 2011) Many theoretical studies were devoted in the past to ion-specific effects trying to interpret a large body of experimental evidence, such as surface tension at air/water interfaces and force measure- ments between charged objects. Although several mechanisms were suggested to explain the results, such as dispersion forces and specific surface-ion interactions, we would like to suggest another source of ion-specificity originating from the local variations of the dielectric constant due to the presence of ions in the solution. We present a mean-field model to account for the heterogeneity of the dielectric constant caused by the ions. In particular, for ions that decrease the dielectric constant we find a depletion of ions from the vicinity of charged surfaces. For a two-plate system, the same effect leads to an increase of the pressure in between two surfaces. Our results suggest that the effect of ions on the local dielectric constant should be taken into account when interpreting experiments that address ion-specific effects. © 2011 American Institute of Physics. [doi:10.1063/1.3549915] I. INTRODUCTION The first interest in ion-specific effects dates back to the end of the 19th century, when Franz Hofmeister and his co- workers 1 measured the thermodynamic properties of protein precipitation in various salt solutions. They tested numerous salt species and found that the protein solubility properties can be arranged in a specific ionic order. This classification of cations and anions is known today as the Hofmeister series. Since then many other experiments demonstrated that ion-specific effects take place in a large variety of chemical and biological systems. 2 These experiments include measurement of surface tension at air/water interface, 3–5 proteins stability, 6 forces between charged surfaces such as mica or silica surfaces, 7, 8 osmotic pressure in systems containing biological macromolecules, 9–11 and many more. Noticeable efforts have been devoted over the years to understand the physical mechanisms that lead to ion-specific effects. 2, 12–15 A typical problem is to obtain density pro- files of ions near charged surfaces such as macromolecules, membranes, and colloids or neutral dielectric interfaces (e.g., air/water interface) and use the profiles to calculate macroscopic quantities such as osmotic pressure and surface tension. Theoretical endeavors offer a variety of perspectives re- garding the origin of the ion-specific effects. Most recently, dispersion interactions 15, 16 depending on the polarizability of the ions have been proposed to furnish the missing link be- tween ionic profiles and ion-specific interactions. These inter- actions add an additional term to the total ionic energy close to a noncharged dielectric interface. This term varies as B/z 3 , where z is the distance of the ion from the surface, located at z = 0. The ion-specificity then emerges from a variation in a) Electronic mail: [email protected]. the specific ion polarizability, leading to different values of the coefficient B . Apart from the dispersion interactions, ion-hydration interaction 12, 13 has been suggested to lead to an effective short-range ion-specific interaction with the bounding sur- face. For example, an attractive potential of the ions to the surface in the shape of a square well takes into account their larger affinity as compared to ion–water interaction. This at- traction then boosts the concentration of the ions in the surface vicinity. In a similar fashion but with an opposite effect, Onsager and Samaras dealt in their seminal work 17 with repulsive im- age charge interactions as a source of ionic depletion from a noncharged dielectric interface. Image charge interaction is a short-range surface interaction having an exp(−2z /λ D )/z dependence, where λ D is the Debye screening length. This repulsive interaction becomes significant for air/water inter- faces and is responsible for the increase of surface tension of saline solutions as compared with pure water. More re- cently, additional interactions have been proposed to augment the original Onsager and Samaras model and offer an expla- nation to ion-specific surface tension of electrolyte solutions in agreement with experiments. 18, 19 In another approach, 6 it was suggested that surface charge density is a crucial parameter controlling ionic speci- ficity. The density is determined by the net charge and spe- cific volume (i.e., radii) of the ions. For small ions, the surface charge density can be large, leading to a strong attractive inter- action with the polar water molecules. This results in a “hard” hydration shell with high energy cost of removing it. Oppo- sitely, for large ions, the surface charge density is smaller, and therefore, the energy cost of breaking the ion-water complex is lower, leading to a “soft” hydration shell. Due to the dif- ferent energy costs of “hard” and “soft” hydration shells, it is favorable to have pairing where both cations and anions are 0021-9606/2011/134(7)/074705/12/$30.00 © 2011 American Institute of Physics 134, 074705-1 Downloaded 17 Feb 2011 to 128.119.56.12. Redistribution subject to AIP license or copyright; see http://jcp.aip.org/about/rights_and_permissions
Transcript of Dielectric decrement as a source of ion-specific...

THE JOURNAL OF CHEMICAL PHYSICS 134, 074705 (2011)
Dielectric decrement as a source of ion-specific effectsDan Ben-Yaakov,1 David Andelman,1,a) and Rudi Podgornik2
1Raymond and Beverly Sackler School of Physics and Astronomy Tel Aviv University, Ramat Aviv,Tel Aviv 69978, Israel2Department of Theoretical Physics J. Stefan Institute, Department of Physics Faculty of Mathematics andPhysics and Institute of Biophysics Medical Faculty, University of Ljubljana 1000 Ljubljana, Slovenia
(Received 1 November 2010; accepted 11 January 2011; published online 17 February 2011)
Many theoretical studies were devoted in the past to ion-specific effects trying to interpret a largebody of experimental evidence, such as surface tension at air/water interfaces and force measure-ments between charged objects. Although several mechanisms were suggested to explain the results,such as dispersion forces and specific surface-ion interactions, we would like to suggest anothersource of ion-specificity originating from the local variations of the dielectric constant due to thepresence of ions in the solution. We present a mean-field model to account for the heterogeneity ofthe dielectric constant caused by the ions. In particular, for ions that decrease the dielectric constantwe find a depletion of ions from the vicinity of charged surfaces. For a two-plate system, the sameeffect leads to an increase of the pressure in between two surfaces. Our results suggest that the effectof ions on the local dielectric constant should be taken into account when interpreting experimentsthat address ion-specific effects. © 2011 American Institute of Physics. [doi:10.1063/1.3549915]
I. INTRODUCTION
The first interest in ion-specific effects dates back to theend of the 19th century, when Franz Hofmeister and his co-workers1 measured the thermodynamic properties of proteinprecipitation in various salt solutions. They tested numeroussalt species and found that the protein solubility propertiescan be arranged in a specific ionic order. This classificationof cations and anions is known today as the Hofmeisterseries. Since then many other experiments demonstratedthat ion-specific effects take place in a large variety ofchemical and biological systems.2 These experiments includemeasurement of surface tension at air/water interface,3–5
proteins stability,6 forces between charged surfaces suchas mica or silica surfaces,7, 8 osmotic pressure in systemscontaining biological macromolecules,9–11 and many more.
Noticeable efforts have been devoted over the years tounderstand the physical mechanisms that lead to ion-specificeffects.2, 12–15 A typical problem is to obtain density pro-files of ions near charged surfaces such as macromolecules,membranes, and colloids or neutral dielectric interfaces(e.g., air/water interface) and use the profiles to calculatemacroscopic quantities such as osmotic pressure and surfacetension.
Theoretical endeavors offer a variety of perspectives re-garding the origin of the ion-specific effects. Most recently,dispersion interactions15, 16 depending on the polarizability ofthe ions have been proposed to furnish the missing link be-tween ionic profiles and ion-specific interactions. These inter-actions add an additional term to the total ionic energy closeto a noncharged dielectric interface. This term varies as B/z3,where z is the distance of the ion from the surface, locatedat z = 0. The ion-specificity then emerges from a variation in
a)Electronic mail: [email protected].
the specific ion polarizability, leading to different values ofthe coefficient B.
Apart from the dispersion interactions, ion-hydrationinteraction12, 13 has been suggested to lead to an effectiveshort-range ion-specific interaction with the bounding sur-face. For example, an attractive potential of the ions to thesurface in the shape of a square well takes into account theirlarger affinity as compared to ion–water interaction. This at-traction then boosts the concentration of the ions in the surfacevicinity.
In a similar fashion but with an opposite effect, Onsagerand Samaras dealt in their seminal work17 with repulsive im-age charge interactions as a source of ionic depletion froma noncharged dielectric interface. Image charge interaction isa short-range surface interaction having an exp(−2z/λD)/zdependence, where λD is the Debye screening length. Thisrepulsive interaction becomes significant for air/water inter-faces and is responsible for the increase of surface tensionof saline solutions as compared with pure water. More re-cently, additional interactions have been proposed to augmentthe original Onsager and Samaras model and offer an expla-nation to ion-specific surface tension of electrolyte solutionsin agreement with experiments.18, 19
In another approach,6 it was suggested that surfacecharge density is a crucial parameter controlling ionic speci-ficity. The density is determined by the net charge and spe-cific volume (i.e., radii) of the ions. For small ions, the surfacecharge density can be large, leading to a strong attractive inter-action with the polar water molecules. This results in a “hard”hydration shell with high energy cost of removing it. Oppo-sitely, for large ions, the surface charge density is smaller, andtherefore, the energy cost of breaking the ion-water complexis lower, leading to a “soft” hydration shell. Due to the dif-ferent energy costs of “hard” and “soft” hydration shells, it isfavorable to have pairing where both cations and anions are
0021-9606/2011/134(7)/074705/12/$30.00 © 2011 American Institute of Physics134, 074705-1
Downloaded 17 Feb 2011 to 128.119.56.12. Redistribution subject to AIP license or copyright; see http://jcp.aip.org/about/rights_and_permissions
074705-2 Ben-Yaakov, Andelman, and Podgornik J. Chem. Phys. 134, 074705 (2011)
either small or large. An interesting feature of this ionic pair-ing mechanism is a possible explanation of a reversal inthe order of the Hofmeister series, as observed in severalexperiments.6
Besides the analytical approaches, computer simulationsgain much needed insight into the intricacies of the ionicspecificity20, 21 and are used to investigate various cross-interactions between the system components (solutes, solvent,and surfaces). Computer simulations capture a very detailedmicroscopic picture as compared to continuum theories suchas the Poisson–Boltzmann (PB) theory and its extensions.However, they often lack the simplicity and predictive powerof analytical models and their straightforward intuition.
From the current state of theoretical and experimentalstudies, it appears to be quite clear that ion-specific effectsare due to the interplay between the ion–ion, ion–solvent,and ion–surface interactions, taking into consideration bothelectrostatic and nonelectrostatic interactions. However, it isstill not well understood what are the important physical andchemical properties of the solutes and solvent that determinethese specific interactions.
The traditional PB theory accounts for electrostatic inter-actions on a mean-field level with well understood drawbacksand limitations.22 It neglects all ion-specific effects exceptfor the ion valency. This ceases to be true for some modifiedmean-field-derived approaches where image effects are addedin by hand.23 Apart from the electrostatic interactions, othernonelectrostatic interactions can be made part of the theory.This was done in the standard Derjaguin–Landau–Verwey–Overbeek theory of colloid stability,24 where the total interac-tion decomposes into a sum of the van der Waals and electro-static interactions.
In the present work, we would like to suggest a phe-nomenological approach to treat different ionic species. Ourapproach shares some of the simplicity of the PB theory, whiletaking into account the ionic specificity on a mean-field level.In particular, we focus on the effect the ions have on thelocal solution polarity as codified by its static dielectric func-tion. The static dielectric function is treated as a spatially-dependent function ε(z), where the spatial dependence isgiven implicitly by the local ionic concentration, thus intro-ducing ionic specificity in an implicit manner. In Sec. II, weelaborate on the dependence of the dielectric constant on theionic concentration and discuss its physical range. In Sec. III,we present a mean-field model that accounts for the effect ofthe ions on the dielectric constants. Finally, results for densityprofiles and the interplate pressure are presented in Secs. IVand V, respectively.
II. ION DEPENDENT DIELECTRIC CONSTANT
The static dielectric function of an electrolyte solu-tion is generally found to be smaller than that of the puresolvent.25, 26 This decrement of the dielectric constant hasbeen attributed to various sources, which underlie the changesin the dielectric response of the solution. We mention here twoof the most important ones:
Ionic polarizability. Each ion in an aqueous solution cre-ates a cavity and displaces one or several water molecules in
this process. Since the ions usually have smaller static and dy-namic polarizabilities than water, they modify the dielectricresponse of the solution.27 This effect, though omnipresent,is nevertheless small and does not have substantial conse-quences.
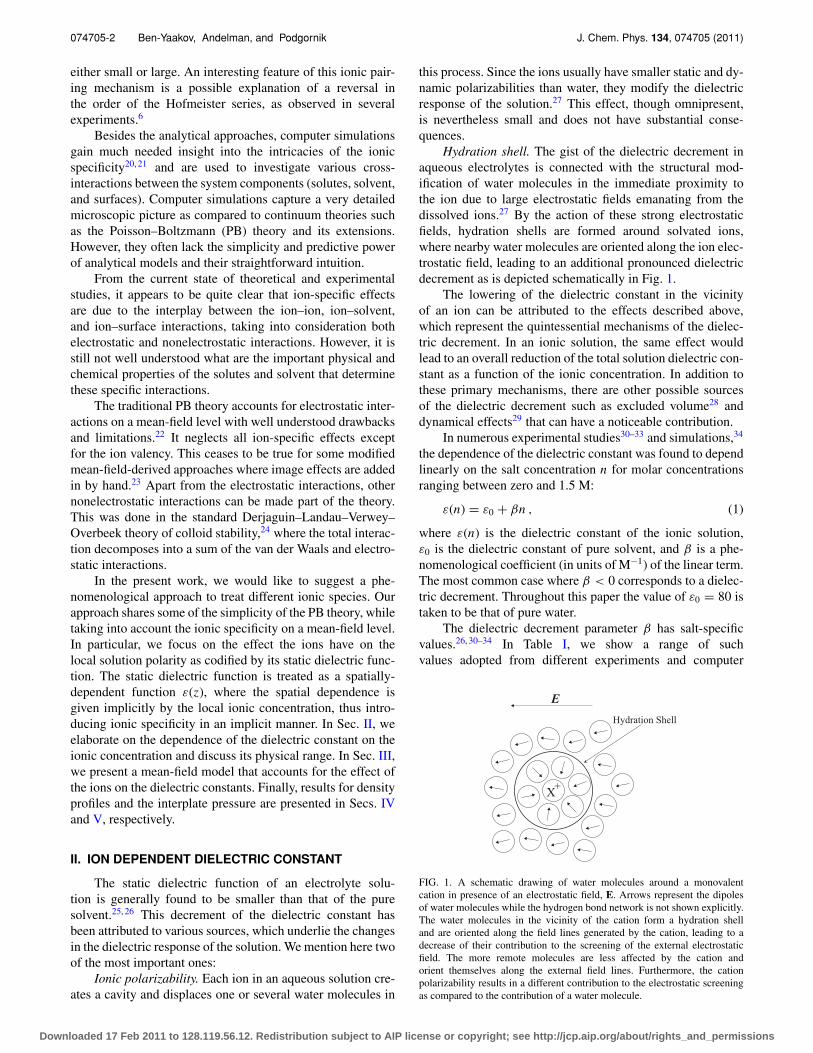
Hydration shell. The gist of the dielectric decrement inaqueous electrolytes is connected with the structural mod-ification of water molecules in the immediate proximity tothe ion due to large electrostatic fields emanating from thedissolved ions.27 By the action of these strong electrostaticfields, hydration shells are formed around solvated ions,where nearby water molecules are oriented along the ion elec-trostatic field, leading to an additional pronounced dielectricdecrement as is depicted schematically in Fig. 1.
The lowering of the dielectric constant in the vicinityof an ion can be attributed to the effects described above,which represent the quintessential mechanisms of the dielec-tric decrement. In an ionic solution, the same effect wouldlead to an overall reduction of the total solution dielectric con-stant as a function of the ionic concentration. In addition tothese primary mechanisms, there are other possible sourcesof the dielectric decrement such as excluded volume28 anddynamical effects29 that can have a noticeable contribution.
In numerous experimental studies30–33 and simulations,34
the dependence of the dielectric constant was found to dependlinearly on the salt concentration n for molar concentrationsranging between zero and 1.5 M:
ε(n) = ε0 + βn , (1)
where ε(n) is the dielectric constant of the ionic solution,ε0 is the dielectric constant of pure solvent, and β is a phe-nomenological coefficient (in units of M−1) of the linear term.The most common case where β < 0 corresponds to a dielec-tric decrement. Throughout this paper the value of ε0 = 80 istaken to be that of pure water.
The dielectric decrement parameter β has salt-specificvalues.26, 30–34 In Table I, we show a range of suchvalues adopted from different experiments and computer
FIG. 1. A schematic drawing of water molecules around a monovalentcation in presence of an electrostatic field, E. Arrows represent the dipolesof water molecules while the hydrogen bond network is not shown explicitly.The water molecules in the vicinity of the cation form a hydration shelland are oriented along the field lines generated by the cation, leading to adecrease of their contribution to the screening of the external electrostaticfield. The more remote molecules are less affected by the cation andorient themselves along the external field lines. Furthermore, the cationpolarizability results in a different contribution to the electrostatic screeningas compared to the contribution of a water molecule.
Downloaded 17 Feb 2011 to 128.119.56.12. Redistribution subject to AIP license or copyright; see http://jcp.aip.org/about/rights_and_permissions

074705-3 Ion-specific effects: Dielectric decrement J. Chem. Phys. 134, 074705 (2011)
TABLE I. Values of the linear coefficient β, Eq. (1), in units of M−1 forvarious salts. [adapted from the references as indicated].
Ref. 26 Ref. 30 Refs. 31 and 32 Ref. 33 Ref. 34HCl –20 –18.1 ... ...- ...LiCl –14 –12.6 –11.55 ... ...NaCl –11 –11.8 ... –12.8 –10.77KCl –10 –11.8 ... ... –8.27CsCl ... –12.6 –7.79 ... ...RbCl –10 ... –7.96 ...NaF –12 –11.8 ... ... ...KF –13 –11 ... ... ...CsF ... –12.6 ... ... ...LiI ... –14.95 ... ... ...NaI –15 –14.17 ... ... ...KI –16 –13.38 ... ... ...CsI ... –14.17 ... ... ...NaOH –21 ... ... ... ...
simulations. The cited values are all negative and vary fromabout –8 to –21 M–1(dielectric decrement). There is also anoticeable spread of the β values, especially when one com-pares experiments with computer simulations. Examining theβ values given in Refs. 26 and 30 for homologous series of thehalides: Cl, F, and I, and the alkaline metals: Li, Na, K, Cs,and Rb, some remarks can be made. In some cases, a trendcan be seen where the magnitude of β decreases as the ionicradius (size) increases for the alkalines. This can be seen forthe homologous series of XCl where X is the alkaline ion. Forthe homologous halide series, the trend of |β| with the halideionic size is not monotonous. We note that the above linearform of the static dielectric constant ε(n) depends on the con-centration of the salt and cannot, in general, be entangled in asimple manner into separate ionic contributions of the cationsand anions. Any such separation requires additional hypothe-ses and experiments that are unavailable at present.
III. THE MODEL
In what follows, we concentrate on the dielectric decre-ment effects of ions (when β is negative) and systematicallyassess the modification wrought in the equilibrium ionic pro-files as well as interactions between two apposed charged sur-faces. Note that we treat the problem of counter-ions only (noco-ions) in order to simplify the model and results.
We set up a phenomenological model based on a modi-fication of the standard PB theory, which includes the effectof the counter-ion concentration n(�r ) on the local dielectricconstant, in a consistent manner, via the local variation ofn(�r ) in ε(n). This model can be formulated in two distinct butequivalent versions. First, one can dress it in the form of themodified PB theory starting with the appropriate generaliza-tion of the PB free-energy functional where the fundamentalquantity is the local electrostatic potential. Equivalently, asis shown in the Appendix, the PB free-energy functional canalso be cast in the form of a density functional theory (DFT),where the fundamental quantity is the local density of thecounter-ions, n(�r ).
The mean-field free energy is similar to the regular PBansatz, except for the coupling between the electrostatic field,−∇ψ , and the positively charged counter-ion concentration,n. For simplicity, we delimit ourselves to systems that aretranslationally invariant in the lateral (x, y) directions havinga spatial dependence only on the z-direction. The free energythen reads
F[ψ ′, ψ, n]/A =∫
dz
[− ε(n)
8π(ψ ′)2 + enψ
+ kBT n(log n − 1) − μn
]
+∑
s
e|σ |ψs, (2)
where A is the lateral cross-sectional area, e is the electroncharge, kB the Boltzmann constant, T the temperature, andμ the chemical potential. The last term is the contribution ofthe charged surfaces to the free energy, where −σ < 0 is thenegative surface charge density, ψs is the electrostatic surfacepotential, and the last term is summed over all charged sur-faces. Note that throughout the manuscript eσ is the surfacecharge density and σ is the corresponding number density.
Using the variational principle for the free energy,Eq. (2), with respect to n and ψ gives the Euler–Lagrangeequations determining the electrostatic potential and densityprofiles as follows:
δF
δψ= 0 ⇒ 4πen + d
dz(ε(n)ψ ′) = 0 , (3)
δF
δn= 0 ⇒ μ = − 1
8πε′(n)ψ ′2 + eψ + kBT log n , (4)
where ε′(n) = dε/dn.As was discussed in our previous work,35 as long as
the system has only one-dimensional spatial inhomogeneity,the pressure is a z-independent constant, and in fact, repre-sents the first integral of the Euler–Lagrange equations. Us-ing Eq. (25) of Ref. 35, we arrive at the following form of thepressure, P,
P = − 1
8π[ε(n) + ε′(n)n]ψ ′2 + kBT n = const . (5)
The pressure is composed of an appropriately modifiedMaxwell stress tensor, which takes into account the densitydependence of the dielectric constant,36 as well as the stan-dard “van ’t Hoff” term proportional to the counter-ion con-centration.
Combining Eqs. (3) and (5), the following first-order dif-ferential equation for n is derived:
dn
dz= −
√2πe2
kBT
n
f ′(n), (6)
where
f (n) = ε(n)
√n − P
ε(n) + nε′(n), (7)
and P = P/kBT . The solution of Eq. (6) yields the equi-librium profile of the counter-ion density. The boundary
Downloaded 17 Feb 2011 to 128.119.56.12. Redistribution subject to AIP license or copyright; see http://jcp.aip.org/about/rights_and_permissions

074705-4 Ben-Yaakov, Andelman, and Podgornik J. Chem. Phys. 134, 074705 (2011)
condition at the charged interface is obtained by tak-ing the variation of Eq. (2) with respect to the surfacepotential ψs ,
εsdψ
dz
∣∣∣∣s
= 4πeσ , (8)
where εs = ε(ns) is the value of the dielectric constant extrap-olated to the surface and ns is the counter-ion concentrationat the surface.
IV. THE SINGLE PLATE CASE
We first consider the case of a single charged plate placedat z = 0. This case can be regarded as a two-plate system inthe limit of infinite interplate spacing, where the pressure inEq. (5) vanishes, P = 0. The function f (n) from Eq. (7) isthen given by
f (n) = ε(n)√
n
ε(n) + nε′(n). (9)
Evaluating Eq. (5) at the surface with ε = εs and n = ns , weobtain an algebraic equation for ns , given by
ns = 2πe2σ 2
kBT ε2(ns)
(ε(ns) + dε
dn
∣∣∣∣s
ns
). (10)
As has already been noted in Sec. II, for ionic con-centrations of 0 < n < 1.5 M, the function ε(n) can be re-garded to a reasonable accuracy as linear in n, Eq. (1). Thisis a key assumption of our model where all the effects dis-cussed in Sec. II contribute to a single phenomenologicalparameter β = dε/dn. We stress that the linear dependencementioned in the previous sentence is a phenomenologicalapproach and cannot be justified theoretically for any valueof concentration.38
The derivative of f (n) is given by
f ′(n) = 2β2n2 + (ε0 + βn)(ε0 + 2βn)
2√
n(ε0 + 2βn)3, (11)
and the boundary condition, Eq. (10), can be expressed as acubic polynomial in ns as follows:
β2n3s + 2βε0n2
s +(
ε20 − 4πe2σ 2β
kBT
)ns − 2πe2σ 2ε0
kBT= 0.
(12)
A. The β = 0 profile
The equation for the counter-ion density profile that wederived above, Eq. (6), appears very different from what onefinds in the standard PB theory. Let us show that the PBsolution is indeed obtained by setting β = 0 in our model.Substituting β = 0 in Eq. (11), the density profile obeys thefollowing equation:
dnPB
dz= −
√8πe2
kBT ε0n3/2
PB , (13)
and its solution reproduces exactly the familiar profile ofGouy and Chapman (GC),37
nPB(z) = 1
2πlB
(1
z + λGC
)2
, (14)
where λGC = 1/(2πlBσ ) is the GC length, lB = e2/(ε0kBT )is the Bjerrum length, and εs = ε0 for the standard PB case.The counter-ion concentration at the surface is obtained viathe Grahame equation, nPB
s = 2πlBσ 2,37 or alternatively canbe expressed in terms of λGC, nPB
s = 1/(2πlBλ2GC).
B. The boundary condition for β �= 0
Returning to the general β �= 0 case, the counter-ion con-centration adjacent to the surface, ns , satisfies the more gen-eral relation given in Eq. (12). Introducing the dimensionlessparameters γ ≡ βnPB
s /ε0 and α ≡ ns/nPBs , Eq. (12) can be
rewritten as
γ = 1 − α ± √1 − α
α2, (15)
where nPBs ∼ σ 2 as obtained from the above mentioned
Grahame equation.It is evident from Eq. (15) that for any β �= 0,
α = ns/nPBs < 1 and the counter-ion close to the surface, is
reduced with respect to PB value. Surprisingly, even whenβ > 0 and the local dielectric constant increases (electrostat-ically favorable), there is an effective repulsion of the ionsfrom the interface.
It is also instructive to express Eq. (15) in terms of thedimensionless parameter q = εs/ε0 − 1 = βns/ε0, whichmeasures the β-dependent relative change of the dielectricconstant at the interface. The dimensionless algebraic equa-tion of the boundary condition, Eq. (15), can now be writtenin terms of γ and q,
q3 + 2q2 + (1 − 2γ )q − γ = 0 , (16)
and its solution yields
γ = q3 + 2q2 + q
1 + 2q. (17)
Using Eq. (17) one can analyze the dependence of εs , thedielectric constant value at the interface, on β.
In several limits the expressions of ns(β) and q(γ ) sim-plify in the following manner:
(i) For strongly negative β −1, equivalent to γ −1,the counter-ion concentration at the surface is decaying,
ns � − ε0
2β∼ −β−1 , (18)
while the change in the surface dielectric constantapproaches a limiting value q = −0.5, leading toεs = ε0/2. For these values of ns and εs the polarizationenergy [see right hand side of Eq. (5)] associated withthe water molecules is equal the energy of the ions “ef-fective” polarization, yielding a limiting value for theelectrostatic energy.
Downloaded 17 Feb 2011 to 128.119.56.12. Redistribution subject to AIP license or copyright; see http://jcp.aip.org/about/rights_and_permissions

074705-5 Ion-specific effects: Dielectric decrement J. Chem. Phys. 134, 074705 (2011)
FIG. 2. In (a) the ion concentration at the interface, ns , is plotted as a function of β. The inverse of Eq. (15) is denoted by the solid line. The surface chargedensity is σ = 0.01 Å−2. Approximated analytical solutions for several limits are denoted by roman numerals (see text). In (b) the parameter q is plotted as afunction of γ . The inverse of the exact relation, Eq. (17), is denoted by the solid line. The approximated analytical solutions are denoted by the same notationsas in (a).
(ii) For small |β| 1 or |γ | 1, the correction to ns issmall and given by
ns − nPBs
nPBs
= −(
βnPBs
ε0
)2
, (19)
while the leading order of q is linear in γ , q(γ ) � γ .(iii) In the limit of extremely polarizable ions (β, γ � 1),
ns varies as
ns �√
2ε0nPBs
β
[1−3
4
√ε0
2βnPBs
]∼ β−1/2 , (20)
and q (or εs) grows as
q =√
2γ
(1 − 3
4√
2γ
)∼ √
γ . (21)
One would expect that for β > 0, where the ions increasethe dielectric constant, the surface ionic density ns will be
increased as well. Surprisingly, ns is decreased for increasedβ as a result of the interplay between all the contributions, seeRef. 39.
The exact dependence of ns(β) from Eq. (15), and q(γ )from Eq. (17), is compared with the above limiting expres-sions in Fig. 2. There is a smooth crossover at γ12 � −1 be-tween regimes (i) and (ii), and similarly at γ23 � 1 for thecrossover between regimes (ii) and (iii). The crossover val-ues are taken to satisfy the conditions of the approximations.Calculating higher order terms for the three regimes givesintersection values that are similar to our crossover values.
C. The profiles for β �= 0
The above analysis for the limiting regimes for q(γ ) orequivalently εs(γ ) applies also for the concentration and di-electric profiles. We first present our results for negative β,which is the more prevalent case for most monovalent ions(e.g., halides and alkalines) (see Table I).
FIG. 3. Counter-ion concentration n(z) and local dielectric constant ε(z) profiles for γ = −1.8 < γ12. In (a) the solid line shows the counter-ion concentrationfor negative β = −20 M−1. The dashed line corresponds to the standard PB case (β = 0), as given by Eq. (14). In (b) the local dielectric constant ε(z) is shownfor the same β value. The surface charge density is σ = 0.01 Å−2 and the calculated surface values are nPB
s = 7.3 M, ns = 1.9 M and εs = 43.
Downloaded 17 Feb 2011 to 128.119.56.12. Redistribution subject to AIP license or copyright; see http://jcp.aip.org/about/rights_and_permissions

074705-6 Ben-Yaakov, Andelman, and Podgornik J. Chem. Phys. 134, 074705 (2011)
FIG. 4. Counter-ion concentration profile n(z) and local dielectric constant ε(z) for γ = 2.3 > γ23. In (a) the solid line shows the counter-ion concentration forpositive β = 25 M−1. The dashed line corresponds to the standard PB case (β = 0), as given by Eq. (14). In (b) the corresponding local dielectric constant isshown for the same β value. The surface charge density is σ = 0.01 Å−2 and the calculated surface values are nPB
s = 7.3 M, ns = 4.7 M, and εs = 197.
The concentration profile is shown in Fig. 3. It has aplateau in the vicinity of the surface, till about distances ofz � 5 Å and larger, where there is an algebraic decay as in theregular PB profile (dashed line). The value of γ = −1.8 usedin Fig. 3 is smaller than the crossover value, γ12 = −1 andlies within regime (i). For completeness, we also present inFig. 4 the β > 0 case, where γ = 2.3 is larger than γ23 = 1[regime (ii)]. Although the value of ns is reduced, the profileexhibits a regular algebraic decay similar to the PB profile(dashed line).
In the more common case of β < 0 (dielectric decrementby the ions), the ions should be depleted from the nearby wallregion. This proximity behavior of the counter-ion cloud bearssome resemblance to the case of steric effects,40 which leadsto similar (but not identical) exclusion of counter-ions fromthe vicinal region.
The crossover values γ12 can be transformed into re-lations between β and the surface charge density −σ ,yielding a regime diagram as shown in Fig. 5(a). The
crossover line between regimes (i) and (ii) is given by therelation
σ12 =√
ε0
2πlB|β12| , (22)
which holds only for β < 0. This crossover line separatesbetween concentration profiles with a plateau-like behaviorin the vicinity of the surface, to those where the concentra-tion profile is nearly identical to the PB one, and can be un-derstood in terms of the dual role played by counter-ions asthey accumulate at the surface. On one hand, just as in thestandard PB model, the ions are attracted to the oppositelycharged surface and diminish the local electrostatic field. Onthe other hand, for β < 0, the ions reduce the local dielec-tric constant and, hence, are repelled from the surface. Inregime (i), the latter prevails and leads to a plateau in thecounter-ion density when σ and |β| are above the crossoverline, as in Fig. 3(a).
FIG. 5. In (a) the regime diagram in the (β, σ ) plane in shown. Two cross-over lines separate the three limiting regimes: (i), (ii), and (iii). In (b) typicalconcentration and dielectric constant profiles for each regime are shown, with surface charge density, σ = 0.01 Å−2. The dashed line corresponds to regime (i)with β = −20 M−1, ns = 1.9 M, and εs = 43. The solid line corresponds to regime (ii) with β = 1 M−1, ns = 7.2 M, and εs = 87. The dotted line correspondsto regime (iii) with β = 25 M−1, ns = 4.7 M, and εs = 197.
Downloaded 17 Feb 2011 to 128.119.56.12. Redistribution subject to AIP license or copyright; see http://jcp.aip.org/about/rights_and_permissions

074705-7 Ion-specific effects: Dielectric decrement J. Chem. Phys. 134, 074705 (2011)
FIG. 6. Profiles of electric potential, concentration and dielectric constant for parameter range as in regime (i). In (a) the electrostatic potential ψ is shownfor σ = 0.01 Å−2 and β = −20 M−1. The solid line corresponds to the exact numerical solution, while the dotted line denotes the approximated one, Eq. (24),and the dashed line is the regular PB (β = 0) result. In (b) and its inset, the concentration and dielectric constant profiles are shown,respectively, for the sameparameters as in (a). The position of l = 2.3 Å as calculated from Eq. (25) is marked in (a), (b), and the inset. It corresponds to the crossover from the slowlyvarying behavior to regular PB algebraic decay.
Similarly, the crossover line between regimes (ii) and (iii)is given by
σ23 =√
ε0
2πlBβ23, (23)
which holds only for β23 > 0. In regime (iii) large values ofβ increases substantially the value of ε close to the surface[Fig. 4(b)], but has no large effect on n(z) ≈ nPB(z). Thissomewhat surprising result is due to the attenuation of theelectrostatic attraction for very large increase in the values ofε at the surface.
In Fig. 5(b), we demonstrate the qualitative differencebetween the various regimes by plotting three correspondingcounter-ion concentration profiles. For all shown profiles, thesurface charge concentration is σ = 0.01 Å−2, while the pa-rameter β takes the values β = −20, 1, and 25 M−1 for thedashed, solid, and dotted lines, respectively.
For the profiles of regime (i), β < 0, one can calculateapproximately the electrostatic potential in the vicinity of thecharged surface by assuming that the counter-ion concen-tration varies slowly close to the surface and roughly obeysn ≈ ns . The potential is then given by the quadratic form
ψ(z) � 2πe
ε0 + βns(−ns z2 + 2σ z) . (24)
The width of the vicinal plateau, l, can be estimated by notingthat the electrostatic field for which the dielectric decrementbecomes negligible is simply related to the crossover value,σ12 given in Eq. (22). By demanding that −ψ ′(l), the electro-static field at z = l matches −4πeσ12/(ε0 + βns), the plateauwidth l is estimated to be
l = 2σ|β|ε0
−√
2|β|πlBε0
, (25)
where ns � ε0/(2|β|) in regime (i), Eq. (18). The profilefor z > l can then be estimated as a regular PB profilewith adjusted surface charge σ = σ12 and a shifted z axis,z → z − l. The validity of Eqs. (24) and (25) is examined
in Fig. 6 by comparing them to the exact numerical results.Several observations are worth noticing. First, the value ofl � 2.3 Å is rather short-range. It gives an estimate to thewidth of the depleted ionic layer. Second, the assumption ofa saturated ionic layer reproduces well the electric potentialup to z � 3l.
When compared to the corresponding PB results, theelectrostatic potential shows a marked increase depend-ing on the dielectric decrement. For parameters used inFig. 6, the electrostatic potential almost doubles in sizeas compared with its standard PB value. The effect per-sists for z up to several dozens of angstroms. Nevertheless,the more important effect of the electrostatic potential onthe ionic density itself is much shorter ranged, and is at-tributed to the spatial variation of the dielectric response, seeinset Fig. 6(b).
V. THE PRESSURE FOR THE TWO-PLATE SYSTEM
We now move on to analyze the case of two apposedcharged planar surfaces. For simplicity sake, we restrict our-selves to the symmetric case where two equally charged platesare located at z = ±D/2 and evaluate the corresponding dis-joining pressure P = P/kBT .
For an arbitrary function ε(n) and P �= 0, the boundarycondition, Eq. (8), is generalized as follows:
ns − P = 2πe2σ 2
kBT ε2(ns)
(ε(ns) + dε
dn
∣∣∣∣s
ns
). (26)
This equation can then be cast into a form that contains onlyns and ε(ns) without its derivatives,41
2πe2σ 2
kBT ε(ns)ns+ log
ns
P+ P
ns= const. (27)
It shows that the pressure is in fact determined solely by thevalues of the surface energy and the (ideal) entropy of mixingat the surface.
Downloaded 17 Feb 2011 to 128.119.56.12. Redistribution subject to AIP license or copyright; see http://jcp.aip.org/about/rights_and_permissions

074705-8 Ben-Yaakov, Andelman, and Podgornik J. Chem. Phys. 134, 074705 (2011)
FIG. 7. The pressure P is shown as a function of the separation D for surfacecharge density σ = 0.01 Å−2. The solid, dashed, dotted and dash-dotted linescorrespond to values of β = 0,−5, −10, and −20 M−1, respectively.
Employing the linearity assumption, ε(n) = ε0 + βn, thederivative of f (n) is given by
f ′(n) = 2β2n(n − P) + (ε0 + βn)(ε0 + 2βn)
2√
(n − P)(ε0 + 2βn)3, (28)
and the boundary condition, Eq. (26), can be expanded as acubic polynomial in ns as follows:
β2n3s + (2βε0 − β2 P)n2
s +(
ε20 − 2β Pε0
−4πe2σ 2β
kBT
)ns −
(Pε2
0 + 2πe2σ 2ε0
kBT
)= 0 . (29)
The counter-ion density profiles are given by Eqs. (6),(28), and (29), while the dependence of the pressure on theinter-plate separation D is obtained by solving these equa-tions for various values of P , and inverting the function D(P)into P(D).
Let us first verify that our theory has the correct PB limitfor β = 0. The differential equation of the density, Eq. (6)reads
dn
dz= −
√8πe2
kBT ε0n√
(n − PPB) , (30)
where PPB is the standard PB pressure. With K = K (P)=
√2πlB P , the solution of the above equation can be shown
to be
arctan
√n(z) − P
P= −K z, (31)
or can be expressed as
n(z) = P(1 + tan2 K z) = P
cos2 K z. (32)
This is exactly the standard solution of the GC equation be-tween two equally charged walls. The pressure is then ob-tained by solving the boundary condition37 that reduces to thefollowing transcendental equation:
K D tan
(K D
2
)= D
λGC. (33)
For the general case of β �= 0, the basic equation for thecounter-ion density profile as well as the boundary conditionhave to be solved numerically. In Fig. 7, the dependence ofthe pressure P on the separation D is shown for several val-ues of β. The dashed line of β = −5 M−1 is almost identicalto the standard PB prediction given by the solid line (β = 0).This implies that β = −5 M−1 is roughly the value where thedielectric decrement begins to affect the disjoining pressure.For more negative β = −20 M−1, the pressure strongly de-pends on the dielectric decrement and increases substantiallywith respect to the PB prediction. For example, at a separa-tion D = 25 Å , the pressure P = 0.7 M with β = −20 M−1
is increased by 67% comparing to PPB = 0.42 M.For small separations (and large pressure) the assumption
of linear dependence of ε on n breaks down due to high values
FIG. 8. In (a) the pressure deviation as compared to the PB pressure (β = 0), �P = P − PPB, is plotted as function of D, for surface charge densityσ = 0.01 Å−2. In (b) similar results as in (a) are plotted on a log–log scale. The dashed, dotted, and dash-dotted lines correspond to values of β = −5,−10,and −20 M−1, respectively.
Downloaded 17 Feb 2011 to 128.119.56.12. Redistribution subject to AIP license or copyright; see http://jcp.aip.org/about/rights_and_permissions

074705-9 Ion-specific effects: Dielectric decrement J. Chem. Phys. 134, 074705 (2011)
FIG. 9. In (a) the total pressure P is shown as a function of the parameter β for surface charge density σ = 0.01 Å−2. In (b) the pressure correction, �P= P − PPB, as compared to the PB pressure, is similarly plotted. The solid, dashed, dotted and dash-dotted lines correspond to values of D = 40, 30, 20 and17 Å, and standard PB pressure PPB = 0.82, 0.63, 0.31 and 0.19 M respectively.
of n > 1.5 M. The results shown in Fig. 7 include only separa-tions where the model is still valid. In the regime of extremelyhigh surface counter-ion densities our model predicts unphys-ical results, such as negative local dielectric constant (only inthe case of P > 0). This breakdown does not imply any deepinconsistency but is just a straightforward consequence of thelinearity ansatz, Eq. (1). This problem can easily be overcomeby introducing a more general nonlinear ansatz with a satura-tion behavior.
The deviation �P = P − PPB of the pressure with re-spect to the PB pressure PPB, is plotted in Fig. 8(a) as a func-tion of D. The �P deviation is significant for separations aslarge as a few nanometers. For D < 30 Å, the relative devi-ation may be as large as 65%, while for D � 50 Å the devi-ation is smaller than 0.05 M, leading to corrections smallerthan 20%. In Fig. 8(b), the deviation is plotted on a log–logscale, where �P shows a power-law decay, �P ∼ Dα . Witha linear fit the extracted α exponent is α = −2.7,−2.8, and−3.1 for β = −5,−10, and −20 M−1, respectively.
For β −1 one can estimate the pressure analyticallyusing rescaled separation Deff and surface charge density σeff.We consider an approximated profile with a plateau near thesurface, having a thickness
l = σ − σ12
ns, (34)
employing the same arguments as in Sec. IV C. Note thatthe values of ns and σ12 are now given by Eq. (29) insteadof Eq. (12). The pressure associated with this profile can becalculated from the region where the behavior is PB-like,namely, for −D/2 + l < z < D/2 − l. This region can beconsidered as an independent profile with a surface chargedensity σeff = σ12 and separation Deff = D − 2l. In analogywith the two limiting regimes of the standard PB theory,37
we find them here as well. First, ideal-gas regime whereDeff λeff
GC and the pressure depends inversely on the sep-aration: P � σeff/Deff, where the rescaled GC length is de-fined as λeff
GC = 1/(2πlBσeff). Second, when Deff � λeffGC , the
pressure dependence is given by the standard Gouy–Chapman
result valid for sufficiently large inter-surface separations, i.e.,P � π/(2lB D 2
eff).The pressure as a function of the parameter β is presented
in Fig. 9(a) for several values of the separation D. The signif-icance of the dielectric decrement effect becomes substantialfor β < −5 M−1 as can be seen in the plot. For smaller val-ues of β the deviation from the standard PB value, P(β = 0)is small and negligible for all the values of D. The magni-tude of the deviation �P as a function of β is presented inFig. 9(b). For β < −11.5 M−1, the deviation is of the order ofat least 10% of the total pressure for all the values of D. Forexample, for D = 30 Å and β = −11.5 M−1, the pressureP = 0.37 M and the deviation is �P = 0.053 M.
For completeness, we present pressure profiles for β > 0in Fig. 10. It is evident from comparing Fig. 8(a) and Fig. 10that for positive values of β the deviation �P is much smaller.This is in agreement with the analysis of the density profiles(see Sec. IV C), where a similar small deviation from the stan-dard PB profile is found for β > 0.
FIG. 10. The pressure correction, �P = P − PPB as a function of D, is plot-ted for several β > 0 values: solid, dashed, and dotted lines correspond toβ = 5, 10, and −20 M−1, respectively.
Downloaded 17 Feb 2011 to 128.119.56.12. Redistribution subject to AIP license or copyright; see http://jcp.aip.org/about/rights_and_permissions

074705-10 Ben-Yaakov, Andelman, and Podgornik J. Chem. Phys. 134, 074705 (2011)
VI. CONCLUSIONS
The model presented in this work accounts for localchanges in the dielectric constant of a solution due to thepresence of ions with an effective polarization effect. Assum-ing linear dependence of the dielectric constant ε on the ionicconcentration n, we introduce a phenomenological parameterβ that describes the relation between ε and n, ε = ε0 + βn.This parameter is ion-specific and as shown in several ex-periments and computer simulations its value is negative andvaries between −8 and −21 M−1.
The concentration dependence of the dielectric constantleads to an additional coupling between the counter-ion con-centration and the electrostatic potential. Consequently, thecounter-ions play a dual role. On one hand, their net chargeinduces an attractive interaction with the charged surface. Onthe other hand, the counter-ions effective dipole moment dueto the concentration dependence of the dielectric constantleads to another electrostatic interaction that could be eitherattractive for β > 0, or repulsive for β < 0. The interplay be-tween theses two interactions leads to changes of the free-energy minimal configuration.
Analyzing the behavior in (β,σ ) parameter plane, wefind three regimes. The most pronounced effect is found forregime (i) and β −1 M−1 , where ions are strongly de-pleted from the charged surface due to the decrement of ε
and the resulting penalty of electrostatic energy. This deple-tion results in a plateau of the ionic concentration profile closeto the charged surface. We estimate the plateau thickness an-alytically and find that it is of the order of few angstroms. Inregime (ii) where |β| < 1 M−1, the effect of local changes ofthe dielectric constant is negligible comparing to the contribu-tion that comes from the net charge of the ions. The profilesin this regime are characterized by an algebraic decay simi-lar to the standard PB theory. For β � 1 M−1 in regime (iii),the dielectric constant is increased nearby the surface, leadingto a weaker attraction of the ions to the surface. The surfaceconcentration is reduced comparing to the standard PB theory,but the overall change in the profiles is small.
Calculating the disjoining pressure between two planarsurfaces, we find a substantial increase for negative valuesof β of the order of −10 M−1. The deviation of the pres-sure calculated in our model as compared to the standard PBpressure reaches ∼200% for β = −20 M−1 and a separationD � 18 Å. The range of this additional effect persists up toa few nanometers. For β = −10 M−1, the deviation is sig-nificant for separations smaller than ∼30 Å. The dependenceof the correction �P on the separation D exhibits an inversepower-law decay. The power varies between −2.7 to −3.1 fordifferent values of β as discussed in Sec. V. For positive val-ues of β we find that the pressure does not vary substantiallycomparing to the standard PB prediction.
It is rather important to notice that the effect of the di-electric decrement on the disjoining pressure shows up as aneffective “solvent structural force”,42 see Fig. 7, between thetwo charged surfaces that acts at relatively small interplateseparations, though no structural forces were assumed a prioriin our approach. This might signal a more general relationshipbetween the dielectric decrement and water structure effects.
In the present formulation, where the dielectric decrement it-self does not contain any spatial scale, the dependence of theadditional “water structural force” on the interplate separa-tion appears to scale with an inverse power of this separation.However, for a model where the dielectric decrement levelsoff for larger values of the counter-ion density, the additionalphenomenological constant will introduce a new length scaleinto the problem. Then, possibly also the additional “waterstructural force” would show such a length scale.
Further refinements and applications can be considered.For example, the model can be generalized to include saltions, instead of counter-ions only as was done here. This willintroduce another screening effect (the Debye length) that willcompete with the other contributions. Moreover, the concen-tration dependence of the dielectric constant can be taken toreproduce the real experimental results in order to improvethe quantitative accuracy. Finally, by generalizing the modelto curved geometries it will be possible to calculate potentialof mean force between spheres and cylinders.
The results derived in this work are pertinent to themean-field approximation implemented specifically for theplanar geometry, where all effects of the dielectric disconti-nuity at the bounding surfaces, i.e., the image charge effectsvanish identically. This is connected with the fact that dielec-tric images, being due to surface-induced charges, imply thatthe electrostatic potential depends not just on one coordinatenormal to the dielectric interface, but also on the in planetransverse coordinates. Since on the mean-field level for pla-nar interfaces the mean potential by definition depends onlyon the normal coordinate, all image effects are thus absent.43
This is true not only for the usual image interactions butalso for the image part of the self-energy, i.e., the Born en-ergy. In any approximation that is beyond the simple mean-field approach, such as, e.g., the systematic strong couplingexpansion22 or other approximations,23 these image and self-energy terms naturally enter the formulation and have im-portant consequences.44 Furthermore, it was shown recentlythat the image effects are important only for strongly coupled(polyvalent) counter-ions whereas for monovalent ones theyare quite small.45 This also limits the validity of our approachto mostly monovalent ions and weakly charged interfaces butthis is exactly the regime where many if not most of the ion-specific effects have been duly noted.2
The results presented in this work suggest that the ef-fect of ions on the local dielectric constant should be takeninto account on an equal footing as other ion-specific inter-actions such as dispersion and hydration. Furthermore, thismodel may serve as a platform for more detailed models, tak-ing into account other ion-specific effects.
ACKNOWLEDGMENTS
We would like to thank Daniel Harries for many sugges-tions and comments that were in particular instrumental inthe initial stage of this work. We also benefited from dis-cussions and comments by Haim Diamant and Derek Fry-del. This work was partially supported by the U.S.-Israel Bi-national Science Foundation under Grant No. 2006/055, the
Downloaded 17 Feb 2011 to 128.119.56.12. Redistribution subject to AIP license or copyright; see http://jcp.aip.org/about/rights_and_permissions

074705-11 Ion-specific effects: Dielectric decrement J. Chem. Phys. 134, 074705 (2011)
Israel Science Foundation under Grant No. 231/08, and theAgency for Research and Development of Slovenia (ARRS)through the Research Program P1-0055 and Research ProjectJ1-0908.
APPENDIX A: THE DFT FORMULATION FORTWO-PLATE SYSTEM
We would like to show how to extend our for-mulation in Sec. III to the case where other inter-actions, besides electrostatic ones, also depend on thedensity profile, n(z). Just as in Sec. V, the equallycharged plates are taken to be at z = ±D/2 yielding thatψ ′(z = 0) = 0 at the symmetric midplane, z = 0. The firstEuler–Lagrange (EL) equation, Eq. (3), still remains valid,
ψ ′(z) = − 4πe
ε[n(z)]
∫ z
0n(z′)dz′. (A1)
A second integration would then yield ψ(z) as a function ofn(z). Furthermore, it follows from the same mentioned ELequation that
enψ = − d
dz
(ε(n)
4πψψ ′
)+ ε(n)
4πψ ′2. (A2)
Instead of performing the minimization on the free energywith respect to the density field, n, as in Eq. (4), we will firstexpress the free energy as a functional only of n. To be fol-lowed only then by a free energy variation. Inserting Eq. (A2)into the square brackets of the free energy, Eq. (2), the freeenergy becomes
F/A =∫
dz
[ε(n)
8πψ ′2 − d
dz
(ε(n)
4πψψ ′
)
+ kB T n(log n − 1) − μn
]+ �seσψs . (A3)
By integrating explicitly the second term in Eq. (A3) it is easyto see that this contribution exactly cancels the surface term.The free energy per unit surface area then assumes the form
F/A =∫ (
ε(n)
8πψ ′2 + kB T n(log n − 1) − μn
)dz. (A4)
Substituting the expression for the local ψ ′ field, Eq. (A1),we get
F[n]/A =∫ [
4πe2
2ε[n(z)]
(∫ z
0n(z′)dz′
)2
+ kB T n(z)(log n(z) − 1) − μn(z)
]dz . (A5)
The free energy is now a functional of the local density n(z)only. The variation of the above functional with respect to n(z)leads to
eψ − 1
8π
dε(n)
dnψ ′2 + kB T log n − μ = 0, (A6)
which is exactly the second EL equation, Eq. (4), derived inSec. III within the PB formulation.
The two formulations are indeed completely equivalent.The DFT formulation is preferable when one has additional
terms in the free energy that depend either on the density orits derivatives, but this venue is left for future work.
1W. Kunz, J. Henle, and B. W. Ninham, Curr. Opin. Colloid Interface Sci. 9,19 (2004)
2K. D. Collins and M. W. Washabaugh, Q. Rev. Biophys. 18, 323 (1985).3A. Heydweiller, Ann. Phys. 33, 145 (1910).4F. A. Long and G. C. Nutting, J. Am. Chem. Soc. 64, 2476 (1942).5J. Ralston and T. W. Healy, J. Colloid Interface Sci. 42, 1473 (1973).6K. D. Collins, Methods 34, 300 (2004).7M. Dishon, O. Zohar, and U. Sivan, Langmuir 25, 2831 (2009).8R. M. Pashley, J. Colloid Interface Sci. 83, 531 (1981).9D. C. Rau and V. A. P. Parsegian, Biophys. J. 61, 260 (1992).
10R. Podgornik, D. Rau, and V. A. Parsegian, Biophys. J. 66, 962 (1994).11J. Chik, S. Mizrahi, S. Chi, V. A. Parsegian, and D. C. Rau, J. Phys. Chem.
B 109, 9111 (2005).12M. Manciu and E. Ruckenstein, Adv. Colloid Interface Sci. 105, 63
(2003).13M. Manciu and E. Ruckenstein, Adv. Colloid Interface Sci. 105, 177
(2003).14W. Kunz, Curr. Opin. Colloid. Interface Sci. 15, 34 (2010).15W. Kunz, P. Lo Nostro, and B. W. Ninham, Curr. Opin. Colloid Interface
Sci. 9, 1 (2004).16B. W. Ninham and V. Yaminski, Langmuir 13, 2097 (1997).17L. Onsager and N. N. T. Samaras, J. Chem. Phys. 2, 628 (1934).18Y. Levin, Phys. Rev. Lett. 102, 147803 (2009).19Y. Levin, Phys. Rev. Lett. 103, 257802 (2009).20R. R. Netz, Curr. Opin. Colloid Interface Sci. 9, 192 (2004).21P. Jungwirth and D. J. Tobias, Chem. Rev. (Washington, D.C.) 106, 1259
(2006).22A. Naji, S. Jungblut, A. G. Moreira, and R. R. Netz, Physica A 352, 131
(2005).23A. Onuki, Phys. Rev. E 73, 021506 (2006). In this work the image effects
are dealt with on what technically is not a mean-field approximation inthe standard sense of the term. Formally this approach is difficult to typifyand/or systematically justify.
24E. J. Verwey and J. T. G. Overbeek, Theory of the Stability of LyophobicColloids (Elsevier, Amsterdam, 1948).
25P. Debye, Polar Molecules (Dover, New York, 1929).26J. B. Hasted, D. M. Ritson, and C. H. Collie, J. Chem. Phys. 16, 1
(1948); J. B. Hasted, Aqueous Dielectrics (Chapman and Hall, London,1973).
27M. Paunovic and M. Schlesinger, Fundamentals of Electrochemical Depo-sition (Wiley, New York, 2006).
28G. N. Patey and S. L. Carnie, J. Chem. Phys. 78, 5183 (1983).29B. Hubbard and L. J. Onsager, J. Chem. Phys. 67, 4850 (1977).30E. Glueckauf, Trans. Faraday Soc. 60, 1637 (1964).31Y. Wei and S. Sridhar, J. Chem. Phys. 92, 923 (1990).32Y. Wei and S. Sridhar, J. Chem. Phys. 96, 4569 (1992).33R. Buchner, G. T. Hefter, and P. Mn. May, J. Phys. Chem. A 103, 1 (1999).34A. Chandra, J. Chem. Phys. 113, 903 (2000).35D. Ben-Yaakov, D. Andelman, D. Harries, and R. Podgornik, J. Phys.
Chem. B 113, 6001 (2009).36L. D. Landau, E. M. Lifshitz, and L. P. Pitaevskii, Electrodynamics of Con-
tinuous Media, 2nd ed. (Elsevier, New York, 1985).37D. Andelman, in Soft Condensed Matter Physics in Molecular and Cell
Biology, edited by W. Poon and D. Andelman (Taylor & Francis, New York,2006) pp 97–122.
38In his book,25 Debye discusses the dependence of the dielectric constant onthe ionic concentation by treating the ions as cavities with a different valueof dielectric constant compared to the surrounding solution. The resultsshow that the value of β depends on the interior and exterior dielectricconstant and on the size of the cavity. According to Debye, for most ofthe salts, the interior dielectric constant should be taken much smaller (ε= 1) than the aqueous one (ε = 80), leading to β < 0. The delicate point ishow to determine the size of the cavity, and Debye discusses that at length.However, the final conclusion of Debye is that there is no clear conclusionabout this issue.
39The lowering of the surface density of ions is a conse-quence of two separate effects, which become apparent ifthe equilibrium density of ions is written in the form (i)n = n0(ψ ′) exp(−eψ/kBT ). One is the direct effect of the dielectricdecrement, which leads to the changes of the Boltzmann distribution, ascan be seen from (ii) log n0(ψ ′) = μ/kBT + β(ψ ′)2/(8πkBT ). On the
Downloaded 17 Feb 2011 to 128.119.56.12. Redistribution subject to AIP license or copyright; see http://jcp.aip.org/about/rights_and_permissions
074705-12 Ben-Yaakov, Andelman, and Podgornik J. Chem. Phys. 134, 074705 (2011)
other hand, there is also an indirect effect of the dielectric decrementon the potential itself that can be obtained from the Poisson equation(iii) 4πen + (ε(n)ψ ′)′ = 0. The total effect of the dielectric decrement–increment then depends on the combined action of both mechanisms andis obviously very nonlinear. In fact one can see by combining (i) and (iii)that for nonvanishing β the effect of dielectric decrement–increment isquadratic in β and thus does not depend on its sign. See Eq. (19) andregime (ii) in the adjacent text.
40I. Borukhov, D. Andelman, and H. Orland, Phys. Rev. Lett. 79, 435(1997).
41Let us write the boundary condition in an alternative form. Not-ing first that ε−2(ns )[ε(ns ) + dε
dn |s ns ] = −n2s
ddns
[1/(ε(ns )ns )] and
ns = P + n2s
ddns
[log (ns/P) + P/ns ], the equation for the sur-face counter-ion density ns can be written as transcenden-tal relation that depends on the pressure P as a parameter,
2πe2σ 2/(kBT ε(ns )ns ) + log (ns/P) + P/ns = const. Indeed, if mul-tiplied by ns , even in the case of a linear dependence of the dielectricfunction on the counter-ion concentration, the pressure can thus be writtenin a local form that contains only the surface electrostatic energy and thesurface (ideal) entropy.
42D. M. LeNeveu, R. P. Rand, and V. A. Parsegian, Nature (London) 259,601 (1976); G. Cevc, R. Podgornik, and B. Zeks, Chem. Phys. Lett. 91,193 (1982).
43M. Kanduc and R. Podgornik, Eur. Phys. J. E 23, 265 (2007).44M. Kanduc, A. Naji, and R. Podgornik, J. Chem. Phys. 132,
224703 (2010); Y. S. Jho, M. Kanduc, A. Naji, R. Podgornik,M. W. Kim, and P. A. Pincus, Phys. Rev. Letts. 101, 188101(2008).
45M. Kanduc, A. Naji, Y. S. Jho, P. A. Pincus, and R. Podgornik, J. Phys.:Condens. Matter 21 424103 (2009).
Downloaded 17 Feb 2011 to 128.119.56.12. Redistribution subject to AIP license or copyright; see http://jcp.aip.org/about/rights_and_permissions