Dibas shrestha
38
Characteristics of Summer Precipitation around the Western Ghats and Myanmar West Coast Dibas Shrestha Nepal Academy of Science and Technology (NAST) 2/2/2015
Transcript of Dibas shrestha

Characteristics of Summer Precipitation
around the Western Ghats and Myanmar
West Coast
Dibas Shrestha
Nepal Academy of Science and Technology (NAST)
2/2/2015

Study Area and Summer Rainfall
2/2/2015 Page 2
WG: Western Ghats and MWC: Myanmar West Coast
Mean summer rainfall 1998-2010

2/2/2015 Page 3
Data
Near-surface: Lowest point in the clutter-free ranges
Average rain rate (mm/h) = Rain frequency × Rain conditioned rain rate (mm/h)
Rain frequency = Number of rain samples / Number of samples
Conditional rain rate = Near-surface rain rate / Number of rain sample
Data
source
Period Horizontal
resolution
Data characteristics
TRMM/PR
(V6)
1998- 2010
0.05° × 0.05°
2A25 - Instantaneous near-surface
rainfall and rain-type
2A23 - Storm-top height (Height of
the precipitation column)
JRA-25 1979-2008 1.125° × 1.125° Temperature, wind, specific
humidity
GTOPO30 0.05° × 0.05 ° Elevation

Central Himalayan Region (Shrestha et al. 2012)
2/2/2015 Page 4
Clear double band of rainfall
maxima over CHR.
Intense rainfall over
low-altitude areas.
High frequency of rainfall
over higher altitude areas.

2/2/2015 Page 5
Horizontal distribution of rainfall
(Xie. et al., 2005) Rain rate (mm/d)
Cond. rain rate (m/h) Frequency (%)
(Contour: 500 m)

2/2/2015 Page 6
Typical examples of cross-shore distribution
MWC WG Elev. (m)
WG
Topography (m)
Freq (%)
Cond rain rate (mm/h)
Rain rate (mm/d)
Rai
n r
ate
(mm
/d),
Fre
q. (%
)
Co
nd
. R
ain
rat
e (m
m/h
)
MWC MWC
WG: Major rain peak appears near the top of the mountains corresponds to high rain frequency.
MWC: Peak rainfall coincides with high conditional rain rate. Broader peak of rain frequency
extended from mountain top to the hundreds of kilometer off the coastline.

2/2/2015 Page 7
Storm-top height and vertical profile
• Downward increasing rain rate—oceanic type
• Deeper convections over MWC regions

2/2/2015 Page 8
Vertical structure of rainfall
2/2/2015 Page 8 Lon (Deg.)
Hei
gh
t (m
)
WG MWC
WG: The rain-top height is higher over
the top of the mountains and coastal
ocean.
MWC: The rain-top height is higher
and homogenous.
Coastline Coastline
WG MWC

2/2/2015 Page 9
Atmospheric stability WG MWC
Shaded: Equivalent potential temperature (K)
Vector: Horizontal wind (m/s)
Contour: Specific humidity (gm/kg)
• Remarkable difference in low-level θe.
• High humidity caused higher θe
in the MWC regions.

2/2/2015 Page 10
Schematic of precipitation mechanisms

2/2/2015 Page 11
Thank you

2/2/2015 Page 12
General features
Rai
nfa
ll (
mm
/d)
Elevation (m) 0
0
Wet case Dry case
Ele
vat
ion
Wet case Dry case
Low-level moisture condition is a key factor.
• Rainfall, topography and atmospheric instability
Central Himalayas
Wet case Dry case
Summer monsoon Pre-monsoon
Active
periods (wet)
Break periods
(dry)
Coastal regions
Myanmar west coast (wet) Western Ghats (dry)
Andes regions
Central Andes (wet) Southern Andes (dry)

Summary
2/2/2015 Page 13
• Central Himalayan region
More intense rainfall during pre-monsoon season, particularly over higher
altitudes.
Double rain peaks: First, along the Sub-Himalayas (~500-700 m) attributed to
intense rainfall; second, along the steep slope of Lesser Himalayas (2,000-2,200)
to frequent rainfall.
• Coastal regions
More humid condition favors broader rainfall maxima over Myanmar west
coast.
• Andes regions
Maximum rainfall over central and southern Andean foothills is attributed to
rainfall frequency and intensity, respectively.
• The characteristics of the precipitation along the continental mountains are distinct
from those of coastal mountains.
• Steep mountains favor more-frequent nonextreme convections, which contribute a
significant amount of rainfall over slopes in regions with large rain totals.

2/2/2015 Page 14
Thank you very much for
your kind attention!
2/2/2015 Page 15
Presentation outline
2/2/2015 Page 15
1. Introduction
2. Objective
3. Study area and subregions of study
4. Data and methodology
5. Results
I. South Asia
(a) Central Himalayan region
(b) Coastal regions (Western Ghats: WG and Myanmar
west coasts: MWC)
II. Andes regions
6. Summary

2/2/2015 Page 16 2/2/2015 Page 16
Introduction (Cont…) • Dairaku et al. (2004), Engman and Hershfield (1969), Sokol and Bližňák, (2009)
Larger quantities of rainfall recorded at higher altitudes are attributed to
greater duration and higher frequency of rainfall.
• Bookhagen and Burbank (2006), and Bookhagen and Strecker (2008)
Topography, relief and TRMM derived rainfall relationships
Large-scale relationships.
Bookhagen and Burbank (2006)

2/2/2015 Page 17 2/2/2015 Page 17
TRMM PR uncertainty
Major sources of error (Anders et al., 2006)
• Retrieval error: Remote sensing methods
• Sampling error: Low earth orbit satellite with narrow swath (250 km)
Sampling error is small enough to resolve statistically significant
precipitation patterns in regions with large precipitation totals (Nesbitt and
Anders, 2009).
Shrestha et al. (2012)

2/2/2015 Page 18
Variation of rainfall with elevation
2/2/2015 Page 18
• Primary peak (~500 m): Rain conditioned
rain rate is dominant.
• Secondary peak (~2,100 m): Frequency
is dominant
• Linear decrease of rain-conditioned rain rate
Area averaged analysis:- Rainfall characteristics are averaged for each 200 m
altitude interval up to 5,000 m MSL.
0
2
4
6
8
10
12
14
16
18
0 1000 2000 3000 4000 5000Rai
nfa
ll (m
m/d
ay),
Co
nd
. rai
n
rate
(m
m/h
r) &
Fre
q. (
%)
Elevation (m)
JJA
Cond. rain rate
Rainfall
Frequency
0
1000
2000
3000
4000
5000
6000
7000
0 10 20 30 40
Height (m)
Topography
St. ht. (above MSL)
St. ht. (AGL)
S-N pixel
Storm height JJA
Storm height is approximately 6 km, with
clear peak near the top of the slope and a
small peak at the bottom.

2/2/2015 Page 19 2/2/2015 Page 19
Vertical structure of rain (84.5o E)
MAM: Deep system with intense rain over
low-altitude areas
JJA: Rather uniform rain-top height

2/2/2015 Page 20 2/2/2015 Page 20
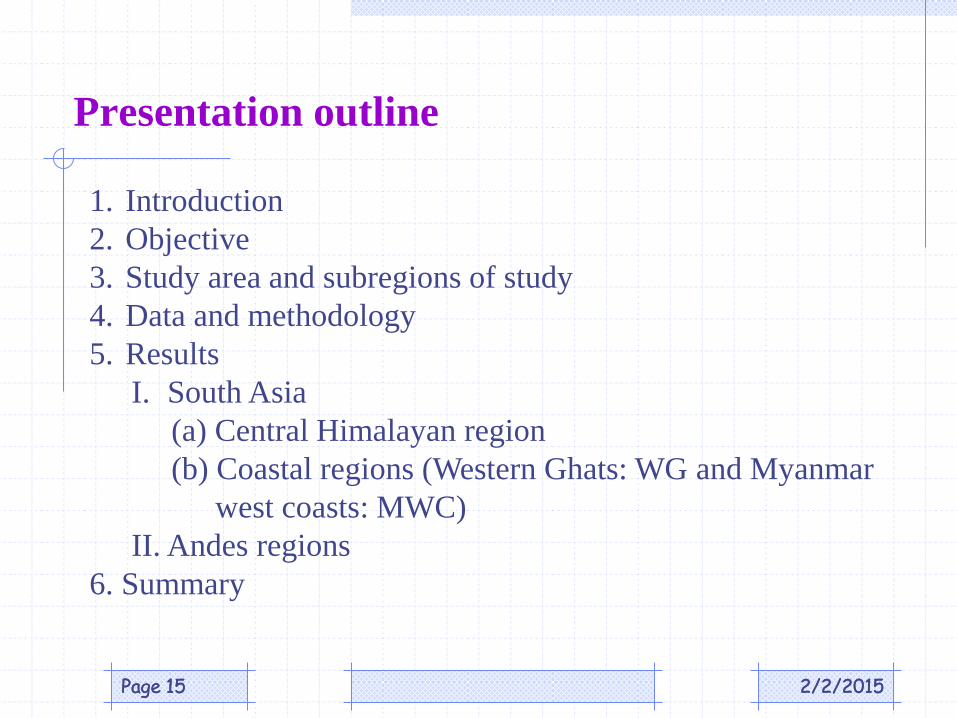
Synoptic conditions
Strong instability during rainy days
in MAM.
Indicator of atmospheric instability:
Difference between equivalent
potential temperature (θe925- θe600
hPa).
Color: Equivalent potential
temperature (K)
Vector: Horizontal wind (m/s)
Contours: Specific humidity (gm/kg)
Gray shading: Elevation above 800 m
MAM: Case study during May in 2004.
2/2/2015 Page 21 2/2/2015 Page 21
Schematic of precipitation mechanisms in the
central Himalayas

2/2/2015 Page 22

2/2/2015 Page 23 2/2/2015
0
1
2
3
4
5
6
7
0 1000 2000 3000 4000 5000
Elevation (m)
Rai
n r
ate
(mm
/hr)
(a)
Stratiform rain
0
5
10
15
20
0 1000 2000 3000 4000 5000
Elevation (m)
No
. of
even
ts
(b)
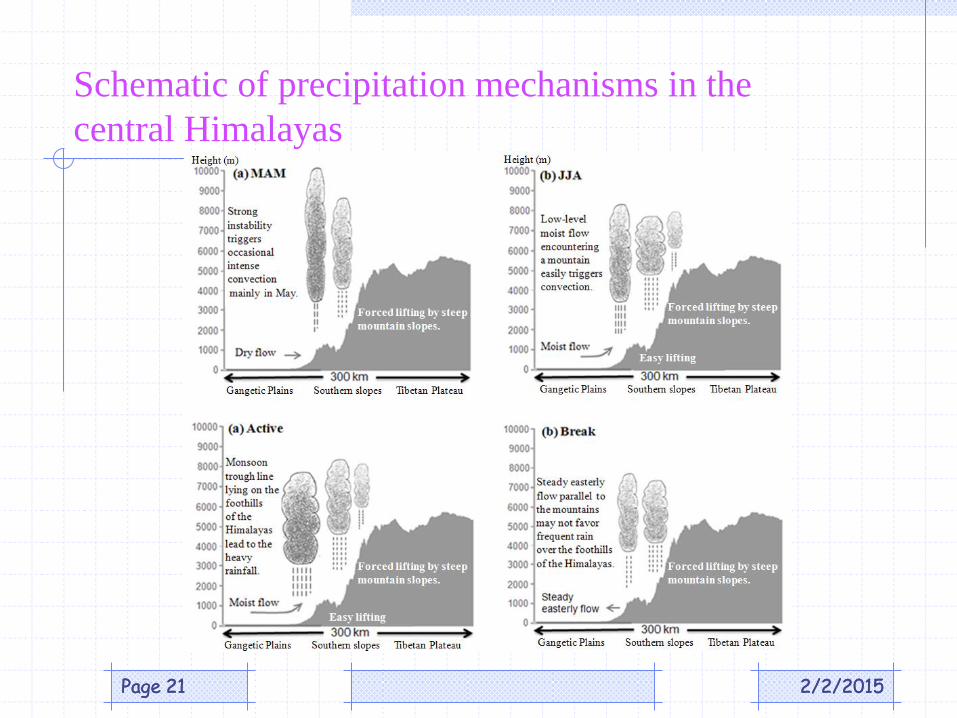
• Intense convective rainfall
over the foothills.
• High frequency of stratiform
rainfall over higher elevation.
Convective rain Convective – Stratiform rain rate (mm/h)
Stratiform – Convective rain events
Rain type

2/2/2015 Page 24
Atmospheric stability
Shaded: Equivalent potential
temperature (K)
Vector: Horizontal wind (m/s)
Contours: Specific humidity
(gm/kg)
MAM: Strong instability
JJA: Higher stability, abundant
supply of water vapor in the
lower atmosphere.
Active: Remarkably similar with
JJA
Break: Wind patterns is just
opposite than that during active
period.

2/2/2015 Page 25
Break (dry) period Active (wet) period
Vertical structure

2/2/2015 Page 26
Synoptic conditions in MAM

2/2/2015 Page 27
Atmospheric stability WG MWC
Shaded: Equivalent potential temperature (K) Vector: Horizontal wind (m/s) Contour: Specific humidity (gm/kg)
• Remarkable difference in low-level θe.
• High humidity caused higher θe
in the MWC regions.

2/2/2015 Page 28
Storm-type distribution

2/2/2015 Page 29
Storm-type distribution
2/2/2015 Page 30
Difference between convective and stratiform rain charactereistics

2/2/2015 Page 31
Percentage of convective and stratiform rainfall

2/2/2015 Page 32
Variation of rainfall with elevation

2/2/2015 Page 33
Vertical profile of rain intensity

2/2/2015 Page 34

2/2/2015 Page 35
Vertical profile of specific humidity
Central Himalayas
Western Ghats
Myanmar West Coasts
Central Andes
Altitude (
hPa)
Specific humidity (g/kg)
Southern Andes

2/2/2015 Page 36
0
5
10
15
20
25
0 1000 2000 3000 4000 5000
Rain rate (mm/day)
Cond. Rain rate (mm/hr)
Rain frequency (%)
Sikkim-Bhutan Himalaya
0
5
10
15
20
25
30
35
40
0 200 400 600 800 1000 1200 1400 1600
Meghalaya Plateau
0
5
10
15
20
25
30
35
0 200 400 600 800 1000 1200 1400
Western Ghats
0
2
4
6
8
10
12
0 1000 2000 3000 4000 5000
Western Himalayas
0
2
4
6
8
10
12
14
16
18
0 1000 2000 3000 4000 5000
Rai
nfa
ll (m
m/d
ay),
Co
nd
. rai
n
rate
(m
m/h
r) &
Fre
q. (
%)
Elevation (m)
JJA
Cond. rain rate
Rainfall
Frequency
0
2
4
6
8
10
12
14
16
18
20
0 1000 2000 3000 4000 5000
Eastern Himalayas
Rainfall-elevation relationship

2/2/2015 Page 37
Break Active
600 hPa

2/2/2015 Page 38
MAM JJA
600 hPa