DEVELOPMENT OF WATER-IN-OIL EMULSIONS FOR …
140
The Pennsylvania State University The Graduate School College of Agricultural Sciences DEVELOPMENT OF WATER-IN-OIL EMULSIONS FOR APPLICATION TO MODEL CHOCOLATE PRODUCTS A Thesis in Food Science by Lauren Bantz Ashworth Killian 2011 Lauren Bantz Ashworth Killian Submitted in Partial Fulfillment of the Requirements for the Degree of Master of Science May 2011
Transcript of DEVELOPMENT OF WATER-IN-OIL EMULSIONS FOR …

The Pennsylvania State University
The Graduate School
College of Agricultural Sciences
DEVELOPMENT OF WATER-IN-OIL EMULSIONS
FOR APPLICATION TO MODEL CHOCOLATE PRODUCTS
A Thesis in
Food Science
by
Lauren Bantz Ashworth Killian
2011 Lauren Bantz Ashworth Killian
Submitted in Partial Fulfillment
of the Requirements
for the Degree of
Master of Science
May 2011
The thesis of Lauren Bantz Ashworth Killian was reviewed and approved* by the following:
John N. Coupland
Associate Professor of Food Science
Thesis Advisor
Ramaswamy C. Anantheswaran
Professor of Food Science
B. Douglas Brown
The Hershey Company, Hershey PA
Special Signatory
John D. Floros
Professor of Food Science
Head of the Department of Food Science
*Signatures are on file in the Graduate School

iii
ABSTRACT
The sale and consumption of chocolate in warmer climates is limited because of the
negative effects of heat on the desirable chocolate characteristics. The addition of a small amount
of water to chocolate in a controlled manner provides the potential for increased heat resistance
through the formation of an internal sugar skeleton that maintains the structural integrity of
chocolate at higher temperatures. Water-in-oil emulsions are one way to deliver this water.
The overall goal of this work was to determine if water-in-oil emulsions produced via a
lab-scale cross flow membrane emulsification system are suitable for use in the production of
heat resistant chocolate products. In order to accomplish this goal, 30% water-in-soybean oil
emulsions were produced with different ingredients in the dispersed or continuous phases as well
as under different processing conditions. The droplet size distributions of the resultant emulsions
were examined both initially and over time. The results from this investigation were used to
produce stable and unstable emulsions which were then added to dispersions of sugar crystals in
oil which were then cooled to crystallize the fat and form a model chocolate. Samples prepared
in this manner were compared to samples made with the direct addition of unemulsified water in
order to determine the impact of different modes of water addition on the formation of a sugar
skeleton and melt resistance in the product.
Analysis of emulsion droplet size distributions showed that polyglycerol polyricinoleate
(PGPR) was a more effective emulsifier than either soya lecithin or a 50:50 PGPR:lecithin blend
at concentrations of 1 to 6 % (w/w; with respect to the continuous phase). At 2% emulsifier,
PGPR-stabilized emulsions remained stable over a period of 4 weeks (d = 22 μm) while lecithin-
stabilized emulsions nearly doubled in droplet size over 6 hours (d = 43 to 77 μm) and blend-
stabilized emulsions completely destabilized within 3 hours (initially d = 68 μm). Water droplet
size decreased with increasing concentration of the emulsifiers used. Emulsion droplet size and
size distribution were also significantly affected by the use of different membranes. Decreasing
the continuous phase flow rate (95.3 to 64.2 g/sec) resulted in larger droplets (d = 22 to 33 μm)
and increasing the dispersed phase flow rate (0.6 to 1.1 g/sec) also resulted in larger droplets (d =

iv
22 to 42μm). The addition of a gelling agent (2% κ-carrageenan) to the dispersed phase prior to
emulsification made it more difficult to produce stable emulsions.
A stable (2% PGPR-stabilized) and unstable (2% lecithin-stabilized) emulsion (30%
water-in-soybean oil) were selected from the first portion of this work and 2 g were added to 120
g of a sugar-in-molten confectionery coating fat (CCF) dispersion (50% sucrose) and cooled to
produce model chocolate samples. These samples were compared to samples with water added
directly and control samples prepared without added water. Microscopy of sugar-in-oil
dispersions in the presence of water-in-oil emulsions provided evidence for the formation of
sugar aggregates formed by the adsorption of water at the capillaries between hydrophilic
surfaces and resultant interparticle capillary forces. The effect of the presence of such structures
was examined within the model chocolate samples. A quantitative test was developed in which
samples on mesh stages were immersed in hexane. The hexane dissolved the solid fat component
and any sugar not incorporated in the sugar skeleton fell through the mesh. Results showed that
addition of water in any form to the samples produced a significant sugar skeleton (44 to 47% out
of the total 49.2% sucrose in the original sample) while control samples prepared without added
water had no skeleton and almost no sugar was retained on the mesh (0.4% out of the total 49.2%
sucrose in the original sample). Since the presence of a sugar skeleton alone does not signify heat
resistance, a meltability test was also developed. Samples were placed in an oven at 50 °C for 20
minutes and the change in height and the spread area were measured. Samples with water added
via emulsions decreased in height by approximately 12% while samples with unemulsified water
decreased by 41% and control samples decreased by 60%. Samples with stable emulsions added
were able to contain the melted fat better than samples with unstable emulsions added resulting in
areas of spread of 10.5 and 14.4 cm2 respectively.
This study showed that water-in-oil emulsions produced by cross flow membrane
emulsification and added to model chocolate are effective in producing samples with increased
heat resistance conferred through the formation of a sugar skeleton.
v
TABLE OF CONTENTS
LIST OF FIGURES ................................................................................................................. viii
LIST OF TABLES ................................................................................................................... xii
ACKNOWLEDGEMENTS ..................................................................................................... xiii
Chapter 1 LITERATURE REVIEW ....................................................................................... 1 1.1. Emulsions ................................................................................................................. 1
1.2. Emulsion Stability .................................................................................................... 2
1.2.1. Creaming/Sedimentation ............................................................................. 3 1.2.2. Flocculation ................................................................................................. 4 1.2.3. Coalescence ................................................................................................. 4 1.2.4. Ostwald Ripening ........................................................................................ 5 1.2.5. Surfactants/Emulsifiers ............................................................................... 5
1.3. Emulsion Characterization ....................................................................................... 6
1.3.1. Microscopy .................................................................................................. 7 1.3.2. Light Scattering ........................................................................................... 8 1.3.3. Ultrasonic Spectroscopy .............................................................................. 8 1.3.4. NMR ............................................................................................................ 9
1.3.4.1. Operation and Theory .......................................................................... 9
1.3.4.2. Benefits and Comparison .................................................................... 14
1.4. Methods of Formation ............................................................................................... 15
1.5. Cross Flow Membrane Emulsification ...................................................................... 16
1.5.1. Droplet Formation and Predicting Droplet Diameter .................................. 17
1.5.1.1. Theory ................................................................................................. 17
1.5.1.2. Composition of Phases ........................................................................ 20
1.5.1.3. Membrane Characteristics ................................................................... 21
1.5.1.4. Processing Conditions ......................................................................... 22
1.5.2. Studies of Water-in-Oil Emulsions ............................................................. 22
1.6. Chocolate ................................................................................................................... 24
1.6.1. Fat ................................................................................................................ 24
1.6.2. Sugar ........................................................................................................... 26
1.6.3. Dairy Ingredients ......................................................................................... 26
1.6.4. Emulsifiers .................................................................................................. 26
1.7. Chocolate Making Process – Bean to Bar ................................................................. 27
1.7.1. Beans to Cocoa Liquor, Butter and Solids .................................................. 29
1.7.2. Finished Chocolate ...................................................................................... 30
1.7.2.1. Refining ............................................................................................... 31
1.7.2.2. Conching ............................................................................................. 31
1.7.2.3. Tempering ........................................................................................... 32
1.8. Heat Resistant Chocolate ........................................................................................... 32
1.8.1. Definition .................................................................................................... 33
1.8.2. Measurement of Heat Resistance ................................................................ 35
1.8.3. Methods of Manufacture of Heat Resistant Chocolate ............................... 36
1.8.3.1. High Melting Fats ................................................................................ 36

vi
1.8.3.2. Increased Viscosity .............................................................................. 37
1.8.3.3. Sugar Skeleton ..................................................................................... 38
1.9. Water- in-Oil Emulsions in Chocolate ...................................................................... 40
1.10. Theory of Sugar Skeleton Formation ...................................................................... 44
1.11. Water in Chocolate – Summary .............................................................................. 50
Chapter 2 STATEMENT OF THE PROBLEM ..................................................................... 51
Chapter 3 MANUFACTURE OF WATER-IN-OIL EMULSIONS BY CROSS FLOW
MEMBRANE EMULSIFICATION: EFFECT OF PROCESSING PARAMETERS
AND FORMULATION ................................................................................................... 53
3.1. Introduction ............................................................................................................... 53
3.2. Materials and Methods ............................................................................................. 56
3.2.1. Materials ......................................................................................................... 56
3.2.2. Methods .......................................................................................................... 56
3.2.2.1. Cross Flow Membrane Emulsification ............................................... 56
3.2.2.2. NMR Analysis .................................................................................... 60
3.2.2.3. Microscopy ......................................................................................... 62
3.2.2.4. Statistical Analysis ............................................................................. 62
3.3. Results and Discussion ............................................................................................. 62
3.3.1. Emulsion Formation ........................................................................................ 62
3.3.2. Emulsion Stability ........................................................................................... 68
3.3.3. Discussion of Emulsion Formation and Stability ............................................ 75
3.3.4. Effect of Membranes on Emulsion Formation ................................................ 77
3.3.5. Effect of Altered Flow Rates on Emulsion Formation .................................... 80
3.3.6. Effect of Gelled Dispersed Phase on Emulsion Formation ............................. 82
3.4 Conclusions ................................................................................................................ 86
Chapter 4 EFFECT OF MODE OF WATER ADDITION ON THE INTERACTIONS
BETWEEN SUGAR PARTICLES DISPERSED IN LIPID ........................................... 88
4.1. Introduction ............................................................................................................... 88
4.2. Materials and Methods ............................................................................................. 91
4.2.1. Materials .......................................................................................................... 91
4.2.2. Methods ........................................................................................................... 92
4.2.2.1. Emulsions ........................................................................................... 92
4.2.2.2. Optical Microscopy ............................................................................ 93
4.2.2.3. Confocal Microscopy ......................................................................... 93
4.2.2.4. Model Chocolate Making ................................................................... 93
4.2.2.5. Hexane Immersion ............................................................................. 94
4.2.2.6. Meltability .......................................................................................... 95
4.2.2.7. Statistical Analysis ............................................................................. 96
4.3. Results and Discussion ............................................................................................. 96
4.3.1. Interaction of Sugar Particles in Oil in Presence of Water .............................. 96
4.3.2. Chocolate Model Systems in the Presence of Water ....................................... 99
4.3.2.1. Hexane Immersion ............................................................................. 100
4.3.2.2. Meltability .......................................................................................... 102
4.4. Conclusions ............................................................................................................... 107

vii
Chapter 5 CONCLUSIONS AND RECOMMENDATIONS FOR FUTURE WORK .......... 110
REFERENCES ........................................................................................................................ 115
APPENDIX A .......................................................................................................................... 125

viii
LIST OF FIGURES
Figure 1.1. Movement and precession of magnetization vectors in the X’Y’ plane using
the rotating frame after A) 90° pulse; B) subsequent dephasing; C) 180° pulse; D)
subsequent rephrasing (adapted from Bruker Optik GmhB, 2001). ........................................ 10
Figure 1.2. Sequence of events in pulsed field spin spin-echo experiment. Shaded regions
represent gradient field pulses; δ – pulse width; g – pulse magnitude;
Δ – pulse separation. ................................................................................................................ 11
Figure 1.3. Reduced echo height of magnetization vector after pulsed-field spin-echo
experiment with diffusion (adapted from Bruker Optik GmhB, 2001). .................................. 12
Figure 1.4. Echo attenuation (R) vs. time between gradient pulses (Δ) for A) diffusion
and B) restricted diffusion experiments (adapted from Bruker Optik GmhB, 2001). ............. 12
Figure 1.5. Relaxation of oil and water protons after a 180° pulse. ......................................... 13
Figure 1.6. Simplified diagram of cross-flow membrane operation (Rayner et al., 2004). ..... 17
Figure 1.7. Simplified Torque Model- Dd – droplet diameter; Dp – pore diameter; Fstat –
static pressure force; FD – cross flow drag force; Fγ – interfacial tension force; A – point
of torque(adapted from De Luca et al., 2005). ......................................................................... 18
Figure 1.8. Process diagram for cocoa liquor, butter and solids from cocoa pods
(Beckett, 1999) ......................................................................................................................... 28
Figure 1.9. Process flow diagram for finished chocolate (modified from Beckett, 1999) ....... 29
Figure 1.10. Sugar-in-oil dispersions A)without and B)with network formation .................... 45
Figure 1.11. Illustration of capillaries created by two neighboring particles. Shading
indicates regions of water adsorption. θ– wetting angle; r – particle radius ............................ 46
Figure 3.1. Simplified diagram of cross flow membrane operation (Rayner et al., 2004) ....... 54
Figure 3.2. A)Photograph of Membrane I and microscope images of B) Membrane I; C)
Membranes II and III; D) Membrane IV Scale bar in B,C,D 20 μm (Micropore
Technologies, Inc).................................................................................................................... 57
Figure 3.3. Photograph of cross flow membrane emulsification system. Arrows show
flow of continuous phase (solid) and dispersed phase (dashed) .............................................. 58
Figure 3.4. Sample log-normal cumulative and relative frequency distributions with
D3_3 = 22.13 μm and sigma = 0.985. ...................................................................................... 61

ix
Figure 3.5. Optical microscope image of 30% water-in-oil emulsion produced under
standard conditions stabilized by A) 2% PGPR; B) 2% lecithin; C) 2% 50:50
PGPR:lecithin blend. Scale bars 50 μm. .................................................................................. 64
Figure 3.5. (Continued) ............................................................................................................ 65
Figure 3.6. Average initial A) droplet size and B) sigma value of 30 % w/o emulsions
produced with increasing concentrations of PGPR (diamonds), lecithin (squares) and
50:50 blend of PGPR:lecithin (triangles). Concentration is of soybean oil continuous
phase. Analyzed by pfg NMR at 25 °C. Error bars indicate standard deviation. Asterisks
indicate that measurements of 100 μm were removed from the calculation of the mean.
No point is shown for 0.5% lecithin-stabilized emulsions as all measurements were 100
μm. .......................................................................................................................................... 67
Figure 3.7. Average initial droplet diameter vs lecithin concentration of 30 % w/o
emulsions produced with lecithin (dark bars) and 50:50 blend of PGPR:lecithin (light
bars). Concentration is of soybean oil continuous phase. The 1% and 2% lecithin
concentrations in the PGPR:lecithin blend also contained 1% and 2% PGPR respectively.
Analyzed by pfg NMR at 25 °C. Error bars indicate standard deviation and letters
indicate significant difference at p = 0.05. ............................................................................... 68
Figure 3.8. Average A) droplet diameter and B) sigma value of 30 % water-in-oil
emulsions produced with 2 % of emulsifiers PGPR (diamonds), lecithin (squares) and
50:50 blend of PGPR and lecithin (triangles) in soybean oil continuous phase. Analyzed
by pfg NMR at 25 °C. Error bars indicate standard deviation. Asterisks indicate that
measurements of 100 μm were removed from the calculation of the mean. ........................... 70
Figure 3.9. Photograph of emulsions in test tubes produced by the standard method with
A) 2% PGPR in oil phase; B) 2% lecithin in oil phase; C) 2% 50:50 PGPR:lecithin blend
in oil phase. Emulsions produced at least 2 weeks prior to photograph. ................................ 72
Figure 3.10. Average A) droplet diameter and B) sigma value of 30% w/o emulsions
produced with 1% (diamonds), 2% (squares) and 4% (triangles) PGPR in soybean oil
continuous phase over 4 weeks. Analyzed by pfg NMR at 25 °C. Error bars indicate
standard deviation. ................................................................................................................... 74
Figure 3.11. Average initial A) droplet diameter and B) sigma value of 30% w/o
emulsions produced by different membranes with 2% PGPR in soybean oil continuous
phase. Analyzed by pfg NMR at 25 °C. Error bars indicate standard deviation and letters
indicate significant difference at p = 0.05. ............................................................................... 79
Figure 3.12. Average initial A) droplet diameter and B) sigma value of 30% w/o
emulsions produced at different operational conditions with 2% PGPR in soybean oil
continuous phase. Analyzed by pfg NMR at 25 °C. Error bars indicate standard deviation
and letters indicate significant difference at p = 0.05. ............................................................. 81

x
Figure 3.13. Optical microscope image after cooling of lecithin-stabilized emulsion A)
without and B) with 2% carrageenan in dispersed aqueous phase produced by standard
pump settings and under heated conditions. Scale bar 50 μm. ................................................ 83
Figure 3.14. Average initial A) droplet diameter and B) sigma value of 30% w/o
emulsions with and without carrageenan in dispersed phase. Control – 2% lecithin in
continuous phase, produced under hot conditions; Carrageenan – 2% lecithin in
continuous phase, 2% carrageenan in dispersed phase, produced under hot conditions.
Samples were cooled to 25 C in freezer at – 22 °C. Analyzed by pfg NMR at 25 °C.
Error bars indicate standard deviation and letters indicate significant difference at p =
0.05. Asterisks indicate that measurements of 100 μm were removed from the calculation
of the mean. ............................................................................................................................ 85
Figure 4.1. Sample empty wire mesh stage for hexane immersion in an empty beaker. ......... 95
Figure 4.2. A) Optical microscope image of fine granulated sugar crystals in soybean oil
and B) in the presence of a 3.85% w/o emulsion stabilized with 3% PGPR and produced
by cross flow membrane emulsification. Scale bars equal 50 μm. ......................................... 97
Figure 4.3. Confocal microscope image of fine granulated sugar in soybean oil in the
presence of a 5% w/o emulsion stabilized with 3% PGPR in the continuous oil phase.
Dispersed water phase was spiked with fluorescein and appears green in the image. Scale
bar equals 200 μm. ................................................................................................................... 99
Figure 4.4. Percent mass of model chocolate remaining after hexane immersion for 3
days. Sample type indicates the type of liquid added to the sample; Oil – 2g soybean oil;
Water – 0.6 g water, 1.4 g soybean oil; PGPR – 2g of 30% water-in-soybean oil emulsion
stabilized with 2% PGPR; Lecithin – 2g of 30% water-in-soybean oil emulsion stabilized
with 2% lecithin. Emulsions produced via cross flow membrane emulsification. Error
bars indicate standard deviation and letters indicate significant difference at p = 0.05.
Dotted line indicates the percent sugar in the original sample. ................................................ 100
Figure 4.5. Photograph of model chocolate samples after fat extraction via hexane
immersion. Samples made with different liquid added A) 2g soybean oil; B) 0.6 g water,
1.4 g soybean oil; C) 2g of 30% water-in-soybean oil emulsion stabilized with 2% PGPR;
or D) 2g of 30% water-in-soybean oil emulsion stabilized with 2% lecithin. Emulsions
produced via cross flow membrane emulsification. ................................................................. 101
Figure 4.6. Photograph of side view of model chocolate samples after heating in oven at
50 °C for 20 minutes. Samples made with different liquid added A) 2g soybean oil; B)
0.6 g water, 1.4 g soybean oil; C) 2g of 30% water-in-soybean oil emulsion stabilized
with 2% PGPR; or D) 2g of 30% water-in-soybean oil emulsion stabilized with 2%
lecithin. Emulsions produced via cross flow membrane emulsification. ................................ 103
Figure 4.7. Photograph of top view of model chocolate samples after heating in oven at
50 °C for 20 minutes. Samples made with different liquid added A) 2g soybean oil; B)
0.6 g water, 1.4 g soybean oil; C) 2g of 30% water-in-soybean oil emulsion stabilized

xi
with 2% PGPR; or D) 2g of 30% water-in-soybean oil emulsion stabilized with 2%
lecithin. Emulsions produced via cross flow membrane emulsification. ................................ 104
Figure 4.8. Percent height difference of samples after heating in oven at 50 °C for 20
minutes. Sample type indicates the type of liquid added to the sample; Oil – 2g soybean
oil; Water – 0.6 g water, 1.4 g soybean oil; PGPR – 2g of 30% water-in-soybean oil
emulsion stabilized with 2% PGPR; Lecithin – 2g of 30% water-in-soybean oil emulsion
stabilized with 2% lecithin. Emulsions produced via cross flow membrane
emulsification. Error bars indicate standard deviation and letters indicate significant
difference at p = 0.05. .............................................................................................................. 105
Figure 4.9. Area of sample spread after heating in oven at 50 °C for 20 minutes. . Sample
type indicates the type of liquid added to the sample; Oil – 2g soybean oil; Water – 0.6 g
water, 1.4 g soybean oil; PGPR – 2g of 30% water-in-soybean oil emulsion stabilized
with 2% PGPR; Lecithin – 2g of 30% water-in-soybean oil emulsion stabilized with 2%
lecithin. Emulsions produced via cross flow membrane emulsification. Error bars
indicate standard deviation and letters indicate significant difference at p = 0.05. ................. 106
Figure A.2. Standardized shear stress vs time for stopped cup emulsion addition; Trial A
(diamond); Trial B (square); Trial C (triangle). ....................................................................... 126
Figure A.1. Standardized shear stress vs time for stopped cup addition of oil (diamond),
oil and unemulsified water (square) and emulsion (triangle). .................................................. 126

xii
LIST OF TABLES
Table 1.1. Standards of identity of three main chocolate types based
on the US FDA Code of Federal Regulations (21CFR163, 2010) ........................................... 24
Table 1.2. Respective melting points of the polymorphic forms of cocoa buttera
a adapted from Talbot, 1994 ..................................................................................................... 25
Table 1.3. Desired characteristics of heat resistant chocolate as stated
by inventors of such products .................................................................................................. 34
Table 3.1. Membrane and pore dimensions and number of pores ........................................... 56
Table 3.2. Flow rate through one pore of each membrane at dispersed
phase flow rate of 0.6 g/sec ...................................................................................................... 59
Table 3.3. Pressures in continuous phase circuit before and after a membrane
at two continuous phase pump speeds. .................................................................................... 59

xiii
ACKNOWLEDGEMENTS
This thesis could not have been completed if it were not for the help and support of many
people. I would like to take this time to thank those people from the bottom of my heart.
Firstly, I would like to thank my advisor, Dr. John N. Coupland for believing in a
chemistry and mathematics undergraduate student from a small, liberal arts college. He has
provided unrelenting support and encouragement throughout this entire process and has fostered
my growth both as a food scientist and as a person.
I would like to thank my committee members, Dr. Ramaswamy Anantheswaran and Dr.
John D. Floros, as well as special committee member Dr. B. Douglas Brown, for their time and
assistance in completion of this work.
I would like to thank the PMCA for providing me with a fellowship to study at Penn
State and the PMCA Research Committee for their support and guidance of this project. Thanks
also go to Eric James and all those who hosted me for an industry visit. This experience has been
invaluable and has only furthered my passion for this industry.
I would like to thank Micropore Technologies, Inc. for supplying the cross flow
membrane emulsification system used in these studies as well as Tom Lewis and Mike Stillwell
of Micropore for their assistance and support. Thanks also go to those who donated ingredients
used in this study including Jon Hopkinson and Danisco, ADM, Domino Specialty Ingredients
and Cargill Dressings, Sauces and Oils. Special thanks to Supriyo Ghosh of Bruker Optics Inc.
for technical support regarding NMR.
I would like to thank all professors, graduates and undergraduates in the Food Science
Department at Penn State who I have had the pleasure of interacting with and learning from over
the past two years. Thanks to my lab-mates for their help and encouragement during this process

xiv
and to Jared Smith for assisting with the emulsion work. Special thanks to all of my friends at
Penn State for their friendship and support as well as a couch to crash on during snowstorms.
I would like to thank my family for their constant love and encouragement and especially
my husband Chad for his support, patience, humor and love. Most of all I would like to thank
God for the many blessings He has given me and for being my Rock throughout this process and
life.

1
Chapter 1
LITERATURE REVIEW
1.1 Emulsions
Emulsions are a type of colloidal system. They are dispersions of one liquid in a second,
immiscible liquid, e.g., water and oil. One liquid is distributed in droplets in the other liquid and
is known as the dispersed phase. The second liquid into which the first is distributed is known as
the continuous phase. Oil and water can be emulsified as either oil-in-water (o/w) or water-in-oil
(w/o) emulsions. In addition to these simple emulsions, the dispersed phase can be an emulsion
in itself, resulting in a more complex multiple emulsion e.g., water-in-oil-in-water. Multiple
emulsions have many important applications, particularly in medicine where studies focus on
their function as delivery systems (Aserin, 2008). Other variations of the simple emulsion
include biemulsions of two oil types as separate droplets in water (Nielloud and Marti-Mestres,
2000) or emulsions including partially crystalline oil phases. Emulsions tend to be cloudy or
white, as the presence of many small droplets scatters the incident light.
Emulsions are used in a wide variety of applications including foods, pharmaceuticals,
cosmetics, personal hygiene products, paints, lubricants, polishes, explosives (Pal, 1996).
Examples of cosmetic and personal hygiene emulsions include lotions, creams, hair dyes and
deodorants (Schramm, 2005) while a common medicinal emulsion is calamine lotion (Moody,
2004). Emulsions are also being explored for their capability as drug carriers for lipophilic drugs
(Buszello and Muller, 2000).
Emulsions are frequently used in the food industry, both as products and ingredients.
Classic examples of oil-in-water emulsions are salad dressings, sauces, flavored beverages,
mayonnaise, milk and cream (Dickinson, 1992). While oil-in-water emulsions are the most
common food emulsion, water-in-oil emulsions include important products such as butter and
margarine (Dickinson, 1992). They would also have potential application in any fat continuous
product.

2
Food emulsions contain anywhere from less than a percent to more than 75% of dispersed
phase (Coupland, 2010). This can be expressed either in terms of a volume percent or a mass
percent and is referred to as the dispersed phase volume fraction (υ) or the dispersed phase mass
fraction (υm) respectively. The relative amount of dispersed phase influences important emulsion
characteristics including appearance, flavor, stability and texture (McClements, 1999).
The droplets in a food emulsion can range in diameter from less than 1 μm to upwards of
100 μm (Dickinson, 1992) and are typically polydisperse in the continuous phase meaning that a
range of droplet sizes is present (Coupland, 2010). Since the two liquids are immiscible, the
droplets of an emulsion are normally spherical in order to minimize the interfacial area. The sizes
of the droplets can be measured with a variety of instrumental techniques (See Section 1.3).
Polydisperse emulsions are also described by plots of particle size distribution data
showing the full range of droplet sizes present versus their frequency (%). A log-normal plot is
used since most food emulsions are skewed towards larger droplet sizes (McClements, 1999).
Again these can be determined based on any of the parameters used in calculating a mean. From
the particle size distribution, a standard deviation of the mean can be determined (σ) and is used
in order to describe the spread of the distribution. This mean can be calculated a variety of ways
based on parameters such as length, area, number, volume, surface- volume or equivalent volume
(Coupland, 2010). A mean based on volume fraction (D3,3) means that 50% of the total dispersed
phase volume is in droplets less than that number. Alternatively, a mean based on number
fraction (D0,0) means that 50% of the dispersed phase droplets are smaller than that number. A
volume fraction mean is skewed more towards larger droplets while a number fraction mean is
skewed towards smaller droplets (McClements, 1999).
1.2 Emulsion Stability
Given that the liquids of an emulsion are immiscible, physical stability of a food
emulsion is extremely important. Instability can affect appearance, texture, taste and shelf-life of
a product.
Emulsion instability arises from the thermodynamic drive to decrease interfacial surface
area. It is the kinetic parameters of the system, however, which govern how quickly the emulsion

3
breaks down and can be used to counter the thermodynamic force. Common mechanisms of
emulsion instability include creaming/sedimentation, flocculation, coalescence and Ostwald
ripening. Each mechanism, its contributing factors and ways to control it are detailed below.
1.2.1 Creaming/Sedimentation
Creaming and sedimentation are the movement of emulsion droplets based on density
differences between the two phases. Creaming occurs in oil-in-water emulsions in which the less
dense oil droplets move to the surface, creating a “cream” layer. Conversely, sedimentation
occurs in water-in-oil emulsions where the more dense water droplets settle to the bottom. If
creaming or sedimentation occurs alone, the droplets can be redispersed in the continuous phase
through gentle mixing.
The rate of gravitational separation is usefully understood in terms of Stokes’ law
governing the terminal velocity of an isolated droplet (McClements, 1999):
(1.1)
where vStokes is the velocity of the droplet, g is the acceleration due to gravity, r is the radius of the
droplet, ρ1 and ρ2 are the densities of the continuous phase and dispersed phase respectively and
η1 is the shear viscosity of the continuous phase. If vStokes is positive the droplet will cream while
if it is negative the droplet will sediment.
Based on the variables in the Stokes’ equation, emulsion creaming/sedimentation can be
altered and controlled by many factors. Changing the densities of the phases so that they are
more similar will drastically decrease the drive for separation. Other ways to decrease
creaming/sedimentation include reducing the droplet size, increasing the viscosity of the
continuous phase, increasing droplet concentration, preventing flocculation in dilute emulsions,
promoting flocculation in concentrated emulsions and increasing the droplet surface charge
(McClements, 1999). Stokes’ equation, however, makes some assumptions about the system.
The derivation of Stokes’ law assumes one droplet that is a rigid sphere in an infinite and ideal
liquid (McClements, 1999; Hiemenz, 1986; Dickinson, 1992) and this is not the case in food
4
emulsions. A more accurate equation would take into account the fluidity of liquid droplets, the
concentration of the emulsion, the polydispersity of the system, the Brownian motion of the
system, the degree of fat crystallinity and the interactions between the droplets.
1.2.2 Flocculation
Flocculation, also known as aggregation, occurs due to energetic interactions between
droplets. Droplets in an emulsion are constantly in motion and often collide. If the droplets stick
to each other without rupture of their surfaces, flocculation has occurred. Flocculation can
drastically change the appearance, texture and stability of an emulsion (Walstra, 1993).
As noted earlier, flocculation affects the rate of creaming or sedimentation. Flocculated
droplets (flocs) have a larger effective radius which increases the rate of sedimentation/creaming
as seen in the Stokes’ equation (Coupland, 2010). This is true in more dilute emulsions. In more
concentrated emulsions, the flocs provide a network that hinders the movement of other droplets,
thus slowing creaming and sedimentation.
Flocculation can be controlled by changing the frequency of the collisions or the strength
of the interactions between the droplets. Factors that influence these two requirements for
flocculation include the viscosity of the continuous phase, the concentration of the droplets, the
droplet size, the relative densities, the charge on the droplet surface, the charge of the continuous
phase and the addition of polymers or other colloidal particles to the continuous phase
(McClements, 1999).
1.2.3 Coalescence
In contrast to flocculation, coalescence occurs when the interparticle film separating
flocculated or otherwise closely associated droplets ruptures and results in the formation of a
single larger droplet. In extreme instances this can lead to phase inversion of the system. It also
increases the rate of creaming/sedimentation by increasing the droplet diameter. The main ways
of controlling coalescence are to decrease the contact between droplets and to increase the
strength of the interparticle layers through the use of emulsifiers. The use of emulsifiers is
explained in detail in Section 1.2.5.
5
1.2.4 Ostwald Ripening
Ostwald ripening occurs mainly in water-in-oil emulsions and is the accumulation of
material, i.e. water, via mass transfer into larger droplets from smaller droplets. The resulting
emulsion has fewer but larger droplets, again increasing the rate of gravitational phase separation.
This process is retarded by gelling the continuous phase, decreasing the solubility of the dispersed
phase in the continuous phase, reducing interfacial tension and narrowing the droplet size
distribution (McClements, 1999).
1.2.5 Surfactants/Emulsifiers
Emulsifiers, typically either small molecule surfactants or proteins, are used mainly to
enhance the stability of emulsions and facilitate the formation of small droplets. They may also
have the added functions of altering the texture, shelf-life, morphology and rheology of products
(Dickinson, 1992; McClements, 1999). Emulsifiers are amphiphilic molecules that have both
hydrophilic and hydrophobic portions. These molecules orient themselves at droplet surfaces
with the hydrophilic and hydrophobic portions partitioning into the appropriate phase. In doing
so, they lower the interfacial tension between the phases, thereby stabilizing the system by
decreasing the thermodynamic drive for separation. Their presence also decreases the likelihood
of flocculation and coalescence by the formation a protective layer around the droplets
(Dickinson, 1992; Walstra, 1993)
There are many different kinds of emulsifiers including polymeric surfactants, fine
particles and small-molecule surfactants. Polymeric surfactants can be disordered proteins,
globular proteins or some polysaccharides (Coupland, 2010). They are particularly effective at
preventing flocculation and coalescence, although their larger size increases the effective droplet
diameter and may influence the rate of creaming/sedimentation. Fine particles such as flours,
spices and crystals also help to stabilize emulsions (Coupland, 2010).
Small-molecule surfactants have smaller molecular weights than polymeric surfactants
and can diffuse rapidly to the surface of droplets (Coupland, 2010). Examples of this type of
emulsifier are polysorbates and phospholipids (Dickinson and Woskett, 1989). Small-molecule
surfactants are commonly used as food emulsifiers and are typically added to the continuous

6
phase prior to emulsification. A way of distinguishing between emulsifier types is based on
Bancroft’s rule which states that the continuous phase is the phase in which the emulsifier is more
soluble. Water continuous emulsifiers include sodium dodecyl sulfate and polyglycerol and
sucrose esters of fatty acids while common oil continuous emulsifiers (of particular importance to
this work) are sorbitan esters, polyglycerol polyricinolate (PGPR) and lecithins (Katoh et al.,
1996).
PGPR is a potent stabilizer of water-in-oil emulsions made by dehydrating and heating
ricinoleic acid followed by esterification with polyglycerol (Stauffer, 2002). PGPR coated water
droplets exhibit strong repulsive steric forces which decrease their tendency for flocculation and
coalescence (Claesson, Blomberg and Poptoshev, 2004; Knoth, Scherze and Muschiolik, 2005a).
It is approved for use in the United States in chocolate at levels up to 0.3 % and in “margarines,
low-fat margarines, spreads, creamers and dairy analogs at levels no greater than 1 % by weight”
(Palsgaard, 2008). In chocolate, it is used to improve the flow properties while decreasing the
amount of cocoa butter needed. Despite its excellent emulsifying capabilities, consumers may be
wary of PGPR because of its long, technical name and synthetic nature.
Natural lecithin is a mixture of phosphatidylcholine, phosphatidylethanolamine,
phosphatidylinositol and phosphatidic acid and commonly comes from soybean, rapeseed and egg
(Faergemand and Krog, 2003; Knoth, Scherze and Muschiolik, 2005b). It is used as an
emulsifier, dispersing agent, wetting agent and viscosity modifier (Dickinson, 1992; Knoth,
Scherze and Muschiolik, 2005). Soybean lecithin is most commonly used in the food industry as
it is cheaper and easier to obtain. Lecithin can be fractionated or modified enzymatically,
chemically or thermally (van Nieuwenhuyzen and Szuhaj, 1998; McClements, 2005). Such
treatment can make lecithin more hydrophobic and increase its ability to stabilize water-in-oil
emulsions (Weete, Betageri and Griffith, 1994; McClements, 2005). Lecithin is also used in
chocolate to decrease viscosity. As a result of its shorter name and natural source, it is generally
more accepted by consumers.
1.3 Emulsion Characterization
The inherent thermodynamic instability of emulsions and the effect that this instability
can have on product quality make it important to be able to characterize an emulsion initially and

7
to track changes over time. While characteristics such as dispersed phase volume fraction,
droplet crystallinity, rheology and droplet charge can all be measured by certain respective
techniques, this section will focus on the measurement of droplet size and distribution
(McClements, 1999).
1.3.1 Microscopy
Different types of microscopy can be used to image and characterize emulsions including
conventional optical microscopy and confocal scanning laser microscopy. Each technique has
certain associated advantages and disadvantages.
Conventional optical microscopy allows emulsion structure to be viewed easily. These
microscopes are less expensive than some of their counterparts and are therefore more common.
Colored chemical dyes can be added in order to enhance phase contrast and improve image
quality (Aguilera and Stanley, 1990; McClements, 1999). Common lipid stains which can assist
in this process include Nile red, Nile blue, oil red O and Sudan black B (Aguilera and Stanley,
1990). Fluorescence microscopy is a similar technique that instead uses fluorescent light. Phase
contrast is further enhanced in this technique by adding a fluorescing material to the emulsion
(Aguilera and Stanley, 1990). Once images are collected in either case, image analysis is
performed to determine particle size and distribution.
Problems with optical and fluorescence microscopy arise in the preparation of the sample
and in the image analysis. Samples must be dilute enough such that droplets are not overlapping
in any images. This can potentially destroy the integrity of the emulsion. Additionally, a cover
slip is typically placed over the sample which can distort or destroy the droplets, particularly the
larger droplets (Van Dalen, 2002). A slide with a well or culture chamber could be used, but the
issue again is overlapping droplets. Resolution is also a problem with these methods because of
the large depth of field. Even if a suitable sample preparation method is established, image
collection and analysis are extremely time consuming. Enough representative yet random images
must be collected to achieve sufficient statistical power and image analysis on each image must
either be done manually or with a suitable software program.

8
Confocal scanning laser microscopy (CSLM), on the other hand, can provide enhanced
quality, resolution and three dimensional images (McClements, 1999). The laser beam used in
CSLM can be set at various depths to image layers of an emulsion without destroying structure or
having to prepare thin slices. This technique is particularly useful for imaging water-in-oil
emulsions where the continuous oil phase is partially crystalline such as in butters and margarines
(Van lent et al., 2008; Van Dalen, 2002; Blonk and Van Aalst, 1993; Vodovotz et al., 1996). As
in optical and fluorescence microscopy, CSLM samples can be stained, particularly with
fluorescent dyes (Aguilera and Stanley, 1990). Despite its benefits, sufficient CSLM images still
need to be collected and time consuming image analysis techniques are necessary as well.
1.3.2 Light Scattering
Both static and dynamic light scattering techniques can be used to effectively determine
particle sizes and distributions of emulsions. Static light scattering is the more common
technique for most emulsions while dynamic light scattering is typically used to image samples
with very small droplets and narrow distributions (McClements, 1999). The three main methods
for static light scattering are based on angular scattering, spectroturbidimetry and reflectance.
Mie theory is used to calculate the size of a spherical droplet based on the patterns of scattered
light collected by the detectors. Since Mie theory assumes isolated particles, light scattering
works best in dilute systems. Concentrated emulsions must be diluted which may affect the
emulsion characteristics.
1.3.3 Ultrasonic Spectrometry
Ultrasonic spectroscopy is used in emulsion droplet sizing and functions by relating
ultrasonic wave properties to emulsion characteristics, again making use of an appropriate
scattering theory. Ultrasonic techniques contrast with the previously mentioned methods in that
they can be used with concentrated emulsions and do not require any sample preparation
(McClements, 1996; McClements and Coupland, 1996; McClements, 1999; Coupland and
McClements, 2001). A negative associated with this technique is that the presence of air bubbles
drastically interferes with the signal (McClements, 1996; McClements, 1998).

9
1.3.4 NMR
Nuclear magnetic resonance spectroscopy (NMR) is used to study the structure,
interaction and kinetics of molecules as well as the composition of solutions (Bruker BioSpin,
2011). The basis for this technique is the spin of certain nuclei, including hydrogen nuclei, which
causes them to act like small magnets. When an external magnetic field is applied, the nuclei will
align parallel the magnetic field in one of two energy states, either spin aligned or spin opposed to
the field and precess or rotate around these parallel axes (Carey, 2011). The absorption of a
photon of a certain energy enables the nuclei to transition between energy states, or resonate. The
frequency of this photon is known as the Larmor frequency. In a simple NMR experiment, a
sample is placed in a magnetic field and radio-frequency pulses are applied. After the pulses, the
nuclei realign with the magnetic field and the manner in which they do so is analyzed to
determine certain desired properties. This type of low-resolution NMR is widely used in the
medical, pharmaceutical and food industries and forms the basis of an important method used
here.
1.3.4.1 Operation and Theory
The use of NMR for the determination of droplet sizes began in the late 1960’s and early
1970’s with the application of pulsed magnetic field gradient spin-echo techniques to the study of
emulsions (Stejskal and Tanner, 1965; Tanner and Stejskal, 1968; Packer and Rees, 1972).
Droplet sizing in this way depends on the restricted diffusion of molecules inside the droplets, as
hindered by the droplet walls (Voda and van Duynhoven, 2009). Diffusion is detected over a
small period of time during which molecules are able to diffuse across emulsion droplets and
encounter the wall barriers (Tanner and Stejskal, 1968; Packer and Rees, 1972).
In order to examine how droplet size measurements are performed, it is first necessary to
define a frame of reference from which to examine the movement of the net magnetization vector,
Mo. The frame used in this situation is known as the rotating frame with axes X’ and Y’ which
rotate around the Z axis at the Larmor frequency (Hornak, 1997). This allows for an easier
visualization of the movement of the magnetization vectors since vectors moving at the Larmor
frequency are stationary in this frame. Vectors moving either faster or slower than the Larmor

10
frequency are seen to move clockwise or counterclockwise about the Z axis respectively (Figure
1.1B).
In a spin-echo experiment, two radio-frequency pulses are applied to a sample. These
pulses are created by passing alternating current through a coil around the X axis at the Larmor
frequency which causes rotation of the net magnetization vector, Mo, which is initially in the Z
direction. The first pulse is a 90° pulse which rotates the magnetization into the horizontal X’Y’
plane (Figure 1.1A; Hornak, 1997). After this pulse, the free induction decay (FID) signal can be
monitored as the magnetization begins to dephase within this plane (Figure 1.1B; Hornak, 1997;
Packer and Rees, 1971). A 180° pulse is then applied to the sample at time τ and rotates the
magnetization around the X axis by 180° (Figure 1.1C; Hornak, 1997). As a result, the
magnetization rephases and an echo signal can be monitored at time 2τ along the Y’ axis (Figure
1.1D; Hornak, 1997; Packer and Rees, 1971; Bruker Optik GmhB, 2001).
Figure 1.1. Movement and precession of magnetization vectors in the X’Y’ plane using the
rotating frame after A) 90° pulse; B) subsequent dephasing; C) 180° pulse; D) subsequent
rephrasing (adapted from Bruker Optik GmhB, 2001).
D C

11
When a pulsed magnetic field gradient is added to the spin-echo sequence, two gradient
pulses operating around the X’ axis are applied that are centered about the 180° pulse. The first
pulse occurs at time t1 after the FID signal but before the 180° pulse and the second occurs after
the 180° pulse but before the spin-echo signal. The gradient pulses have a duration of δ, a
magnitude of g and are separated by time Δ as seen in Figure 1.2.
t = 0 t = τ t =2τ
90° 180
Figure 1.2. Sequence of events in pulsed field spin spin-echo experiment. Shaded regions
represent gradient field pulses; δ – pulse width; g – pulse magnitude; Δ – pulse separation.
The first gradient pulse dephases the nuclear spin magnetization. If the pulses are of
equal strength and no diffusion occurs, the resultant echo has the same height as when the
experiment is performed without the gradient pulses (Bruker Optik GmhB, 2001). If diffusion
does occur within the sample, the second pulse can only partially rephase the nuclei and the
intensity of the spin-echo signal is decreased (Figure 1.3; Packer and Rees, 1971; Fourel,
Guillement and Le Botlan, 1994; Van den Enden et al., 1990; Bruker Optik GmhB, 2001). In
general terms, “the first gradient pulse labels the spins according to their position, and the second
gradient pulse determines how much they have moved in the interval” (Tanner and Stejskal,
1968). The echo attenuation, R, is the ratio of the echo heights of pulse sequences with and
without gradient pulses and can be determined at different values of Δ, the time between pulses.
A plot of R vs Δ is a straight line from with the diffusion coefficient can be calculated (Figure
1.4A; Bruker Optik GmhB, 2001).
1
80°
δ δ
g
Δ
t
= τ

12
Figure 1.3. Reduced echo height of magnetization vector after pulsed-field spin-echo experiment
with diffusion (adapted from Bruker Optik GmhB, 2001).
In a restricted diffusion experiment, the R value reaches a minimum plateau at a certain Δ
value for a constant gradient pulse of length δ (Figure 1.4B) because the water molecules can
only diffuse so far without encountering a boundary (droplet surface). Similar plateaus are
achieved at various R values when the gradient pulse length is altered and Δ is kept constant.
This provides a “fingerprint” for the droplet distribution which is then calculated by the software
application (Bruker Optik GmhB, 2001).
Figure 1.4. Echo attenuation (R) vs. time between gradient pulses (Δ) for A) diffusion and B)
restricted diffusion experiments (adapted from Bruker Optik GmhB, 2001).
A B

13
In order to measure the droplet size of water-in-oil emulsions, the spin-echo experiment
with gradient pulses must be modified. The first variation is that the 180° pulse is divided into
two 90° pulses in order to have an identifiable echo signal because the Δ used in these
experiments is fairly long (Bruker Optik GmhB, 2001). Additionally, something must be done so
that the signal from the water protons is not disrupted by the signal from the oil protons (Bruker
Optik GmhB, 2001). To accomplish this, the different relaxation rates of oil and water are taken
into account. As seen in Figure 1.5, after a 180° pulse the net magnetization of oil protons returns
to the original value much faster than water protons and there is a point at time τ0 that the net
magnetization of the oil protons is zero. If the first 90° pulse is applied at time of τo after an
initial 180° pulse, the final signal will only be due to the water protons. The value of τ0 is
determined by a measurement on an oil sample without pulses, varying τ0 until the signal
disappears (Bruker Optik GmhB, 2001).
Figure 1.5. Relaxation of oil and water protons after a 180° pulse.
Thus by comparing the spin-echo signal heights with and without gradient pulses of
different pulse lengths and using detailed equations that take into account the diffusion
coefficient, the average droplet size and distribution can be calculated (Packer and Rees, 1971;
Murday and Cotts, 1968; Tanner and Stejskal, 1968; Voda and van Duynhoven, 2009).
M
Z
-
+

14
1.3.4.2 Benefits and Comparison
There are many benefits of using pulsed field gradient NMR (pfg NMR) for emulsion
droplet sizing compared to other techniques. Experimentation can be performed with a low
magnetic field (20 MHz) which means that the necessary spectrometers are relatively low cost
(Voda and van Duynhoven, 2009). Additionally, pfg NMR can be used on emulsions with no
sample preparation. Emulsions do not need to be diluted and the samples are not damaged by
testing (Gabriele et al., 2009; Rousseau and Hodge, 2005; Van lent et al., 2008). The technique
can be used on both water-in-oil and oil-in-water emulsions as well as multiple and partially
crystalline samples.
Several researchers have performed studies comparing pfg NMR results to those from
other particle sizing methods. Fourel, Guillement and Le Botlan (1994) showed that laser
diffraction or image analysis were less time consuming techniques for liquid emulsion analysis
than NMR. However, when it came to “solid” emulsions, Fourel, Guillement and Le Botlan
(1995) found that NMR was a more appropriate method for analysis as compared to image
analysis. The group used commercial butters with a range of solid fat contents in their analysis
and found that laser diffraction could not be used and image analysis was limited since the
samples had to be sliced before measurement. There was sufficient agreement in droplet size
distributions between NMR and image analysis and the NMR method exhibited reproducibility.
Two studies compared pfg NMR to confocal scanning laser microscopy for imaging
butters or fat spreads. Van Dalen (2002) analyzed fat spreads with fat contents of 40 – 80%. He
found that while the two techniques gave comparable results at both 65 and 80% fat content, there
were large differences in the measurements of 40% fat spreads. This, however, was ascribed
mainly to the shortcomings of CSLM and the only advantage of CSLM over NMR was the
collection of visual information about the droplet size distribution. Van lent et al. (2008) also
compared CSLM to NMR when analyzing butters. Again, the only shortcoming of NMR was
stated to be the lack of visual information. Van lent et al. (2008) also found that NMR was a
more accurate method for droplet size distribution analysis, especially in samples with numerous
small particles. The method was faster, easier and more reliable than CSLM.

15
A study by Gabriele et al. (2009) compared NMR and dynamic light scattering in the
analysis of dairy emulsions. Researchers found that the main advantage of NMR was the lack of
sample preparation that was necessary for light scattering. For light scattering, the dairy emulsion
had to be diluted. NMR tests on a diluted sample showed a larger droplet diameter as compared
to the results from an undiluted sample. Although a reason for this phenomenon was not stated,
Gabriele et al. (2009) acknowledged that sample dilution could change emulsion properties and
thus the use of NMR for concentrated emulsion analysis would be favored. The authors noted,
however, that NMR cannot be used in studying flocculation, as the aggregated droplets are still
intact.
Another restriction of this method is the droplet size that is able to be measured. Large
droplets (>100 μm) cannot be accurately measured by the application because the diffusion time
before encountering the droplet walls is too large. This limits the use of this technique, especially
in long term stability studies, except is cases with very small droplet sizes.
1.4 Methods of Formation
When emulsions are formed from two bulk immiscible phases the interfacial area is
increased. This corresponds to an increase in the free energy of the system. As this increase is
thermodynamically unfavorable, the formation of emulsions requires the input of work of some
type.
Work can be supplied to the system by several different methods in order to form an
emulsion. Traditional methods include rotor-stators, high pressure homogenizers, ultrasound
homogenizers and microfluidizers. Rotor-stator methods include all forms of mixers and stirrers,
colloid mills and toothed disc dispersing machines (Sotoyama et al., 1999; Charcosset, Limayem
and Fessi, 2004; Tadros, 2009). In many cases, these techniques are combined, with a coarse pre-
mix emulsion produced first by stirring and then emulsified via one of the above methods.
All of these methods are very inefficient as most of the energy input is lost as heat
(Gijsbertsen-Abrahamse, van der Padt and Boom, 2004). This heat can damage any labile
ingredients in the emulsion. Additionally, the equipment is usually bulky and expensive and
controlling droplet size and distribution can be difficult.

16
Lack of control over the characteristics of the emulsions produced by these methods is
another shortcoming. High shear stress is used to break up droplets in these methods. This can
lead to coalescence of the dispersed phase if it is not quickly stabilized by emulsifiers
(Charcosset, 2009). As a result, it is more difficult to specifically control droplet size and
distribution (Sotoyama et al., 1999; Egidi et al., 2008). Inconsistent droplet size can have a
drastic effect on the properties of an emulsion, especially in terms of microbiological stability and
flavor release in emulsions with a dispersed flavor component (Sotoyama et al., 1999; Charcosset,
2009). All of these issues make scale up from laboratory scale equipment unreliable (Egidi et al.,
2008; De Luca et al., 2008).
In contrast to these methods, a more recently developed method, membrane
emulsification, which does not involve high shear stress and requires less energy provides a way
to control droplet size and distribution (Sotoyama et al., 1999). Membrane emulsification entails
the use of microporous membranes and has become more popular in the past 20 years because of
these advantages (Charcosset, 2009). This technique will be detailed in the following section
(Section 1.5).
1.5 Cross Flow Membrane Emulsification
Membrane emulsification utilizes pressure to push a liquid through a porous membrane
(Charcosset, Limayem and Fessi, 2004). Frequently the continuous phase is sheared to aid in
droplet detachment although the shear stress is much lower than in other emulsification methods
(Egidi et al., 2008). Different types of membrane emulsification methods include pre-mix
membrane emulsification and direct membrane emulsification (De Luca et al., 2008). In pre-mix
emulsification, a coarse emulsion is passed through a membrane to reduce the droplet size (De
Luca et al., 2008). The coarse emulsion is typically produced via traditional emulsification
methods (Gutierrez, Rayner and Dejmek, 2009). Vladisavljevic, Shimidzu and Nakashima
(2004) explored the use of pre-mix emulsification and argued that the process was commercially
unrealistic. This was due to the need for multiple passes through the membrane to achieve a
desired droplet size as well as an increased likelihood of fouling (Vladisavljevic, Shimidzu and
Nakashima, 2004; Kosvintsev et al., 2005).

17
In direct membrane emulsification, the dispersed phase is injected into the continuous
phase through membrane pores. Droplet detachment typically occurs due to shear stress at the
membrane surface that can be produced by a variety of methods. The membrane can be rotated
or vibrated in a stationary continuous phase (Zhu and Barrow, 2005; Vladisavljevic and Williams,
2006; Charcosset, 2009). Additionally, agitation of the continuous phase via stirring can cause
the shear stress. This is usually done in a set up known as a stirred cell in which a paddle-blade
stirrer is moved over the surface of a flat, circular membrane (Stillwell et al., 2007; Egidi et al.
2008). A final method is cross-flow membrane emulsification in which shear stress is produced
by recirculating the continuous phase past the membrane surface as seen in Figure 1.6 (Egidi et
al., 2008; Charcosset, 2009). Direct cross flow membrane emulsification is used in this work and
discussed further below.
Figure 1.6. Simplified diagram of cross-flow membrane operation (Rayner et al., 2004).
1.5.1 Droplet Formation and Diameter in Cross Flow Membrane Emulsification
1.5.1.1 Theory
Droplet formation in cross-flow membrane emulsification occurs in two steps; droplet
growth at the pore and droplet detachment into the flowing continuous phase (Peng and Williams,
1998). The droplet diameter is given by how far droplet growth proceeds before detachment.
There are various modeling methods for droplet formation including computational fluid
dynamics, surface free-energy minimization, lattice Boltzmann simulations and force or torque
balances (Rayner et al., 2004; De Luca et al., 2008). The force or torque balance models are most
commonly explored in the literature (De Luca et al., 2004; De Luca et al., 2008; Egidi et al.,
18
2008). The latter model, torque balance, assumes a rigid spherical droplet. The center of torque
is at the attachment point of the droplet to the pore on the side opposite the continuous flow inlet
as displayed in point A in Figure 1.7 (De Luca et al., 2008). Detachment occurs when the
clockwise torque overcomes the counterclockwise torque at point A.
Figure 1.7. Simplified Torque Model- Dd – droplet diameter; Dp – pore diameter; Fstat – static
pressure force; FD – cross flow drag force; Fγ – interfacial tension force; A – point of torque
(adapted from De Luca et al., 2005).
While multiple forces are acting on the droplet, the main contributors to the torque
balance are the torques induced by the static pressure force (Fstat), the cross flow drag force (FD)
and the interfacial tension force (Fγ) (Schroder, Behrend and Schubert, 1998). The static pressure
force is due to the pressure difference between the inside and outside of the droplet (Egidi et al.,
2008). The cross-flow drag force is due to the flow of the continuous phase past the droplet and
the interfacial tension force is due to the capillary force of the droplet. The first two forces can be
viewed as inducing a detaching torque, pulling the droplet clockwise around point A and away
from the pore. The interfacial tension force acts in a counterclockwise direction about point A
and essentially holds the droplet onto the pore. Detachment occurs when the detaching torque
(static pressure and cross-flow drag) overcomes the attaching torque caused by interfacial tension
(Peng and Williams, 1998; De Luca et al., 2008).
The torque balance model can be used to predict how experimental parameters influence
the droplet diameter. Thus, by altering these parameters, a more controlled emulsion can be
produced with a desired droplet size and narrow size distribution. A narrow distribution is often
desired because it decreases Ostwald Ripening and hence increases the stability of the emulsion.
In the torque balance model, the cross-flow drag force is given as;

19
(1.2)
where kχ is the wall correction factor (kχ = 1.7 for a single sphere touching an impermeable wall
in the presence of simple shear flow), μc is the viscosity of the continuous phase, dd is the droplet
diameter, vc∞
is the undisturbed tangential velocity of the continuous phase in the center of the
droplet and τw is the wall shear stress (De Luca et al., 2004). The interfacial tension force is
described as;
(1.3)
where dp is the diameter of the membrane pore and γ(t) is the dynamic interfacial tension as a
function of time (De Luca et al., 2004) Lastly, the static pressure force is;
(1.4)
Various torque balance based models use equations that include some or all of these forces.
Oftentimes additional forces such as a dynamic lift force and a buoyancy force are included in the
calculation as well, although in most cases these can be considered negligible (De Luca et al.,
2008). One model used by De Luca et al. in a 2004 study comparing different torque balance
models combines the cross-flow drag force, the interfacial tension force and the static pressure
force in order to model the droplet diameter. This relationship is seen in Equation 1.5 below;
(1.5)
From Equation 1.5 we can see how the different experimental parameters influence
resulting droplet diameter. Factors including continuous phase viscosity, continuous phase
velocity, pore diameter and interfacial tension are all included in the calculations. These

20
variables can be altered by selecting appropriate continuous phase oils and surfactants, altering
the composition of the dispersed aqueous phase, using membranes with certain characteristics and
changing the operational settings of the continuous and dispersed phase pumps (De Luca et al.,
2004).
The above parameters can be divided into three areas: the composition of the phases, the
membrane characteristics and the processing conditions (Charcosset, 2009). Several previous
experiments have been performed to investigate the effect of changing these parameters in a cross
flow emulsification system. The vast majority of these investigations have been performed on
oil-in-water emulsions. The findings from the literature are summarized in the following sub-
sections, although it is uncertain if all of the determined relationships hold true for water-in-oil
emulsions.
1.5.1.2 Composition of Phases
One of the main variations to the phase compositions is the addition of different types
and levels of emulsifiers. Emulsifiers can alter the phase viscosity as well as the interfacial
tension and these changes directly impact Equation 1.5 and thus the droplet size. Increasing
levels of emulsifier have been shown to decrease the droplet size (Schroder, Behrend and
Schubert, 1998; Joscelyne and Tragardh, 1999). This is mainly a function of reduced interfacial
tension as well as the ability of emulsifiers to protect against droplet coalescence (Schroder,
Behrend and Schubert, 1998; Joscelyne and Tragardh, 1999; Yuan et al., 2009; Charcosset,
Limayem and Fessi, 2004).
The type of oil used can also influence the droplet size. Different oils have different
viscosities and interfacial tensions. The purity of oils also affects the interfacial tension. A study
by Gutierrez, Rayner and Dejmek (2009) found that oils free from impurities resulted in narrower
size distributions in oil-in-milk emulsions.
In a water-in-oil emulsion, the composition of the water phase can be altered by the
addition of gelling agents. This affects the viscosity of the aqueous phase, the aqueous phase flux
and perhaps the behavior at the pores. Gelling the dispersed phase after emulsion formation has
been shown to increase the stability of the droplets produced (Garti and Benichou, 2004). While
21
there is no experimental data on how the addition of gelling agents to the dispersed phase affects
droplet size, it is likely that the increased viscosity of the aqueous phase results in a decreased
aqueous phase flux and therefore produces smaller droplets.
1.5.1.3 Membrane Characteristics
The membranes used in cross flow membrane emulsification can be manufactured from a
variety of materials. The most common material is Shirasu-porous-glass (SPG) made from
Japanese volcanic ash. Other membrane types include silicon and silicon nitride microsieves,
polycarbonate track-etch, ceramic aluminum oxide, α-aluminum and zirconia coated, sacroporous
silica glass and polytetrafluoroethylene membranes (Schroder, Behrend and Schubert, 1998;
Joscelyne and Tragardh, 1999; Charcosset, 2009; Yuan, Williams and Biggs, 2009; Lepercq-Bost
et al., 2010; de los Reyes and Charcosset, 2010). Additionally, membranes are often coated with
certain materials or presoaked in the continuous phase to make them either hydrophilic or
hydrophobic for oil-in-water and water-in-oil emulsions respectively (Katoh et al., 1996). The
type of membrane and its pretreatment have been shown to affect droplet diameter (de los Reyes
and Charcosset, 2010) and must therefore be selected depending on desired emulsion
characteristics. A membrane coated with the dispersed phase would lead to coalescence at the
membrane surface instead of budding of the dispersed phase at the pores.
Another main contributor to emulsion droplet size is the size of the membrane pores. It
has been shown that there is a linear relationship between the size of the pores and the size of the
resulting droplets (Equation 1.5; Charcosset, Limayem and Fessi, 2004; Gijsbertsen-Abrahamse
et al., 2004). It is also necessary that the pore size distribution be narrow (Peng and Williams,
1998). In a study of corn oil or kerosene-in-water emulsions stabilized by sucrose esters and
sodium dodecyl sulfate respectively, Katoh et al. (1996) stated that “the dispersion droplet
diameter basically depends upon the membrane pore diameter.” The researchers used SPG
membrane with pore sizes ranging between 0.57 and 2.34 μm and found a linear relationship
between pore size and droplet size.
A final membrane characteristic that affects droplet diameter is porosity which is related
to the distance between the pores. According the Peng and Williams (1998) it is preferred that
pores are uniformly spaced on the membrane surface and there is enough distance between the

22
pores such that the droplets do not touch, even during deformation by the continuous phase. If
contact between droplets occurs before detachment there is an increased likelihood of coalescence
(Peng and Williams, 1998; Gijsbertsen-Abrahamse et al., 2004).
1.5.1.4 Processing Conditions
One of the processing conditions that can be altered in a crow flow membrane
emulsification system is the transmembrane pressure. Transmembrane pressure is the pressure
difference between the dispersed phase and the continuous phase at the membrane (Lepercq-Bost
et al., 2010). This force can be controlled by altering the speed of the continuous and dispersed
phase pumps and thus the respective fluxes. There is not, however, a linear relationship between
the continuous or dispersed phase flux and their respective pressure, so the pressures must be
determined experimentally (Lepercq-Bost et al. 2010). In a study of soybean oil-in-water
emulsions produced using alumina membranes, Lepercq-Bost et al. (2010) showed that mean
droplet diameter and droplet polydispersity increased with increasing transmembrane pressure.
Increasing transmembrane pressure led to more active pores which resulted in increased
coalescence at the membrane due to droplets forming in close proximity (Lepercq-Bost et al.,
2010).
Another processing condition that can be controlled is the wall shear stress. This
parameter is changed by varying the continuous phase pump speed and thus the continuous phase
flux past the membrane. Joscelyne and Tragardh (1999) showed that at a constant emulsifier
concentration, increased wall shear stress resulted in decreased droplet size. These researchers
used a system of oil dispersed in milk via cross-flow emulsification as a possible replacement for
mother’s milk. They determined that at low shear stresses the droplets coalesced at the
membrane surface before detachment by the continuous phase (Joscelyne and Tragardh, 1999).
Similar results were also found by Schroder and Schubert (1997) and Katoh et al. (1996), also for
oil-in-water emulsions.
1.5.2 Studies of Water-in-Oil Emulsions
While the majority of cross flow membrane emulsification studies have been performed
on oil-in-water emulsions, a few have investigated water-in-oil systems. Kandori, Kishi and

23
Ishikawa (1991a,b) investigated water-in-oil emulsions prepared using hydrophilic SPG
membranes. An initial study (Kandori, Kishi and Ishikawa, 1991a) compared the droplet size and
distribution obtained from batch (stirred tank) and continuous (cross flow) methods. The
emulsions were made with water distributed in toluene with different levels of poly(oxyethylene-
oxypropylene) surfactants. The researchers found that there was no difference between the
droplet sizes produced by the two different methods. They showed that the droplets produced by
either method were fairly monodisperse and the emulsions were stable after one month.
The researchers performed a second study examining the effects of interfacial tension and
pore size on droplet diameter (Kandori, Kishi and Ishikawa, 1991b). Although this study did not
use the continuous or cross flow method of production, the initial study showed no difference in
droplet size, so only the batch method was used. The researchers showed that increasing
surfactant concentration and therefore decreasing interfacial tension resulted in decreased droplet
size. The size of the droplets was also shown to depend on the membrane pore diameter.
In another study of water-in-oil emulsions, Katoh et al. (1996) prepared emulsions in
both corn oil and kerosene with either sorbitan esters or PGPR as emulsifiers. They examined
increasing the dispersed phase flux from previously used values to a level that would be
acceptable in food manufacturing. The researchers used a hydrophilic membrane that was pre-
immersed in oil. In a more in-depth study of the corn oil system, Katoh et al. (1997) found that
the droplet diameter was proportional to the pore diameter, droplet size decreased with increasing
continuous phase pump speed and the dispersed phase flux could in fact be increased to
reasonable levels.
Other parameters of a cross flow membrane emulsification system were examined by de
los Reyes and Charcosset (2010) who investigated water-in-oil and ethanol-in-oil emulsions.
Preliminary investigation into suitable emulsifiers determined that 5 wt% PGPR in the soybean
oil continuous phase produced emulsions that remained stable after approximately one month of
storage. The study then looked at the differences between emulsions that were prepared with a
membrane wetted with the continuous phase versus with the dispersed phase. The droplet size
and polydispersity were monitored as well as the changes in the dispersed phase flux. The
researchers found that pre-treatment of the membrane with oil resulted in narrower droplet size
distributions and low dispersed phase flux for water-in-oil emulsion.

24
1.6 Chocolate
Chocolate is a suspension of solids in a continuous phase of semi-crystalline fat. The
three main types of chocolate are dark, milk and white. Dark chocolate is a suspension of sugar
and non-fat cocoa solids in cocoa butter, while milk chocolate adds milk solids and milk fat to the
mix. White chocolate, on the other hand, includes milk solids and milk fat but does not include
nonfat cocoa solids. Chocolate can also include emulsifiers such as lecithin and PGPR as well as
salt, flavoring or spices. While each country follows its own set of laws and requirements for
their chocolate, the United States standard of identity for the three main chocolate types is shown
in Table 1.1 (21CFR163, 2010). Note that only cacao fat and milk fat are included in these
formulations. The addition of any vegetable derived oils, fats or stearins other than from cacao
fat prevents the product from being able to be called a chocolate or chocolate coating (21CFR163,
2010).
Table 1.1. Standards of identity of three main chocolate types based on the US FDA Code of
Federal Regulations (21CFR163, 2010)
Semisweet/Bittersweet
Chocolate
Milk Chocolate White Chocolate
Chocolate Liquor 35 % 10 % 0
Sugar - - 55 %
Cacao Fat - - 20 %
Total Milk Solids 12 % 14 %
Milk Fat 3.39 % 3.5 %
Emulsifier 1.0 % 1.0 % 1.5 %
1.6.1 Fat
Chocolate is typically 30 to 40% fat, depending on the type and its application (Beckett,
2000; Do et al., 2007). This fat is mostly cocoa butter, although milk fat is a minor component.
Cocoa butter is responsible for the “snap, gloss, creamy texture, rich taste and melt-in-the-mouth
quality” desired in chocolate (Norton et al., 2009). It is composed mainly of triacylglycerols of
three fatty acids: saturated palmitic acid and stearic acid and monounsaturated oleic acid
(Afoakwa, Paterson and Fowler, 2007). Cocoa butter can crystallize into a variety of
polymorphic forms, each form melting at a different temperature as seen in Table 1.2. Form V
has the most desired melting profile for chocolate as it melts between 32 and 34 °C, meaning that

25
it melts at body temperature in the mouth (Norton et al., 2009; Talbot, 1994). It is also relatively
dense which provides the desired physical characteristics and allows the product to pop out of
molds efficiently (Haslund, 2010). Polymorphic form V can be produced by tempering the
chocolate, as described below in Section 1.7.2.3.
Table 1.2. Respective melting points of the polymorphic forms of cocoa buttera
Polymorphic Form Melting Point (°C)
I 16-18
II 21-22
III 25.5
IV 27-29
V 34-35
VI 36 a adapted from Talbot, 1994
While cocoa butter is the main fat component of chocolate, other fat may be present as
well. The milk fat in milk and white chocolate helps to soften the chocolate. It also slows the
transition from Form V to Form VI, a higher melting form of cocoa butter (Timms, 1984; Pajin
and Jovanovic, 2005). By slowing this transition, the presence of milk fat has been shown to
decrease fat bloom, an unsightly whitish growth of fat crystals at the surface which will be
discussed in detail in Section 1.8 (Samsudin and Rahim, 1996; Sonwai and Rousseau, 2010).
Depending on the countries’ regulations and intended use, other types of vegetable fat
can be used in chocolate or compound coatings. These fats can either be cocoa butter equivalents
(CBE) which have similar chemical and physical characteristics to those of cocoa butter or cocoa
butter replacers (CBR) which are similar to cocoa butter only in their physical properties (Talbot,
1994; Samsudin and Rahim, 1996). Typical CBE blends are produced from mixtures of
fractionated fats from palm, illipe and shea and must be tempered like cocoa butter (Talbot,
1994). On the other hand, lauric and non-lauric CBRs produced from palm kernel or coconut oil
and palm or soyabean oil respectively do not require tempering as they are non-polymorphic
(Talbot, 1994).

26
1.6.2 Sugar
In accordance with the standard of identity for chocolate, the sweetening component must
be a “nutritive carbohydrate sweetener” (21CFR163, 2010). Sucrose from cane or beet is the
main sugar component in chocolate, with some lactose contributed by the milk solids in milk and
white chocolate (Kruger, 1994). It is used up to approximately 50% in chocolate confectionery
products (Kruger, 1994). Although the sugar only truly imparts sweetness to the product,
changing the sugar content by 5% or more has a large impact on the flavor (Beckett, 1999). The
water content of correctly conditioned sugar is between 0.03 and 0.06%, with sugar crystals
readily absorbing water at relative humidities of 65% or above (Kruger, 1994). Water absorption
by pure sugar results in hardened lumps as well as possible chemical changes and microbiological
issues (Kruger, 1994). Other sugars that can be used in chocolate confections include invert
sugar, fructose, glucose and many common sugar alcohols (Kruger, 1994).
1.6.3 Dairy Ingredients
Based on the chocolate standard of identity, milk and white chocolate products must
contain one or more optional dairy ingredient (21CFR163, 2010). These ingredients include
cream, milkfat, butter, milk, dry whole milk, concentrated milk, evaporated milk, sweetened
condensed milk, skim milk, concentrated skim milk, evaporated skim milk, sweetened condensed
skim milk, nonfat dry milk, concentrated buttermilk, dried buttermilk and malted milk
(21CFR163, 2010). Dairy ingredients have many components that are important to chocolate
production including fats, lactose, proteins and minerals (Reimerdes and Mehrens, 1994).
1.6.4 Emulsifiers
Emulsifiers can be added to white chocolate either singly or in combination up to a total
amount of 1.5% by weight and to milk and semisweet or bittersweet chocolate up to 1.0 % by
weight (21CFR163, 2010). Emulsifiers help to reduce both the viscosity and the yield stress
value of chocolate. In doing so, they serve to decrease the amount of cocoa butter necessary for
proper flow characteristics which decreases both the fat content and the price as cocoa butter is an
expensive ingredient. The most common emulsifier used in chocolate is soya lecithin which has
been shown to bind to the surface of sugar particles and thus drastically reduce viscosity

27
(Johansson and Bergenstahl, 1992; Do et al., 2007). A study by Babin et al. (2005) showed that
when lecithin was added at 0.3 % to a suspension of 70% sugar in various oils, approximately 30
to 40% of it was absorbed to the surfaces of the sugar. At higher values, however, lecithin will
form micelles and thus increase yield value (Afoakwa, Paterson and Fowler, 2007; Johansson and
Bergenstahl, 1992a).
PGPR is another common emulsifier used in chocolate. While PGPR does not have as
large of an effect on viscosity, it does considerably reduce the yield value (Rousset, Sellappan
and Daoud, 2002). It also binds to solid particles but unlike lecithin, does not form micelles
(Rector, 2000). As a result of these benefits, chocolate products made with PGPR can be used
very effectively as thin coatings or detailed surface designs (Schantz and Rohm, 2005).
Additionally, lecithin and PGPR can be blended for optimal rheological benefits in
chocolate products. Schantz and Rohm (2005) found that a lecithin:PGPR ratio of 30:70 resulted
in yield stress minima for both milk and dark chocolate. Viscosity minima were found at a 50:50
ratio for dark chocolate and a 75:25 ratio for milk chocolate (Schantz and Rohm, 2005).
1.7 Chocolate Making Process – Bean to Bar
The manufacturing of chocolate is a complex procedure that can be divided into two
smaller processes; producing cocoa liquor, butter solids from beans (Figure 1.8) and turning these
products into finished chocolate (Figure 1.9). These processes are detailed in Sections 1.7.1 and
1.7.2 below.

28
Figure 1.8. Process diagram for cocoa liquor, butter and solids from cocoa pods (Beckett, 1999).

29
Figure 1.9. Process flow diagram for finished chocolate (modified from Beckett, 1999).
1.7.1 Beans to Cocoa Liquor, Butter and Solids
Cocoa beans are the seeds inside pods of the Theobroma cacao tree. There are three
main varieties, Forastero, Criollo and Trinitario, and the differences between the varieties and
their growing environment have a large impact on finished flavor. Forastero is typically grown in
the Amazon and West Africa and accounts for over 70% of chocolate produced (Adriaenssens,

30
2010). Criollo accounts for 5 to 8% of chocolate products and is grown in Central America and
Asia. Trinitario, a hybrid of the previous two varieties from Trinidad and Grenada, makes up
around 20 percent of chocolate (Adriaenssens, 2010).
Ripe cocoa pods are harvested from the trees and cut open so that the beans inside can be
removed. The beans are then spread out and allowed to ferment, typically enclosed in banana
leaves (Hancock, 1994; Adriaenssens, 2010). This processing step allows for the development of
color and flavor in the bean and lasts approximately 5 to 7 days (Fowler, 1999). The beans are
then spread out and dried, typically by the sun or by artificial drying in wetter regions. Once dry,
the beans are filled into large sacks and transported where necessary.
Once the beans reach a processing facility, they are sorted and cleaned and then roasted.
Roasting helps to further develop the bean flavor, with flavor differences coming from variations
in time, temperature and water content (Adriaenssens, 2010). While it is the beans that are
typically roasted, the next few steps can be switched around such that the nib or the cocoa mass is
roasted instead (Hancock, 1994). These methods each have associated advantages and
disadvantages and can be performed by a variety of machines.
A process called winnowing takes place in which the shell of the bean is broken and the
cocoa bean kernel or nib is separated. The nib is then ground into cocoa mass or liquor which is a
mixture of cocoa solids and cocoa butter. The grinding process also serves to reduce the particle
size of the cocoa solids and is done by different types of grinding mills (Hancock, 1994). This
cocoa mass can then be treated and used in chocolate making or pressed to separate the cocoa
butter from the cocoa solids or powder.
1.7.2 Finished Chocolate
Chocolate liquor, cocoa butter and cocoa powder produced in the above method are now
ready to be used in the manufacture of chocolate products. Again, depending on the type of
chocolate, varying quantities of these ingredients are used.

31
1.7.2.1 Refining
In the next step in chocolate production, the appropriate cocoa components are mixed
with sugar and milk ingredients (for milk or white chocolate). Refining is a grinding process that
can either be done dry or wet with a fraction of the cocoa butter added (8 to 24% fat) (Beckett
1999, 2000). The process is typically done with a two or five roll refiner. The refining step is
extremely important because the particle size produced here directly impacts the mouthfeel and
rheological properties of the finished chocolate (Afoakwa, Paterson and Fowler, 2007). Particles
that are greater than 35 μm can be perceived by the tongue, feel gritty or sandy and are therefore
undesirable to the consumer (Jackson, 1994). Chocolate in the US and Britain are refined to
between 20 and 30 μm while other European chocolate is refined to 15 to 22 μm (Jackson, 1994).
The downside of small particle sizes is that it means an increase in surface area that must be
coated by fat or emulsifiers to have the same viscosity and yield value. Some researchers have
found, however, that a bimodal particle size distribution results in less fat needed and comparable
rheological properties (Beckett, 1999; Do et al., 2007).
1.7.2.2 Conching
The next step in chocolate production is called conching. Conching is a mixing and
shearing process that has two important impacts on the product; it changes the viscosity and
texture from a dry crumb to a liquid and it develops the final flavor attributes of the chocolate
(Ley, 1994; Afoakwa, Paterson and Fowler, 2007). Conching is done by a variety of conche
types including longitudinal, rotary or round and continuous conches (Ley, 1994). The process
can be performed at different times and temperatures, depending on the desired characteristics of
the final product. It normally occurs at temperatures over 50 °C over a period of a few hours to
up to a day (Beckett, 2000).
During the conching process, the chocolate mass undergoes mixing to evenly disperse all
of the ingredients, drying to reduce the moisture content from approximately 1.6% to between 0.6
and 0.8% and shearing to break up agglomerates and distribute the fat (Ley, 1994; Muntener,
2010). The three phases of conching are the dry, pasty and liquid phases (Ley, 1994; Afoakwa,
Paterson and Fowler, 2007). In the first phase, the dry crumb produced from refining is mixed
and sheared under heating. Since the moisture content is the highest at this stage, temperatures

32
should be increased slowly and kept below 60 °C to prevent grit formation (Ley, 1994; Muntener,
2010). It is during this stage that a majority of the moisture evaporates and takes with it many
undesirable volatile components (Ley, 1994).
The second phase of conching, the pasty phase, serves to further develop the chocolate
flavor, remove additional moisture and homogenize the mass (Ley, 1994). Agglomerates are
broken up and the fat is distributed (Muntener, 2010). Since only free fat or fat not coating any
particles, is responsible for the flow properties, it is important to release as much fat as possible
(Muntener, 2010). The final phase involves intense stirring and shearing (Ley, 1994). At this
point emulsifiers and additional cocoa butter are added to achieve the desired flow properties
(Ley, 1994; Afoakwa, Paterson and Fowler, 2007; Muntener, 2010).
1.7.2.3 Tempering
As stated previously, cocoa butter is polymorphic and can crystallize into any of six
forms. Form V, a β form, is desired in chocolate products for appropriate physical characteristics.
Tempering can be done either by batch or continuous methods and by hand or by machine. The
four main steps in tempering involve complete melting, cooling to crystallization, crystallization
and removal of unstable crystals (Talbot, 1994). In the first step, the chocolate is heated to
approximately 50 °C. This melts all the possible crystal polymorphs and removes any crystal
memory. The mass is then cooled to approximately 32 °C while mixing to induce crystal
formation. Crystallization continues at 27 °C and then the mass is heated again to 29-31 °C to
melt out any of the unstable crystals that may have formed (Talbot, 1994). Once the chocolate is
properly tempered, it can be poured into molds for finished products or bulk blocks or it can be
used for enrobing. It is packaged, wrapped and stored to protect the product from moisture,
insects, dust, handling and flavor absorption (Beckett, 1999).
1.8 Heat Resistant Chocolate
When normal chocolate is exposed to temperatures above the melting point of the fat, the
product will become soft, lose its snap and stick to fingers and the wrapper. The impacts on the
product tend to be worse for products with a chocolate confectionery coating (Kempf and
Downey, 1956; Schubiger and Rostagno, 1965; Mandralis and Weitsenecker, 1996; Best et al.,

33
2005). Additionally, when melted chocolate is cooled again the fat has now lost its temper and
can crystallize into unstable polymorphic forms. This causes a phenomenon known as chocolate
bloom. Bloom is the appearance of whitish grey crystals larger than 5 μm on the surface that tend
to look like mold and is seen unfavorably by consumers. Studies have shown that it is an
evolution to the larger Form VI crystals that accounts for bloom (Hodge and Rousseau, 2002;
Rousseau and Sonwai, 2008; Sonwai and Rousseau, 2010).
As a result of the many negatives associated with chocolate in warm environments,
chocolate consumption in warm, tropics regions and during warmer seasons in some countries is
drastically reduced (Ogunwolu and Jayeola, 2006). Transport and storage must be temperature
controlled and in some regions, only stores with refrigeration ability can stock chocolate
(Ogunwolu and Jayeola, 2006). This is also an issue for United States troops abroad in warmer
climates where chocolate is carried as a quick source of calories. In 1937 The Hershey Chocolate
Corporation came out with a heat resistant D Ration chocolate bar that was supplied to troops in
World War II, although it did not have great flavor (Aaseng, 2005; D’Antonio, 2006). A different
version, the Tropical Bar, was introduced in 1945 and later improved upon and used in both
Korea and Vietnam. During the Gulf War the Desert Bar, which could withstand up to 60 °C,
was produced and shipped by Hershey’s (Aaseng, 2005; D’Antonio, 2006). These bars, however,
do not have the same flavor or texture as traditional chocolate and thus the development of a heat
resistant chocolate with the same sensory attributes is still to be desired.
1.8.1 Definition
There is no standard definition for “heat resistant chocolate” but it is referred to in the
patent literature as heat resistant, thermostable, tropicalized, thermally robust and shape
sustaining (O’Rourke, 1959; Giddey and Dove, 1984; Kealey and Quan, 1992; Alander,
Warnheim and Luhti, 1996; Best et al., 2005). Inventors of heat resistant products have different
qualifying characteristics for their products. One factor important to most inventors is shape
retention at some specified elevated temperature. Some inventors merely state that shape
retention must occur above room temperature, at elevated temperatures or at temperatures like in
summer or tropical countries (Kempf and Downey, 1956; Schubiger and Rostagno, 1965; Kincs,
1993; Davila and Finkel, 2005). Alander, Warnheim and Luhti (1996) on the other hand require
shape retention at 35 to 40 °C. Yet others require 40 °C (Takemori, Tsurumi and Takagi, 1993;

34
Best et al., 2005; Simburger, 2009) or even 50 °C (Beckett, 1995) to classify the product as heat-
resistant. Jeffery, Glynn and Khan (1977) necessitate the highest level of heat resistance at 65.55
°C.
Other important factors listed by inventors of heat resistant chocolates include not being
soft, not being sticky to the touch or to the wrapper, not having increase likelihood of fat bloom
and not having significant sensory differences. These characteristics are listed in Table 1.3 with
their corresponding inventors. When referring to sensory differences, most inventors report in
the patent literature that the same “finished” flavor is still present and the texture, mouthfeel and
appearance are not changed, however these claims are typically not supported by sensory data.
Table 1.3. Desired characteristics of heat resistant chocolate
as stated by inventors of such products
Characteristic Patents
Not Soft Giddey and Dove, 1991; Kincs, 1992; Mandralis and
Weitzenecker, 1996
Not Sticky to the
Touch
Giddey and Dove, 1991; Takemori, Tsurumi and Takagi, 1992;
Davila and Finkel, 2005; Simburger, 2009
Not Stick to Wrapper Schubiger and Rostagno, 1965; Beckett, 1995; Best et al., 2005;
Davila and Finkel, 2005
No Sensory
Differences
Kempf and Downey, 1956; Schubiger and Rostagno, 1965; Giddey
and Dove, 1984, 1991; Kealey and Quan, 1992; Kincs, 1992;
Takemori, Tsurumi and Takagi, 1992; Best et al., 2005; Davila and
Finkel, 2005
No Increase in Bloom Giddey and Dove, 1984,1991; Kincs, 1992; Best et al., 2005
As a result of this wide array of desired heat resistant characteristics and qualifying
temperatures, Dicolla (2009) proposed three different levels of heat resistance at which the
chocolate is not sticky to the touch, retains its shape and is acceptable to a sensory panel. The
levels are mild heat resistance from 26.7 to 32.2 °C, intermediate heat resistance from 32.3 to
37.8 °C and extreme heat resistance from 37.9 °C and higher (Dicolla, 2009).

35
1.8.2 Measurement of Heat Resistance
The variety of characteristics required by researchers and inventors for heat resistant
chocolate leads to various ways for testing and examining products. Many placed the chocolate
in ovens set between 35 to 50 °C for set periods of time ranging from a few minutes to a couple
of hours and monitored shape retention (Takemori, Tsurumi and Takagi, 1992; Beckett, 1995;
Alander, Warnheim and Luhti, 1996; Mandralis and Weitzenecker, 1996). Giddey and Dove
(1984, 1991) took this one step further and left their chocolates in an oven at 50 °C overnight.
Best et al. (2005) describe a more quantitative method for examining shape retention
upon heating. Samples of their chocolate were molded into bars of set dimensions. These bars
were weighed and their width was measured at ten evenly spaced points along their length. The
bars were placed into an oven at 40 °C for 1 hour after which they were dropped 18 inches onto a
solid, flat laboratory bench. The bars were allowed to cool and then the width was remeasured at
the ten points. Equation 1.6 was then used to calculate the shape retention index (SRI) of the
sample.
(1.6)
In this equation, d1 and d2 are the average width before and after the test procedure, w is the
weight of the bar and the superscripts are the test sample (s) and the control sample (c). This
equation results in a zero if there is no significant difference between the test and control samples
and a 100 if there is complete shape retention. A SRI value of 80% was acceptable while 90%
and above was preferred (Best et al., 2007).
In addition to these shape retention observations and measurements, some inventors
quantitated the softening of their products through penetration testing. Giddey and Dove (1984)
placed samples in an oven for 1 to 2 hours at 40 °C or 2 hours at 37 °C (Giddey and Dove, 1991)
and sample were then subjected to piercing with a vertical needle using progressive force. The
force required to penetrate 3 mm into the sample was recorded. Results showed that 6 g of force
was used for control chocolates while the tropicalized chocolate made via their method required

36
58 g of force (Giddey and Dove, 1984). Simburger (2009) also used penetration testing,
measuring the force of samples stored at 50 °C for 2 hours with a Stevens texture analyzer.
In another interesting heat resistance test, Giddey and Dove (1984) packed their
chocolate in the trunk of a car and left it there for 15 days during the summer. The samples were
then inspected for gloss, shine and bloom.
Other instrumental techniques are used to examine heat resistant chocolates including a
Gallenkamp melting point apparatus to measure melting points (Ogunwolu and Jayeola, 2006)
and a Brabender thermorheograph to monitor viscosity changes (Best et al., 2007). Many
inventors also employed sensory evaluation techniques to check for differences in mouthfeel
(Giddey and Dove, 1984, 1991; Takemori, Tsurumi and Takagi, 1992).
Schubiger and Rostagno (1965) tested their heat resistant chocolate by immersing
samples in ether for several hours. Their theory for heat resistance was based on the formation of
a sugar edifice that will be described in detail in Section 1.8.3.3. Ether is a fat solvent capable of
extracting the fat from chocolate. Since the fat of typical chocolate is what confers structure,
samples of normal chocolate would collapse completely upon extraction by ether. A chocolate
sample that possesses a sugar edifice that gives it structure would not collapse upon immersion in
ether. This test can also show the extent to which heat resistance permeates the chocolate as well
as its homogeneity (Schubiger and Rostagno, 1965).
1.8.3 Methods of Manufacture of Heat Resistant Chocolate
While there are many techniques for developing heat resistance, the majority can be
divided into three mechanistic categories. These categories include increasing the melting point
of the continuous phase fats, increasing the viscosity of the continuous phase and forming a sugar
skeleton.
1.8.3.1 High Melting Fats
The first and perhaps simplest method of producing heat resistant chocolate is by using
fats other than cocoa butter that have higher melting points. Cocoa butter softens at 28 °C,

37
melting completely by 34 °C. Higher melting fats can either be added as a total replacement for
cocoa butter or as a partial replacement. The solid fat creates a fat crystal lattice that traps the
melted cocoa butter. Illipe and fractionated shea butters are commonly used for this purpose
(Jeyarani and Reddy, 1999). Other vegetable fats, particularly modified fats, have also been used
and decrease the cost of the product by at least partially replacing expensive cocoa butter.
Jeyarani and Reddy (1999) investigated blends of mahua and kokum fats for use as cocoa butter
extenders. They found that by fractionating and blending the fats, they could create a suitable
cocoa butter extender for use along with cocoa butter in heat resistant chocolate.
One disadvantage of this approach is that the use of these fats as a replacement for cocoa
butter in chocolate is restricted in many countries (Best et al., 2005). Additionally, the use of
higher melting fats typically results in a waxy mouthfeel that is unfavorable to consumers.
Products with these fats lack the smooth melting characteristics of a cocoa butter containing
product (Takemori, Tsurumi and Takagi, 1992; Best et al., 2005). Consumers still want a product
to melt well in their mouth but just not in the package on in their hand.
1.8.3.2 Increased Viscosity
Another approach to heat resistant chocolate is by increasing the viscosity of the
continuous phase. By doing so, melted cocoa butter will not be able to flow from the original
product shape. This was the theory behind Hershey’s D Ration chocolate bar which had added
oat flour (Hershey Community Archives, 2011). Ogunwolu and Jayeola (2006) made heat
resistant chocolate products with increased viscosity as the proposed mechanism by incorporating
either cornstarch or gelatin. The addition of 10 % of cornstarch or gelatin increased the melting
point to 50 °C and 45 °C respectively. The hypothesis was that this occurred due to an increase
in the viscosity of the fat due to the thickening/stabilizing properties of these ingredients. While
most sensory characteristics were not rated significantly different than traditional chocolate, there
were significant differences in the sweetness of the cornstarch product and the taste and
smoothness of the gelatin product.
The common disadvantage of heat resistant chocolate made by the above mechanism is
that the chocolate products do not have the same mouthfeel as traditional chocolate. These
products may contain aggregates of solid particles or have a different melting profile. The

38
methods also include detailed extra steps in the chocolate making process and make it necessary
to purchase and install new equipment. Additionally, Ogunwolu and Jayeola (2006) noted that
the percent moisture of their chocolate with added cornstarch was significantly higher than that of
the control or gelatin chocolate. This indicates that the product may have developed heat
resistance through a different mechanism instead of through an increase in continuous phase
viscosity. This mechanism is due to the addition of water to chocolate and is described in the
following section.
1.8.3.3 Sugar Skeleton
The final method for the development of heat resistance involves the formation of a
continuous sugar skeleton within the chocolate structure. The theory to explain this is that the
water is absorbed onto the sugar particles, creating a syrup layer around them (Chevalley, 1994)
and changing their interactions within the dispersion (Johansson and Bergenstahl, 1992b).
Details of the theory are expanded in Section 1.10 below. However, if the sugar molecules can be
welded together to form an internal edifice, then even if the cocoa butter melts, the product will
be able to maintain its form. Thus it would be the sugar skeleton that gives the chocolate its
structure instead of the crystallized cocoa butter.
In order to visualize the sugar skeleton, the procedure described by Schubiger and
Rostagno (1965) can be used in which the product is immersed in ether. If no sugar structure
exists, the sugar will collapse away with the extracted fat. In the other hand, if there is a sugar
skeleton, the product will hardly look different without the fat.
Schubiger and Rostagno (1965) proposed a heat resistant chocolate by mixing amorphous
sugar made by one of three proposed methods with a standard conched chocolate mass. The
product can be tempered and molded and is subjected to a thermal treatment at 25 °C for 20 to 30
days. This heat treatment releases moisture from the amorphous sugar allowing for the formation
of a sugar skeleton within the structure as long as the right amount of fat has been added such that
it does not coat the sugar particles.
A similar approach by many inventors is the addition of a polyol. The method of
addition varies, but eventually the polyol serves to release water in a controlled manner. If not

39
added correctly, the polyol can cause immediate and drastic increases in viscosity to the point that
it is impossible to work with the product. Davila and Finkel (2005) add a polyol directly to
molten chocolate but in order to overcome previous disadvantages to this method, the mass
undergoes mixing for an extended period of time. By doing so, the sample goes from being
highly viscous upon addition back to a viscosity typical of chocolate products as the water
becomes evenly distributed. This product can then be tempered and molded or used as a coating.
Other workers avoid direct polyol addition, instead opting to add it in various protected
forms. Kincs (1992) proposed adding a polyol-in-oil emulsion using mixing and sometimes an
additional homogenization technique. This emulsion was then added to a melted confectionery
coating formula and used as a coating with increased heat resistance and bloom retardation.
Beckett (1995) used a similar method, but further encapsulated a polyol, usually glycerol, by
spray cooling a homogenized polyol-in-oil emulsion. This was then added to melted, conched
chocolate before, during or after tempering and then molded into bars.
Mandralis and Weitzenecker (1996) propose a polyol gel or polyol and water gel that was
either frozen, ground and mixed with cocoa powder or emulsified in cocoa butter to form beads.
The gels were made using a variety of techniques and gelling agents. The gel particulates were
then added to a melted chocolate mass with mixing. A total polyol content of between 0.2 and 60
% existed in the final product which was then allowed to harden for a period of days. The polyol
was believed to diffuse slowly out of the gel and eventually result in the formation of a sugar
skeleton. It was also stated that this invention may be used for making low cost or low calorie
chocolate because of the addition of polyol containing water and can also be used to add aromas
or flavors.
Kempf and Downey (1956) added a water and emulsifier (favorably lecithin) “emulsion”
to a conched chocolate mass. The water and emulsifier emulsion was sprayed over the mass
while it was under agitation. Heat resistance was said to be conferred to the product because the
emulsifier enables the water to be absorbed at the surface of the milk solids causing them to swell
and create a supporting structure within the composition. While this was the explanation of
Kempf and Downey (1956) it is more likely the formation of a sugar skeleton that is the true
mechanism in this case.
40
O’Rourke (1959) combined the use of polyols with the addition of humectants and
protein that were added to the typical chocolate ingredients during refining. The chocolate mass
is processed as normal and can be molded or used for enrobing. Once the final product is made,
it is subjected to a humid environment, either at environmental conditions or an artificial
environment if the environmental humidity is not high enough. The humectant in the product
absorbs moisture and creates an internal structure along with the moisture from the polyol.
In addition to adding water by the above methods, water can also be added in the form of
a foam. The foam made by Giddey and Dove (1991) can be of a variety of compositions,
including different foamers, viscosity enhancers and thickeners. The foam is stirred into a
chocolate mass and the product is molded and cooled. The foam must be strong enough to
withstand the mixing process and able to evenly disperse the water throughout the chocolate
mass. It is preferred that 0.1 to 5 % water be in the final composition. Upon cooling the foam
degasses and the water binds the sugar particles into a skeleton.
As in the products with increased continuous phase viscosity, the trouble with adding
amorphous sugar, polyols, humectants or foam to chocolate is the potential for formation of large
aggregates. In order to prevent this, inventors propose methods of adding water that is stabilized
in smaller amounts. Similar to the use of the foam by Giddey and Dove (1991), this allows the
water to be added without causing large viscosity increases or the development of large
particulates. One way to do this is through the formation of a water-in-oil emulsion or
microemulsion formed through various technologies. The use of water-in-oil emulsions in
chocolate products is further detailed in Section 1.9 below.
1.9 Water-in-Oil Emulsions in Chocolate
Typical chocolate has a water activity of less than 0.5 and is thus not prone to spoilage
(Lenovich, 1986). However, when water is added directly to melted chocolate, it causes the melt
to quickly seize up with a drastic increase in viscosity. In addition to increased viscosity, water in
chocolate also reduces snapability (Norton et al., 2009) and causes it to be subject to
microbiological instability. Current research however focuses on the addition of water droplets
into a fat continuous phase resulting in an emulsion that is used in chocolate formulation. The

41
use of emulsions provides a controlled method of water addition so that the negative aspects
typically associated with water addition can be overcome.
A product patented by Simburger (2009) involves a chocolate mass that is between 1.8
and 7% water. The inventor discusses the addition of water-in-oil emulsions as a preferred
method to accomplish this goal. These water-in-oil emulsions are produced with a high speed
mixer in the presence of emulsifiers resulting in an average droplet size of around 10 μm. These
emulsions are then added to a standard chocolate mass to the desired water content. The
chocolate product received a microwave heat treatment before, during or after cooling which
serves “to induce the formation of a secondary microstructure,” creating a sugar skeleton within
the sample through the stimulated release of water.
Jeffery, Glynn and Khan (1977) patented an oil-in-water emulsion made with a high
speed mixer in which chocolate ingredients were emulsified in water. This emulsion was then
evaporated to approximately 10% moisture content and further dried under gasification. This
produced an expanded product with less than 5% moisture that was claimed to be temperature-
resistant.
In a similar application, microemulsions can also be used to add water in even smaller
droplet sizes. Since the water droplets are so small, the sugar lattice is able to be constructed
uniformly and without the formation of large aggregates in theory. Alander, Warnheim and Luhti
(1996) use microemulsions that are produced spontaneously in the presence of an emulsifier.
Kealey and Quan (1992) make microemulsions through the utilization of reverse micelle
technology. Using this method, a hydrated lecithin is produced that is comprised preferably of 80
to 85% water. The emulsion can then be added to tempered chocolate in amounts ranging from 1
to 3%.
The water-in-oil emulsion does not necessarily need to be added in liquid form. Giddey
and Dove (1984) made emulsions with a final water content of 30 to 80% in droplets between 0.1
to 100 μm that can either be used as is or solidified and powdered for later use. The liquid or
powdered emulsion is then added to a conched chocolate mass under agitation to a total water
content of 1 to 4% by weight. The product must immediately be molded into bars or used as a
confectionery coating. A tropicalized chocolate product is thus produced that can withstand

42
storage at 40 to 50 °C. The heat resistance of the product is highest after two weeks of storage at
15 to 20 °C or one to two days at 27 to 28 °C.
Other water-in-oil emulsions for application to chocolate also involve polyols or
sweeteners. Takemori, Tsurumi and Takagi (1992) made a water-in-oil emulsion with water
soluble sugars and sugar alcohols in the aqueous phase distributed in a fat phase with emulsifier.
The emulsion was produced by mixing in fats and oils that had a SFI not more than 20 at 20 °C
and not more than 10 at 30 °C. The emulsions produced were 10 to 50% water and were then
mixed with a standard chocolate mass to a total water concentration of 4 to 15%. The product
was molded and it was determined that heat resistance was greatest after 20 days of storage at 18
°C after which the product retained its shape even when heated to 50 °C.
Similarly, Best et al. (2005) make a “tropicalizing agent” which can then be used in
chocolate confections. The agent was a water-in-oil emulsion in which the water phase included
sugars and/or polyols and a gelling agent. Once emulsified, the temperature was reduced such
that gelled beads formed in the continuous fat phase. This could be incorporated into a chocolate
mass that could then be molded or used for enrobing. Once solidified, the release of the gel was
initiated by a variety of different processes. The gel was able to diffuse through the chocolate
mass and form adhesion points between existing sugar crystals.
In a third example, Traitler, Windhab and Wolf (2000) made water-in-oil emulsions first
by stirring water and an emulsifier in which water may contain a polyol to improve microbial
stability. It can also contain other water soluble ingredients such as flavoring agents,
preservatives or vitamins. The rough emulsion was homogenized by a colloid mill to
microdroplets approximately 2 μm in diameter. This emulsion was stable for at least 1 hour. A
molten chocolate mass was added to the emulsion with slight to moderate stirring. The chocolate
composition was tempered and poured into molds. The final mass contains anywhere from 1 to
40% water by mass. This was done for economical reasons, to create a heat resistant chocolate,
to make a low calorie chocolate, to incorporate water into a chocolate with neutral flavor and for
the possibilities of adding nutrients or bioactive components to chocolate.
Not unlike the product made by Traitler, Windhab and Wolf (2000), water-in-oil
emulsions can also be produced for use in chocolate for reasons other than heat resistance.

43
Rosenthal et al. (1966) created an emulsion of 8 to 62.5% water-in-oil by stirring or by
homogenization. The resulting emulsion is best used as a chocolate dip-coating for water-
containing foods, particularly ice cream and is a lower fat and lower cost product. Schlup and
Lioutas (1995) patented water-containing chocolate tablets with up to 16% water in which an
aqueous mixture of water, sweetener and milk solids are added to cocoa solids coated in cocoa
butter in the presence of an emulsifier. Beckett et al. (2007) propose a low-calorie/ low fat milk
chocolate produced by adding a water-in-oil emulsion produced by stirring which to a conched
dark chocolate under agitation such that there exists 1 to 30% water. A milk powder suspension
is then made and incorporated into the water-containing dark chocolate to a final preferred water
content of 10 to 15% by weight. Rey et al. (2008) also made a low fat confection by mixing an
aqueous phase that can include sugars, preservatives, structuring agents and flavoring agents with
a fat phase using a hand mixer. Cocoa powder, cocoa liquor and or milk ingredients can then be
added to create a low fat confection that is at least 60% water.
Water-in-oil emulsions can also be utilized in making reduced fat and reduced calorie
cocoa butters. These emulsions are made in order to study their properties and eventually apply
them to chocolate products. Vastenavond (2006) created a reduced fat, reduced calorie cocoa
butter by creating a water-in-oil emulsion with membrane emulsification. The aqueous phase is a
mixture of a pectin solution and a gum, sugar and calcium solution. A membrane tube was
moved linearly with an electronically induced vibrator to generate shear at the membrane surface.
The aqueous phase was then dispersed in a continuous phase of melted cocoa butter, cocoa butter
hardener and PGPR. The emulsion can be up to 50 to 90% aqueous phase and is meant to be
used in chocolate formulations for a reduced calorie product.
Similarly, Norton et al. (2009) made emulsions with cocoa butter as the continuous phase
with a high shear mixer and on a bench scale margarine line. The margarine line was able to
produce stable emulsions with 1% sugar in the aqueous phase and using 2% lecithin or 1% PGPR
as an emulsifier. It was shown that lecithin produces emulsions with a narrower size distribution,
however at 10 and 20% water, 100% of the PGPR stabilized droplets were smaller than 100 μm.
After five weeks of storage, the cocoa butter had changed to form V, producing a melting curve
in DSC similar to that of correctly tempered chocolate. Emulsions made on the margarine line
contained 20% water and 1% PGPR with a range of sugar concentrations. NMR was performed
on the emulsions and showed that the droplet size was approximately 1 μm. By controlling the

44
temperatures used in this process, a correctly tempered chocolate product was produced, as
evident in DSC results. The goal of the work was to investigate water-in-cocoa butter emulsions
for later application to chocolate products with lower fat contents but still having the same
sensory attributes.
Whether water-in-oil emulsions are produced for the development of heat resistance or in
order to product lower calorie/fat confections, it is important to understand the interaction of all
ingredients present. Water can be very destructive to chocolate products if not added in a
controlled manner. When uncontrolled, it can ruin the product through drastic viscosity
increases, the formation of large agglomerates which negatively impact the sensory attributes or
by corrupting the microbial stability. While water-in-oil emulsions have been shown to be a good
form of control, further investigation must be done into their formation, stability and ingredient
interactions.
The above methods show that the formation of a heat resistant chocolate is possible
through the controlled addition of water. In order to properly understand the mechanism
responsible for this heat resistance it is necessary to examine the interactions of sugar particles in
oil dispersions and the influences of water and emulsifiers. The following section provides the
theoretical background for the formation of a continuous sugar skeleton in chocolate.
1.10. Theory of Sugar Skeleton Formation
Figure 1.10A shows a dispersion of particles in oil. The particles behave much like the
droplets of emulsions described in Section 1.2 above, with some of the same modes of instability.
The rheology of the suspension is a function solely of the viscous forces acting and depends on
the volume fraction of the particles (Dickinson, 1992). However, if a network forms between the
particles the viscosity will increase, something which Wildemuth and Williams (1985) refer to as
the “liquid microstructure.” They state that this microstructure “will be the primary determinant
of the rheology” and can lead to the gelation of the dispersion. The gel led particle network can
keep the continuous phase liquid contained, thereby increasing the viscosity. A dispersion of
particles in oil in which a network has developed is shown in Figure 1.10B.

45
Figure 1.10. Sugar-in-oil dispersions A) without and B) with network formation.
In order to form a network within a dispersion, the particles must stick together (Figure
1.10) and the net attractive force between the particles must be greater than any mechanical shear.
There are many colloidal and surface forces that may be important in dispersions and can give
rise to interparticle attraction including:
Electrostatic forces due to the interaction of charged material that is adsorbed
on the surfaces of particles (Coupland, 2010)
Steric forces between adsorbed layers in close contact (Israelachvili, 1992;
Walstra, 1996)
Hydrophobic forces between hydrophobic particles in the presence of water
(Babin, 2005)
Hydrogen bonding forces between adsorbed material of adjacent
particles(Israelachvili, 1996)
Van der Waals forces due to dipoles and induced dipoles of particles and
adsorbed material (Hiemenz and Rajagopalan, 1997)
For hydrophilic particles in a hydrophobic media (e.g.,sugar in air or oil), electrostatic
forces are insignificant, steric forces are too short range and hydrophobic forces are not present.
Although hydrogen bonding forces would be relatively strong, the particles must first come into
A B

46
close contact. While van der Waals forces are fairly long range attractive forces and may cause
slight attraction of dry particles, these forces alone are not enough to cause the formation of a
strong sugar skeleton. Consequently, dry powders suspended either in air or in oil are usually
reasonably free-flowing if the volume fraction does not approach close packing.
However, when a small amount of water is present in the system, the interactions
between particles change. Cracks in and gaps between particles create regions of lower vapor
pressure which allow water vapor to condense in these regions, even below the dew point, in a
process called capillary condensation (Billings, Bronlund and Paterson, 2005). This occurs
because the concave shape at these regions lowers the chemical potential of the liquid phase as
seen by the shaded regions in Figure 1.11.
Figure 1.11. Illustration of capillaries created by two neighboring particles. Shading indicates
regions of water adsorption. Θ – wetting angle; r – particle radius.
The adsorption of water leads to the formation of water bridges between particles (Billings,
Bronlund and Paterson, 2005). The result is strong adhesive forces due to the interfacial tension
of the curved region of liquid (Johansson and Bergenstahl, 1992; Butt, 2011). The forces are
known as capillary forces with force (Fc) given by the equation:
Fc = 2πrΓcosθ
(1.7)
where r is the particle radius, Γ is the surface tension and θ is the wetting angle as shown
in Figure 1.7 (Koos and Willenbacher, 2011).
θ r

47
The effect of capillary forces described above can be seen in the work of Scoville and
Peleg (1981) in which a model system of uniform glass beads was used to investigate the
influence of water on the bulk properties of powders. The workers showed that water bridges
alone caused significant changes in the bulk properties and the effect was most significant at
smaller particle sizes. At larger sizes, the attractive forces from the water bridges were not strong
enough to support a physical structure of such heavy particles.
While Scoville and Peleg (1981) were not able to directly measure the magnitude of the
forces acting, Claesson et al. (1997) used a force balance to investigate the interaction between
mica surfaces at different water activities in the presence of a liquid triglyceride. The workers
showed that water preferentially adsorbed on the surfaces, as seen through the low contact angle
of water on mica in the oil. When the water activity was increased above 0.90, a strong attractive
force was observed between the surfaces indicating the formation of water capillaries. In a
related study, Billings, Bronlund and Paterson (2005) measured the strength of the liquid bridges
formed in sucrose at different water activities and determined that significant liquid bridging
occurs at a water activity of 0.77. This water activity corresponds with the inflection point in the
moisture sorption isotherm of sucrose which can be used to visualize moisture adsorption.
The forces which result from water adsorption by particles also affect the bulk properties
of the dispersion. Whereas dry powders were relatively free-flowing, powders that are wet
become aggregated. This aggregation tends to increase viscosity or lead to gelation of the
dispersion. This behavior can be seen through rheological examination of wet dispersions.
In one such study, Moreyra and Peleg (1981) performed rheological tests on food powders
including sucrose and showed that moisture on the surface of the particles was the main
contributor to the physical changes observed in the powders. The physical changes of sucrose
again mirrored the pattern of the moisture sorption isotherm.
Johansson and Bergenstahl (1992b) also examined the rheological parameters of sucrose,
this time in soybean oil systems. The workers utilized a network model originally proposed by
van den Tempel (1961) to explain their results. This model “assumes that the attractive forces
between the particles dominate particle-particle interactions. The particles flocculate and arrange
themselves into a three-dimensional network of chains. Each chain consists of a linear array of
particles attached to each other.” Therefore, as long as this “structure” is not significantly

48
disrupted, this model can be used in conjunction with a relationship between yield stress and
energy of interaction (Gillespie,1960) to determine interaction forces and energies from
rheological data. Johansson and Bergenstahl (1992b) used this as a basis for their analysis and
determined that van der Waals forces were too weak to be responsible for the interactions seen in
their system. They proposed that these forces influence the formation of a primary network but
then water bridges are formed between particles and result in a secondary network with higher
energy interactions and stronger adhesive forces.
Johansson and Bergenstahl (1992a,b) also investigated the particle interactions in oils
through sedimentation experiments. The basis of the method is that the formation of
agglomerates through particle attraction affects particle sedimentation behavior (Tiller and
Khatib, 1984; Johansson and Bergenstahl, 1992a). Conversely, repulsive forces between particles
allows them to pass each other more easily when sedimenting and results in a more dense and
compact sediment (Johansson and Bergenstahl, 1992a). In experiments reported by Johansson
and Bergenstahl (1992a,b,c) soybean oil was used as a representative food oil in sucrose crystal
sedimentation studies. The workers investigated the influence of water on sedimentation
behavior and showed that the sediment volume increased with water addition up to 1 % water
content (Johansson and Bergenstahl, 1992c). These results correspond linearly to those in the
rheological studies. They argued that increased sediment volume was due to increased attractive
forces, specifically water bridges.
Through the research described above, it can be seen that the addition of water to
particles results in increased adhesion and development of a network through the formation of
water bridges. If this network is able to develop to a sufficient extent, then heat resistance could
be conferred to a chocolate product. Food materials, however, are more complex than non-
adsorbent model powders and the adsorption of water onto sugar particles causes more than just
the formation of water bridges. Water also alters the physical properties of the surface of various
food particles by softening and local plasticization (Moreyra and Peleg, 1981). This action
contributes to changes in both the individual and bulk characteristics of food powders and is also
a factor in the development of agglomerated or “caked” products (Scoville and Peleg, 1981).
However, if the amount of water added is too large, the sugar particles dissolve and the resultant
water-in-oil emulsion will be unstable (Johansson and Bergenstahl, 1992c).

49
If water is added to a suspension of partially soluble particles (e.g., sugar particles) and
the suspension is subsequently dried out, the dried sugar may form a very strong glass or crystal
bridge holding the particles together. Billings, Bronlund and Paterson (2005) demonstrated the
formation of solid bridges when moisture was added to sucrose suspensions to form capillary
bonds then dried. In this case, solid bridges resulting from the recrystallization of dissolved sugar
were two to three times stronger than liquid bridges and strongly contributed to caking of sugars.
These strong solid bridges provide yet another force capable of supporting a sugar skeleton and
help to explain how heat resistant chocolate products maintain structure even after exposure to
heat which could evaporate a portion of the liquid water bridges.
It is important to note that the emulsifiers commonly used in chocolate, lecithin and
PGPR, are capable of altering the sugar particle interactions in oil as well. Emulsifiers adsorb to
the surfaces of sugar particles dispersed in oil in order to decrease the unfavorable sugar-oil
interactions. This adsorption can compete with the adsorption of water to the interface and thus
change the interactions between particles in the presence of water (Ziegler, Garbolino and
Coupland, 2003). Lecithin has been shown to adsorb to sugar surfaces in multilayers or
aggregates which increases the repulsive forces between particles, decreases adhesive forces,
stabilizes the dispersion and results in a denser, more packed sediment (Johansson and
Bergenstahl, 1992a; Ziegler, Garbolino and Coupland, 2003). PGPR, on the other hand, tends to
adsorb in “a loosely packed monolayer” (Ziegler, Garbolino and Coupland, 2003).
Ziegler, Garbolino and Coupland (2003) showed including 0.05% lecithin or 0.1% PGPR
significantly reduced the size of sucrose aggregates in oil. While emulsifiers can affect the sugar
particle interactions, at aw > 0.75 enough water may be adsorbed to the sugar surface to form
water bridges and promote adhesion (Ziegler, Garbolino and Coupland, 2003). Johansson and
Bergenstahl (1992c) also show that high levels of phosphatidylcholine (a major component of
lecithin) decreased sucrose in soybean oil sediment volume, suggesting that it weakened the
adhesive forces between sugar particles. With the addition of up to 1% moisture, however, the
sediment volume was still higher than the dry volume of sugar crystals. Thus while emulsifiers
may alter the interaction of particles in oil in the presence of water, it is still safe to assume that
sufficient water bridges can be formed to promote the formation of an internal sugar structure that
can provide heat resistance to chocolate products, especially at low emulsifier concentrations.
50
1.11. Water in Chocolate – Summary
Now that the theory for sugar skeleton formation in chocolate products has been detailed,
it is important to revisit the addition of water to chocolate. Added water typically causes a drastic
increase in the viscosity of a sugar in oil dispersion. This disrupts many processes used in
traditional chocolate manufacture as the product does not flow or mold as easily. To prevent this,
water must be added in a controlled form that does not immediately react with the sugar particles.
A decreased reaction time would allow the water to become more evenly dispersed within the
sugar in oil dispersion. Mixing in this case must also be done in a way that does not significantly
affect the interaction between the water and the sugar particles. Once dispersed, the water can
then react with the sugar particles. The interactions discussed above suggest a mechanism by
which the reaction of water with sugar particles would impact the formation of a sugar skeleton
and therefore confer heat resistance to a chocolate product.

51
Chapter 2
STATEMENT OF THE PROBLEM
Water-in-oil emulsions are used in many common food applications, either as products or
ingredients in oil continuous systems. Traditional emulsification methods require considerable
inputs of energy, use bulky and expensive equipment and produce substantial amounts of heat
which can damage ingredients. A relatively new technique for making emulsions, cross flow
membrane emulsification, has been shown to remedy many of these problems. In order to apply
this technique to foods, it is first important to fully understand the operation in a small, lab-scale
system. The addition of emulsions produced by this method to an oil continuous food such as
chocolate can then be explored for the possibility of enhanced heat resistance.
Many studies and patents have reported the addition of water to chocolate for the
development of heat resistance. The proposed mechanism for this is the formation of a sugar
skeleton due to capillary forces between sugar particles upon addition of water. Water is
typically added in some sort of bound form and several patents report the use of water-in-oil
emulsions. However, there was no work to date on the use of cross flow membrane
emulsification for producing such emulsions. In order to optimize the heat resistance of
chocolate products it is necessary to understand how water-in-oil emulsions produced by this
method interact with sugar particles and develop the sugar skeleton within a sugar-in-oil
dispersion.
The overall goal of this work is to determine if suitable water-in-oil emulsions can be
produced via a lab-scale cross flow membrane emulsification system for use in the production of
heat resistant model chocolate products. Two objectives were defined in order to reach this goal:
1. The first objective is to explore the effects of changing ingredients (type and
concentration of emulsifiers in the continuous phase and κ-carrageenan in the
dispersed phase) and operational parameters (different membranes and continuous
and dispersed phase flow rates) on the droplet size and distribution of water-in-oil
emulsions produced with the cross flow membrane emulsification system.

52
Conditions to produce both stable and unstable emulsions will be identified, with
stable emulsions maintaining a consistent droplet size over time.
2. The second objective is to investigate the interactions of water-in-oil emulsions with
sugar-in-oil dispersions and determine if heat resistant model chocolate can be
produced through the incorporation of emulsions made with the cross flow membrane
emulsification system. In this study, a method for producing a model chocolate will
be developed and chocolates made with and without added water with water added
either directly or as a stable or unstable emulsion. Quantitative testing procedures
will be developed to evaluate sugar skeleton formation and heat resistance because of
a lack of such defined procedures in the literature.

53
Chapter 3
MANUFACTURE OF WATER-IN-OIL EMULSIONS BY CROSS FLOW
MEMBRANE EMULSIFICATION: EFFECT OF PROCESSING
PARAMETERS AND FORMULATION
3.1. Introduction
Emulsions are dispersions of one liquid as droplets in a second, immiscible liquid. They
are frequently used in the food industry, both as products and ingredients. Classic food examples
of oil-in-water emulsions are salad dressings, sauces, flavored beverages, mayonnaise, milk and
cream (Dickinson, 1992). While oil-in-water emulsions are the most common food emulsion
type, water-in-oil food emulsions include important products such as butter and margarine
(Dickinson, 1992). They also have potential application in any fat continuous product such as
chocolate. The following study will focus on this type of emulsion.
Water-in-oil emulsions are inherently unstable due to the immiscible phases present and
instability can drastically impact product characteristics and shelf-life. Instability arises due to
the thermodynamic drive to decrease interfacial surface area and can occur via a variety of
mechanisms including sedimentation, flocculation, coalescence and Ostwald ripening. The rate
of sedimentation of water-in-oil emulsions is understood in terms of Stokes’ law governing the
terminal velocity of an isolated droplet which takes into account the radius of the droplet, the
densities of the phases and the shear viscosity of the continuous phase (McClements, 1999).
Flocculation or aggregation is the sticking together of droplets without rupture of their
interparticle films while coalescence occurs when the interparticle film ruptures resulting in a
single, larger droplet. Ostwald ripening is the mass transfer of water from smaller droplets to
larger droplets also causing them to increase in size. All of these methods of instability result in
larger effective droplet sizes, thus increasing the rate of sedimentation. These instability
mechanisms, however, can be minimized through the alteration of phase compositions and the
use of effective production techniques.
Traditional methods of emulsion production include the use of rotor-stator mixers, high
pressure homogenizers, ultrasound homogenizers and microfluidizers. Rotor-stator methods
include all forms of mixers and stirrers, colloid mills and toothed disc dispersing machines

54
(Sotoyama et al., 1999; Charcosset, Limayem and Fessi, 2004; Tadros, 2009). All of these
methods require large energy inputs, the majority of which is lost by heat which can damage any
labile ingredients (Gijsbertsen-Abrahamse, van der Padt and Boom, 2004). Equipment is also
usually bulky and expensive and controlling droplet size and distribution can be difficult. In
contrast to these methods, a more recent method, membrane emulsification using microporous
membranes, does not involve high shear stress, requires less energy and provides an easy way to
control droplet size and distribution (Sotoyama et al., 1999). Membrane emulsification has
become more popular in the past 20 years because of these advantages (Charcosset, 2009).
Membrane emulsification utilizes pressure to push a liquid dispersed phase through a
porous membrane (Charcosset, Limayem and Fessi, 2004). Frequently the continuous phase is
sheared to aid in droplet detachment (Egidi et al., 2008). This can be done by a variety of
methods including recirculation of the continuous phase in a process known as cross flow
membrane emulsification as seen in Figure 3.1.
Figure 3.1. Simplified diagram of cross flow membrane operation (Rayner et al., 2004)
Droplet formation in this system occurs in two steps; droplet growth at the pore and
droplet detachment into the flowing continuous phase (Peng and Williams, 1998). The droplet
diameter is given by how far droplet growth proceeds before detachment and can be modeled
through a variety of techniques including a torque balance model (De Luca et al., 2004; De Luca
et al., 2008; Egidi et al., 2008). While multiple forces are acting on a droplet, the main
contributors to the torque balance are the torques induced by the static pressure force, the cross
flow drag force and the interfacial tension force (Schroder, Behrend and Schubert, 1998). The

55
continuous phase viscosity, continuous phase velocity, pore diameter and interfacial tension are
factors included in the calculations of these forces. These variables can be altered by selecting
appropriate continuous phase oils and emulsifiers, altering the composition of the dispersed
aqueous phase (such as by adding a gelling agent), using membranes with certain characteristics
and changing the operational settings of the continuous and dispersed phase pumps (De Luca et
al., 2004). While these variables have been explored for water-in-oil emulsions made by
traditional methods and oil-in-water emulsions made by cross flow membrane emulsification,
there is limited literature available exploring these variables in water-in-oil cross flow membrane
formed emulsions.
The following study used a lab-scale cross flow membrane emulsification system to
produce 30% water-in-oil (w/w) emulsions for potential application in food systems. This
concentration was chosen because 30% water-in-oil emulsions are easily measured by pulsed
field gradient NMR, which was used to determine droplet size and distribution. This
measurement technique was selected from the available sizing techniques because it does not
require any sample preparation, does not damage the samples and works even with concentrated
emulsions (Gabriele et al., 2009; Rousseau and Hodge, 2005; Van lent et al., 2008). Some of the
accessible factors involved in determining droplet size described above were explored by altering
the type and concentration of emulsifier, membrane pore size and shape, continuous and
dispersed phase flow rates and dispersed phase composition. Data collected from these
experiments will help to determine the operational and compositional parameters required to
produce stable emulsions with the lab-scale cross flow membrane emulsification system. Based
on the factors in Stokes’ law, a “stable” emulsion in this experiment was defined as consisting of
small droplets with a narrow droplet size distribution that does not significantly change over the
time scale of the experimentation.
It was hypothesized that increased emulsifier concentration, higher continuous phase
flow rate, lower dispersed phase flow rate and the presence of a gelling agent in the dispersed
phase will result in a more stable emulsion. Additionally, it was hypothesized that there would be
a difference in the emulsification behavior of the emulsifiers used; polyglycerol polyricinoleate
(PGPR), soy lecithin and a 50:50 PGPR:lecithin blend and that the use of different membranes
would affect droplet size and distribution.
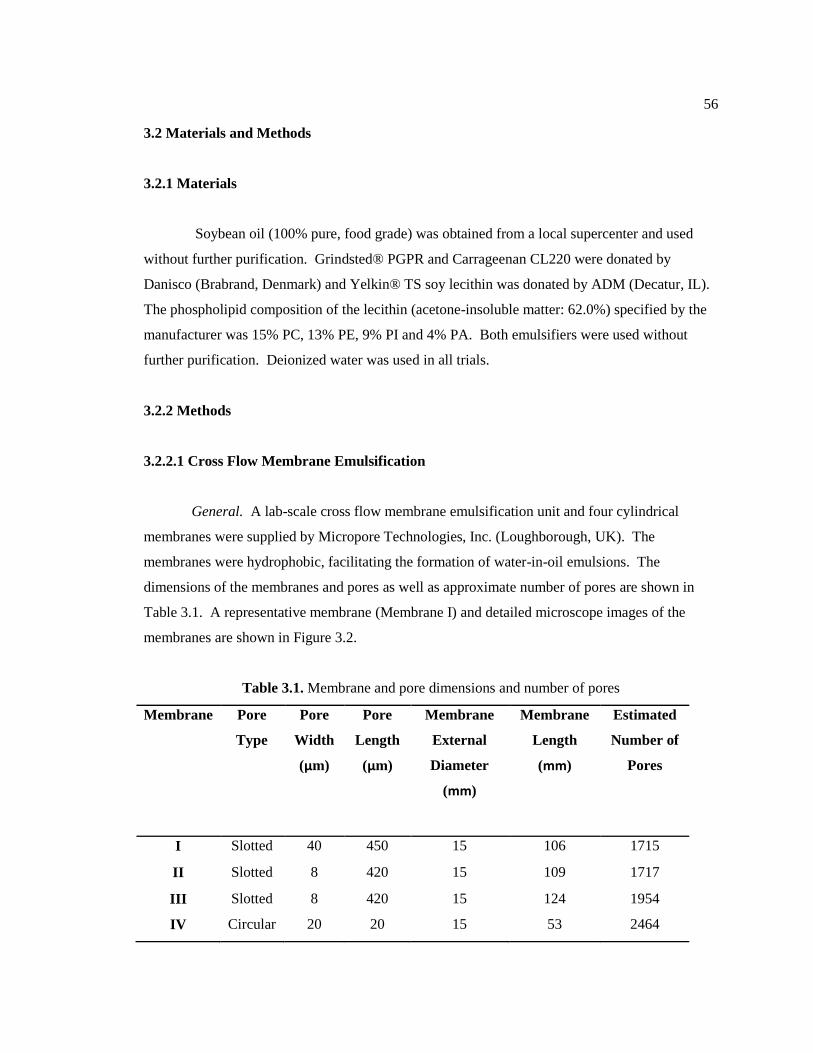
56
3.2 Materials and Methods
3.2.1 Materials
Soybean oil (100% pure, food grade) was obtained from a local supercenter and used
without further purification. Grindsted® PGPR and Carrageenan CL220 were donated by
Danisco (Brabrand, Denmark) and Yelkin® TS soy lecithin was donated by ADM (Decatur, IL).
The phospholipid composition of the lecithin (acetone-insoluble matter: 62.0%) specified by the
manufacturer was 15% PC, 13% PE, 9% PI and 4% PA. Both emulsifiers were used without
further purification. Deionized water was used in all trials.
3.2.2 Methods
3.2.2.1 Cross Flow Membrane Emulsification
General. A lab-scale cross flow membrane emulsification unit and four cylindrical
membranes were supplied by Micropore Technologies, Inc. (Loughborough, UK). The
membranes were hydrophobic, facilitating the formation of water-in-oil emulsions. The
dimensions of the membranes and pores as well as approximate number of pores are shown in
Table 3.1. A representative membrane (Membrane I) and detailed microscope images of the
membranes are shown in Figure 3.2.
Table 3.1. Membrane and pore dimensions and number of pores
Membrane Pore
Type
Pore
Width
(μm)
Pore
Length
(μm)
Membrane
External
Diameter
(mm)
Membrane
Length
(mm)
Estimated
Number of
Pores
I Slotted 40 450 15 106 1715
II Slotted 8 420 15 109 1717
III Slotted 8 420 15 124 1954
IV Circular 20 20 15 53 2464
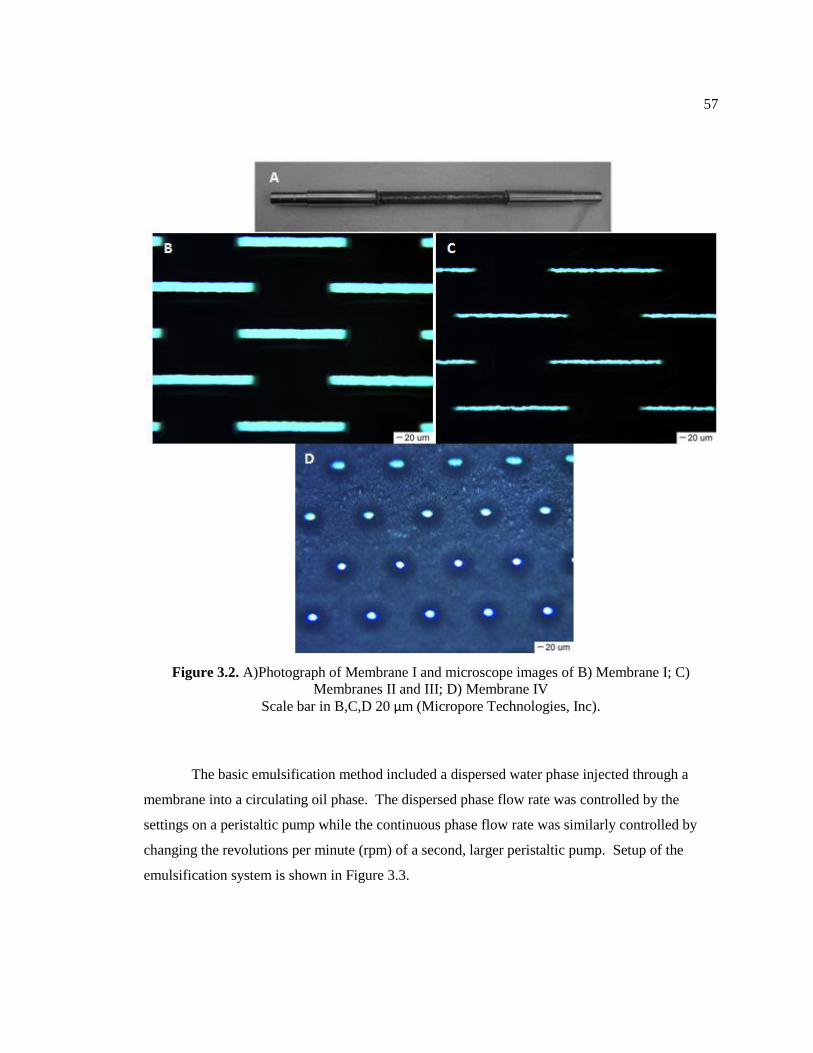
57
Figure 3.2. A)Photograph of Membrane I and microscope images of B) Membrane I; C)
Membranes II and III; D) Membrane IV
Scale bar in B,C,D 20 μm (Micropore Technologies, Inc).
The basic emulsification method included a dispersed water phase injected through a
membrane into a circulating oil phase. The dispersed phase flow rate was controlled by the
settings on a peristaltic pump while the continuous phase flow rate was similarly controlled by
changing the revolutions per minute (rpm) of a second, larger peristaltic pump. Setup of the
emulsification system is shown in Figure 3.3.

58
Figure 3.3. Photograph of cross flow membrane emulsification system. Arrows show flow of
continuous phase (solid) and dispersed phase (dashed).
The following is the general method for the production of emulsions. The continuous
phase (400 g) of soybean oil and the appropriate emulsifiers was obtained and stirred until all
emulsifier was dispersed, as determined visually. The dispersed phase (176.4 g) of distilled water
was obtained as it was previously determined that 5 g water remained in the dispersed phase
tubing after injection. Thus the total amount of aqueous phase injected into the oil was 171.4 g,
resulting in a 30% (w/w) water-in-oil emulsion. Unless otherwise specified, the dispersed phase
pump was set to a setting of 4 and the continuous phase pump was set to 150 rpm, referred to
hereafter as “standard pump conditions”. The water was injected into the continuous phase using
Membrane I (unless otherwise specified) and two samples were taken for particle size
determination. Each composition was prepared a minimum of three times. Samples were also
poured into test tubes immediately after production and stored quiescently at room temperature to
monitor behavior over time.
Determining Flow Rates and Pressures. The mass of soybean oil (continuous phase)
pumped through the system per unit time was measured for different speed settings of the large
peristaltic pump. The dispersed phase flow rate was similarly determined as the mass of water

59
per unit time injected into soybean oil at different speed settings of the small peristaltic pump.
All flow rate determinations were performed in triplicate. Pressure in the system before and after
the membrane at different large pump settings was determined using a DP25B-S Strain
Meter/Controller (Omega Engineering, Inc.; Stamford, CT) equipped with a pressure transducer.
The continuous phase flow rate of soybean oil through the system at pump speeds of 100
and 150 rpm was determined to be 64.2 g/sec and 95.3 g/sec respectively. The dispersed phase
flow rate at pump settings of 4 and 7 was 0.6 g/sec and 1.1 g/sec respectively. The flow rate
through each pore of the four membranes was calculated at a flow rate of 0.6 g/sec (Table 3.2).
Table 3.2. Flow rate through one pore of each membrane
at dispersed phase flow rate of 0.6 g/sec
Membrane Flow Rate Through Pore
(g*pore-1
*sec-1
)
I 3.5 x 10⁻⁴
II 3.5 x 10⁻⁴
III 3.1 x 10⁻⁴
IV 2.4 x 10⁻⁴
The pressures in the continuous phase circuit before and after a membrane at both
continuous phase pump speeds is shown in Table 3.3. Because of the nature of the peristaltic
pump, both low and high pressure values are listed.
Table 3.3. Pressures in continuous phase circuit before and after a membrane
at two continuous phase pump speeds.
Pump Speed (rpm) Pressure Before Membrane (kPa) Pressure After Membrane (kPa)
100 0.068 – 0.075 0.057 – 0.067
150 0.091 – 0.107 0.083 – 0.093
Emulsifiers. The three emulsifiers in this study were PGPR, lecithin and a 50:50
PGPR:lecithin blend. The emulsifiers were studied at concentrations of 0.5, 1, 2, 4 and 6 % with
respect to the continuous phase (w/w). Based on preliminary data, emulsions with a 2%

60
concentration of emulsifier was chosen to be tracked at various time points over a 24 hour time
period. Emulsions produced with 1, 2 and 4% PGPR were also tracked over a period of 4 weeks.
Carrageenan. In order to determine the effect of adding carrageenan to the dispersed
phase of emulsions, a control emulsion was prepared as a reference. This control emulsion was
30% water-in-oil stabilized with 2% lecithin which was previously determined to be unstable at
25 °C. This was done to be able to isolate any stability change due to carrageenan. Carrageenan
containing emulsions were produced with 2% κ-carrageenan in the dispersed phase, which was
shown to produce a solid gel at 25 °C. The emulsions were produced under standard pump
conditions as defined previously, however the temperatures of the phases were changed. The
continuous phase was heated to and maintained at between 60 and 65 °C. The dispersed phase
was heated to and maintained at between 70 and 75 °C and injected into the continuous phase at
this temperature. For carrageenan containing emulsions, κ-carrageenan was fully dissolved in the
heated water with stirring prior to injection. Once the dispersed phase was injected, two samples
were taken and placed in screw cap test tubes. A thermometer was placed in one test tube and
both were put in a freezer at -22 °C. Samples were continually observed until the thermometer
read 25 °C after which they were removed from the freezer. A cap was added to the tube without
the thermometer. This tube was inverted five times to re-suspend the droplets and two samples
were taken for droplet size determination. Emulsions both with and without carrageenan were
made in triplicate.
3.2.2.2 NMR Analysis
Emulsion droplet size was measured by pulsed field gradient NMR (pfg NMR) analysis
(Minispec mq20, Bruker, The Woodlands, TX) with a “Water Droplet Size Application V1.1 Rev
2” program for water-in-oil emulsions. Diffusion coefficients were measured with the “Diffusio
Application.” The diffusion coefficients for pure water and gelled water with 2% carrageenan at
25 °C were 2.299x10⁻⁵
and 1.706x10⁻⁵
cm2/sec respectively. A constant gradient strength γ of 2 T
m-1
was used with gradient pulse widths (δ) varied automatically by the application between 0.05
and 5 ms. Eight gradient pulse widths were used with a gradient pulse separation (Δ) of 210 ms.
The application was calibrated at 5 °C and measurements were performed at 25 °C with the
appropriate changes in diffusion coefficients. Each measurement took between 12 to 30 minutes.

61
Emulsions were tested in duplicate, with measurements taken within the same hour considered to
be at the same time point.
The NMR droplet size application assumes that the distributions are log-normal. The
application provides values for the geometric mean of the volume weighted distribution which
will be referred to in this text as D3_3 or droplet size and the standard deviation of the log-normal
distribution which will be referred to as sigma. Figure 3.4 shows sample distributions (D3_3 =
22.13 μm, sigma = 0.985) indicating these values with D3_3 shown on the cumulative
distribution and sigma indicated on the relative frequency distribution. Sigma provides a way to
characterize the width of the distribution. Since sigma is calculated from the logarithmic
distribution, its true unit is ln(μm), however this unit is not used when reporting sigma values as it
does not have any practical meaning and will also not be used when reporting sigma in this study.
Figure 3.4. Sample log-normal cumulative and relative frequency distributions with D3_3 =
22.13 μm and sigma = 0.985.
It is important to note that the maximum droplet size that can be reported by the software
is 100 μm since the time for diffusion is so long in droplets above this size that the effect of
restriction cannot be determined accurately. Thus emulsions with this value as an output have an
average droplet size at or above 100 μm. The means reported in the following figures exclude
any measurements of 100 μm and are identified with an asterisk followed (*). These
measurements were also excluded from the calculation of standard deviation of the mean. Thus
any measurement indicated with an asterisk is a low estimate of the actual value.

62
3.2.2.3 Microscopy
Optical microscopy was performed using an Olympus BX41 microscope (Hitech
Intruments, Inc., Edgemont, PA) equipped with SPOT Advanced Version 4.0.9 imaging software
(Diagnostic Intruments, Inc) on samples prepared by the above methods. One drop of the sample
was placed on a glass microscope slide and covered by a cover slip. Analysis was performed at
room temperature.
3.2.2.4 Statistical Analysis
Statistical analysis was performed using GraphPad Prism 5 (GraphPad Software, Inc.; La
Jolla, CA) for analysis of variance (ANOVA) and Tukey’s post-test and Minitab Student Release
14 (Minitab Inc.; State College, PA) for 2-Sample t-tests with significance at α = 0.05.
Probability plots of the droplet size (D3_3) and sigma were performed by Minitab Student
Release 14 (Minitab Inc.; State College, PA) and all values were greater than 0.05, indicating
normal distributions.
3.3 Results and Discussion
3.3.1 Emulsion Formation
Water-in-oil emulsions (30% w/w) were produced via cross flow membrane
emulsification using PGPR, lecithin and a 50:50 PGPR:lecithin blend as emulsifiers under
standard pump conditions with membrane A. Images of the emulsions stabilized with 2% of the
respective emulsifiers immediately after production are shown in Figure 3.5A-C.
Droplets stabilized by PGPR were perfectly spherical and highly polydisperse with many
fine droplets and a few large ones with diameters up to approximately 90 μm (Figure 3.5A). The
larger droplets appeared to be clustered together. This may be due to flocculation or alternatively
may be due to the constrictive effects of the cover slip causing larger particles to move to regions
with more space.
63
The optical micrographs of lecithin-stabilized emulsions were different from PGPR-
stabilized emulsions (Figure 3.5B). Again, the droplets were highly polydisperse but in this case
the largest particles (> 100 μm) were often non-spherical. The droplets were highly aggregated
with large gaps between groups of droplets. The aggregates were also seen on the microscope
slide without magnification. The blend-stabilized emulsions were also highly polydisperse and
contained a mixture of spherical and non-spherical droplets (Figure 3.5C). The droplet sizes were
typically larger than those seen in PGPR- or lecithin-stabilized emulsions. Some droplets were
also seen to coalesce during observation.

64
A
B
Figure 3.5. Optical microscope image of 30% water-in-oil emulsion produced under standard
conditions stabilized by A) 2% PGPR; B) 2% lecithin; C) 2% 50:50 PGPR:lecithin blend. Scale
bars 50 μm.

65
C
Figure 3.5. (Continued)
The influence of emulsifier concentration on the resulting initial droplet diameter and
distribution of these emulsions was investigated via NMR analysis. The droplet diameters
(D3_3) and the sigma values are shown in Figure 3.6A and B. Overall, droplet diameter is shown
to decrease with increasing emulsifier concentration (Figure 3.6A). The PGPR-stabilized
droplets are significantly smaller than the lecithin and blend stabilized droplets at a concentration
of 1%. The PGPR-stabilized droplets also show a large initial decrease in droplet diameter from
0.5 to 1% PGPR. The lecithin-stabilized droplets are significantly smaller than the blend droplets
from 1 to 4%. At 6% emulsifier concentration, the droplet diameters of the lecithin and blend
emulsions are not statistically different.
Sigma values (the standard deviation of the droplet size distribution) display a similar
decrease with increasing emulsifier concentration for all emulsifiers (Figure 3.6B). In this case,
the sigma values of lecithin-stabilized emulsions are significantly smaller than those of blend-
stabilized emulsions at all concentrations and PGPR-stabilized emulsions at concentrations
between 1 and 4%. The sigma of PGPR- and blend-stabilized emulsions are not significantly
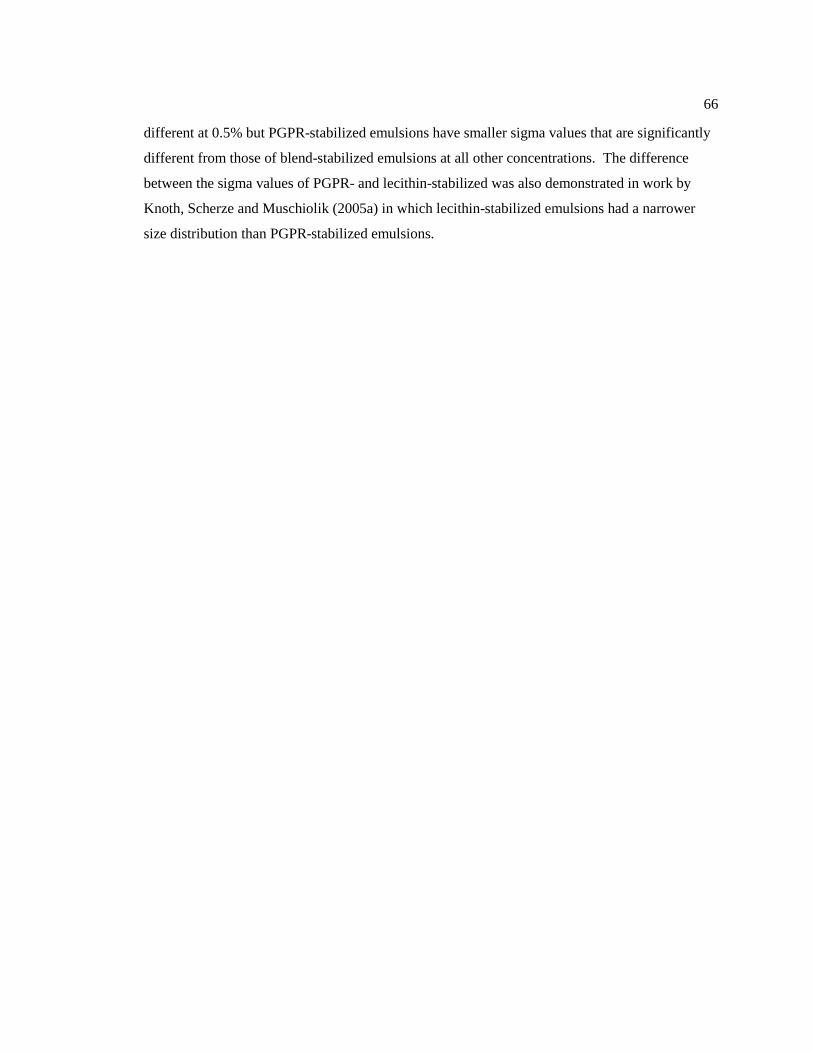
66
different at 0.5% but PGPR-stabilized emulsions have smaller sigma values that are significantly
different from those of blend-stabilized emulsions at all other concentrations. The difference
between the sigma values of PGPR- and lecithin-stabilized was also demonstrated in work by
Knoth, Scherze and Muschiolik (2005a) in which lecithin-stabilized emulsions had a narrower
size distribution than PGPR-stabilized emulsions.
67
A
B
Figure 3.6. Average initial A) droplet size and B) sigma value of 30 % w/o emulsions
produced with increasing concentrations of PGPR (diamonds), lecithin (squares) and 50:50 blend
of PGPR:lecithin (triangles). Concentration is of soybean oil continuous phase. Analyzed by pfg
NMR at 25 °C. Error bars indicate standard deviation. Asterisks indicate that measurements of
100 μm were removed from the calculation of the mean. No point is shown for 0.5% lecithin-
stabilized emulsions as all measurements were 100 μm.

68
It appears that the droplet size of blend-stabilized emulsions is governed by the amount of
lecithin present. This behavior is illustrated in Figure 3.7 which compares the droplet sizes of
lecithin-stabilized and blend-stabilized emulsions based on the lecithin concentration of the
continuous phases at 1 and 2%. At these levels the droplet sizes of the blend-stabilized emulsion
are not statistically different than those of the lecithin-stabilized emulsion while they are
statistically different from the PGPR-stabilized emulsions (not shown). This behavior is difficult
to explain but is possibly due to interactions between the two emulsifiers of the blend. I will
return to this point after considering additional data (Section 3.3.3).
Figure 3.7. Average initial droplet diameter vs lecithin concentration of 30 % w/o emulsions
produced with lecithin (dark bars) and 50:50 blend of PGPR:lecithin (light bars). Concentration is
of soybean oil continuous phase. The 1% and 2% lecithin concentrations in the PGPR:lecithin
blend also contained 1% and 2% PGPR respectively. Analyzed by pfg NMR at 25 °C. Error bars
indicate standard deviation and letters indicate significant difference at p = 0.05.
3.3.2 Emulsion Stability
Just because a particular emulsifier is able to form fine droplets is no indication that those
droplets will be stable. Microscopy of lecithin- and blend-stabilized emulsions immediately after
formation already showed evidence of flocculation. To elucidate the effect of emulsifier on
emulsion stability, the size distributions of emulsions prepared with a fixed amount of emulsifier

69
(2%) were monitored over a period of 24 hours (Figure 3.8A and B). Again, the means reported
exclude any measurements of 100 μm and are identified with an asterisk followed (*). These
measurements were also excluded from the calculation of standard deviation of the mean.
PGPR-stabilized emulsions remained at a consistent droplet size of approximately 21.4
μm over the 24 hour period with a consistent sigma value of approximately 1, indicating a stable
emulsion. The lecithin-stabilized emulsion droplet size increased from 43.1 to 77 μm in a six
hour time-span after which there was no further change. This indicates that there was sufficient
lecithin present to stabilize the interfacial area of this size of droplets. This behavior was
mirrored in the sigma value which increased from 0.8 to 1.4 during this time period, becoming
significantly different than the sigma value of PGPR-stabilized emulsions after 24 hours. The
blend-stabilized emulsions, on the other hand, rapidly destabilized with a majority of samples
furnishing measurements of 100 μm after two to three hours.
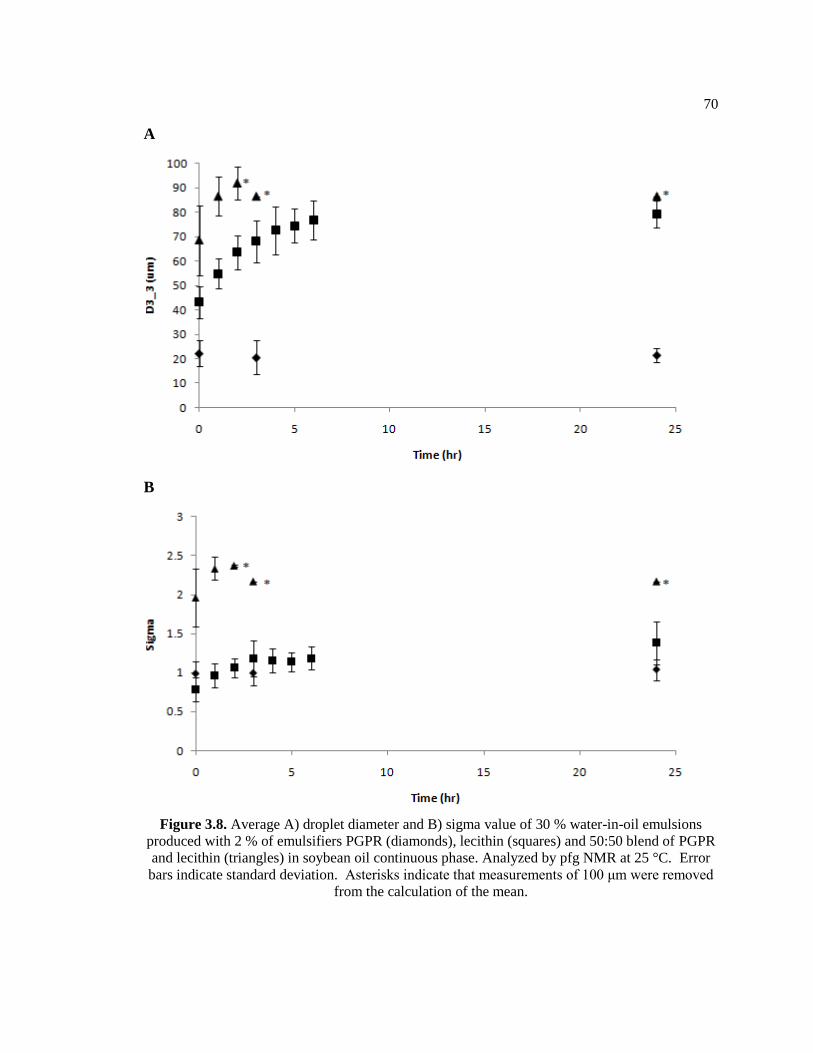
70
A
B
Figure 3.8. Average A) droplet diameter and B) sigma value of 30 % water-in-oil emulsions
produced with 2 % of emulsifiers PGPR (diamonds), lecithin (squares) and 50:50 blend of PGPR
and lecithin (triangles) in soybean oil continuous phase. Analyzed by pfg NMR at 25 °C. Error
bars indicate standard deviation. Asterisks indicate that measurements of 100 μm were removed
from the calculation of the mean.
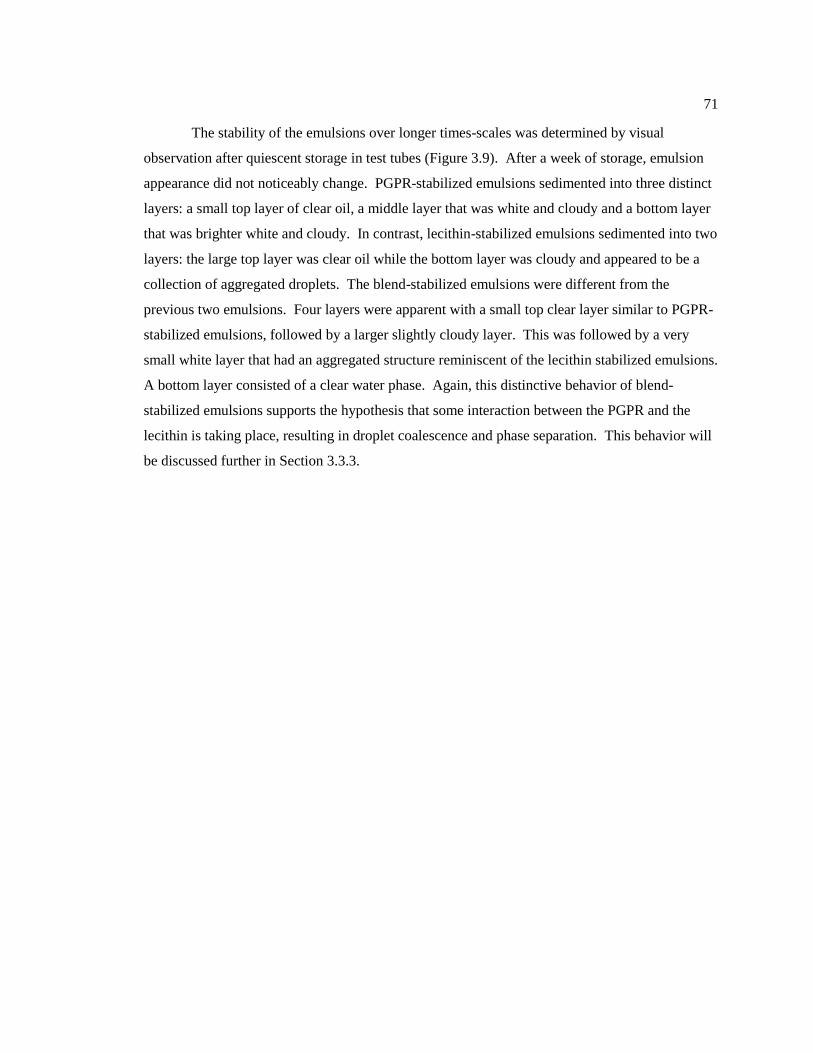
71
The stability of the emulsions over longer times-scales was determined by visual
observation after quiescent storage in test tubes (Figure 3.9). After a week of storage, emulsion
appearance did not noticeably change. PGPR-stabilized emulsions sedimented into three distinct
layers: a small top layer of clear oil, a middle layer that was white and cloudy and a bottom layer
that was brighter white and cloudy. In contrast, lecithin-stabilized emulsions sedimented into two
layers: the large top layer was clear oil while the bottom layer was cloudy and appeared to be a
collection of aggregated droplets. The blend-stabilized emulsions were different from the
previous two emulsions. Four layers were apparent with a small top clear layer similar to PGPR-
stabilized emulsions, followed by a larger slightly cloudy layer. This was followed by a very
small white layer that had an aggregated structure reminiscent of the lecithin stabilized emulsions.
A bottom layer consisted of a clear water phase. Again, this distinctive behavior of blend-
stabilized emulsions supports the hypothesis that some interaction between the PGPR and the
lecithin is taking place, resulting in droplet coalescence and phase separation. This behavior will
be discussed further in Section 3.3.3.

72
Figure 3.9. Photograph of emulsions in test tubes produced by the standard method with A) 2%
PGPR in oil phase; B) 2% lecithin in oil phase; C) 2% 50:50 PGPR:lecithin blend in oil phase.
Emulsions produced between 2 to 4 weeks prior to photograph.
As seen in Figures 3.8 and 3.9, PGPR-stabilized emulsions were stable over a longer
period of time than the other emulsions. To further investigate the stability of PGPR-stabilized
emulsions, the droplet size distributions of emulsions stabilized with 1, 2 and 4% PGPR were
monitored over a period of four weeks and shown in Figure 3.10A and B. Clearly the lecithin and
blend covered droplets could not be studied over this timescale.
While higher levels of PGPR resulted in smaller droplet sizes and sigma values, all the
emulsions showed no statistical difference in droplet size between time 0 and 4 week

73
measurements and only the emulsions stabilized with 4% PGPR showed a significant increase in
sigma value (0.83 to 1.06 at week 4).

74
A
B
Figure 3.10. Average A) droplet diameter and B) sigma value of 30% w/o emulsions produced
with 1% (diamonds), 2% (squares) and 4% (triangles) PGPR in soybean oil continuous phase
over 4 weeks. Analyzed by pfg NMR at 25 °C. Error bars indicate standard deviation.

75
3.3.3 Discussion of Emulsion Formation and Stability
The results for initial droplet distribution support the hypothesis that increasing
emulsifier concentration results in reduced droplet diameters and distributions (Figure 3.6). This
is evident from the torque balance model for predicting droplet diameter as interfacial tension is
one of the main factors in Equation 1.5. Emulsifiers lower the interfacial tension by adsorbing
onto the surface of droplets as they develop at the membrane (Charcosset, Limayem and Fessi,
2004; Charcosset, 2009). The addition of more surfactant lowers the surface tension even further.
Additionally, higher levels of emulsifier are able to better stabilize existing droplets leading to
decreased coalescence during recirculation of the continuous phase during emulsion production
(Charcosset, Limayem and Fessi, 2004; Charcosset, 2009). Furthermore, the decrease in droplet
diameter with increasing emulsifier concentration would be expected to level off when the
amount of emulsifier able to be adsorbed at the droplet surface reached a maximum and Figure
3.6A shows the beginning of this behavior with smaller changes in droplet diameter occurring
between 4 and 6% in all systems.
The data on both emulsion formation and stability (Figures 3.5, 3.6 and 3.8) show that the
type of emulsifier affects droplet size distribution. Schroder, Behrend and Schubert (1998) also
found this to be true for water-continuous emulsifiers used in stabilizing oil-in-water emulsions
produced by membrane emulsification. The smaller droplet sizes and increased stability of
emulsions stabilized by equivalent concentrations of PGPR show that this emulsifier is more
effective at stabilizing water-in-oil emulsions. There are two explanations for this behavior.
Firstly, lower interfacial tensions are expected to generate smaller sizes (Schroder, Behrend and
Schubert, 1998). Indeed surface tension is present in the equations of two of the forces included
in the model for predicting droplet diameter (Equations 1.3 and 1.4; De Luca et al., 2004). A
study by Knoth, Scherze and Muschiolik (2005a) reported the interfacial pressures at the water-
sunflower oil interface with 2.5% PGPR and lecithin as 23.09 and 16.41 mN/m respectively.
Thus PGPR solutions have a lower interfacial tension and can be expected to produce smaller
emulsion droplets. However, the emulsifiers and oil used in the study by Knoth, Scherze and
Muschiolik (2005a) are not identical to those used in this study. Despite variables in the
composition of these components, the general trends observed are expected to hold for this study
as well.

76
A second explanation for the smaller droplet sizes and increased stability of PGPR
stabilized emulsions is the stabilizing steric effects of PGPR-coated surfaces. PGPR is typically
larger than lecithin ( 1050 D vs 750 D; Ziegler, Garbolino and Coupland, 2003; Palsgaard, 2008)
and has a polymeric structure consisting of loops and tails. This structure allows PGPR to
provide a strong steric barrier around emulsion droplets, thereby preventing flocculation and
decreasing the likelihood of coalescence. Dedinaite and Campbell (2000) measured the steric
repulsion between emulsifier-coated hydrophilic mica surfaces in triolein and showed that PGPR
was more efficient at providing a strongly repulsive barrier than lecithin. It is possible that
droplets formed at the membrane surface in this study detached with similar droplet diameters,
but then PGPR-stabilized emulsions were able to prevent droplet coalescence through steric
stabilization.
The amount of PGPR shown to produce stable emulsions in this study is lower than that
reported in previous work. Benichou, Aserin and Garti (2001) investigated the stability of PGPR-
stabilized water-in-oil emulsions and found that stable emulsions could only be produced at high
emulsifier concentrations ( 10%). Knoth, Scherze and Muschiolik (2005a) also found that at
least 4% PGPR was needed for stable emulsions. These concentrations are greater than those
determined to produce stable emulsions in this study (1%), however this can be attributed to the
sizes of the droplets produced. Both Benichou, Aserin and Garti (2001) and Knoth, Scherze and
Muschiolik (2005a) studied droplets less than 10 μm in diameter while the droplets in this study
averaged 40 μm in diameter (at 1% PGPR). The amount of PGPR per m2 of droplet surface area
in these two studies was approximately three times less than that in the present work.
Blend-stabilized emulsions consisted of larger droplets with greater sigma values and
were less stable than PGPR- or lecithin-stabilized emulsions (Figures 3.6 and 3.8). It should be
noted that chunks of lecithin were apparent when the continuous phase of blend-stabilized
emulsions was initially produced. Continued stirring was necessary to dissolve the emulsifiers,
which eventually went into solution, as determined visually. In the case of PGPR or lecithin
alone, only moderate stirring was needed. This suggests that PGPR and lecithin interact in some
way in solution that may modify their individual abilities to stabilize emulsion droplets when
present together. Dedinaite and Campbell (2000) observed similar turbid behavior in anhydrous
mixtures of phospholipid and PGPR in triolein. The workers also observed the interaction
between mica plates in the presence of these emulsifiers and interpret these findings as PGPR

77
adsorbing onto phospholipid aggregates (Dedinaite and Campbell, 2000). The interaction of
PGPR and lecithin, particularly in the bulk continuous phase, may mean that less emulsifier is
available to stabilize emulsion droplets.
3.3.4 Effect of Membranes on Emulsion Formation
The influence of changing the membrane characteristics on droplet size and distribution
of emulsions was investigated by producing and testing 2% PGPR-stabilized emulsions made at
standard pump conditions (Figure 3.11). The properties of the four membranes used are
summarized in Table 3.1 and the flow rate through one pore of each membrane is summarized in
Table 3.2.
Membrane IV produced emulsions with larger diameters than membranes I and II but
similar to membrane III. The droplets produced by membranes I, II and III were not statistically
different from one another. Various other studies and existing theory suggest that pore size
should be proportional to droplet size at set operating conditions (Equation 1.5; Charcosset,
Limayem and Fessi, 2004; De Luca et al., 2004; Gijsbertsen-Abrahamse, van der Padt and Boom,
2004; Charcosset, 2009). However membrane I had larger pore size than II and III yet produced
similarly-sized droplets.
One hypothesis for this discrepancy is that because the flow rate of the dispersed phase
through the pores of membranes I-III was similar, the membranes were able to produce similar
sized droplets before detachment from the membrane (Table 3.2). An alternative hypothesis is
that the membranes with smaller pores initially produced smaller droplets, however the amount of
emulsifier present was not sufficient to stabilize these droplets. The smaller droplets coalesced
either close to the membrane or during the circulation of the continuous phase, resulting in
stabilized droplets approximately the same diameter as those produced by membrane I. In a study
on vegetable oil-in-milk emulsions, Joscelyne and Tragardh (1999) also found that there was no
dependence of droplet size on membrane pore size at a 2% emulsifier concentration.
It is hard to directly compare the size of the pores in membrane IV with the others as
although the area of each pore was smaller (314 μm2 versus 18000 and 3360 μm
2 for membranes
I and II/III respectively), they were circular rather than slotted. Kobayashi et al. (2002) found

78
that circular pores produced much larger soybean oil-in-water droplets than oblong pores. This is
consisted with the data which shows that the average droplet diameter of emulsions produced by
membrane IV was significantly larger than the average droplet diameters of emulsions produced
by membranes I or II. Again, it is possible that membrane IV produced small droplets initially,
but the concentration of emulsifier was not sufficient to stabilize the small droplets which
coalesced to a larger droplet size prior to measurement.

79
A
B
Figure 3.11. Average initial A) droplet diameter and B) sigma value of 30% w/o emulsions
produced by membranes I-IV with 2% PGPR in soybean oil continuous phase. Analyzed by pfg
NMR at 25 °C. Error bars indicate standard deviation and letters indicate significant difference at
p = 0.05.

80
3.3.5 Effect of Altered Flow Rates on Emulsion Formation
The influence of continuous phase flow rate and dispersed phase flow rate were
investigated by changing the respective pump speeds. Decreasing the continuous phase flow rate
from 95.3 g/sec to 64.2 g/sec significantly increased both the droplet diameter and the sigma
value (Figure 3.12A and B). The continuous phase velocity is a main contributor to the shear
stress at the membrane surface which causes droplets to detach (Equation 1.2). Various studies
have shown that increasing the continuous phase velocity or subsequent shear stress decreases the
droplet diameter; however this work was in studies of oil-in-water emulsions (Katoh et al., 1996;
Joscelyne and Tragardh, 1999).
Increasing the dispersed phase flow rate from 0.6 g/sec to 1.1 g/sec also significantly
increased the droplet diameter, however it did not significantly alter the sigma value (Figure
3.12A and B). Again, this is consistent with the literature which showed that when the dispersed
phase flow rate is increased the droplets increase more in volume and therefore size prior to
detachment (Peng and Williams, 1998). While dispersed phase flow rate is not directly involved
in the calculation of droplet diameter, it is possible that it influences the dynamic interfacial
tension of the droplets (Equations 1.2-1.5). It is more difficult for surfactant to stabilize the
rapidly expanding interface of quickly growing droplets and therefore these droplets would have
higher dynamic interfacial tension. Additionally, increased dispersed phase flow rate increases
the likelihood of coalescence at the membrane which results in larger droplet diameters
(Charcosset, Limayem and Fessi, 2004).

81
A
B
Figure 3.12. Average initial A) droplet diameter and B) sigma value of 30% w/o emulsions
produced at different operational conditions with 2% PGPR in soybean oil continuous phase.
Analyzed by pfg NMR at 25 °C. Error bars indicate standard deviation and letters indicate
significant difference at p = 0.05.

82
3.3.6 Effect of Gelled Dispersed Phase on Emulsion Formation
The influence of a gelling agent on emulsion characteristics was examined by making
emulsions with and without carrageenan in the dispersed phase. The emulsions were stabilized
with 2% lecithin as these were previously shown to be unstable. An unstable emulsion was used
because I hypothesized that the addition of carrageenan to the dispersed phase would cause
emulsion droplets to gel upon cooling, therefore preventing coalescence and increasing the
stability. Emulsions were made under heated conditions so that the dispersed phase would not gel
until after emulsification. The control emulsions were produced under heated conditions as well
to eliminate confounding variables. Preliminary investigation showed that a 2% solution of
carrageenan in water produced a solid gel when cooled from 70 to 25 °C so this concentration
was used in the dispersed phase.
The control emulsion sedimented extremely rapidly and the sediment appeared highly
aggregated, similar to previous observations of lecithin-stabilized emulsions. The sediment was
re-suspended by inverting test tube before NMR sampling. The emulsion prepared with
carrageenan added to the dispersed phase sedimented equally as rapidly, however upon cooling,
large aggregates of solidified droplets had formed making re-suspension difficult. Optical
microscope images of these two emulsions show marked differences. The control emulsion
(Figure 3.13A) consisted of many round and oblong droplets that were slightly flocculated, but
reasonable well dispersed. Larger droplets are seen in these emulsions compared to the lecithin-
stabilized emulsions produced earlier at room temperature conditions (Figure 3.5B). This is
likely due to the decreased viscosity of the continuous phase due to increased temperature. This
decrease in viscosity also caused faster sedimentation of the droplets which were then able to
coalesce into the larger droplets because of the increased droplet density in the bottom of the test
tube.
The emulsions with carrageenan (Figure 3.13B) showed few single droplets, with the
majority of the dispersed phase coalesced into large gelled chunks. Air bubbles were also
noticeable, trapped within the gel matrix.

83
A
B
Figure 3.13. Optical microscope image after cooling of lecithin-stabilized emulsion A) without
and B) with 2% carrageenan in dispersed aqueous phase produced by standard pump settings and
under heated conditions. Scale bar 50 μm.
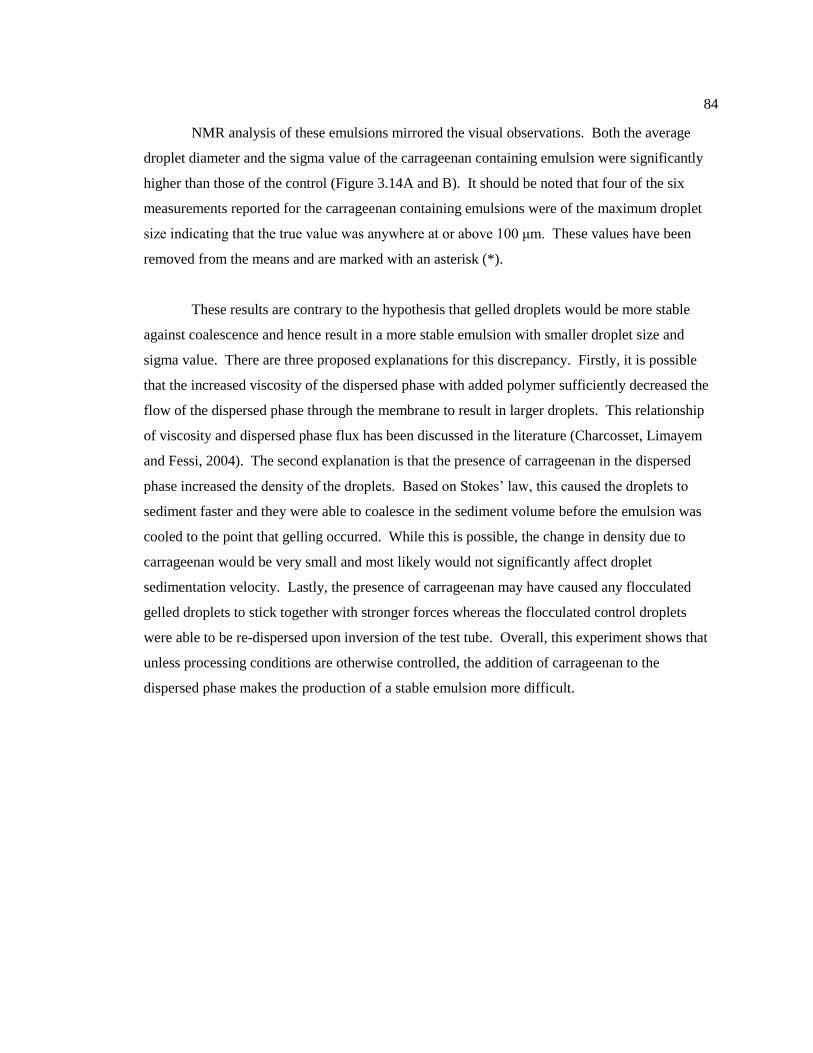
84
NMR analysis of these emulsions mirrored the visual observations. Both the average
droplet diameter and the sigma value of the carrageenan containing emulsion were significantly
higher than those of the control (Figure 3.14A and B). It should be noted that four of the six
measurements reported for the carrageenan containing emulsions were of the maximum droplet
size indicating that the true value was anywhere at or above 100 μm. These values have been
removed from the means and are marked with an asterisk (*).
These results are contrary to the hypothesis that gelled droplets would be more stable
against coalescence and hence result in a more stable emulsion with smaller droplet size and
sigma value. There are three proposed explanations for this discrepancy. Firstly, it is possible
that the increased viscosity of the dispersed phase with added polymer sufficiently decreased the
flow of the dispersed phase through the membrane to result in larger droplets. This relationship
of viscosity and dispersed phase flux has been discussed in the literature (Charcosset, Limayem
and Fessi, 2004). The second explanation is that the presence of carrageenan in the dispersed
phase increased the density of the droplets. Based on Stokes’ law, this caused the droplets to
sediment faster and they were able to coalesce in the sediment volume before the emulsion was
cooled to the point that gelling occurred. While this is possible, the change in density due to
carrageenan would be very small and most likely would not significantly affect droplet
sedimentation velocity. Lastly, the presence of carrageenan may have caused any flocculated
gelled droplets to stick together with stronger forces whereas the flocculated control droplets
were able to be re-dispersed upon inversion of the test tube. Overall, this experiment shows that
unless processing conditions are otherwise controlled, the addition of carrageenan to the
dispersed phase makes the production of a stable emulsion more difficult.

85
A
B
Figure 3.14. Average initial A) droplet diameter and B) sigma value of 30% w/o emulsions with
and without carrageenan in dispersed phase. Control – 2% lecithin in continuous phase, produced
under hot conditions; Carrageenan – 2% lecithin in continuous phase, 2% carrageenan in
dispersed phase, produced under hot conditions. Samples were cooled to 25 C in freezer at – 22
°C. Analyzed by pfg NMR at 25 °C. Error bars indicate standard deviation and letters indicate
significant difference at p = 0.05. Asterisks indicate that measurements of 100 μm were removed
from the calculation of the mean.

86
3.4. Conclusions
The aim of this study was to examine the effect of changing ingredients and processing
parameters on water-in-oil emulsions produced by a cross flow membrane emulsification system.
Droplet size and distribution of emulsions consisting of 30% water in soybean oil were analyzed
via NMR to provide a measure of initial emulsion formation and stability. In general, it was
shown that increasing concentration of emulsifier decreased average droplet diameter and the
sigma value (a measure of the width of the distribution). PGPR-stabilized emulsions resulted in
the smallest droplets of the three emulsifier systems studied and these droplets did not
significantly increase in size over time at concentrations ranging from 1 to 4%. On the other hand,
initial measurements of emulsions stabilized by lecithin or a 50:50 PGPR:lecithin blend showed
larger mean droplet sizes. Emulsions stabilized by 2% lecithin doubled in droplet diameter over 6
hours before stabilizing at this value and emulsions stabilized by a 2% blend destabilized beyond
measurement after 3 hours.
Membrane pore size did not have a significant effect on the droplet diameter and sigma
value except between membranes I and IV, however, differences in membrane length and the
flow rates through the pores may have resulted in confounding variables. The circular pores of
membrane IV resulted in larger droplets that were significantly different from those of
membranes I, however no conclusion can be drawn about the effect of pore size as other variables
are present. The only conclusion to be drawn from the work with different membranes was that
changing the membrane can change the droplet size and distribution of the resulting emulsion.
To accurately determine the effect of pore shape and size all other variables need to be kept
constant.
Using a stable PGPR-stabilized emulsion, the droplet size and sigma value were shown to
increase by either decreasing the continuous phase flow rate or by increasing the dispersed phase
flow rate.
The addition of a gelling agent, κ-carrageenan, to the dispersed phase resulted in
significantly larger droplet sizes and sigma values demonstrating that it is more difficult to
produce a stable emulsion under these conditions.

87
Overall, numerous conditions for producing both stable and unstable water-in-oil
emulsions with a cross flow membrane emulsification technique were described giving some
flexibility in the implementation of this type of system in oil continuous food production.

88
Chapter 4
EFFECT OF MODE OF WATER ADDITION ON THE INTERACTIONS
BETWEEN SUGAR PARTICLES DISPERSED IN LIPID
4.1. Introduction
Chocolate is a food enjoyed by many worldwide but its consumption is lower in warm,
tropical regions and during warmer seasons in otherwise cool countries (Ogunwolu and Jayeola,
2006). This is due to softening of chocolate at higher temperatures leading to loss of snap and
causing the product to stick to fingers and the wrapper. Companies and inventors have developed
many different formulations for heat resistant chocolate products (Kempf and Downey, 1956;
O’Rourke, 1959; Schubiger and Rostagno, 1965; Jeffery, Glynn and Khan 1977; Giddey and
Dove, 1984, 1991; Kealey and Quan, 1992; Kincs, 1992; Takemori, Tsurumi and Takagi, 1993;
Beckett, 1995; Alander, Warnheim and Luhti, 1996; Mandralis and Weitzenecker, 1996; Jeyarani
and Reddy, 1999; Traitler, Windhab and Wolf, 2000; Aaseng, 2005; Best et al., 2005; Davila and
Finkel, 2005; D’Antonio, 2006; Ogunwolu and Jayeola, 2006; Simburger, 2009).
Proposed methods for making heat resistant chocolate are based on three functional
mechanisms; addition of higher melting fats, increasing the viscosity of the continuous phase and
the development of a sugar skeleton. The last named of these is perhaps the most promising
method, is widely used in the patent literature and will be the focus of this work (Kempf and
Downey, 1956; O’Rourke, 1959; Schubiger and Rostagno, 1965; Jeffery, Glynn and Khan 1977;
Giddey and Dove, 1984, 1991; Kealey and Quan, 1992; Kincs, 1992; Takemori, Tsurumi and
Takagi, 1993; Beckett, 1995; Alander, Warnheim and Luhti, 1996; Mandralis and Weitzenecker,
1996; Traitler, Windhab and Wolf, 2000; Best et al., 2005; Davila and Finkel, 2005; Simburger,
2009).
The development of an internal sugar skeleton is accomplished through the addition of a
small amount of water in some form to the system. Adding water results in increased adhesion
89
between sugar particles and the development of a network through the formation of water bridges
due to capillary condensation. Water bridging has previously been demonstrated between
particles in air (Moreyra and Peleg, 1981; Scoville and Peleg, 1981; Billings, Bronlund and
Paterson, 2005) as well as particles in oil dispersions (Johansson and Bergenstahl 1992b,c;
Claesson et al., 1997; Dedinaite et al., 1997; Dedinaite et al., 1998; Dedinaite and Campbell,
2000).
When liquid water is added directly to a chocolate product, it reacts immediately with the
sugar particles causing the product to seize up quickly with a drastic increase in viscosity and
results in a product with reduced snap (Norton et al., 2009). For these reasons, water that is
added to chocolate in order to increase heat resistance is typically added in a controlled manner
such as amorphous sugar or polyols (O’Rourke, 1959; Schubiger and Rostagno, 1965; Kincs,
1992; Beckett, 1995; Mandralis and Weitzenecker, 1996; Davila and Finkel, 2005), foams
(Giddey and Dove, 1991) or water-in-oil emulsions/microemulsions (Schubiger and Rostagno,
1965; Jeffery, Glynn and Khan 1977; Giddey and Dove, 1984, 1991; Kealey and Quan, 1992;
Takemori, Tsurumi and Takagi, 1993; Alander, Warnheim and Luhti, 1996; Traitler, Windhab
and Wolf, 2000; Best et al., 2005; Simburger, 2009). The water must be in small amounts and in
a stable enough form to allow complete mixing before reaction with the sugar particles. This
would allow for the development of an even and comprehensive sugar skeleton. While some
success has come from the methods stated previously, most of the workers still note drastic
viscosity increases and the formation of large agglomerates which negatively impact the sensory
attributes. Most methods also require additional equipment which is hard to integrate into
existing chocolate production lines or changes to processing conditions. While water-in-oil
emulsions have been shown to be a good form of controlled water addition to chocolate, further
investigation must be done into their formation, stability and interactions with chocolate
ingredients.
There is no standard, accepted test for melt resistance in chocolate (Dicolla, 2009).
Desired characteristics of heat resistance chocolate include shape retention at elevated
temperatures, not being soft, not being sticky to the touch or to the wrapper, not having increased
likelihood of fat bloom and having no significant sensory differences (Kempf and Downey, 1956;
Schubiger and Rostagno, 1965; Jeffery, Glynn and Khan 1977; Giddey and Dove, 1984, 1991;
Kealey and Quan, 1992; Kincs, 1992; Takemori, Tsurumi and Takagi, 1993; Beckett, 1995;
90
Alander, Warnheim and Luhti, 1996; Mandralis and Weitzenecker, 1996; Best et al., 2005; Davila
and Finkel, 2005; Simburger, 2009). Inventors of heat resistant products require shape retention
at temperatures range from 35 to 65.55 °C in order to call their products heat resistant (Kempf
and Downey, 1956; Schubiger and Rostagno, 1965; Jeffery, Glynn and Khan, 1977; Kincs, 1993;
Takemori, Tsurumi and Takagi, 1993; Beckett, 1995; Alander, Warnheim and Luhti, 1996; Best
et al., 2005; Davila and Finkel, 2005; Simburger, 2009). Measurement techniques used by these
workers include observing behavior after heating in an oven, penetration testing, melting point
measurements, viscosity measurements and sensory evaluation techniques, however there is no
standard method used by all.
A technique described by Best et al. (2005) involves the measurement of shape retention
upon heating. The width of chocolate bars was measured at ten evenly spaced points along their
length. The bars were then placed into an oven at 40 °C for 1 hour after which they were dropped
18 inches onto a solid, flat laboratory bench. They were allowed to cool and the width was
remeasured at the ten points. Changes in the measurements were used to calculate a parameter
related to shape change. Another test performed on heat resistant chocolate is a method described
by Schubiger and Rostagno (1965) used to reveal any sugar skeleton that may have developed
within the sample. This procedure involves immersion in ether which removes the fat from a
chocolate product. However these workers do not describe any quantification steps for the
residual material.
To the best of our knowledge, no heat resistant chocolate products have been proposed
using water-in-oil emulsions manufactured by cross flow membrane emulsification. Earlier I
showed that emulsions with controlled droplet sizes and distributions can be produced by this
method using the common chocolate emulsifiers soy lecithin and polyglycerol polyricinoleate
(PGPR). The control, reproducibility, low operational cost and potentially feasible integration
into existing chocolate production lines make this a promising method for the controlled addition
of water to chocolate and the subsequent development of heat resistance.
The goal of the following experiment was twofold. The first was to investigate the
interaction of sugar-in-oil dispersions and water-in-oil emulsions, particularly those produced by
cross flow membrane emulsification. Microscopy was used to visualize the interactions and the
effect of stable (2% PGPR stabilized) and unstable (2% lecithin stabilized) water-in-oil emulsions

91
on a chocolate model system was compared to a control of unemulsified water. The second goal
was to develop and use quantitative techniques to demonstrate any resultant melt resistance.
Real chocolate contains sugar and cocoa butter and can also contain cocoa solids non-fat and milk
solids depending upon the type of chocolate. Rather than work directly with real chocolate, I
used a model system of sugar dispersed in a non-polymorphic confectionery coating fat (CCF),
which will be referred to hereafter as model chocolate. This was done for two reasons. Since it
has been shown that the behavior of chocolate dispersions in the presence of water is controlled
largely by the sugar rather than the cocoa particles, I used only sugar particles in my model
system (Ziegler, Garbolino and Coupland, 2003). Additionally, a confectionery coating fat was
used because while it has the same melting properties as cocoa butter, it does not crystallize into
different polymorphic forms so there was no need for tempering.
I hypothesize that the water of water-in-oil emulsions forms water bridges between sugar
particles as a result of capillary condensation, thus creating a sugar skeleton within the model
chocolate and providing heat resistance. This would be seen when either PGPR or lecithin
stabilized emulsions were added to the model chocolate system. I also hypothesize that the
addition of a more stable emulsion (PGPR stabilized) would result in increased heat resistance
compared to addition of an unstable emulsion (lecithin stabilized) or unemulsified water because
it would be better able to disperse throughout the molten model chocolate before reacting with the
sugar, leading to the formation of a more comprehensive skeleton.
4.2 Materials and Methods
4.2.1 Materials
Soybean oil (100% pure, food grade) was obtained from a local supercenter and used
without further purification. Grindsted® PGPR and Carrageenan CL220 were donated by
Danisco (Brabrand, Denmark) and Yelkin® TS soy lecithin was donated by ADM (Decatur, IL).
The phospholipid composition of the lecithin (acetone-insoluble matter: 62.0%) specified by the
manufacturer was 15% PC, 13% PE, 9% PI and 4% PA. Both emulsifiers were used without
further purification. Deionized water was used in all experiments. Bakers Special fine granulated
sugar was donated by Domino Specialty Ingredients (West Palm Beach, FL) and was used in
confocal microscopy studies. Pure powdered sugar was obtained from a local grocery store for

92
use in chocolate model making. Both sugars were stored in vacuum desiccators until use.
Confectionery coating fat (CCF, palm kernel oil, hydrogenated palm oil and citric acid as a
preservative) was donated by Cargill Dressings, Sauces and Oil (Charlotte, NC). The hexanes
used was ACS Grade supplied by VWR International, LLC (Radnor, PA).
Chocolate model molds were purchased from Kerekes Bakery and Restaurant Equpiment
(BakeDeco.com, Brooklyn, NY). Molds were made of clear polycarbonate plastic and consisted
of 36 cylindrical cavities 3/16 inches in diameter and 1-1/8 inches in height. Polystyrene petri
dishes used in melting work (100 x 15 mm) were from VWR International, LLC (Radnor, PA).
Materials used in hexane immersion studies included Bright Aluminum Screening (New York
Wire, Mt. Wolf, PA), which was purchased from a local hardware store, and 24 gauge beading
wire (Horizon Group USA, Inc., Warren, NJ), which was purchased from a local supercenter.
4.2.2 Methods
4.2.2.1 Emulsions
Optical Microscopy. A lab-scale cross flow membrane emulsification system was
supplied by Micropore Technologies, Inc. (Loughborough, UK) and used to make the emulsions
used in optical microscopy. A 3% solution of PGPR in soybean oil was obtained (11.4 and 368.6
g respectively). Deionized water was injected through a membrane with 40 μm wide slotted
pores (External diameter- 15 μm; Length – 106 μm; Slotted pores – 40 x 450 μm) to result in a
3.85% (w/w) water-in-oil emulsion. The system consisted of a large peristaltic pump to circulate
the continuous phase which was set at 150 rpm (flow rate of 95.3 g/sec)and a small peristaltic
pump for the dispersed phase which was set at 4 (flow rate of 0.6 g/sec).
Confocal Microscopy. A water-in-oil emulsion was prepared by adding water dropwise to
stirred oil. An Erlenmeyer flask was filled with a 3% solution of PGPR in soybean oil (1.425 g
and 46.075 g respectively). A stir bar was added and the solution was stirred without heating.
Deionized water (2.5 g) spiked with fluorescein isothiocyanate (FITC) was dripped into the
stirring solution using a pipet over a period of 1.5 minutes. Once the water was added, the
emulsion was stirred for a further 5 minutes.

93
Model Chocolate Making. The cross flow membrane emulsification system was used to
produce all emulsions for use in model chocolate making. A 2% solution of emulsifier (either
PGPR or lecithin) and soybean oil was obtained (8 g and 392 g respectively). Deionized water
was injected through the same membrane used previously to result in a 30% (w/w) water-in-oil
emulsion. The large and small peristaltic pump settings were also the same as those used
previously.
4.2.2.2 Optical Microscopy
Optical microscopy was performed using an Olympus BX41 microscope (Hitech
Intruments, Inc., Edgemont, PA) equipped with SPOT Advanced Version 4.0.9 imaging software
(Diagnostic Intruments, Inc). Fine granulated sugar crystals were placed on a microscope slide in
a single layer. A drop of soybean oil was added to the sugar and covered with a cover slip. The
slide was placed under the microscope and a drop of emulsion was applied next to the cover slip.
The cover slip was gently agitated six times back and forth and images were captured.
4.2.2.3 Confocal Microscopy
Fluorescence imaging was performed with a Olympus FV1000 Laser Scanning Confocal
Microscope (Olympus America Inc., Melville, NY) equipped with FV10-ASW version 2.1
software. A Blue Argon (488 nm) laser was used and the same procedure was used as for optical
microscopy with the exception of using the fluorescein containing emulsion. All confocal
microscopy was done at the Cytometry Facility at the Huck Institutes of the Life Sciences, Penn
State University. This facility is funded, in part, under a grant with the Pennsylvania Department
of Health using Tobacco Settlement Funds. The Department specifically disclaims responsibility
for any analyses, interpretations or conclusions.
4.2.2.4 Model Chocolate Making
CCF (60 g) was weighed into a 250 mL beaker and placed in a forced convection oven.
Powdered sugar (60 g) was added to the CCF once it reached 70° C. The sample was mixed with
a metal spatula 50 times clockwise followed by 50 times counterclockwise. This was repeated
twice for a total of 200 turns and the beaker was returned to the oven. Once the sample reached

94
68° C, 2 g of an additional liquid was added. This additional liquid was either A) 2 g soybean oil,
B) 0.6 g of water and 1.4 g soybean oil, C) 2 g of a 30% water-in-oil emulsion stabilized with 2%
PGPR in the continuous phase or D) 2 g of a 30% water-in-oil emulsion stabilized with 2%
lecithin in the continuous phase. In all cases where water was added, the amount used
corresponded to 1% of the mass of sugar. The emulsions used were produced by the cross flow
membrane emulsification system as described in Section 4.3.2.1. The mixture was stirred 50
times clockwise and 50 times counterclockwise and immediately poured into the 10 cylinders of a
chocolate mold. The mold was tapped gently against the table to remove air bubbles. Samples
were allowed to harden at room temperature for 3 hours. Molds were then placed in a freezer at -
22 °C for 20 minutes and then tapped upside-down on a counter until they demolded. Samples
were allowed to equilibrate to room temperature for 2 hours before testing. All samples were
prepared in triplicate.
4.2.2.5 Hexane Immersion
Fat was extracted from the molded samples by immersing them in hexane. The hexane
dissolved the fat leaving the sugar from the samples. Small pieces of sugar would fall through the
supporting mesh but cross-linked sugar was retained and could be weighed.
Squares of aluminum screening were cut to approximately 5.75 x 5.75 cm to create a
stage for the chocolate. Approximately 1 cm of each corner was folded upwards. Beading wire
was attached to each corner of the stage. A sample stage in an empty beaker is shown in Figure
4.1.

95
Figure 4.1. Sample empty wire mesh stage for hexane immersion in an empty beaker.
The mass of the stage and wires was recorded. A sample was placed in the center of the
stage and the total mass was recorded. A 400 mL beaker was placed in a fume hood and filled to
375 mL with hexane. The stage containing the model chocolate was lowered slowly into the
hexane until the bottom of the stage was at the 75 mL level and the wire was bent over the top of
the beaker to secure the stage. The beaker was covered and allowed to sit in the fume hood for 72
hours and room temperature. After this period, the stage was gently lifted out of the hexane,
tapped three times against the side of the beaker and placed in an empty beaker to dry for 24
hours. The final mass of the sample was then recorded. Three samples from each model
chocolate batch were tested for a total of 9 samples per added liquid type.
4.2.2.6 Meltability
Meltability was determined using a test based on Arnott and modified Schrieber tests
traditionally used with cheeses (Arnott, Morris and Combs, 1957; Muthukumarappan, Wang and
Gunasekaran, 1999). In this method the changes in dimensions of a sample of molded sample
was measured before and after heating to a temperature such that the solid fat melted then cooled
back to room temperature.

96
A sample was placed in the middle of an open petri dish and a digital caliper was used to
measure the height at four points equally spaced around the perimeter. The height of the petri
dish was also recorded. Three dishes of the each model chocolate batch were placed in the center
of a forced convection oven set at 50 °C for 20 minutes. Dishes were removed from the oven and
allowed to cool at room temperature for 24 hours. The height of the sample was again measured
at four evenly spaced points around the perimeter.
Top view photographs of samples next to a ruler were taken and the spread of each
sample was determined via image analysis in Adobe Photoshop CS4. The measurement scale for
each photograph was set using the photographed ruler. The Quick Selection Tool was used to
highlight the sample spread area and the measurement of the area was recorded.
4.2.2.7 Statistical Analysis
Statistical analysis was performed using GraphPad Prism 5 (GraphPad Software, Inc.; La
Jolla, CA) for analysis of variance (ANOVA) and Tukey’s post-test with significance at α = 0.05.
4.3 Results and Discussion
4.3.1 Interaction of Sugar Particles in Oil in the Presence of Water
The interactions of water-in-oil emulsions with sugar particles dispersed in oil were
visualized using both optical and confocal microscopy. Figure 4.2A shows an optical microscope
image of sugar particles in soybean oil and Figure 4.2B shows similar sugar particles in soybean
oil in the presence of an emulsion that was produced by cross flow membrane emulsification.
The concave shape indicative of capillary condensation can be seen in the corners between the
two sugar particles in Figure 4.2B causing the particles to stick together. This was not observed
in images without the presence of water.

97
Figure 4.2. A) Optical microscope image of fine granulated sugar crystals in soybean oil and B)
in the presence of a 3.85% w/o emulsion stabilized with 3% PGPR and produced by cross flow
membrane emulsification. Scale bars equal 50 μm.

98
Fluorescence microscopy was used to confirm that the concave region seen in Figure
4.2B was in fact due to moisture adsorption, fluorescence microscopy was utilized. A 5% water-
in-oil emulsion with 3% PGPR was prepared using an aqueous phase spiked with fluorescein.
Cross flow membrane emulsification was not used in this case as the volumes required by this
method were too large. Instead, the fluorescein-spiked emulsion was produced by adding water
dropwise to stirred oil.
In the fluorescence microscopy images, green fluorescing water was seen in water
droplets, surrounding the sugar particles and particularly between adjacent particles (Figure 4.3).
This image supports a model of the water droplets destabilizing in the presence of sugar crystals.
The de-emulsified water adsorbs at the sugar surfaces where it accumulates in capillaries between
crystals to minimize its surface curvature and therefore provides an attractive force between the
crystals. Simultaneously some sugar can be expected to dissolve in the water (not visualized in
this work) although this will only have a secondary affect on the strength of the bond formed
provided the amount of water remains relatively low. In the chocolate model systems described
in this study, the amount of water added to the system was 1% with respect to the mass of the
sugar. At this level, a relatively small amount of the sugar, approximately 0.8%, is expected to
dissolve. This will hardly change the crystal size and therefore not significantly affect the
strength of the capillary force between crystals via changes in particle size (Equation 1.7).
Dissolution of sucrose, however, does result in a modest increase in surface tension (~2% for
100% sucrose at 20 °C, Docoslis, Giese and van Oss, 2000) which is another factor in the
calculation of capillary force. The result would be a proportionally increased capillary force.
Additionally, it is possible that the saturated sugar syrup between crystals increases their cohesion
because of the increased viscosity of the liquid. Finally, if the system is dried, the sugar syrup
will either form a glass or recrystallize, physically linking the crystals into a sintered block.
These “solid bridges” formed between particles are up to three times stronger than the liquid
bridges and provide yet another force to hold the particles together (Billings, Bronlund and
Paterson, 2005). Overall, these observations and the resultant forces provide a mechanism for
sugar skeleton formation when water-in-oil emulsions are added to a chocolate model system.

99
Figure 4.3. Confocal microscope image of fine granulated sugar in soybean oil in the presence of
a 5% w/o emulsion stabilized with 3% PGPR in the continuous oil phase. Dispersed water phase
was spiked with fluorescein and appears green in the image. Scale bar equals 200 μm.
4.3.2 Chocolate Model Systems in the Presence of Water
Model chocolate was successfully made using the procedure described in Section 4.2.2.4.
Water was added to 50% powdered sugar in CCF mixtures in different forms (i.e., directly as
liquid water, via a stable emulsion or via an unstable emulsion) and the effect on sugar skeleton
formation was determined. When water in any form was added to the molten model chocolate,
the samples became more viscous and harder to pour into molds. Some small sugar aggregates

100
were apparent and more air bubbles developed that needed to be removed upon molding. This
observation is consistent with sugar aggregates forming very quickly after water addition. After
demolding however, the samples were visually indistinguishable. Viscosity characterization of a
similar system is shown in Appendix A.
4.3.2.1 Hexane Immersion
Model chocolate samples were subjected to fat extraction via hexane immersion in order
to examine the remaining sugar skeleton. The proportion of the residual mass that did not pass
through a wire mesh was used as a measure of skeleton formation. Figure 4.4 shows the average
percent mass remaining from the four model chocolate types produced in this study. If no sugar
fell through the mesh, the percent remaining would equal 49.2%, the total percent of sugar in the
sample. This is indicated in the figure by the dotted line.
Figure 4.4. Percent mass of model chocolate remaining after hexane immersion for 3 days.
Sample type indicates the type of liquid added to the sample; Oil – 2g soybean oil; Water – 0.6 g
water, 1.4 g soybean oil; PGPR – 2g of 30% water-in-soybean oil emulsion stabilized with 2%
PGPR; Lecithin – 2g of 30% water-in-soybean oil emulsion stabilized with 2% lecithin.
Emulsions produced via cross flow membrane emulsification. Error bars indicate standard
deviation and letters indicate significant difference at p = 0.05. Dotted line indicates the percent
sugar in the original sample.
b b b
a

101
The results show no statistically significant difference in percent mass remaining between
sample made with the addition of water in any form, either directly or as an emulsion. The
percent mass remaining of these samples ranged from 44 to 47% indicating almost all of the sugar
was bound in a continuous skeleton and did not pass through the mesh. On the other hand, the
model chocolate with only oil added showed significant loss of mass following solvent extraction
with an average of only 0.36% sugar remaining. This average was significantly different (α =
0.05) from the other samples.
Examples of the model chocolate samples after hexane immersion are shown in Figure
4.5. Visually, the sugar skeletons from the three model chocolate types with water added in some
form appeared very similar. The sugar skeletons had heights and widths similar to those of the
sample before fat extraction but appeared pock-marked where sugar aggregates had fallen from
the surface. The model chocolate with only oil added appeared drastically different with only a
few small sugar aggregates present on the mesh that were too large to fall through.
Figure 4.5. Photograph of model chocolate samples after fat extraction via hexane immersion.
Samples made with different liquid added A) 2g soybean oil; B) 0.6 g water, 1.4 g soybean oil; C)
2g of 30% water-in-soybean oil emulsion stabilized with 2% PGPR; or D) 2g of 30% water-in-
soybean oil emulsion stabilized with 2% lecithin. Emulsions produced via cross flow membrane
emulsification.
102
The results of the hexane immersion study indicate that substantial sugar skeletons
formed when water of some type was added to the system. This provides support for possible
heat resistance of these samples, which is investigated further below. I had hypothesized that
water added as an emulsion would result in a larger percent mass remaining when compared to
water added directly. I had also hypothesized that the addition of a stable emulsion (i.e., PGPR-
stabilized) would result in a larger percent mass remaining than the addition of an unstable
emulsion (i.e., lecithin-stabilized). The theory behind these hypotheses was that water added as
an emulsion would be able to disperse throughout the model chocolate better before adsorbing to
sugar particles resulting in a more uniform skeleton and that the difference would be more
apparent for a more stable emulsion. These hypotheses were not supported by the data in this
study.
One possible reason for this discrepancy is that the method of incorporation was too
vigorous. The added liquid was stirred into the model chocolate by hand 50 times clockwise and
50 times counterclockwise. It is possible that this allowed for an even incorporation of the
directly added water or caused significant breakdown of the emulsions.
A second possible reason is that the emulsions, regardless of stability on their own,
became highly unstable when added to such a highly concentrated sugar dispersion. If this were
the case, the same results would be seen even if the emulsions were incorporated in a different
manner. Thus to elucidate the cause of the similar sugar skeleton results for the samples with
added water different methods of incorporation should be studied.
Finally, the empirical test selected may not have been sufficiently sensitive to the
differences between water-containing samples. A slightly more aggressive treatment of the fat-
free sugar skeletons might have disrupted weaker structures and revealed differences not seen in
the method used. It should also be stressed that the presence of a sugar skeleton that is not in
itself proof that the skeleton is able to confer useful heat resistance.
4.3.2.2 Meltability
To test heat resistance, model chocolate samples were placed in an oven at 50 °C for 20
minutes and the percent height difference and area of spread were determined. The theory of this

103
method is that the sugar skeleton of a heat resistant chocolate produced by the addition of water
provides solid-like structure to the chocolate that prevents any change in shape even when the fat
has melted. Therefore, a model chocolate with increased heat resistance should display a small
percent height difference and a small spread area.
The images in Figure 4.6 and 4.7 show differences in both height and spread area after
heat exposure respectively for representatives of each type of model chocolate. The control
samples with only oil added melted down to a small round, smooth mound with a spread that was
typically to one side of the dish. This indicates that the sample fell sideways during heating
instead of collapsing down on itself. The samples with water added directly also appeared to
have fallen to one side. These samples were not smooth like the oil only samples but instead
appeared clumpy with protruding chunks of sugar. The samples with emulsions added did not
fall sideways. They appeared similar to unheated samples with some sagging evident at the base
of most samples where the weight of the sample caused some expansion.
Figure 4.6. Photograph of side view of model chocolate samples after heating in oven at
50 °C for 20 minutes. Samples made with different liquid added A) 2g soybean oil; B) 0.6 g
water, 1.4 g soybean oil; C) 2g of 30% water-in-soybean oil emulsion stabilized with 2% PGPR;
or D) 2g of 30% water-in-soybean oil emulsion stabilized with 2% lecithin. Emulsions produced
via cross flow membrane emulsification.

104
Figure 4.7. Photograph of top view of model chocolate samples after heating in oven at
50 °C for 20 minutes. Samples made with different liquid added A) 2g soybean oil; B) 0.6 g
water, 1.4 g soybean oil; C) 2g of 30% water-in-soybean oil emulsion stabilized with 2% PGPR;
or D) 2g of 30% water-in-soybean oil emulsion stabilized with 2% lecithin. Emulsions produced
via cross flow membrane emulsification.
The average percent height difference and average spread area for the four model
chocolate types are shown in Figure 4.8 and Figure 4.9 respectively. The samples with only oil
added resulted in the largest percent height difference than the other three types of chocolate at
approximately 60%, a value significantly different from all others. The directly added water
sample had the second highest percent difference in height of approximately 40%. This value
was significantly different from the samples with water added via emulsion. The samples with
added emulsion stabilized by PGPR and lecithin resulted in percent height differences of 11.8 and
11.5% respectively, values which were not significantly different from each other.

105
Figure 4.8. Percent height difference of samples after heating in oven at 50 °C for 20
minutes. Sample type indicates the type of liquid added to the sample; Oil – 2g soybean oil;
Water – 0.6 g water, 1.4 g soybean oil; PGPR – 2g of 30% water-in-soybean oil emulsion
stabilized with 2% PGPR; Lecithin – 2g of 30% water-in-soybean oil emulsion stabilized with
2% lecithin. Emulsions produced via cross flow membrane emulsification. Error bars indicate
standard deviation and letters indicate significant difference at p = 0.05.
In terms of the area of the spread seen in Figure 4.7, the oil only sample had the largest
value at approximately 26 cm2. Again this value was significantly different from all other
samples. The direct water and lecithin-stabilized emulsion samples had the second and third
highest spread areas at approximately 15 and 14 cm2 respectively. While these values were
significantly different from that of the PGPR-stabilized emulsion samples, they were not
significantly different from each other. The PGPR-stabilized emulsion samples had the smallest
spread area at approximately 11 cm2.

106
Figure 4.9. Area of sample spread after heating in oven at 50 °C for 20 minutes. . Sample type
indicates the type of liquid added to the sample; Oil – 2g soybean oil; Water – 0.6 g water, 1.4 g
soybean oil; PGPR – 2g of 30% water-in-soybean oil emulsion stabilized with 2% PGPR;
Lecithin – 2g of 30% water-in-soybean oil emulsion stabilized with 2% lecithin. Emulsions
produced via cross flow membrane emulsification. Error bars indicate standard deviation and
letters indicate significant difference at p = 0.05.
In contrast to the hexane immersion work, the melt test displayed significant differences
between samples with water added directly versus samples with water added via an emulsion.
This was seen especially in the height difference of the samples. Even though a similar sugar
skeleton seemed to be formed as seen via hexane immersion (Figures 4.4 and 4.5), the model
chocolate with water added directly did not hold up to heat as well as the model chocolates with
added emulsions. This provides evidence for the production of a more uniform and
comprehensive skeleton when emulsions were used to deliver the water. Evenly distributing the
water through the model chocolate through use of an emulsion may have resulted in a more
complete sugar particle network that was stronger as a result. This increased strength may have
enabled the model chocolates with added emulsion to retain much of their height upon heating
whereas the model chocolates with water added directly sagged and often fell over sideways. The
additional strength was important for height retention because of the increased force on the
skeleton due to the gravitational force of the melted CCF. In comparison, in the hexane
immersion work the CCF was dissolved away from the skeleton and there were no additional

107
gravitational forces. Thus the sugar skeletons of samples with water added directly were able to
maintain structure when the CCF was extracted but not when it was melted.
The type of emulsion used to deliver the water also had an effect on the spread area. The
model chocolate made with a stable PGPR-stabilized emulsion was able to contain the melted fat
better than the model chocolate made with a less stable lecithin-stabilized emulsion, resulting in a
smaller area. In fact, the spread in the samples prepared with lecithin-stabilized emulsion was not
significantly different than the spread in the samples with water added directly. Low spread is
consistent with an effective, extensive and strong sugar particle network. The more stable
emulsion was able to distribute more evenly within the melted model chocolate before reaction
with sugar particles.
For all of these measurements there could be a secondary effect due to the adsorption of
surfactants in the emulsions on the surfaces of sugar crystals. Lecithin has been shown to adsorb
to sugar particles and decrease the adhesive forces between them, resulting in significant
differences in rheology, sedimentation behavior and aggregate size in sugar in oil dispersions
(Johansson and Bergenstahl, 1992a,b,c; Ziegler, Garbolino and Coupland, 2003). Lecithin may
also adsorb to the water covering sugar particles, again decreasing the adhesive forces.
Decreased adhesive forces could result in a weaker sugar skeleton. PGPR on the other hand, was
shown to have little effect on sedimentation behavior or rheology and only significantly affected
aggregate size at concentrations of at least 0.1% (Ziegler, Garbolino and Coupland, 2003). The
concentrations of lecithin investigated by these workers was higher than the concentration of
lecithin in this study so it is therefore unclear whether this low concentration of lecithin had a
significant effect on the formation of a sugar skeleton that contributed to the differences seen in
the spread area of model chocolates with different types of emulsions added.
4.4. Conclusions
The first aim of this study was to examine the effect of water-in-oil emulsions on sugar-
in-oil dispersions, particularly in the context of emulsions made by cross flow membrane
emulsification and a chocolate model system. Images from both optical and fluorescence
microscopy showed that the water from water-in-oil emulsions adsorbs on and between sugar
particles via capillary condensation. This supports the proposed mechanism behind the formation

108
of a sugar skeleton in chocolate with added emulsions. In order for this mechanism to work
effectively it is first necessary for the water to be intimately mixed with the sugar-in-oil
dispersion prior to adsorption. Emulsions are able to facilitate this even distribution of water
throughout a chocolate model system, after which it adsorbs on and between sugar particles
resulting in the formation of water bridges. These water bridges provide the strong adhesive
forces necessary for a sugar skeleton and the development of heat resistance.
An additional aim of this study was to develop quantitative methods to detect and analyze
heat resistance in model chocolate. The first test took an existing method of visualizing the sugar
skeleton of heat resistant chocolate and modified it in order to better measure the
comprehensiveness and quality of the skeleton. This test showed that it could accurately detect
the existence of a sugar edifice, although there was no significant difference in the percent sugar
remaining between model chocolates made with water added directly or as an emulsion. This
was perhaps due to the empirical nature of the test and altering the pore size of the mesh or the
aggressiveness of the shaking technique after removal from hexane could alter the results.
Additionally, the presence of a sugar skeleton was not in itself an indication of the level
of heat resistance. Heat resistance was demonstrated via a melt test. The melt test took aspects of
existing heat resistance testing on chocolate and combined it with tests typically used to test
melting behavior of cheeses. By measuring the height difference and area of spread, the melt test
was able to show the ability of the sugar skeleton to hold up against heat and to contain the
melted fat. This test showed significant differences between model chocolate with water added
directly and model chocolates with water added via an emulsion in terms of height difference. It
also showed significant differences between model chocolates with a stable versus unstable
emulsion added in the area of spread measurement, with samples with a stable emulsion able to
contain more of the melted fat. It should be noted that because model chocolate was used in this
study, these results have limited applicability to the quality of real chocolate. This study also did
not measure chocolate stickiness upon heating which is another attribute of concern in heat
resistant chocolate.
This experiment showed that model chocolate with increased heat resistance can be made
by the addition of water-in-oil emulsions produced by cross flow membrane emulsification. The
model chocolate can be characterized in terms of the sugar skeleton and behavior under heated

109
conditions. While these tests show the increased heat resistance of the products made in this
experiment, this heat resistance cannot be accurately compared to that of other products unless
the same tests are preformed on those products. These test methods do, however, help to provide
a standardized method of testing heat resistance that could be used in the future.

110
Chapter 5
CONCLUSIONS AND RECOMMENDATIONS FOR FUTURE WORK
The overall goal of this work was to determine if water-in-oil emulsions produced via a
lab-scale cross flow membrane emulsification system are suitable for use in the production of
heat resistant model chocolate products. In order to accomplish this goal, 30% water-in-oil
emulsions were produced with different ingredients in the dispersed or continuous phases as well
as under different processing conditions. The droplet size distributions of the resultant emulsions
were examined both initially and over time. The results from this investigation were used to
produce stable (2% PGPR-stabilized) and unstable (2% lecithin-stabilized) emulsions which were
then added to dispersions of sugar crystals in oil which were then cooled to crystallize the fat and
form a model chocolate. Samples prepared in this manner were compared to samples made with
the direct addition of unemulsified water in order to determine the impact of different modes of
water addition on the formation of a sugar skeleton and melt resistant in the product.
Results from the two objectives that were defined relating to this goal as well as their
impacts and outstanding questions are summarized below.
The first objective (Chapter 3):
The first objective of this study was to determine the effects of changing ingredients and
operational parameters on water-in-oil emulsions produced by cross flow membrane
emulsification. Average droplet size and sigma value were shown to decrease in emulsions with
increasing concentrations of the emulsifiers PGPR, lecithin or a 50:50 PGPR:lecithin blend.
PGPR-stabilized emulsions were stable over time with consistent droplet sizes and distributions
for both short and long term measurements. Lecithin-stabilized emulsions doubled in droplet size
over a six hour period and blend-stabilized emulsions were completely unstable within three
hours. Emulsion droplet size and distribution were also significantly affected by the use of
different membranes, different continuous phase flow rates and different dispersed phase flow
rates. The addition of a gelling agent to the dispersed phase prior to emulsification made it more
difficult to produce stable emulsions.

111
The results of this study could be used for industrial application of similar cross flow
emulsification systems. The general trends can be extrapolated to scaled-up systems and can be
used to tailor an emulsion for a specific application. One such application is to chocolate, an oil-
continuous system, and this application will be examined in the discussion of the second goal of
this work. One outstanding question from this part of the work has to do with the addition of a
gelling agent to the dispersed phase. I had hypothesized that this would increase the stability of
emulsions because the gelling agent would protect the droplets from coalescence. While the
opposite behavior was observed in this study, it is possible that the method of emulsion
production or the choice of gelling agent may have influenced this result. It would therefore be of
interest to further examine effects of the addition of a gelling agent to the dispersed phase under
different conditions.
In this study, pfg-NMR was used for the measurement of droplet diameter and sigma (the
standard deviation of the log-normal distribution, i.e., a measure of the width of the distribution).
This technique had many advantages as emulsion samples were able to be measured immediately
after production without any sample preparation or dilution. However, there were a few
negatives associated with using this technique for this project. Firstly, the droplet sizing
application requires 10 to 30 minutes to make accurate measurements. Droplet size may change
significantly during this time period, especially in the case of unstable emulsions. This also made
measurement in duplication difficult, as the second sample was measured up to 30 minutes after
the first. Thus the droplet sizes reported in this work may not be an accurate reflection of the
droplet initially produced from the membrane. Additionally, the maximum droplet size that was
able to be measured by the pfg-NMR was 100 μm. Beyond this point the application cannot
distinguish the effects of restricted diffusion in such large droplets. A few of the emulsions
produced in this study furnished measurements of 100 μm and could therefore not be included in
calculations of the average droplet diameter or sigma value. For these reasons, pfg-NMR may be
better suited for use with stable emulsions consisting of small droplets. It is likely, however, that
the downsides did not significantly affect the overall conclusions in this study.
The second objective (Chapter 4):
The second objective was to investigate the interactions between water-in-oil emulsions
and sugar-in-oil dispersions. Optical and fluorescence microscopy of sugar-in-oil dispersions
with added emulsions showed the formation of water bridges between sugar particles due to

112
capillary condensation, confirming the mechanism leading to formation of a sugar skeleton. In
order to develop a sufficient sugar skeleton for heat resistance it is necessary for the water
droplets to be intimately mixed within the sugar dispersion before reaction with sugar. Water-in-
oil emulsions have the potential for such controlled delivery of water and were therefore added to
a chocolate model system in order to investigate the effect on the formation of a sugar skeleton as
well as determine any resultant heat resistance. A method was developed for making model
chocolate and samples with water added via stable or unstable emulsions were compared to
samples with water added directly and control samples prepared without added water. The
different formulations used in this study were chosen so that the amount of emulsifier (0.0328%)
was well below the values restricted by law (1 to 1.5% total). This means that additional
emulsifier could be added to the molten model chocolate for traditional purposes. The oil added
to the system was also not at a level that should cause problems in traditional chocolate
manufacture, however the use of other fats could be investigated as well.
Two quantitative tests were developed in order to aid in this investigation. The first test
involved immersion in hexane to extract fat from model chocolate samples which were placed on
wire mesh stages. Any sugar not incorporated in the sugar skeleton would fall through the holes
in the mesh. After hexane immersion, all samples with water added showed considerable sugar
skeletons (44 to 47% out of the 49.2% total sucrose in the original sample) with no significant
difference in the weight of the skeletons between treatments whereas the control model chocolate
did not have any skeleton. This procedure is, however, fairly empirical in nature with results
dependent upon the size of the mesh and how vigorously it is shaken upon removal from hexane.
Additionally, the height of the sugar skeleton in the hexane immersion study could not be
accurately measured with this method because the mesh stand was not flat when placed on a table
top. This excluded accurate measurement by a ruler and the skeletons were too delicate to be
measured by calipers. In the future, similar mesh stages could be constructed with the mesh
pulled flat across the opening of a short, open cylinder such as a section of PVC piping. This
would still allow for exposure of hexane to all model chocolate surfaces and the ability for sugar
to fall through the mesh, but would also enable the height of the sample to be accurately recorded.
Regardless, a similar procedure could be instituted as common practice for the testing of other
heat resistant chocolates in which heat resistance is conferred through a sugar skeleton. This
would provide the industry with a method of comparison between products as long as the
aforementioned variables were kept constant.

113
The second test involved heating the model chocolate samples in an oven at 50 °C for 20
minutes. The change in height and the area of spread were determined as measurements of
product deformation. Samples with water added via emulsions did not decrease in height as
much as samples with water added directly or the control samples. The area of spread showed a
difference between samples with stable or unstable emulsions added, with samples with stable
emulsions added able to contain more of the melted fat. This test is also somewhat empirical in
nature in terms of the times and temperatures that were selected. Different times and
temperatures could be investigated to examine the degree of heat resistance or when differences
between products become significant. Similar to the hexane immersion method, this method
could provide a way to compare different heat resistant chocolate products if standard conditions
were chosen. Having such defined tests for these products would be invaluable for product
developers so that the characteristics of different formulations could be fully understood and the
heat resistance of chocolate products could be optimized.
While the different formulations in this study resulted in products with different
characteristics, the method used shows only one way of incorporating emulsions into a model
chocolate system. Other methods of incorporation should be investigated in order to optimize the
ability of emulsions to evenly distribute water to a sugar-in-oil dispersion. Suggested methods
include stirring the emulsion into the model chocolate less vigorously and adding the emulsion in
smaller portions over time. It would also be helpful to investigate the characteristic timescale of
droplet reaction with sugar particles as well as the timescale of mixing. A second approach
would be to make the water droplets less reactive with sugar particles. Approaches to this might
include alternative surfactant systems or, more promisingly, using partially-dried gels as the
dispersed phase rather than free water. Additionally, because only a model system was used in
this study, it would be important to see how the results from this study are affected by the
addition of other ingredients commonly used in chocolate products, particularly cocoa particles
and milk solids. The use of cocoa butter in place of CCF could also alter the results, as a
particular polymorphic form is desired in chocolate products.
The work pertaining to this second goal has important impacts for the chocolate and
confectionery industries. The results show a promising application of water-in-oil emulsions
produced via cross flow membrane emulsification to chocolate products for the development of
114
heat resistance. Such products include solid, molded chocolates as well as chocolate or
confectionery coatings. This would expand the sale of chocolate to warmer regions of the world
and allow for more people to be able to consume chocolate worldwide. It may also be possible to
use this emulsification technique in reduced calorie applications if the aqueous phase is altered
such that it does not react with the sugar particles.
115
REFERENCES
Aaseng, N. (2005). Business Builders in Sweets and Treats. Minneapolis: The Oliver Press, Inc.
Adriaenssens, M. (2010). Impact of Ingredients on Chocolate Flavor. 64th PMCA Production
Conference (pp. 19-27). Bethlehem, PA: PMCA.
Afoakwa, E., Paterson, A., & Fowler, M. (2007). Factors influencing rheological and textural
qualities in chocolate - a review. Trends Food Sci. Tech. , 18, 290-298.
Aguilera, J., & Stanley, D. (1990). Microstructural Principles of Food Processing and
Engineering. Amsterdam: Elsevier.
Alander, J., Warnheim, T., & Luhti, E. (1996). Patent No. 5,486,376. United States of America.
Arnott, D., Morris, H., & Combs, W. (1957). Effect of certain chemical factors on melting quality
of process cheese. J. Dairy Sci , 40, 957-959.
Aserin, A. (2008). Multiple Emulsions: Technology and Applications. Hoboken, NJ: John Wiley
& Sons, Inc.
Awua, P. (2002). The success story of cocoa processing and chocolate manufacture in Ghana.
Essex: David Jamieson & Associates.
Babin, H. (2005). Colloidal Properties of Sugar Particle Dispersions in Food Oils with
Relevance to Chocolate Processing. Doctoral Dissertation, University of Leeds.
Babin, H., Dickinson, E., Chisholm, H., & Beckett, S. (2005). Interactions in dispersions of sugar
particles in food oils: influence of emulsifier. Food Hydrocolloid , 19, 513-420.
Beckett, S. (1995). Patent No. 5,445,843. United States of America.
Beckett, S. (1999). Industrial Chocolate Manufacture and Use (3rd ed.). Oxford: Blackwell
Science.
Beckett, S. (2000). The Science of Chocolate. Cambridge: RSC Paperbacks.
Beckett, S., Hugelshofer, D., Wang, J., & Windhab, E. (2007). Patent No. 7,186,435 B2. United
States of America.
Benichou, A., Aserin, A., & Garti, N. (2001). Polyols, High Pressure, and Refractive Indices
Equalization for Improved Stability of W/O Emulsions for Food Applications. J. Disper. Sci.
Technol. , 22, 269-280.

116
Best, E., Oakenful, D., Maladen-Percy, M., Boch, R., & Kibler, L. (2005). Patent No. US
2005/0118327 A1. United States of America.
Billings, S., Bronlund, J., & Paterson, A. (2006). Effects of capillary condensation on the caking
of bulk sucrose. J. Food Eng. , 77, 887-895.
Blonk, J., & Van Aalst, H. (1993). Confocal scanning light-microscopy in food research. Food
Res. Int. , 26, 297-311.
Buszello, K., & Muller, B. (2000). Emulsions as Drug Delivery Systems. In F. Nielloud, & G.
Marti-Mestres (Eds.), Pharmaceutical Emulsions and Suspensions (pp. 191-228). New York:
Marcel Dekker, Inc.
Butt, H.-J. (2011). Controlling the Flow of Suspensions. Science , 331, 868-869.
Bruker BioSpin. (2011). NMR Systems: Technological leadership in NMR. Retrieved from
http://www.bruker-biospin.com/nmr_systems.html
Bruker Optik GmbH. (2001). The minispec mq Series: Oil/Water Droplet Size Applications.
Reihnstetten, Germany.
Carey, F. (2011). Spectroscopy: Nuclear Magnetic Resonance (NMR) Spectroscopy. Retrieved
from http://www.chem.ucalgary.ca/courses/351/Carey/Ch13/ch13-nmr-1.html
Charcosset, C. (2009). Preparation of emulsions and particles by membrane emulsification for the
food processing industry. J. Food Eng. , 92, 241-249.
Charcosset, C., Limayem, I., & Fessi, H. (2004). The membrane emulsification process - a
review. J. Chem. Technol. Biot. , 79, 209-218.
Chevalley, J. (1994). Chocolate flow properties. In S. Beckett (Ed.), Industrial Chocolate
Manufacture and Use (2nd ed., pp. 139-155). London: Blackie Academic & Professional.
Claesson, P., Dedinaite, A., Bergenstahl, B., Campbell, B., & Christenson, H. (1997). Interactions
between hydrophilic mica surfaces in triolein: Triolein Surface Orientation, Solvation Forces, and
Capillary Condensation. Langmuir , 13, 1682-1688.
Cleasson, P., Blomberg, E., & Poptoshev, E. (2004). Surface Forces and Emulsion Stability. In S.
Friberg, K. Larsson, & J. Sjoblom (Eds.), Food Emulsions (4th ed.). New York: Marcel Dekker,
Inc.
Coupland, J., & McClements, D. (2001). Droplet size determination in food emulsions:
Comparison of ultrasonic and light scattering methods. J. Food Eng. , 50, 117-120.
Coupland, J., & McClements, D. (2001). Ultrasonic Characterization of Food Emulsions. In J.
Sjoblom (Ed.), Encyclopedic Handbook of Emulsion Technology. New York: Marcel Dekker, Inc.
Coupland, J. (2010). Introduction to the Physical Chemistry of Foods. Unpublished manuscript.
117
D'Antonio, M. (2006). Hershey: Milton S Hershey's extraordinary life and wealth, empire, and
utopian dreams. New York: Simon & Schuster.
Davila, V., & Finkel, G. (2005). Patent No. 6,841,186 B2. United States of America.
de los Reyes, J., & Charcosset, C. (2010). Preparation of water-in-oil and ethanol-in-oil
emulsions by membrane emulsification. Fuel , 89, 3482-3488.
De Luca, G., Di Maio, F., Di Renzo, A., & Drioli, E. (2008). Droplet detachment in cross-flow
membrane emulsification: Comparison among torque- and force-based models. Chem. Eng.
Process. , 47, 1150-1158.
De Luca, G., Sindona, A., & Giorno, L. D. (2004). Quantitative analysis of coupling effects in
cross-flow membrane emulsification. J. Membr. Sci. , 229, 199-209.
Dedinaite, A., & Campbell, B. (2000). Interactions Between Mica Surfaces across Triglyceride
Solution Containing Phospholipid and Polyglycerol Polyrincinoleate. Langmuir , 16, 2258-2253.
Dickinson, E. (1992). An Introduction to Food Colloids. Oxford: Oxford University Press.
Dickinson, E., & Woskett, C. (1989). Competitive adsorption between proteins and small-
molecule surfactants in food emulsions. In R. Bee, P. Richmond, & J. Mingins (Eds.), Food
Colloids. London: Royal Society of Chemistry.
Dicolla, C. (2009). Charactierization of Heat Resistant Milk Chocolate. Masters Thesis, The
Pennsylvania State University, Food Science Department, State College, PA.
Do, T.-A. L., Hargreaves, J., Wolf, B., Hort, J., & Mitchell, J. (2007). Impact of Particle Size
Distribution on Rheological and Textural Properties of Chocolate Models with Reduced Fat
Content. J. Food Sci. , 72, E541-E552.
Docoslis, A., Giese, R., & van Oss, C. (2000). Influence of the water-air interface on the apparent
surface tension of aqueous solutions of hydrophilic solutes. Colloid Surface B , 19, 147-162.
Egidi, E., Gasparini, G., Holdich, R., Vladisavljevic, G., & Kosvintsev, S. (2008). Membrane
emulsification using membranes of regular pore spacing: Droplet size and uniformity in the
presence of surface shear. J. Membr. Sci. , 323, 414-420.
Faergemend, M., & Krog, N. (2003). Using emulsifiers to improve food texture. In B. McKenna
(Ed.), Texture in Food Volume 1: Semi-solid foods. Cambridge: Woodhead Publishing, Ltd.
Fourel, I., Guillement, J., & Le Botlan, D. (1994). J. Colloid Interf. Sci. , 164, 48.
Fourel, I., Guillement, J., & Le Botlan, D. (1995). Determination of Water Droplet Size
Distributions by Low Resolution PFG-NMR: II. "Solid" Emulsions. J. Colloid Interf. Sci. , 169,
119-124.
Fowler, M. (1999). Cocoa beans: from tree to factory. In S. Beckett (Ed.), Industrial Chocolate
Manufacture and Use (3rd ed., pp. 8-35). Oxford: Blackwell Science.

118
Gabriele, D., Migliori, M., Di Sanzo, R., Rossi, C., Ruffolo, S., & de Cindio, B. (2009).
Characterisation of dairy emulsions by NMR and rheological techniques. Food Hydrocolloid , 23,
619-628.
Garti, N., & Benichou, A. (2004). Rapid developments in double emulsions for food applications.
In S. Friberg, L. K., & J. Sjoblom (Eds.), Food Emulsions. New York: Marcel Dekker, Inc.
Giddey, C., & Dove, G. (1984). Patent No. 4,446,166. United States of America.
Giddey, C., & Dove, G. (1991). Patent No. 5,004,623. United States of America.
Gijsbertsen-Abrahamse, A., van der Padt, A., & Boom, R. (2004). Status of cross-flow membrane
emulsification and outlook for industrial application. J. Membr. Sci. , 230, 149-159.
Gillespie, T. (1960). An extension of Goodeve's impulse theory of viscosity to pseudoplastic
systems. J. Colloid Sci. , 15, 219-231.
Gutierrez, G., Rayner, M., & Dejmek, P. (2009). Production of vegetable oil in milk emulsions
using membrane emulsification. Desalination , 245, 631-638.
Hancock, B. r. (1994). Cocoa bean production and transport. In S. Beckett (Ed.), Industrial
Chocolate Manufacture and Use (2nd ed., pp. 43-54). London: Blackie Academic & Professional.
Haslund, H. (2010). Chocolate Tempering. 64th PMCA Production Conference (pp. 58-66).
Bethlehem, PA: PMCA.
Hemar, Y., Cheng, L., Oliver, C., Sanguansri, L., & Augustin, M. (2010). Encapsulation of
resveratrol Using Water-in-Oil-in-Water Double Emulsions. Food Biophys. , 5, 120-127.
Hershey Community Archives. (2011) Ration D Bars. Retrieved from
http://www.hersheyarchives.org/essay/printable.aspx?EssayId=26.
Hiemenz, P. (1986). Principles of Colloid and Surface Chemistry. New York: Marcel Dekker,
Inc.
Hiemenz, P., & Rajagopalan, R. (1997). Principles of Colloids and Surface Chemistry. New
York: Marcel Dekker, Inc.
Hodge, S., & Rousseau, D. (2002). Fat Bloom Formation and Characterization in Milk Chocolate
Observed by Atomic Force Microscopy. J. Am. Oil Chem. Soc. , 79, 1115-1121.
Hornak, J. (1997). The Basics of NMR. Retrieved from www.cis.rit.edu/htbooks/nmr/inside.htm
Hunter, R. (2001). Foundations of Colloid Science (2nd ed.). Oxford: Oxford University Press.
Israelachnili, J. (1992). Intermolecular and Surface Forces (2nd ed.). London: Academic Press.
Jackson, K. (1994). Recipes. In S. Beckett (Ed.), Industrial Chocolate Manufacture and Use (2nd
ed., pp. 258-280). London: Blackie Academic & Professional.

119
Jeffery, M., Glynn, P., & Khan, M. (1977). Patent No. 4,045,583. United States of America.
Jeyarani, T., & Reddy, S. (1999). Heat-Resistant Cocoa Butter Extenders from Mahua (Madhuca
latifolia) and Kokum (Garcinia indica) Fats. J. Am. Oil Chem. Soc. , 76, 1431-1436.
Johansson, D., & Bergenstahl, B. (1992a). The Influence of Food Emulsifiers on Fat and Sugar
Dispersions I. Adsorption, Sedimentation. J. Am. Oil Chem. Soc. , 69, 705-717.
Johansson, D., & Bergenstahl, B. (1992b). The Influence of Food Emulsifiers on Fat and Sugar
Dispersions in Oils II. Rheology, Colloidal Forces. J. Am. Oil Chem. Soc. , 69, 718-727.
Johansson, D., & Bergenstahl, B. (1992c). The Influence of Food Emulsifiers on Fat and Sugar
Dispersions in Oils III. Water Content, Purity of Oils. J. Am. Oil Chem. Soc. , 69, 728-733.
Joscelyne, S., & Tragardh, G. (1999). Food Emulsions using membrane emulsifcation: conditions
for producing small droplets. J. Food Eng. , 39, 59-64.
Kandori, K., Kishi, K., & Ishikawa, T. (1991b). Formation mechanisms of monodispersed W/O
emulsions by SPG filter emulsification method. Colloid Surface , 61, 269-279.
Kandori, K., Kishi, K., & Ishikawa, T. (1991a). Preparation of monodispersed W/O emulsions by
Shirasu-porous-glass filter emulsification technique. Colloid Surface , 55, 73-78.
Katoh, R., Asano, Y., Furuya, A., Sotoyama, K., & Tomita, M. (1996). Preparation of food
emulsions using a membrane emulsification system. J. Membr. Sci. , 113, 131-135.
Katoh, R., Asano, Y., Furuya, A., Sotoyama, K., Tomita, M., & Okonogi, S. (1997). Methods for
preparation of W/O food emulsions using the membrane immersed with oils and fats. J. Jpn. Soc.
Food Sci. Technol. , 44, 238-242.
Kealey, K., & Quan, N. (1992). Patent No. 5,149,560. United States of America.
Kempf, N., & Downey, P. (1956). Patent No. 2,760.867. United States of America.
Kennedy, E. (2004). Emulsions. In A. Winfield, & R. Richards (Eds.), Pharmaceutical Practice
(3 ed., pp. 198-205). Philadelphia: Churchill Livingstone.
Kincs, F. (1992). Patent No. 5,108,769. United States of America.
Knoth, A., Scherze, I., & Muschiolik, G. (2005a). Effect of lipid type on water-in-oil-emulsions
stabilized by phosphatidylcholine-depleted lecithin and polyglycerol polyricinoleate. Eur. J. Lipid
Sci. Technol. , 107, 857-863.
Knoth, A., Scherze, I., & Muschiolik, G. (2005b). Stability of water-in-oil-emulsions containing
phosphatidylcholine-depleated lecithin. Food Hydrocolloid , 19, 635-640.

120
Kobayashi, I., Lou, X., Mukataka, S., & Nakajima, M. (2005). Preparation of Monodisperse
Water-in-Oil-in-Water Emulsions Using Microfluidization and Straight-Through Microchannel
Emulsification. J. Am. Oil Chem. Soc. , 82, 65-71.
Kobayashi, I., Nakajima, M., Chun, K., Kikuchi, Y., Fujita, H. (2002). Silicon array of elongated
through-holes for monodisperse emulsion droplets. Am. Inst. Chem Eng., 48, 1639-1644.
Koos, E., & Willenbacher, N. (2011). Capillary Forces in Suspension Rheology. Science , 331,
897-900.
Kruger, C. (1994). Sugar. In S. Beckett (Ed.), Industrial Chocolate Manufacture and Use (2nd
ed., pp. 25-42). London: Blackie Academic & Professional.
Lenovich, L. (1986). Survival and death of microorganisms as influence by water activity. Food
Technol. , 40, 56.
Lepercq-Bost, E., Giorgi, M.-L., Isambert, A., & Arnaud, C. (2010). Estimating the risk of
coalescence in membrane emulsification. J. Membr. Sci. , 357, 36-46.
Ley, D. (1994). Conching. In S. Beckett (Ed.), Industrial Chocolate Manufacture and Use (2nd
ed., pp. 117-138). London: Blackie Academic & Professional.
Mandralis, Z., & Weitzenecker, D. (1996). Patent No. 5,523,110. United States of America.
McClements, D. (2005). Food Emulsions: Principles, Practices, and Techniques (2nd ed.). Boca
Raton, FL: CRC Press.
McClements, D. J. (1999). Food Emulsions: Principles, Practice and Techniques. Boca Raton,
FL: CRC Press, LLC.
McClements, D. (1998). Particle sizing of food emulsions using ultrasonic spectroscopy:
principles, techniques and applications. In M. Povey, & T. Mason (Eds.), Ultrasound in food
processing (pp. 85-104). London: Blackie Academic & Professional, Thomson Science.
McClements, D. (1996). Principles of Ultrasonic Droplet Size Determination in Emulsions.
Langmuir , 12, 3454-3461.
McClements, D., & Coupland, J. (1996). Theory of droplet size distribution measurements in
emulsions using ultrasonic spectroscopy. Colloid Surface A , 117, 161-170.
Moreyra, R., & Peleg, M. (1981). Effect of Equilibrium Water Activity on the Bulk Properties of
Selected Food Powders. J. Food Sci. , 46, 1918-1922.
Mun, S., Choi, Y., Rho, S., Kang, C., Park, C., & Kim, Y. (2010). Preparation and
Characterization of Water/Oil/Water Emulsions Stabilized by Polyglycerol Polyricinoleate and
Whey Protein Isolate. J. Food Sci. E: Food Eng. and Physical Properties , 75, 116-125.
Muntener, K. (2010). Conching: Back to the Basics. 64th PMCA Production Conference (pp. 39-
57). Bethlehem, PA: PMCA.

121
Murday, J., & Cotts, R. (1968). Self-Diffusion Coefficient of Liquid Lithium. J. Chem. Phys. , 48,
4938-4945.
Muthukumarappan, K., Wang, Y.-C., & Gunasekaran, S. (1999). Short Communication: Modified
Schreiber Test for Evaluation of Mozzarella Cheese Meltability. J. Dairy Sci. , 82, 1068-1071.
Norton, J., Fryer, P., Parkinson, J., & Cox, P. (2009). Development and characterization of
tempered cocoa butter emulsions containing up to 60% water. J. Food Eng. , 95, 172-178.
Ogunwolu, S., & Jayeola, C. (2006). Development of non-conventional thermo-resistant
chocolate for the tropics. Brit. Food J. , 108, 451-455.
O'Rourke, J. (1959). Patent No. 2,904,438. United States of America.
Packer, K., & Rees, C. (1972). Pulsed NMR Studies of Restricted Diffusion I. Droplet Size
Distributions in Emulsions. J. Colloid Interf. Sci. , 40, 206-218.
Pajin, B., & Jovanovic, O. (2005). Influence of high-melting milk fat fraction on quality and fat
bloom stability of chocolate. Eur. Food Res. Technol. , 220, 389-394.
Pal, R. (1996). Rheology of Emulsions Containing Polymeric Liquids. In P. Becher (Ed.),
Encyclopedia of Emulsion Technology (Vol. 4, pp. 92-264). New York: Marcel Dekker, Inc.
Palsgaard. (2008). GRAS Notification for Polyglycerol Polyricinoleate (PGPR) in Vegetable Fat
Coatings. Retrieved from http://www.accessdata.fda.gov/scripts/fcn/gras_notices/grn000266.pdf
Peng, S., & Williams, R. (1998). Controlled Production of Emulsions Using a Crossflow
Membrane. Part. Part. Syst. Charact. , 15, 21-25.
Rayner, M., Tragardh, G., Tragardh, C., & Dejmek, P. (2004). Using the Surface Evolver to
model droplet formation processes in membrane emulsification. J. Colloid Interf. Sci. , 279, 175-
185.
Rector, D. (2000). Chocolate - controlling the flow: Benefits of polyglycerol polyricinoleic acid.
The Manufacturing Confectioner , 80, 63-70.
Reimerdes, E., & Mehrens, H.-A. (1994). Milk. In S. Beckett (Ed.), Industrial Chocolate
Manufacture and Use (2nd ed., pp. 43-54). London: Blackie Academic & Professional.
Rey, B., Rossi-Vauthley, P., Rousset, P., & Schafer, O. (2008). Patent No. US 2008/0241335.
United States of America.
Rousseau, D., & Hodge, S. (2005). Stabilization of water-in-oil emulsions with continuous phase
crystals. Colloid Surface A , 260, 229-237.
Rousseau, D., & Sonwai, S. (2008). Influence of the dispersed particulate in chocolate on cocoa
butter microstructure and fat crystal growth during storage. Food Biophys. , 3, 273-278.
122
Rousset, P., Sellappan, P., & Daoud, P. (2002). Effect of emulsifiers on surface properties of
sucrose by inverse gas chromatography. J. Chromatogr. A , 969, 97-101.
Samsudin, R., & Rahim, M. (1996). Use of Palm Mid-Fraction in White Chocolate Formulation.
J. Sci. Food Agric. , 71, 483-490.
Schantz, B., & Rohm, H. (2005). Influence of lecithin-PGPR blends on the rheological properies
of chocolate. Lebensm.-Wiss. u.-Technol. , 38, 41-45.
Schluo, R., & Lioutas, T. (1995). Patent No. 5,468,509. United States of America.
Schramm, L. L. (2005). Personal Care Product Applications in Emulsions, Foams and
Suspensions: Fundamentals and Applications. Weinheim, Germany: Wiley-VCH Verlag GmbH
& Co. KGaA.
Schroder, V., & Schubert, H. (1997). Emulsification using microporous ceramin membranes.
Proceedings of the first European congress on chemical engineering (ECCE 1), (pp. 2491-2494).
Florence.
Schroder, V., Behrend, O., & Schubert, H. (1998). Effect of Dynamic Interfacial Tension on the
Emulsification Process Using Microporous, Ceramic Membranes. J. Colloid Interf. Sci. , 202,
334-340.
Schubiger, G.-F., & Rostagno, W. (1965). Patent No. 3,218,174. United States of America.
Scoville, E., & Peleg, M. (1981). Evaluation of the Effects of Liquid Bridges on the Bulk
Properties of Model Powders. J. Food Sci. , 46, 174-177.
Simburger, S. (2009). Patent No. 7,579,031 B2. United States of America.
Sonwai, S., & Rousseau, D. (2010). Controlling fat bloom formation in chocolate-Impact of milk
fat on microstructure and fat phase crystallization. Food Chem. , 119, 286-297.
Sotoyama, K., Asano, Y., Ihara, K., & Takahashi, K. D. (1999). Water/Oil Emulsions Prepared
by the Membrane Emulsification Method and Their Stability. J. Food Sci. , 64, 211-215.
Stauffer, C. (2002). Emulsifiers and Stabilizers. In K. Rajah (Ed.), Fats in Food Technology (pp.
228-274). Sheffield: Sheffield Academic Press, Ltd.
Stejskal, E., & Tanner, J. (1965). Spin Diffusion Maasurements: Spin Echos in the Presence of a
Time-Dependent Field Gradients. J.Chem. Phys. , 42, 288-292.
Stillwell, M., Holdich, R., Kosvintsev, S., Gasparini, G., & Cumming, I. (2007). Stirred Cell
Membrane Emulsification and Factors Influencing Dispersion Drop Size and Uniformity. Ind.
Eng. Chem. Res. , 46, 965-972.
Tadros, T. (2009). Emulsion Science and Technology : A General Introduction. In T. Tadros
(Ed.), Emulsion Science and Technology (pp. 1-56). Weinheim, Germany: Wiley-VCH Verlag
GmbH & Co.

123
Takemori, T., Tsurumi, T., & Takagi, M. (1992). Patent No. 5,160,760. United States of America.
Talbot, G. (1994). Chocolate temper. In S. Becket (Ed.), Industrial Chocolate Manufacture and
Use (2nd ed., pp. 156-166). London: Blackie Academic & Professional.
Talbot, G. (1994). Vegetable Fats. In S. Beckett (Ed.), Industrial Chocolate Manufacture and Use
(2nd ed., pp. 242-256). London: Blackie Academic & Professional.
Tanner, J., & Stejskal, E. (1968). Restricted Self-Diffusion of Protons in Colloidal Systems by the
Pulsed-Gradient, Spin-Echo Method. J. Chem. Phys. , 49, 1768-1777.
Tiller, F., & Khatib, Z. (1984). The Theory of Sediment Volumes of Compressible, Particulate
Structures. J. Coll. Interface Sci. , 100, 55-67.
Timms, R. (1984). Phase-behavior of Fats and Their Mixtures. Prog. Lipid Res. , 23, 1-38.
Traitler, H., Windhab, E., & Wolf, B. (2000). Patent No. 6,165,540. United States of America.
Van Dalen, G. (2002). Determination of the water droplet size distribution of fat spreads using
confocal scanning laser microscopy. J. Microsc.-Oxford , 208, 116-133.
van den Tempel, M. (1961). Mechanical properties of plastic-disperse systems at very small
deformations. J. Colloid Sci. , 16, 284-296.
Van lent, K., Vanlerberghe, B., Van Oostveldt, P., Thas, O., & Van der Meeren, P. (2008).
Determination of water droplet size distribution in butter: Pulsed field gradient NMR in
comparison with confocal scanning laser microscopy. Int. Dairy J. , 18, 12-22.
Van Nieuwenhuyzen, W., & Szuhaj, B. (1998). Effects of lecithins and proteins on the stability of
emulsions. Fett-Lipid , 100, 282-291.
Vastenavond, C. (2008). Patent No. EP 1 894 474 A1. European.
Vladisavljevic, G., & Williams, R. (2006). Manufacture of large uniform droplets using rotating
membrane emulsification. J. Colloid Interf. Sci. , 299, 396-402.
Vladisavljevic, G., Shimidzu, M., & Nakashima, T. (2004). Preparation of monodisperse multiple
emulsions at high production rates by multi-stage premix membrane emulsification. J. Membr.
Sci. , 244, 97-106.
Voda, M., & van Duynhoven, J. (2009). Characterization of food emulsions by PFG NMR.
Trends Food Sci. Tech. , 20, 533-543.
Vodovotz, Y., Vittadini, E., Coupland, J., McClements, D., & Chinachoti, P. (1996). Bridging the
gap: Use of confocal microscopy in food research. Food Technol.-Chicago , 50, 74-82.
Walstra, P. (1996). Dispersed Systems: Basic Considerations. In O. Fennema (Ed.), Food
Chemistry (3rd ed., p. 95). New York: Marcel Dekker, Inc.

124
Walstra, P. (1993). Introduction to aggregation phenomenon in food colloids. In E. Dickinson, &
P. Walstra (Eds.), Food Colloids and Polymers: Stability and Mechanical Properties (3 ed.).
Cambridge: Royal Society of Chemistry.
Weete, J., Betageri, S., & Griffith, G. (1994). Improvement of lecithin as an emulsifier for water-
in-oil emulsions by thermalization. J. Am. Oil Chem. Soc. , 71, 731-737.
Wildemuth, C., & Williams, M. (1985). A new interpretation of viscosity and yield stress in
dense slurries: coal and other irregular particles. Rheol. Acta. , 24, 75-91.
Williams, R., Peng, S., Wheeler, D., Morley, N., Tayloer, D., Whalley, M., et al. (1998).
Controlled production of emulsions using a crossflow membrane. Part II: Industrial scale
manufacture. Chem. Eng. Red. Des. , 76, 902-910.
Yuan, Q., Williams, R., & Biggs, S. (2009). Surfactant selection for accurate size control of
microcapsules using membrane emulsification. Colloid Surface A , 347, 97-103.
Zhu, J., & Barrow, D. (2005). Analysis of droplet size during crossflow membrane emulsification
using stationary and vibrating micromachine silicon nitride membrane. J. Membr. Sci. , 261, 136-
144.
Ziegler, G., Garbolino, C., & Coupland, J. (2003). The Influence of Surfactants and Moisture on
the Colloidal and Rheological Properties of Model Chocolate Dispersions. ISFRS Conference
Proceedings, (pp. 335-339).

125
APPENDIX A
The rheology of 30% sugar-in-oil dispersions was investigated with a Haake Fisons
RV20 Rotovisco Rheometer (Karlsruhe, Germany). Bakers Special fine granulated sugar (3.5g;
Domino Specialty Ingredients; West Palm Beach, FL) was added to soybean oil (8.169g) in a
standard rheometer cup and stirred. A cylindrical bob with a spiral groove was used. Initial shear
stress was measured at an instrumental setting of 9D. Measurements were taken every 15
seconds for 2 minutes. The cup was then removed and 1 mL of liquid was added (oil,
unemulsified oil and water or water-in-oil emulsion). The cup was reattached and measurements
were recorded as before. The amount of water used was 1% with respect to the sugar (w/w). The
emulsion was a 3.85% water-in-soybean oil emulsion stabilized with 3% PGPR in the continuous
phase. Shear stress was standardized against the initial value of the sugar in oil dispersion.
The shear stress with added water (unemulsified or as an emulsion) was shown to be less
than when no water was added (Figure A.1). This contradicts what was expected as I
hypothesized that the addition of water would lead to the formation of aggregates and increase the
viscosity (or shear stress). When water was added to the system in any form, large aggregates
formed and were forced over the top of the cup. This meant that they were no longer influencing
the shear stress which likely resulted in the decrease seen in the data. Additionally, because of
the issue with the methodology, the data was not reproducible. Replication of the experiment
with added emulsion (Trials A-C) resulted in different trends in standardized shear stress (Figure
A.2). Different methodologies were attempted but it was concluded that there was no way to
accurately measure what was occurring within the system upon addition of water.

126
Figure A.1. Standardized shear stress vs time for stopped cup addition of oil (diamond),
oil and unemulsified water (square) and emulsion (triangle).
Figure A.2. Standardized shear stress vs time for stopped cup emulsion addition; Trial A
(diamond); Trial B (square); Trial C (triangle).